good organic growth - media.kemira.com · eps, eur 0.14 0.12 +17 0.52 april 27, 2018 q1 2018...
TRANSCRIPT

JANUARY-MARCH 2018
Good organicgrowth
JARI ROSENDAL, PRESIDENT AND CEO PETRI CASTRÉN, CFOAPRIL 27, 2018
Key financial highlights
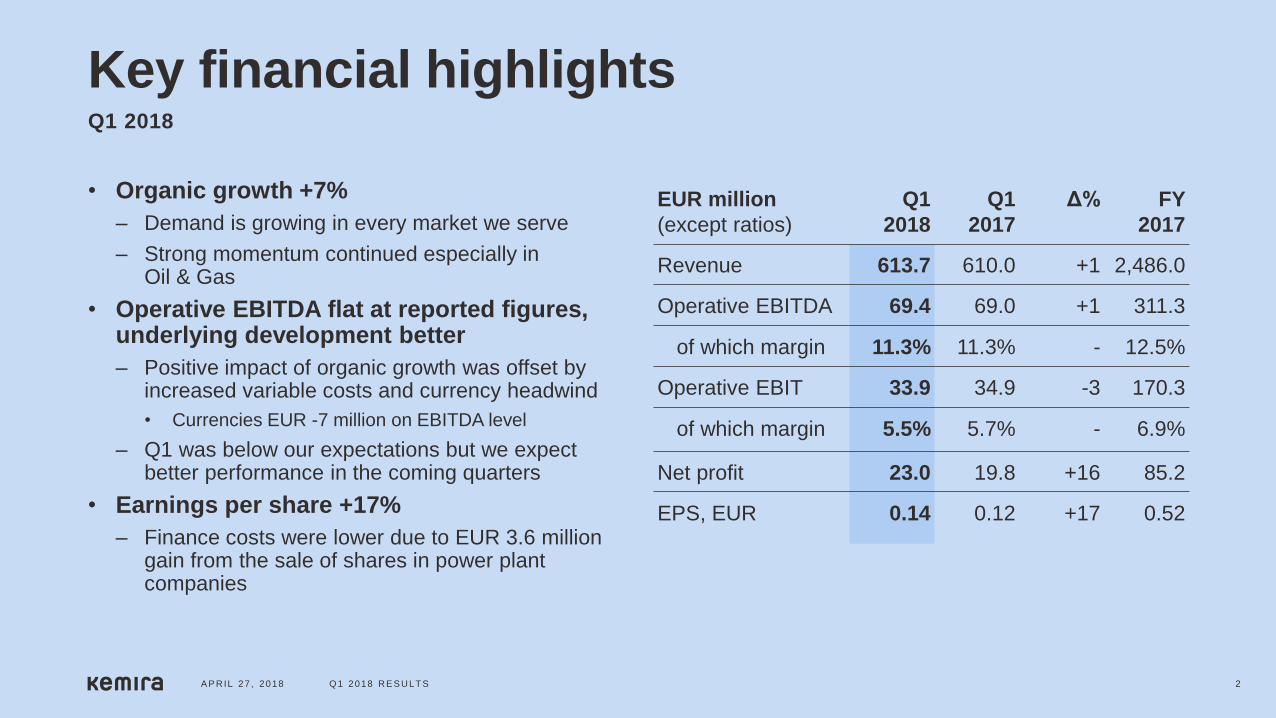
• Organic growth +7%
– Demand is growing in every market we serve
– Strong momentum continued especially inOil & Gas
• Operative EBITDA flat at reported figures, underlying development better
– Positive impact of organic growth was offset by increased variable costs and currency headwind
• Currencies EUR -7 million on EBITDA level
– Q1 was below our expectations but we expectbetter performance in the coming quarters
• Earnings per share +17%
– Finance costs were lower due to EUR 3.6 million gain from the sale of shares in power plant companies
EUR million
(except ratios)
Q1
2018
Q1
2017
Δ% FY
2017
Revenue 613.7 610.0 +1 2,486.0
Operative EBITDA 69.4 69.0 +1 311.3
of which margin 11.3% 11.3% - 12.5%
Operative EBIT 33.9 34.9 -3 170.3
of which margin 5.5% 5.7% - 6.9%
Net profit 23.0 19.8 +16 85.2
EPS, EUR 0.14 0.12 +17 0.52
A P RIL 27 , 2018 Q1 2018 RE S ULT S 2
Q1 2018

In big picture, operative EBITDA on positive trend
Profitability improvement measures overshadowed by pressure from raw material prices
During the last year market has moved from deflatory to inflatory environment
A P RIL 27 , 2018 Q1 2018 RE S ULT S 3
ROLLING 12-MONTH OPERATIVE EBITDA AND OPERATIVE EBITDA-%
262
276
285 287
294298
301 303299 297
301
311 312
12.1%12.4% 12.3%
12.1% 12.2%12.4%
12.7% 12.8%12.5%
12.3% 12.3%12.5%
10%
11%
12%
13%
14%
15%
16%
200
220
240
260
280
300
320
Q1 Q2 Q3 Q4 Q1 Q2 Q3 Q4 Q1 Q2 Q3 Q4 Q1
2015 2016 2017 2018
Positive long-term operative EBITDA trend
12.5%

Pulp & Paper – good underlying market with major regional differencesMarket environment and performance
• EMEA strong and South America solid
• North America battles with shrinking market in process and functional chemicals
• In APAC growth continues but profitability a challenge
Q1 organic growth +5%
• FX offsetting reported revenue growth
Profitability drivers
• Profitability improvement to continue when price increases go through - current sales prices were not yet sufficient to cover increase in raw material prices
• In addition to sales prices, new capacity at Joutseno and Chinese acquisition are expected to improve profitability in mid-term
183
191
196 195193
192189
198
194
12.5%12.9%
13.4% 13.4%13.2% 13.0%
12.8%
13.4%
Q1 Q2 Q3 Q4 Q1 Q2 Q3 Q4 Q1
2016 2017 2018
A P RIL 27 , 2018 Q1 2018 RE S ULT S 4
13.2%
ROLLING 12-MONTH OPERATIVE EBITDA AND EBITDA-% EUR million

Megatrend e-commerce drives need for packaging materialMegatrend
• Retail e-commerce grew +25% globally in 2017led by Amazon, eBay, Alibaba, etc.
• Growth in e-commerce drives packaging material production volumes
Impact on pulp and paper producers
New board capacity regularly announced, especially in APAC and EMEA, e.g.
• Chinese Nine Dragon to add 3 million tons of packaging paper capacity by June 2019
• APP to expand Guangxi (CN) mill by 2 new board machines with production of 1.8 Mton/a
• Hamburger Rieger (DE) to invest in new 500 kt/a containerboard machine
Impact on Kemira
• Kemira serves board producers with process and functional chemicals
• Kemira has strong references in conversions and new start-ups
• Also beneficial for Kemira’s pulp bleaching business as pulp is the intermediate product for board
A P RIL 27 , 2018 Q1 2018 RE S ULT S 5
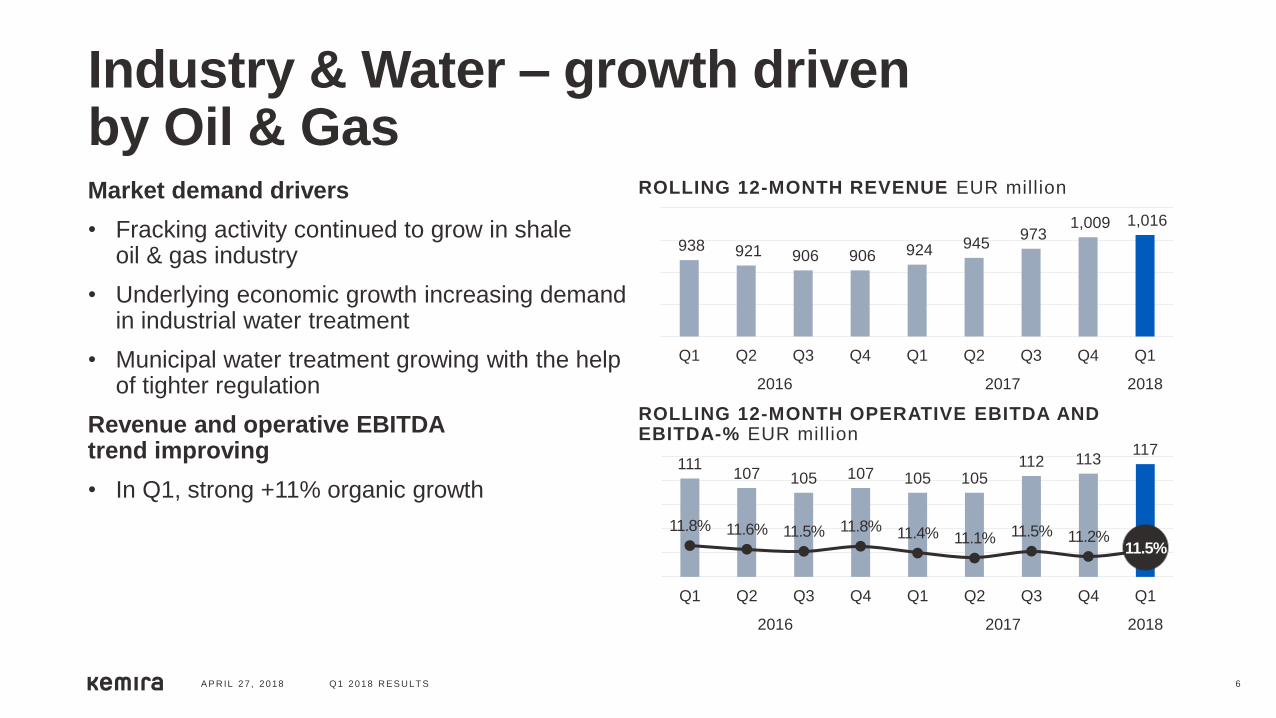
Industry & Water – growth drivenby Oil & GasMarket demand drivers
• Fracking activity continued to grow in shale oil & gas industry
• Underlying economic growth increasing demand in industrial water treatment
• Municipal water treatment growing with the help of tighter regulation
Revenue and operative EBITDAtrend improving
• In Q1, strong +11% organic growth
938 921 906 906 924 945 973
1,009 1,016
Q1 Q2 Q3 Q4 Q1 Q2 Q3 Q4 Q1
2016 2017 2018
111107 105 107 105 105
112 113117
11.8% 11.6% 11.5% 11.8% 11.4% 11.1% 11.5% 11.2%
Q1 Q2 Q3 Q4 Q1 Q2 Q3 Q4 Q1
2016 2017 2018
A P RIL 27 , 2018 Q1 2018 RE S ULT S 6
ROLLING 12-MONTH REVENUE EUR million
ROLLING 12-MONTH OPERATIVE EBITDA AND EBITDA-% EUR million
11.5%

CEOR deal signed with Chevron
• Strategically important multi-year Chemical Enhanced Oil Recovery deal signed with Chevron
• EUR 30 million capacity addition, announced in October 2017, progressing well
• CEOR market size approximately EUR 1 billion of which EUR 500 million accessible to Kemira
• Market growth estimated to be 5% driven by enhanced production from existing fields
• Kemira is committed to provide enhanced solutions for challenging water intensive environments and technologies that can enable CEOR
• Our offering provides enhanced and improved oil recovery with focus around polymer injectivity, chemical stability, shear tolerance, thermal stability and efficacy
A P RIL 27 , 2018 Q1 2018 RE S ULT S 7

Progressing our strategy forprofitable growth
A P RIL 27 , 2018 Q1 2018 RE S ULT S 8
GROUP’S MID- TO LONG-TERM TARGETS
Above-the-market growth
Operative EBITDA 14-16%
Gearing below 60%
Dividend policy: stable and competitive dividend
Balanced cash flow
and capex
Increase
efficiency
Grow by investing,
innovating and capturing
market opportunities

PETRI CASTRÉN, CFO APRIL 27, 2018
A P RIL 27 , 2018 Q1 2018 RE S ULT S 9
Financials Q1 2018

Group’s organic revenue growth continued
A P RIL 27 , 2018 Q1 2018 RE S ULT S 10
Q1 2018
Group’s organic growth +7%
• Pulp & Paper +5%
• Industry & Water +11%
Operative EBITDA margin 11.3%
• Flat compared to prior year
• Good revenue growth was offset by raw material prices and FX
• Fixed costs slightly below prior-year level
72.878.9 80.8
70.0 69.077.1
84.5 80.769.4
12.5%13.4% 13.6%
11.7% 11.3%12.5%
13.6%12.7%
Q1 Q2 Q3 Q4 Q1 Q2 Q3 Q4 Q1
2016 2017 2018
610 +4%-7% 0% 614
Q1 2017 Salesvolumes
Salesprices
Currencyimpact
Acquisitions Q1 2018
+4%
REVENUE AND ORGANIC REVENUE GROWTH
(Y-ON-Y) EUR million
OPERATIVE EBITDA AND OPERATIVE EBITDA
MARGIN EUR million
11.3%
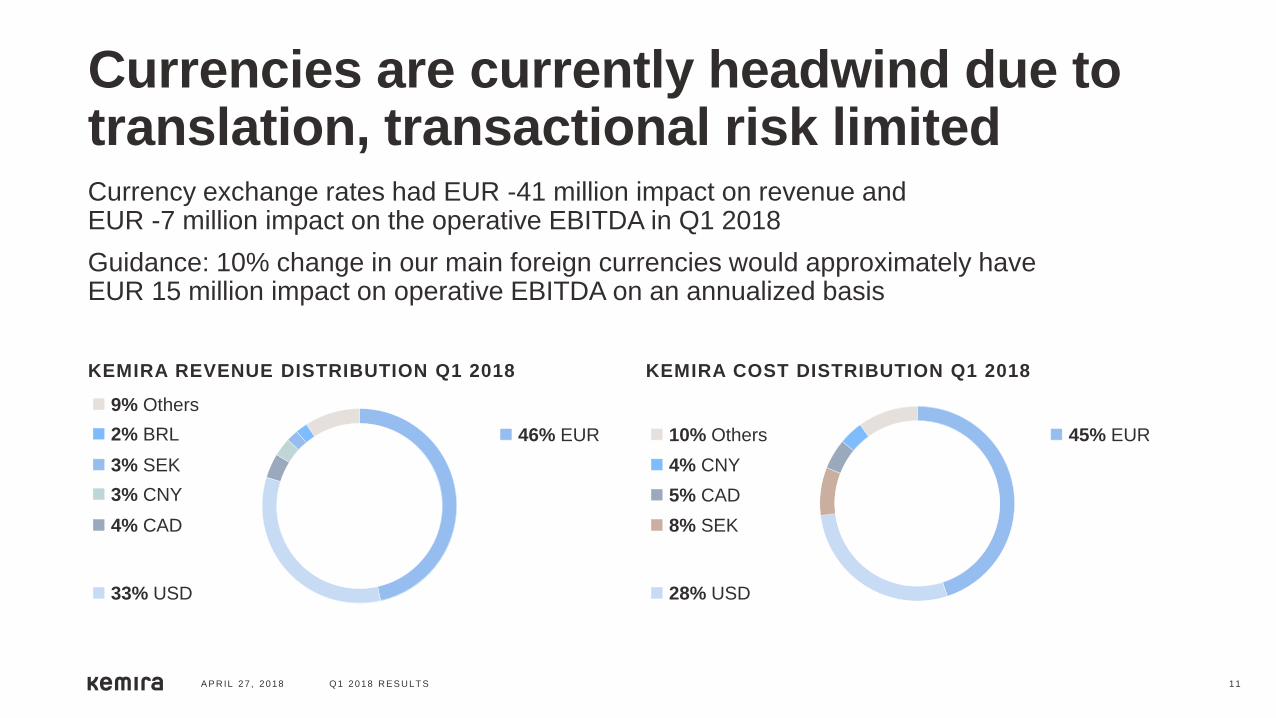
Currencies are currently headwind due to translation, transactional risk limitedCurrency exchange rates had EUR -41 million impact on revenue andEUR -7 million impact on the operative EBITDA in Q1 2018
Guidance: 10% change in our main foreign currencies would approximately haveEUR 15 million impact on operative EBITDA on an annualized basis
A P RIL 27 , 2018 Q1 2018 RE S ULT S 11
46% EUR
9% Others
KEMIRA REVENUE DISTRIBUTION Q1 2018 KEMIRA COST DISTRIBUTION Q1 2018
3% SEK
3% CNY
4% CAD
33% USD
10% Others
4% CNY
5% CAD
8% SEK
28% USD
45% EUR 2% BRL

SALES PRICE VS VARIABLE COST TREND
-200
-150
-100
-50
0
50
100
150
200
2008 2009 2010 2011 2012 2013 2014 2015 2016 2017 2018
Brent oil, USD Sales prices* Variable costs*
SALES PRICES AND VARIABLE COSTS(CHANGE Y-O-Y)
95
-3-10
-16-20
-10
-2 -2-9
-18
-26-23
-16
-4
3
11
23
-18-23
-23 -13
0
1613
13
26
-30
-20
-10
0
10
20
30
Q1 Q2 Q3 Q4 Q1 Q2 Q3 Q4 Q1
2016 2017 2018
Net impact on EBITDA (sales prices-variable costs)
Sales prices
Variable costs
A P RIL 27 , 2018 Q1 2018 RE S ULT S 12
Variable costs spiked in Q1,sales prices following
* 12-month rolling change vs previous year in EUR million

Pulp & Paper – good organic growth but profitability disappointed• Organic growth continued with volume growth at +3%, driven by chlorate capacity addition in
Finland and good underlying demand, especially in Europe
• FX headwind had -6% impact on revenue
• Profitability hampered by FX and sharp variable cost increases
• EMEA performing well but North America and China were behind
362 361 365 369 372 369 363 373 369
Q1 Q2 Q3 Q4 Q1 Q2 Q3 Q4 Q1
2016 2017 2018
47.9 49.3 51.846.3 46.0 47.8 48.5
55.4
42.7
13.2%13.7% 14.2%
12.6% 12.4% 13.0% 13.4%14.9%
11.6%
Q1 Q2 Q3 Q4 Q1 Q2 Q3 Q4 Q1
2016 2017 2018
A P RIL 27 , 2018 Q1 2018 RE S ULT S 13
+3% +1% -4% -2% 0% +1% +2% +5%
REVENUE AND ORGANIC REVENUE GROWTH
(Y-ON-Y) EUR million
OPERATIVE EBITDA AND OPERATIVE EBITDA
MARGIN EUR million
+5%

Industry & Water – strong growth continued
• Strong organic growth, heavy FX headwind from USD
• Oil & Gas +21% to EUR 46 million in Q1 2018, organic growth in O&G over 30%
• Profitability improving in Oil & Gas driven by sales price increases and volume growth
• Newer growth areas, such as water treatment for oil sands and CEOR, continue to be margin-dilutive until fully scaled up and optimized
220 227 231 228 238 248 259 264245
Q1 Q2 Q3 Q4 Q1 Q2 Q3 Q4 Q1
2016 2017 2018
24.929.6 29.0
23.7 22.929.3
36.0
25.3 26.6
11.3%13.1% 12.5%
10.4%9.6%
11.8%
13.9%
9.6%10.9%
Q1 Q2 Q3 Q4 Q1 Q2 Q3 Q4 Q1
2016 2017 2018
A P RIL 27 , 2018 Q1 2018 RE S ULT S 14
-7% -5% 0% +9% +15%-5% +6% +20% +11%
REVENUE AND ORGANIC REVENUE GROWTH
(Y-ON-Y) EUR million
OPERATIVE EBITDA AND OPERATIVE EBITDA
MARGIN EUR million

Development of selected key figures
9.8%9.9%
9.7%
9.5%
9.7%
2015 2016 2017 Q1 2017 Q1 2018
642 634694 661 678
2015 2016 2017 Q1 2017 Q1 2018
A P RIL 27 , 2018 Q1 2018 RE S ULT S 15
ALL KEY FIGURES IN EUR MILLION EXCEPT RATIOS
248271
205
1234
2015 2016 2017 Q1 2017 Q1 2018
104 118 124
20 16
78 95 66
17 7
2015 2016 2017 Q1 2017 Q1 2018
CASH FLOW FROM OPERATIONS CAPITAL EXPENDITURE EXCL. ACQUISITIONS
NET DEBT AND LEVERAGE RATIORETURN ON CAPITAL EMPLOYED
2.22.12.2 2.22.2
Growth capex
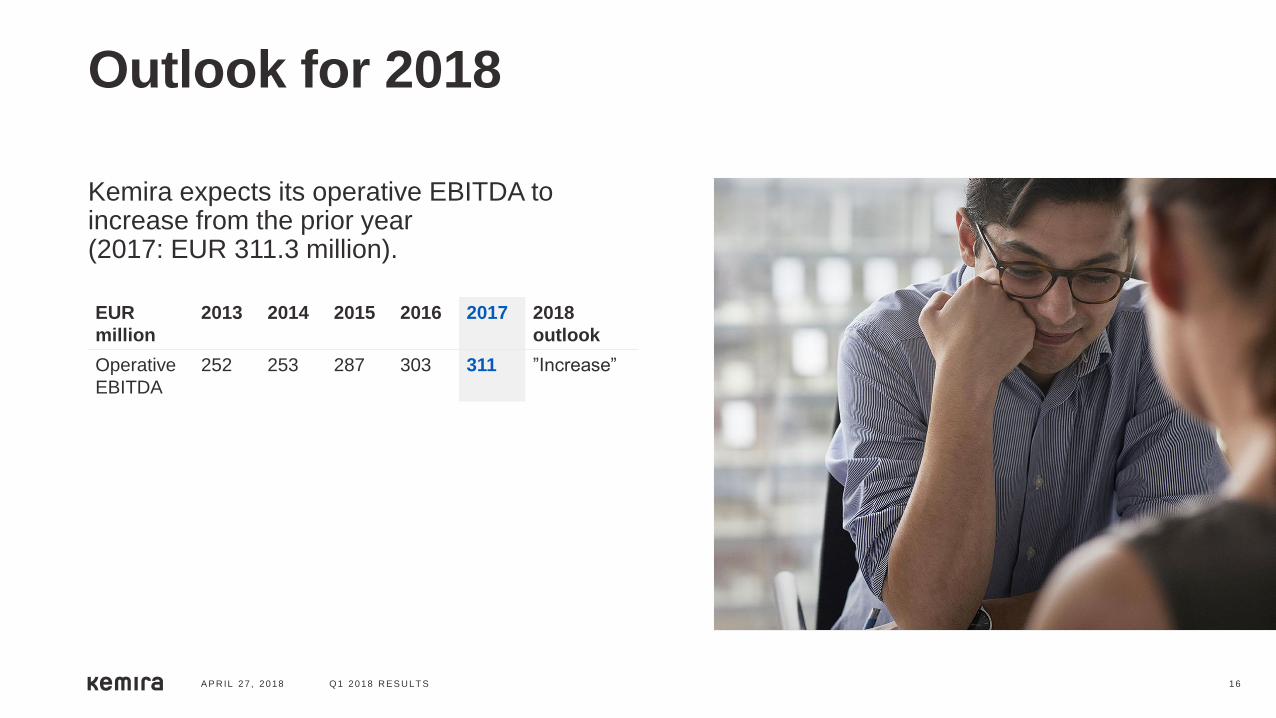
Outlook for 2018
Kemira expects its operative EBITDA to increase from the prior year(2017: EUR 311.3 million).
A P RIL 27 , 2018 Q1 2018 RE S ULT S 16
EUR
million
2013 2014 2015 2016 2017 2018
outlook
Operative
EBITDA
252 253 287 303 311 ”Increase”

JANUARY-MARCH 2018
A P RIL 27 , 2018 Q1 2018 RE S ULT S 17
Appendix

Revenue and operative EBITDA split
A P RIL 27 , 2018 Q1 2018 RE S ULT S 18
REVENUE SPLIT
EUR 614 million EUR 2,486 million
OPERATIVE EBITDA
EUR 69 million EUR 311 million
Q1 2018 2017 Q1 2018 2017
Pulp & Paper
Industry & Water
60%
40% 40%
60%
38%
62% 64%
36%
Pulp & Paper
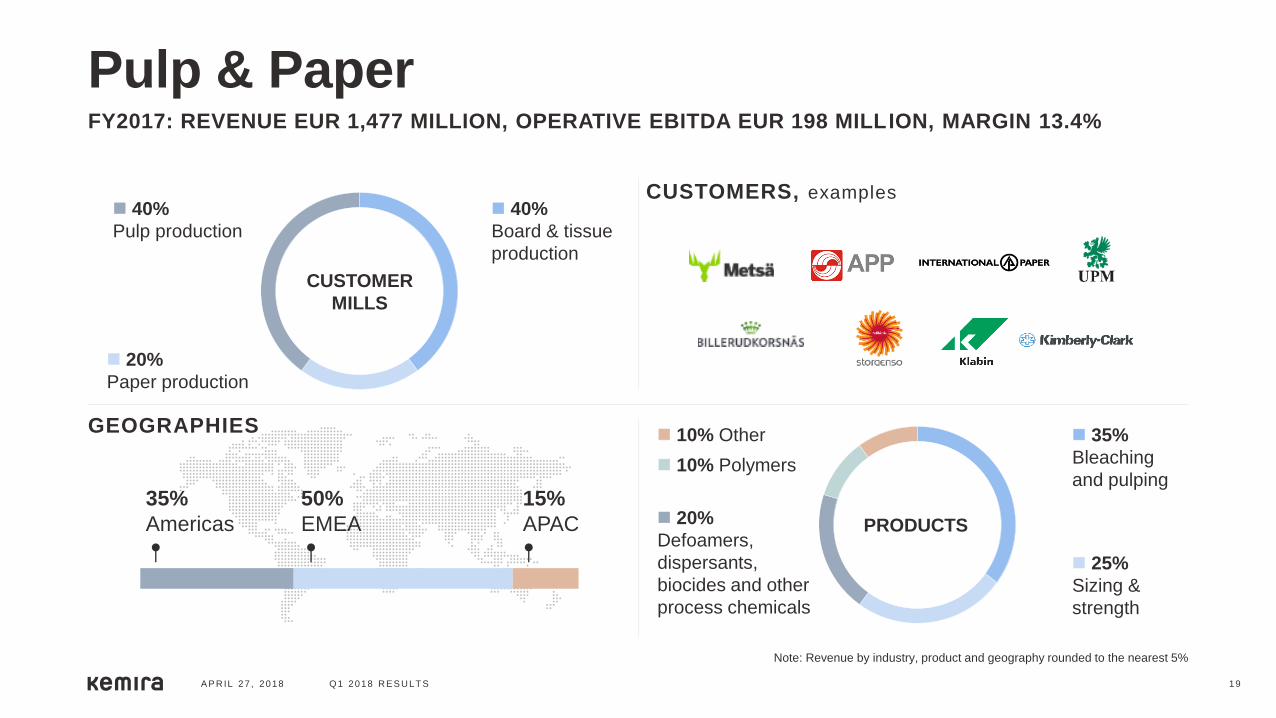
A P RIL 27 , 2018 Q1 2018 RE S ULT S 19
FY2017: REVENUE EUR 1,477 MILLION, OPERATIVE EBITDA EUR 198 MILLION, MARGIN 13.4%
CUSTOMERS, examples
GEOGRAPHIES
CUSTOMER
MILLS
40%
Board & tissue
production
40%
Pulp production
20%
Paper production
PRODUCTS
35%
Bleaching
and pulping
25%
Sizing &
strength
20%
Defoamers,
dispersants,
biocides and other
process chemicals
10% Polymers
10% Other
35%
Americas
50%
EMEA
15%
APAC
Note: Revenue by industry, product and geography rounded to the nearest 5%

Industry & Water
A P RIL 27 , 2018 Q1 2018 RE S ULT S 20
FY2017: REVENUE EUR 1,009 MILLION, OPERATIVE EBITDA EUR 114 MILLION, MARGIN 11.3%
MUNICIPAL (40%), Customer examples
GEOGRAPHIES
APPLICATION
SPLIT
70%
Water treatment
20%
Oil & Gas
10%
Other applications
PRODUCTS
40%
Coagulants
20%
Other products
such as defoamers
and biocides
40%
Polymers
INDUSTRIAL (60%), Customer examples
London New York City
Shanghai
Los Angeles
Montreal
Toronto
MiamiMelbourne
Amsterdam
Barcelona
Washington DC
Berlin
Paris
Stockholm
OsloLas Vegas
45%
Americas
50%
EMEA
5%
APAC
Note: Revenue by industry, product and geography rounded to the nearest 5%

EUR million Q1 2018 Q1 2017 Δ% 2017 2016 Δ%
Revenue 613.7 610.0 +1 2,486.0 2,363.3 +5
Operative EBITDA 69.4 69.0 +1 311.3 302.5 +3
margin 11.3% 11.3% - 12.5% 12.8% -
Operative EBIT 33.9 34.9 -3 170.3 170.1 0
margin 5.5% 5.7% - 6.9% 7.2% -
Net profit 28.8 26.1 +10 85.2 97.9 -13
Earnings per share, EUR 0.14 0.12 +17 0.52 0.60 -13
Cash flow from operations 34.5 12.2 +183 205.1 270.6 -24
Capex excl. acquisitions 23.2 36.9 -37 190.1 212.6 -11
Net debt 677.9 660.9 +3 694 634 +10
NWC ratio 9.5% 9.8% - 9.4% 10.2% -
Operative ROCE (rolling 12 months) 9.7% 9.5% - 9.7% 9.9% -
Personnel at period-end 4,740 4,771 -1 4,732 4,818 -2
Key figures
A P RIL 27 , 2018 Q1 2018 RE S ULT S 21

EUR million Q1 2018 Q1 2017 Δ% 2017 2016 Δ%
Revenue 368.7 372.2 -1 1,476.9 1,457.3 +1
Operative EBITDA 42.7 46.0 -7 197.7 195.3 +1
margin 11.6% 12.4% - 13.4% 13.4% -
Operative EBIT 18.9 23.8 -20 104.8 111.6 -6
margin 5.1% 6.4% - 7.1% 7.7% -
Operative ROCE*, % 8.6% 9.5% - 9.0% 10.0% -
Capital expenditure 13.4 29.8 -55 138.3 125.1 +11
Cash flow after investing activities 16.7 -22.9 - 15.7 105.7 -85
KEY FINANCIALS
Pulp & Paper
A P RIL 27 , 2018 Q1 2018 RE S ULT S 22
*12-month rolling average
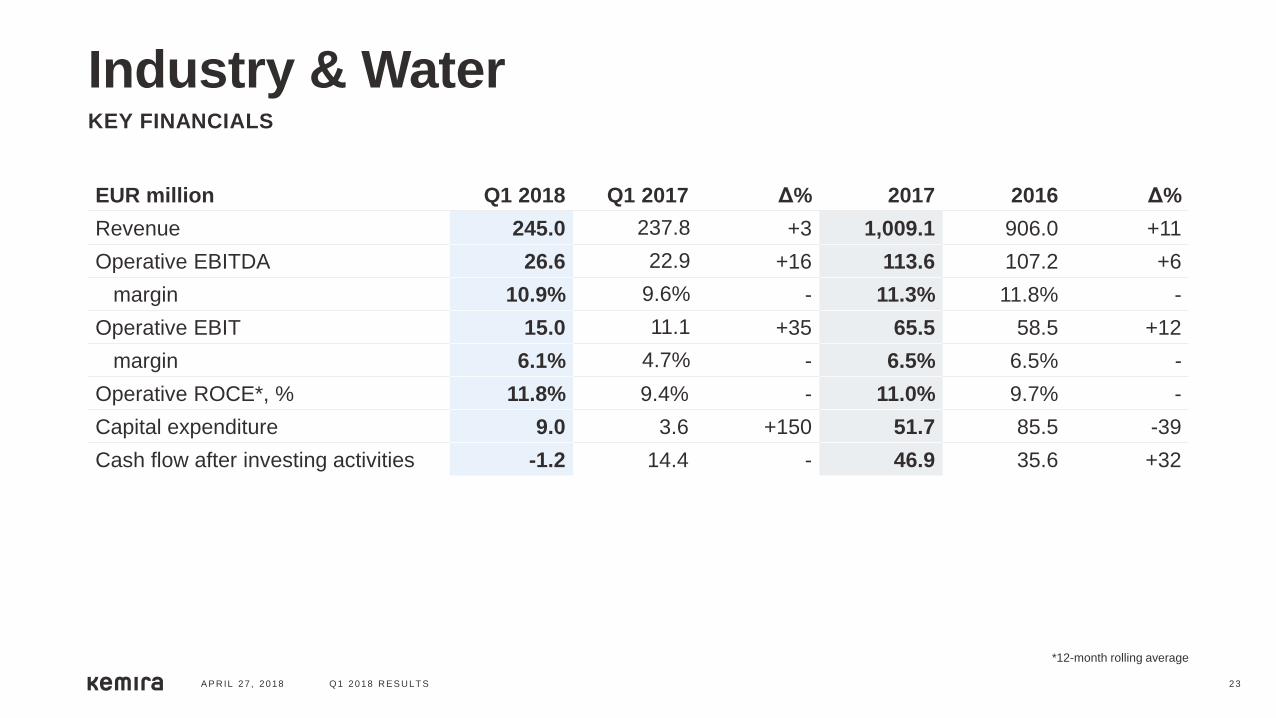
EUR million Q1 2018 Q1 2017 Δ% 2017 2016 Δ%
Revenue 245.0 237.8 +3 1,009.1 906.0 +11
Operative EBITDA 26.6 22.9 +16 113.6 107.2 +6
margin 10.9% 9.6% - 11.3% 11.8% -
Operative EBIT 15.0 11.1 +35 65.5 58.5 +12
margin 6.1% 4.7% - 6.5% 6.5% -
Operative ROCE*, % 11.8% 9.4% - 11.0% 9.7% -
Capital expenditure 9.0 3.6 +150 51.7 85.5 -39
Cash flow after investing activities -1.2 14.4 - 46.9 35.6 +32
KEY FINANCIALS
Industry & Water
A P RIL 27 , 2018 Q1 2018 RE S ULT S 23
*12-month rolling average

EUR million Q1 2018 Q1 2017 2017 2016
Net profit for the period 23 20 85 98
Total adjustments 42 45 204 187
Change in net working capital -31 -42 -34 29
Finance expenses -1 -4 -25 -20
Income taxes paid 1 -7 -25 -23
Net cash gen. from operating activities 34 12 205 271
Purchases of subsidiaries and acquisit. 1 0 0 2
Capital expenditure -23 -37 -190 -213
Proceeds from sale of assets 4 0 3 37
Change in long-term loan receivables 0 0 -5 1
Cash flow after investing activities 16 -25 13 98
Cash flow
A P RIL 27 , 2018 Q1 2018 RE S ULT S 24

FY 2017
Revenue split by country
A P RIL 27 , 2018 Q1 2018 RE S ULT S 25
USA 27%
Canada 6%
Brazil 3%
Uruguay 2%
Other Americas 1%
Finland 14%Sweden 6%
Germany 5%
Poland 3%
UK 3%
Spain 2%
Other APAC 4%
Korea 1%
China 4%
Russia 2%
Netherlands 2%
France 2%
Italy 2%
Other EMEA 9%
Norway 2%

Important information about financial figuresKemira provides certain financial performance measures (alternative performance measures) on non-GAAP basis. Kemira believes that alternative performance measures, such as organic growth*, EBITDA, operative EBITDA, cash flow after investing activities, and gearing followed by capital markets and Kemira management, provide useful information of its comparable business performance and financial position. Selected alternative performance measures are also used as performance criteria in remuneration.
Kemira’s alternative performance measures should not be viewed in isolation to the equivalent IFRS measures and alternative performance measures should be read in conjunction with the most directly comparable IFRS measures. Definitions of the alternative performance measures can be found in the Definitions of the key figures in this report, as well as at www.kemira.com > Investors > Financial information.
All the figures in this interim report have been individually rounded and consequently the sum of individual figures may deviate slightly from the sum figure presented.
A P RIL 27 , 2018 Q1 2018 RE S ULT S 26
* Revenue growth in local currencies, excluding acquisitions and divestments
