good organic growth - media.kemira.com · with chemistry water can be purified better ... gain from...
TRANSCRIPT

INVESTOR PRESENTATION
Good organicgrowth
APRIL 27, 2018

SEGMENT SPLIT PRODUCTS
A P RIL 2018 INV E S T OR P RE S E NT A T ION 2
GEOGRAPHIES
Kemira in briefFY2017: REVENUE EUR 2,486 MILLION, OPERATIVE EBITDA EUR 311 MILLION, OPERATIVE EBITDA MARGIN 12.5%, OPERATIVE ROCE 9.7%
25% Bleaching
and pulping
20%
Polymers
20% Other:
e.g. defoamers,
dispersants,
and biocides
20%
Coagulants
15%
Sizing
and
strength
Revenue by product category rounded to the nearest 5%
39%
AMERICAS
1.USA
2.Canada
3.Brazil
52%
EMEA
1.Finland
2.Sweden
3.Germany
9%
APAC
1.China
2.South
Korea
3. Indonesia
59%Pulp & Paper
41%Industry & Water
CUSTOMERS
2,000 customers
TOP 10 customers are ~25% of revenue
TOP 50 customers are ~45 of revenue
EXAMPLES OF
LARGEST CUSTOMERS
Municipalities, e.g.
Frankfurt, London, New York,
Paris, Shanghai, Singapore
#1 in
water
treatment
in NA and
Europe
#2 in friction reduction in North
American shale oil & gas
#1 globally

Global trends favor Kemira
A P RIL 2018 INV E S T OR P RE S E NT A T ION 3
Trends, among others
How Kemira benefits from the trend
E-commerce /
online
shopping
Recycling
Increasing need
for packaging
material
More chemicals
required for
stronger
paper/board
Plastics to
be replaced
by biobased
products
Increased
demand of
biobased and
more sustainable
technologies
Regulation driving
better water quality
Finding oil
reservoirs
becoming harder
With chemistry
water can be
purified better
With polymers
increasing
amount of oil
can be
extracted from
current and
new oil fields
Plastics to
be replaced
by biobased
products

REVENUE EUR million
2,229
2,137
2,373 2,363
2,486
2013 2014 2015 2016 2017
OPERATIVE EBITDAOPERATIVE EBITDA MARGINEUR million
252 253
287
303311
11.3%
11.8%12.1%
12.8%
12.5%
2013 2014 2015 2016 2017
INV E S T OR P RE S E NT A T ION 4
Delivering profitable growth
A P RIL 2018

1,0681,170
1,417 1,457 1,477
130137
171195
198
2013 2014 2015 2016 2017
REVENUE ANDOPERATIVE EBITDA
REVENUE BYPRODUCT CATEGORY
INV E S T OR P RE S E NT A T ION 5
REVENUE BY CUSTOMERTYPE AND MARKET GROWTH
Pulp & Paper – market leader with solid track record
MARKET ENVIRONMENT REVENUE BY GEOGRAPHIES AND
MARKET GROWTH BY REGION
CUSTOMER EXAMPLES
50%
EMEA
35%
Americas 15% APAC
35%
Bleaching
& pulping
25%
Sizing &
strength
20%Defoamers,
dispersants,
biocides and
other process
chemicals
10%
Polymers
10% Other 40%
Pulp
20%
Printing &
writing papers
40%
Board &
tissue
-1-2%2-3%1-2%Market
growth
2-3%0-1%0-1%Market
growth
AkzoNobel (pulp) #4
BASF (paper) #2
Solenis (paper) #3
Kemira (pulp and paper) m.s. ~16% #1
Ecolab (paper) #5
Note: Revenue by industry, product and geography rounded to the nearest 5%
A P RIL 2018

REVENUE BYPRODUCT CATEGORY
INV E S T OR P RE S E NT A T ION 6
REVENUE BY APPLICATIONTYPE AND MARKET GROWTH
Industry & Water – strong positions in chosen categories
REVENUE BY GEOGRAPHIES AND
MARKET GROWTH BY REGION
40%
Coagulants
40%
Polymers
20%
Other
products
such as
defoamers
and biocides
2-3%5-6%2-3%
50%
EMEA
45%
Americas
5%
APAC
70%
Water treatment 10%
Other
20%
Oil & Gas
5-6%3-4%3-4%
WATER TREATMENT
Amsterdam
Barcelona
Frankfurt
London
Oslo
Paris
Stockholm
Los Angeles
Montreal
New York City
Toronto
Melbourne
Shanghai
Singapore
OIL & GAS
Note: Revenue by industry, product and geography rounded to the nearest 5%
Market
growth
Market
growth
CUSTOMER EXAMPLES
A P RIL 2018
938 921 906 906 924 945 973 1,009 1,016
111 107 105 107 105 105112 113 117
Q1 Q2 Q3 Q4 Q1 Q2 Q3 Q4 Q1
2016 2017 2018
REVENUE AND OPERATIVE EBITDA ROLLING 12 MONTHS
MARKET ENVIRONMENT
Market share
~30% in coagulants and
~20% in polymers
Main competitors in
coagulants:
• Feralco (Europe)
• Kronos (Europe)
• Chemtrade (US)
• USAlco (US)
Market share ~25% in
polymers used in shale oil
& gas
Main peers in polymers
(also in water treatment):
• SNF
• BASF
• Solenis
• Solvay (only O&G)
MUNICIPAL (40%),
customer examples
INDUSTRIAL (60%),
customer examples
Municipal Industrial

2015 2016 2017 Pulp &Paper
Group Pulp &Paper
Pulp &Paper
Group Industry &Water
Industry &Water
Industry &Water
Volatility &inflation
Mid- to long-term target
Our key actions to improve margins
INV E S T OR P RE S E NT A T ION 7
12.5%
Operative EBITDA
margin 14-16%
New
bleaching
capacity in
Finland
Optimization
of operations:
majority of
savings in
logistics
Oil sandsChemical
Enhanced
Oil Recovery
12.1% New
two segment
structure
12.8%
Estimated end of 2017 run-rate 100% 100% 75% 0% Low 25% Low Low
Full run-rate by EO 2017 EO 2017 2018 2019 1-2 yrs 2-3 yrs 2-5 yrs 3-5 yrs
AkzoNobel’s
paper
chemicals
Advanced
Water
Treatment
Volatility and
inflation
A P RIL 2018
Acquisition
in China

Kemira offers stable and competitive dividend• Cash flow from operations has been partly
invested into future growth and partly distributed to shareholders as dividends
• Kemira has paid dividend every year since listing of shares in 1994
• Kemira offers attractive dividend yield
0.53 0.53 0.53 0.53 0.53 0.53 0.53
0.13
0.37
0.470.44
0.51
0.61
0.43
5.8% 4.5% 4.4% 5.4% 4.9% 4.4% 4.6%
2011 2012 2013 2014 2015 2016 2017
INV E S T OR P RE S E NT A T ION 8
Dividend per share
Dividend yield
A P RIL 2018
Kemira’s dividend yield calculated using the share price at year-end
Growth investments per share

Expansion of
pulp chemicals,
Oulu (FI)
Progress in profitable growth
INV E S T OR P RE S E NT A T ION 9
AcquisitionOpening / expansion of site Operational efficiencies
Opening of Tarragona
coagulant site (ES)
Acquisition BASF
AKD emulsion business
Opening of EMEA
service center
Expansion of dry
and emulsion
polyacrylamide
(US)
Opening of
Nanjing (CN)
site
Closure of
Longview (US)
AkzoNobel’s
paper chemicals
acquisition
Acquisition of Soto
Industries (US)
Closure of
Soave (IT)
Start-up of Ortigueira
(BR) sodium chlorate site
and announcement of
Joutseno (FI) expansion
Acquisition
of Polymer
Services (US)
Botlek (NL)
modernization
BOOST operational
excellence program
launch
Bradford (UK)
expansion
San Giorgio (IT)
expansion
Closures of Ottawa (CA)
and Zaramillo (ES)
Closure of site
Q416
Transportation
agreement with
Odyssey
Q117
Odyssey go-live
in North America
Two segment
structure
operational
Start-up of Joutseno
(FI) chlorate expansion
Announcement
of acquisition
via JV in China
Q114
Q217
Q314
Q414
Q115
Q215
Q415
Q116
Q214
Q317
Q216
11.3%2013 operative
EBITDA
12.5%2017 operative
EBITDA
Q315
Q316
A P RIL 2018
Q417

INVESTOR PRESENTATION
A P RIL 2018 INV E S T OR P RE S E NT A T ION 10
Latest news andfinancials

Key financial highlights
• Organic growth +7%
– Demand is growing in every market we serve
– Strong momentum continued especially inOil & Gas
• Operative EBITDA flat at reported figures, underlying development better
– Positive impact of organic growth was offset by increased variable costs and currency headwind
• Currencies EUR -7 million on EBITDA level
– Q1 was below our expectations but we expectbetter performance in the coming quarters
• Earnings per share +17%
– Finance costs were lower due to EUR 3.6 million gain from the sale of shares in power plant companies
EUR million
(except ratios)
Q1
2018
Q1
2017
Δ% FY
2017
Revenue 613.7 610.0 +1 2,486.0
Operative EBITDA 69.4 69.0 +1 311.3
of which margin 11.3% 11.3% - 12.5%
Operative EBIT 33.9 34.9 -3 170.3
of which margin 5.5% 5.7% - 6.9%
Net profit 23.0 19.8 +16 85.2
EPS, EUR 0.14 0.12 +17 0.52
A P RIL 2018 INV E S T OR P RE S E NT A T ION 11
Q1 2018

In big picture, operative EBITDA on positive trend
Profitability improvement measures overshadowed by pressure from raw material prices
During the last year market has moved from deflatory to inflatory environment
A P RIL 2018 INV E S T OR P RE S E NT A T ION 12
ROLLING 12-MONTH OPERATIVE EBITDA AND OPERATIVE EBITDA-%
262
276
285 287
294298
301 303299 297
301
311 312
12.1%12.4% 12.3%
12.1% 12.2%12.4%
12.7% 12.8%12.5%
12.3% 12.3%12.5%
10%
11%
12%
13%
14%
15%
16%
200
220
240
260
280
300
320
Q1 Q2 Q3 Q4 Q1 Q2 Q3 Q4 Q1 Q2 Q3 Q4 Q1
2015 2016 2017 2018
Positive long-term operative EBITDA trend
12.5%

Pulp & Paper – good underlying market with major regional differencesMarket environment and performance
• EMEA strong and South America solid
• North America battles with shrinking market in process and functional chemicals
• In APAC growth continues but profitability a challenge
Q1 organic growth +5%
• FX offsetting reported revenue growth
Profitability drivers
• Profitability improvement to continue when price increases go through - current sales prices were not yet sufficient to cover increase in raw material prices
• In addition to sales prices, new capacity at Joutseno and Chinese acquisition are expected to improve profitability in mid-term
183
191
196 195193
192189
198
194
12.5%12.9%
13.4% 13.4%13.2% 13.0%
12.8%
13.4%
Q1 Q2 Q3 Q4 Q1 Q2 Q3 Q4 Q1
2016 2017 2018
A P RIL 2018 INV E S T OR P RE S E NT A T ION 13
13.2%
ROLLING 12-MONTH OPERATIVE EBITDA AND EBITDA-% EUR million

Megatrend e-commerce drives need for packaging materialMegatrend
• Retail e-commerce grew +25% globally in 2017led by Amazon, eBay, Alibaba, etc.
• Growth in e-commerce drives packaging material production volumes
Impact on pulp and paper producers
New board capacity regularly announced, especially in APAC and EMEA, e.g.
• Chinese Nine Dragon to add 3 million tons of packaging paper capacity by June 2019
• APP to expand Guangxi (CN) mill by 2 new board machines with production of 1.8 Mton/a
• Hamburger Rieger (DE) to invest in new 500 kt/a containerboard machine
Impact on Kemira
• Kemira serves board producers with process and functional chemicals
• Kemira has strong references in conversions and new start-ups
• Also beneficial for Kemira’s pulp bleaching business as pulp is the intermediate product for board
A P RIL 2018 INV E S T OR P RE S E NT A T ION 14
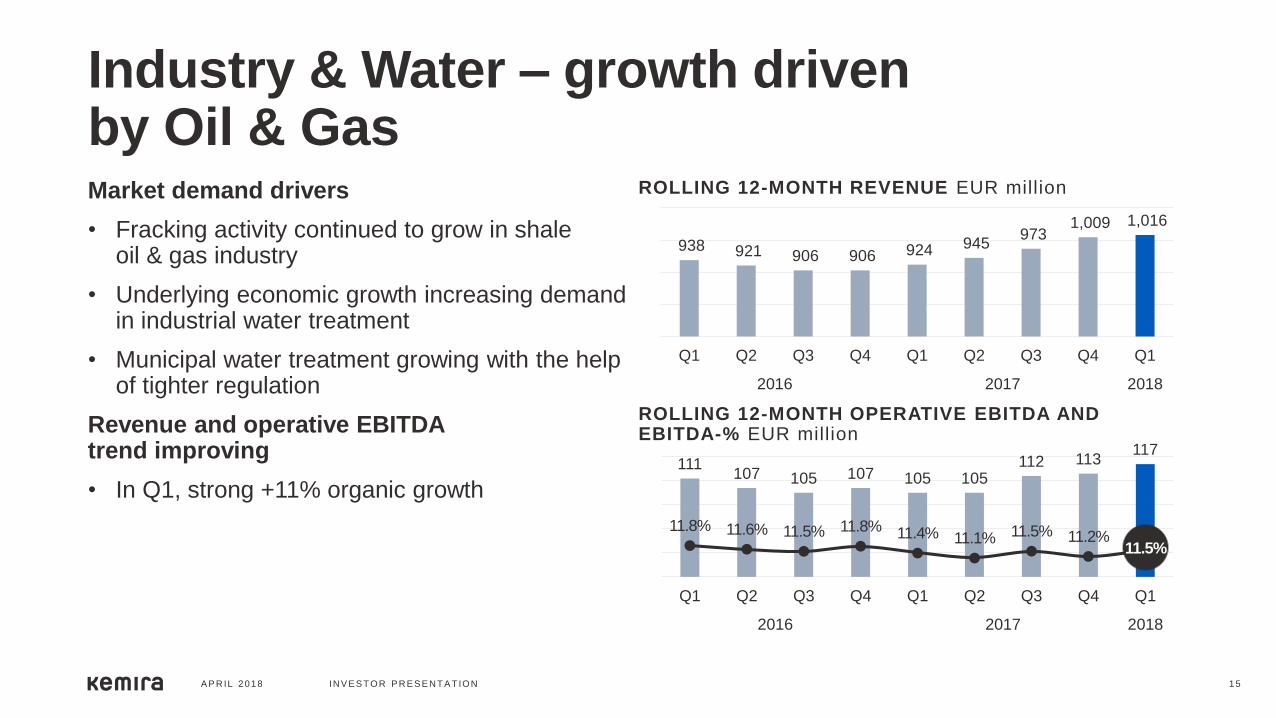
Industry & Water – growth drivenby Oil & GasMarket demand drivers
• Fracking activity continued to grow in shale oil & gas industry
• Underlying economic growth increasing demand in industrial water treatment
• Municipal water treatment growing with the help of tighter regulation
Revenue and operative EBITDAtrend improving
• In Q1, strong +11% organic growth
938 921 906 906 924 945 973
1,009 1,016
Q1 Q2 Q3 Q4 Q1 Q2 Q3 Q4 Q1
2016 2017 2018
111107 105 107 105 105
112 113117
11.8% 11.6% 11.5% 11.8% 11.4% 11.1% 11.5% 11.2%
Q1 Q2 Q3 Q4 Q1 Q2 Q3 Q4 Q1
2016 2017 2018
A P RIL 2018 INV E S T OR P RE S E NT A T ION 15
ROLLING 12-MONTH REVENUE EUR million
ROLLING 12-MONTH OPERATIVE EBITDA AND EBITDA-% EUR million
11.5%

CEOR deal signed with Chevron
• Strategically important multi-year Chemical Enhanced Oil Recovery deal signed with Chevron
• EUR 30 million capacity addition, announced in October 2017, progressing well
• CEOR market size approximately EUR 1 billion of which EUR 500 million accessible to Kemira
• Market growth estimated to be 5% driven by enhanced production from existing fields
• Kemira is committed to provide enhanced solutions for challenging water intensive environments and technologies that can enable CEOR
• Our offering provides enhanced and improved oil recovery with focus around polymer injectivity, chemical stability, shear tolerance, thermal stability and efficacy
A P RIL 2018 INV E S T OR P RE S E NT A T ION 16

Group’s organic revenue growth continued
A P RIL 2018 INV E S T OR P RE S E NT A T ION 17
Q1 2018
Group’s organic growth +7%
• Pulp & Paper +5%
• Industry & Water +11%
Operative EBITDA margin 11.3%
• Flat compared to prior year
• Good revenue growth was offset by raw material prices and FX
• Fixed costs slightly below prior-year level
72.878.9 80.8
70.0 69.077.1
84.5 80.769.4
12.5%13.4% 13.6%
11.7% 11.3%12.5%
13.6%12.7%
Q1 Q2 Q3 Q4 Q1 Q2 Q3 Q4 Q1
2016 2017 2018
610 +4%-7% 0% 614
Q1 2017 Salesvolumes
Salesprices
Currencyimpact
Acquisitions Q1 2018
+4%
REVENUE AND ORGANIC REVENUE GROWTH
(Y-ON-Y) EUR million
OPERATIVE EBITDA AND OPERATIVE EBITDA
MARGIN EUR million
11.3%

Currencies are currently headwind due to translation, transactional risk limitedCurrency exchange rates had EUR -41 million impact on revenue andEUR -7 million impact on the operative EBITDA in Q1 2018
Guidance: 10% change in our main foreign currencies would approximately haveEUR 15 million impact on operative EBITDA on an annualized basis
A P RIL 2018 INV E S T OR P RE S E NT A T ION 18
46% EUR
9% Others
KEMIRA REVENUE DISTRIBUTION Q1 2018 KEMIRA COST DISTRIBUTION Q1 2018
3% SEK
3% CNY
4% CAD
33% USD
10% Others
4% CNY
5% CAD
8% SEK
28% USD
45% EUR 2% BRL

SALES PRICE VS VARIABLE COST TREND
-200
-150
-100
-50
0
50
100
150
200
2008 2009 2010 2011 2012 2013 2014 2015 2016 2017 2018
Brent oil, USD Sales prices* Variable costs*
SALES PRICES AND VARIABLE COSTS(CHANGE Y-O-Y)
95
-3-10
-16-20
-10
-2 -2-9
-18
-26-23
-16
-4
3
11
23
-18-23
-23 -13
0
1613
13
26
-30
-20
-10
0
10
20
30
Q1 Q2 Q3 Q4 Q1 Q2 Q3 Q4 Q1
2016 2017 2018
Net impact on EBITDA (sales prices-variable costs)
Sales prices
Variable costs
A P RIL 2018 INV E S T OR P RE S E NT A T ION 19
Variable costs spiked in Q1,sales prices following
* 12-month rolling change vs previous year in EUR million

Pulp & Paper – good organic growth but profitability disappointed• Organic growth continued with volume growth at +3%, driven by chlorate capacity addition in
Finland and good underlying demand, especially in Europe
• FX headwind had -6% impact on revenue
• Profitability hampered by FX and sharp variable cost increases
• EMEA performing well but North America and China were behind
362 361 365 369 372 369 363 373 369
Q1 Q2 Q3 Q4 Q1 Q2 Q3 Q4 Q1
2016 2017 2018
47.9 49.3 51.846.3 46.0 47.8 48.5
55.4
42.7
13.2%13.7% 14.2%
12.6% 12.4% 13.0% 13.4%14.9%
11.6%
Q1 Q2 Q3 Q4 Q1 Q2 Q3 Q4 Q1
2016 2017 2018
A P RIL 2018 INV E S T OR P RE S E NT A T ION 20
+3% +1% -4% -2% 0% +1% +2% +5%
REVENUE AND ORGANIC REVENUE GROWTH
(Y-ON-Y) EUR million
OPERATIVE EBITDA AND OPERATIVE EBITDA
MARGIN EUR million
+5%

Industry & Water – strong growth continued
• Strong organic growth, heavy FX headwind from USD
• Oil & Gas +21% to EUR 46 million in Q1 2018, organic growth in O&G over 30%
• Profitability improving in Oil & Gas driven by sales price increases and volume growth
• Newer growth areas, such as water treatment for oil sands and CEOR, continue to be margin-dilutive until fully scaled up and optimized
220 227 231 228 238 248 259 264245
Q1 Q2 Q3 Q4 Q1 Q2 Q3 Q4 Q1
2016 2017 2018
24.929.6 29.0
23.7 22.929.3
36.0
25.3 26.6
11.3%13.1% 12.5%
10.4%9.6%
11.8%
13.9%
9.6%10.9%
Q1 Q2 Q3 Q4 Q1 Q2 Q3 Q4 Q1
2016 2017 2018
A P RIL 2018 INV E S T OR P RE S E NT A T ION 21
-7% -5% 0% +9% +15%-5% +6% +20% +11%
REVENUE AND ORGANIC REVENUE GROWTH
(Y-ON-Y) EUR million
OPERATIVE EBITDA AND OPERATIVE EBITDA
MARGIN EUR million

Development of selected key figures
9.8%9.9%
9.7%
9.5%
9.7%
2015 2016 2017 Q1 2017 Q1 2018
642 634694 661 678
2015 2016 2017 Q1 2017 Q1 2018
A P RIL 27 , 2018 Q1 2018 RE S ULT S 22
ALL KEY FIGURES IN EUR MILLION EXCEPT RATIOS
248271
205
1234
2015 2016 2017 Q1 2017 Q1 2018
104 118 124
20 16
78 95 66
17 7
2015 2016 2017 Q1 2017 Q1 2018
CASH FLOW FROM OPERATIONS CAPITAL EXPENDITURE EXCL. ACQUISITIONS
NET DEBT AND LEVERAGE RATIORETURN ON CAPITAL EMPLOYED
2.22.12.2 2.22.2
Growth capex

• New chlorate plant in Brazil and new chlorate line in Finland
• Capacity additions due to integration of acq.
• Polymer capacity in Italy and UK
50 60 59
53 58 65
78
95 66
2015 2016 2017
A P RIL 2018 INV E S T OR P RE S E NT A T ION 23
IN 2015-2017, ON AVERAGE AROUND EUR 80 MILLION INVESTED INTO GROWTH
CAPEX guidance 160-200 MEUR in 2018
Expansion Improvement Maintenance
190
CAPITAL EXPENDITURE EXCLUDING ACQUISITIONSEUR million and share of revenue
213
RECENT LARGEST VALUE CREATING
INVESTMENTS
CAPEX GUIDANCE
• In 2018, capital expenditure estimated to beEUR 160-200 million
– Includes capacity expansion in Oil & Gas
182
7.7%9.0%
7.6%

VARIABLE COST SPLIT 2017EUR 1.5 billion
TOP 10 RAW MATERIALSBY SPEND
1. Sodium hydroxide
2. Acrylonitrile
3. Colloidal silica dispersion
4. Amines
5. Aluminium hydrate
6. Petroleum solvents
7. Sodium chloride (salt)
8. Acrylic ester
9. Acrylic acid
10. Fatty acid
Top 10 account for 43%of Kemira’s raw material spend
INV E S T OR P RE S E NT A T ION 24
EXPOSURE TO OIL RELATEDRAW MATERIALS
Kemira’s variable cost split and top raw materials
30%Oil & gas
related
70%Not oil
related
70%Raw materials
10%Electricity & energy
20%Logistics
A P RIL 2018

NET DEBT / OPERATIVE EBITDA AND GEARING
42% 41% 42%
54% 54%59%
2012 2013 2014 2015 2016 2017
GROSS DEBT MATURITY PROFILE,
END OF MARCH 2018 EUR 908 MILLION
(Cost of debt 2.0%)
INV E S T OR P RE S E NT A T ION 25
Debt portfolio is well diversified
1.9x
2.1x 2.1x2.2x
1.8x
2.2x
532m 694m456m 486m 634m642m
NET DEBT
OPERATIVE EBITDA
A P RIL 2018
249m 311m252m 253m 303m287m
0
50
100
150
200
250
300
350
400
450
2018 2019 2020 2021 2022 2023 2024 2025
Bilaterals Bonds Undrawn RCF Undrawn Bilaterals Others
150
200
400
114
205
90
149
40

Per share figures – 5-year summary
2013 2014 2015 2016 2017
Earnings per share, EUR -0.21 0.59 0.47 0.60 0.52
Cash flow from operating activities
per share, EUR
1.32 0.49 1.63 1.78 1.35
Equity per share, EUR 7.32 7.57 7.76 7.68 7,61
Dividend per share, EUR
(*2017 proposal to the AGM)
0.53 0.53 0.53 0.53 0.53*
Share price, EUR, end of period 12.16 9.89 10.88 12.13 11.50
Market capitalization, EUR million
(excl. treasury shares)
1,849 1,504 1,654 1,848 1,752
Number of shares, million
(excl. treasury shares)
152.0 152.1 152.1 152.4 152.4
P/E ratio - 16.7 23.3 20.1 22.3
P/CF ratio 9.2 20.2 6.7 6.8 8.5
P/B ratio 1.7 1.3 1.4 1.6 1.5
Dividend yield, % 4.4 5.4 4.9 4.4 4.6
INV E S T OR P RE S E NT A T ION 26A P RIL 2018

Key figures and ratios
EUR million (except ratios) 2013 2014 2015 2016 2017 Q1 2018 Q1 2017
Revenue 2,229.1 2,136.7 2,373.1 2,363.3 2,486.0 613.7 610.0
Operative EBITDA 251.9 252.9 287.3 302.5 311.3 69.4 69.0
of which margin 11.3% 11.8% 12.1% 12.8% 12.5% 11.3% 11.3%
Operative EBIT 164.2 158.3 163.1 170.1 170.3 33.9 34.9
of which margin 7.4% 7.4% 6.9% 7.2% 6.9% 5.5% 5.7%
Net profit -25.9 95.8 77.2 97.9 85.2 23.0 19.8
Cash flow from operations 200.3 74.2 247.6 270.6 205.1 34.5 12.2
Capital expenditure,
excluding acq.133.5 140.6 181.7 212.6 190.1 23.2 36.9
Gearing at period-end 41 42 54 54 59 61 59
Inventories 170 197 207 217 224 237.1 230.2
Personnel at period-end 4,453 4,248 4,685 4,818 4,732 4,740 4,771
A P RIL 2018 INV E S T OR P RE S E NT A T ION 27
* Restated figures reflect the change of IAS 19, Employee Benefits

EUR million Q1 2018 Q1 2017 2017 2016
Net profit for the period 23 20 85 98
Total adjustments 42 45 204 187
Change in net working capital -31 -42 -34 29
Finance expenses -1 -4 -25 -20
Income taxes paid 1 -7 -25 -23
Net cash gen. from operating activities 34 12 205 271
Purchases of subsidiaries and acquisit. 1 0 0 2
Capital expenditure -23 -37 -190 -213
Proceeds from sale of assets 4 0 3 37
Change in long-term loan receivables 0 0 -5 1
Cash flow after investing activities 16 -25 13 98
Cash flow
A P RIL 2018 INV E S T OR P RE S E NT A T ION 28

EUR million Q1 2018 Q1 2017 Δ% 2017 2016 Δ%
Revenue 368.7 372.2 -1 1,476.9 1,457.3 +1
Operative EBITDA 42.7 46.0 -7 197.7 195.3 +1
margin 11.6% 12.4% - 13.4% 13.4% -
Operative EBIT 18.9 23.8 -20 104.8 111.6 -6
margin 5.1% 6.4% - 7.1% 7.7% -
Operative ROCE*, % 8.6% 9.5% - 9.0% 10.0% -
Capital expenditure 13.4 29.8 -55 138.3 125.1 +11
Cash flow after investing activities 16.7 -22.9 - 15.7 105.7 -85
KEY FINANCIALS
Pulp & Paper
A P RIL 2018 INV E S T OR P RE S E NT A T ION 29
*12-month rolling average

EUR million Q1 2018 Q1 2017 Δ% 2017 2016 Δ%
Revenue 245.0 237.8 +3 1,009.1 906.0 +11
Operative EBITDA 26.6 22.9 +16 113.6 107.2 +6
margin 10.9% 9.6% - 11.3% 11.8% -
Operative EBIT 15.0 11.1 +35 65.5 58.5 +12
margin 6.1% 4.7% - 6.5% 6.5% -
Operative ROCE*, % 11.8% 9.4% - 11.0% 9.7% -
Capital expenditure 9.0 3.6 +150 51.7 85.5 -39
Cash flow after investing activities -1.2 14.4 - 46.9 35.6 +32
KEY FINANCIALS
Industry & Water
A P RIL 2018 INV E S T OR P RE S E NT A T ION 30
*12-month rolling average

FY 2017
Revenue split by country
A P RIL 2018 INV E S T OR P RE S E NT A T ION 31
USA 27%
Canada 6%
Brazil 3%
Uruguay 2%
Other Americas 1%
Finland 14%Sweden 6%
Germany 5%
Poland 3%
UK 3%
Spain 2%
Other APAC 4%
South Korea 1%
China 4%
Russia 2%
Netherlands 2%
France 2%
Italy 2%
Other EMEA 9%
Norway 2%

INVESTOR PRESENTATION
Pulp & Paper –driving growth as market leader
A P RIL 2018 INV E S T OR P RE S E NT A T ION 32

Above-the-market
growth and operative
EBITDA of 14-16%
Our winning formula to continue growth
A P RIL 2018 INV E S T OR P RE S E NT A T ION 33
INVEST IN GROWTH
AND R&D
• Capacity additions
• More than 10 new products in
2016 and 2017
IMPROVE CUSTOMER
EXPERIENCE
• TOP 50 customers are EUR 1bn
• Customer satisfaction to 98%
MAXIMIZE CAPACITY
UTILIZATION
• Bleaching ran flat out 9 years
• Paper chemicals varying
REDUCE COMPLEXITY
• Group: 240 products out in 2016
• Around 250 products out in 2017
MANAGE FIXED COSTS
• 2017 business overheads
below 2016 level
ENHANCE
PERFORMANCE CULTURE
• New mgmt. structure
• Employee engagement – 15/16
survey items improved since 2015

Board and paper production shiftingto emerging markets
A P RIL 2018 INV E S T OR P RE S E NT A T ION 34
GROWTH OF
BOARD AND PAPER
PRODUCTION
BY REGION 2015-2030
55mt growth in APAC
by 2030
BIGGEST PRODUCERS
ARE:
China, USA, Japan,
Germany, India, Sweden,
Korea, Canada, Finland,
Brazil
BIGGEST GROWTH
AREAS ARE:
China, India, Indonesia,
Brazil, Russia, Vietnam
TOTAL BOARD &
PAPER PRODUCTION:
2015: 402 million tons
2030: 461 million tons
CAGR%: around 1 % / annum
Source: Pöyry
North America
2015: 82 mt
2030: 75 mt
Latin America
2015: 21 mt
2030: 31 mt
. Europe
2015: 85 mt
2030: 78 mt
Oceania
2015: 4 mt
2030: 4 mt
China
2015: 106 mt
2030: 139 mt
E. Europe
2015: 18 mt
2030: 26 mt
Africa
2015: 4 mt
2030: 6 mt
Japan
2015:26 mt
2030:21 mt
Rest of Asia
2015: 55 mt
2030: 82 mt

Strong market positions and strategic investments
A P RIL 2018 INV E S T OR P RE S E NT A T ION 35
REGION MARKET POSITION GROWTH TREND GROWTH STRATEGY
EMEA
North America
APAC
South America
#1
#2/3
#1
#3
Exceptional customer
experience
Transformation from paper
to board
Continue to grow with major
players (TCM) and assess
future investments
Assess future bleaching
investments
TCM = Total Chemistry Management

Board and paper production in APAC willbe bigger than Europe and North America combined by 2020
>90% of global board and paper production growth in APAC
Kemira now #1 with close to 10% share in APAC
• Revenue doubled to aroundEUR 200 million in 3 years
Fragmented market provides good potential for profitable growth
Continue to grow revenue and market share
PULP & PAPER RELEVANT CHEMICALSMARKET 2017
A P RIL 2018 INV E S T OR P RE S E NT A T ION 36
We have become market leader in APAC
EMEA
North
America
APAC
South America 2-3%
2-3%
-1-0%
0-1%
CAGR 2017-2022

Strong demand in pulp market creating growth opportunitiesNew pulp mill projects are driven byincreasing demand for board and tissue
• Food and liquid packaging board isgrowing particularly fast in Asia
• Pulp is produced close to wood sources andthen shipped to board, paper, and tissue mills
• Growth in board = 1 new pulp mill per year
Multiple pulp mill projects realised and expected in Northern Europe creating opportunities for Kemira to grow withthe market
In addition, a few large scale pulp millprojects expected in South America
A P RIL 2018 INV E S T OR P RE S E NT A T ION 37
Confirmed new capacity /
debottlenecking 2016-2020
Possible new mills 2020-2022

• Kemira’s capacity in sodium chlorate was fully utilized, hence the need for additional capacity
• Capacity doubled in Joutseno with around EUR 50 million investment
• Investment realized according to budget and start-up was ahead of schedule in early September 2017
• Part of the production will be shipped to APAC to support the growth in the region
KEMIRA BLEACHING CHEMICALS REVENUE GROWTH
2014 2015 2016 2017
A P RIL 2018 INV E S T OR P RE S E NT A T ION 38
Successful value creating investments –case Joutseno
+7% +10% +6% +5%
CAGR
+ 7%

Acquisition via JV in China
• Agreed to form joint venture with Tiancheng
• NewCo will produce mainly AKD wax and its key raw material fatty acid chloride (FACL)
– AKD is sizing chemical used in board and paper to createresistance against liquid absorption
– NewCo also plans to produce coagulants for water treatment
• Kemira strengthens its position and secures supply of key raw material for AKD wax
• Kemira will have 80% of NewCo
– Investment for 80% around EUR 55 million
– Closing expected in H1 2018
• Ramp-up in H2/18 after completion investments
– Good contribution to P&L in 2019 after ramp-up
A P RIL 2018 INV E S T OR P RE S E NT A T ION 39

AKD WAX SUPPLIED FROM YANZHOU, CHINA TO KEMIRA SITES GLOBALLY
We leverage acquisition synergieswith our global production
A P RIL 2018 INV E S T OR P RE S E NT A T ION 40
Telêmaco
Borba
Washougal
St. CatharinesHelsingborg
Joutseno
Nanjing
Hallam
Gunsan
Pasuruan
Wellgrow
Krems
TarragonaYanzhou
NewCo

Acquisition in China is excellentstrategic fitAcquired asset fulfills our key criteria for acquisitions
GROWTH – End-products in growing markets
APAC – Enables profitable growth in APAC
SUPPLY – Backward integr. & self-sufficiency (FACL)
SUSTAINABILITY – FACL from renewable raw material
LOCATION – Close to our existing production
PROFITABILITY – Accretive in 2019 after ramp-up
A P RIL 2018 INV E S T OR P RE S E NT A T ION 41
END-PRODUCTSWHERE AKD WAXIS USED

Pulp & Paper
A P RIL 2018 INV E S T OR P RE S E NT A T ION 42
TECHNOLOGY AND MARKET LEADER
Value chain part covered by Kemira
RAWMATERIALS
INTERMEDIATES PRODUCTS APPLICATIONSCUSTOMERINDUSTRIES
CUSTOMERS
Electricity
Sodium chloride(salt)
Crude tall oil
Cationic monomer
Acrylonitrile
Acrylic acid
Olefins
Fatty acids
Maleic anhydride
Sulfur
Tall oil rosin
AKD Wax
Isomerized olefinsAcrylamide
Sodium chlorate
Hydrogen peroxide
Polymers
Defoamers
Coagulants
Biocides
Sizing
Strength Additives
Surface additives
Colorants
Sulfuric acid
Pulping
Bleaching
Retention
Wet-end processcontrol
WQQM
Sizing
Strength
Surface treatment
Coloring
Pulp
Packagingand board
Printingand writing
Tissue
All the major global paper and pulp producers
MAIN COMPETITORS: BASF, Akzo Nobel, Solenis, Ecolab, SNF

INVESTOR PRESENTATION
A P RIL 2018 INV E S T OR P RE S E NT A T ION 43
Industry & Water -stronger platformfor profitable growth

New structure creates growth andefficiency opportunities Leveraging the full potential of new combined segment
• Full geographical reach in all regions
• Global polymer expert network
• Water treatment expertise for O&G and Mining
Structural change means faster decision making
More efficient development and roll-out of new innovations
Important part of segment’s profitability improvement
• On Group-level cost savings EUR 15-20 million
A P RIL 2018 INV E S T OR P RE S E NT A T ION 44
Oil &
Mining
Municipal
& Industrial
70%Water
treatment
20%Oil & Gas
10%Other
applications
Industry
& Water

The next generation of sludge treatment will focus on customer performance and value created
KemConnect Smart Dewatering combines a complete chemicals portfolio, continuous chemistry optimizationand real-time monitoring to a new business model
ADVANCED WATER TREATMENT CASE EXAMPLE
Innovation case – KemConnect Smart Dewatering
A P RIL 2018 INV E S T OR P RE S E NT A T ION 45
Dewatering Today Smart DewateringTomorrow
Disposal
Cost
KemConnect
Service Fee
Disposal
Cost
Customer
Net Savings
Chemical Cost

Resilient business set for growth
Growing market demand with our selective market diversification assuring growth
Kemira’s offering
• Process efficiencies: polymers that reduce energy consumption by 60% in shale oil fields
• Cost reduction: higher concentrated liquids that make offshore oil recovery more cost effective (CEOR)
• Addressing environmental regulations: tailing treatment in oil sands
New innovative technologies driving expansion
A P RIL 2018 INV E S T OR P RE S E NT A T ION 46
0
50
100
150
200
250
2013 2014 2015 2016 2017
REVENUE IN GROWTH INITIATIVESEUR million
REVENUE IN GROWTH INITIATIVESEUR million
25%Other
50%Shale fracking
25%Oil sands and
Chemical Enhanced
Oil Recovery Figures rounded to closest 5%
Oil
Price
+ 56%
in 2017

Our innovations make shale industrymore efficientSHALE MARKET
• Polymer market size +200M EUR and growing at double digit today
• Polymer more favorable product based on cost/performance
KEMIRA
• Provides unique chemistries, friction reducers,that reduce energy needed during hydraulic fracturing
• Volume growth over 100% in 1-9/2017
• Differentiating from competitors with innovative products
A P RIL 2018 INV E S T OR P RE S E NT A T ION 47
Market shares
in polymers used
for fracking
#1 market
position with
over 30%
market share
KEMIRA
Others
Competitor B
Competitor C
Competitor A

Long-term growth potential in CEOR
CHEMICAL ENHANCEDOIL RECOVERY MARKET
• CEOR market sizeEUR 1bn of whichEUR 500 million accessible to Kemira
• Market growth estimatedto be 5% driven by decline of production from existing fields
KEMIRA
• Kemira’s MaxXtract solution tailored specifically to customer needs, incorporating chemistry, equipment and services
• Kemira’s knowhow in polymers helps oil producers
• Potential for > EUR 100 million revenue in 5 years
A P RIL 2018 INV E S T OR P RE S E NT A T ION 48
Substantial long-term growth
potential within existing
CEOR projects and
through new projects

Oil sands has grown from 0 to aboveEUR 30m in 3 yearsOIL SANDS MARKET
• Market size is aroundEUR 400 million
• Projects are capex-heavybut developed projects are considered as sunken costs
KEMIRA
Offers total solutions to reduce environmental concerns
Customer base expanding
Revenue has grown to above EUR 30 million in 3 years
Target to more than double current revenues in 2-3 years
A P RIL 2018 INV E S T OR P RE S E NT A T ION 49
Companies
operating in oil
sands market (examples)

Industry & Water
A P RIL 2018 INV E S T OR P RE S E NT A T ION 50
TECHNOLOGY AND MARKET LEADER IN WATER TREATMENT AS WELLAS IN NICHE APPLICATIONS IN OIL & GAS
MAIN COMPETITORS
Coagulants: mainly local small companies, Feralco, USALCO, Kronos, PVS,
Polymers: SNF, Solvay, Ecolab, Solenis, BASF Value chain part covered by Kemira
INTERMEDIATES PRODUCTS APPLICATIONS SALES CHANNELS CUSTOMERS
Acrylonitrile
Acrylic acid
Sulfuric acid
Hydrochloric acid
Aluminium hydrate
Iron ore
Pickling liquor
Copperas
Various monomers
Acrylamide
Cationic monomer
Polymers (EPAM, DPAM)
Al Coagulants
Fe Coagulants
Dispersants &antiscalants
Biocides
Emulsifiers
Defoamers
Formulations
Raw water & waste water treatment
Sludge treatment
Friction reduction
Enhanced oil recovery
Tailings treatment
Mining processes
Direct sales
Distributor/reseller
Service companies
RAWMATERIALS
Municipalities
Private operators
Industrial customers
Pumpers
Oil & Gas operators
Service companies
Mine operators

INVESTOR PRESENTATION
Appendix
A P RIL 2018 INV E S T OR P RE S E NT A T ION 51

SHAREHOLDERS ON MARCH 31, 2018
% OF SHARES
1. Oras Invest 18.2%
2. Solidium (owned by State of Finland) 16.7%
3. Varma Mutual Pension Insurance Company 3.4%
4. Ilmarinen Mutual Pension Insurance Comp. 2.1%
5. Kemira Oyj 1.8%
Total number of shares 155,342,557
Foreign ownership of shares 26.4%
Total number of shareholders 35,815
KEMIRA BOARD OF DIRECTORS
A P RIL 2018 INV E S T OR P RE S E NT A T ION 52
Kemira – largest shareholders andBoard of Directors
JARI PAASIKIVI
Chairman
Member since 2012
Oras Invest Oy, CEO
KERTTU
TUOMAS
Vice Chairman
Member
since 2010
WOLFGANG
BÜCHELE
Member in
2009-2012 and
since 2014
KAISA
HIETALA
Member
since 2016
TIMO
LAPPALAINEN
Member since
2014
SHIRLEY
CUNNINGHAM
Member
since 2017

Kemira’s Management Board
A P RIL 2018 INV E S T OR P RE S E NT A T ION 53
Jukka Hakkila, Chief Legal Officer, acts as secretary of Management Board and Board of Directors.
PULP & PAPER
Kim Poulsen
OPERATIONAL
EXCELLENCE
Esa-Matti Puputti
INDUSTRY & WATER
Antti Salminen
CFO
Petri Castrén
HUMAN RESOURCES
Eeva SalonenCTO
Matthew R. Pixton
PRESIDENT AND CEO
Jari Rosendal

Priority Target Performance 2017 Comments Progress
Responsible
operations and supply
chain
Climate change
Kemira Carbon Index ≤ 80 by end
of 2020 (2012 = 100)
Sourcing of low carbon energy, especially carbon-
free electricity, continued according to plan. As part
of the E3 Plus program, four Energy Review site
visits were performed during Q1 2018. Until now, the
performed energy reviews cover more than 90% of
Kemira’s total energy consumption. Additionally,
internal Energy Management Audits were carried out
in Joutseno and Helsinki.
People Safety
Achieve zero injuries on long
term;
TRIF* 2.0 by end of 2020
Slight increase in the number of TRIs compared to
last year. Safety campaign and critical safety
standard implementation initiated this quarter should
help to reduce TRIs going forward. No single reason
for increase of incidents identified.
Supplier Management% of direct key suppliers screened
through sustainability assessments
and audits (cumulative %). The
target includes 5 sustainability audits
for highest risk** suppliers every
year, and cumulatively 25 by 2020.
Target scope expanded to cover both supplier
sustainability assessments and audits.
Corporate responsibility performance Q1 2018
55% 60%
90%
8 8
35
0
10
20
30
40
50
0%
20%
40%
60%
80%
100%
Baseline 2017 2018 Q1 Target 2022
% of Key suppliers # Audits
5.8
7.2
3.43.9
4.5
2.0
0.0
2.0
4.0
6.0
8.0
14 15 16 17 Q1 18 Target2020
10088 91 92 86 85 80
0
50
100
150
12 13 14 15 16 17 Target2020
A P RIL 2018 INV E S T OR P RE S E NT A T ION 54

Priority Target Performance CommentsProgress
People and
integrity
Employee engagement index
based on Voices@Kemira
biennial survey
The index at or above the external
industry norm. Participation rate in
Voices@Kemira 75 % or above.
Global people employee engagement survey
Voices@Kemira was postponed from autumn 2017
until Q2 2018, and will be conducted by IBM April 9-
20th 2018.
Leadership development
activities provided, average
Two (2) leadership development
activities per people manager
position during 2016-2020,
cumulative target 1500 by 2020.
Overall we are tracking well to achieve target.
Cumulative figure by the end of Q1 2018 is 1,147.
Corporate responsibility performance Q1 2018
58%67%
75%85%
0%
20%
40%
60%
80%
100%
2013 2015 2017 2018
Engagement Participation
494
1,036 1,147
1,500
0
500
1000
1500
2000
2016 2017 2018 Q1 Target 2020
* TRIF = Number of Total Recordable Injury Frequency per million hours, Kemira + contractor, year-to-date
** suppliers with lowest sustainability assessment score
A P RIL 2018 INV E S T OR P RE S E NT A T ION 55

Important information about financial figuresKemira provides certain financial performance measures (alternative performance measures) on non-GAAP basis. Kemira believes that alternative performance measures, such as organic growth*, EBITDA, operative EBITDA, cash flow after investing activities, and gearing followed by capital markets and Kemira management, provide useful information of its comparable business performance and financial position. Selected alternative performance measures are also used as performance criteria in remuneration.
Kemira’s alternative performance measures should not be viewed in isolation to the equivalent IFRS measures and alternative performance measures should be read in conjunction with the most directly comparable IFRS measures. Definitions of the alternative performance measures can be found in the Definitions of the key figures in this report, as well as at www.kemira.com > Investors > Financial information.
All the figures in this interim report have been individually rounded and consequently the sum of individual figures may deviate slightly from the sum figure presented.
* Revenue growth in local currencies, excluding acquisitions and divestments
A P RIL 2018 INV E S T OR P RE S E NT A T ION 56
