goal 4 reduce child mortality - statistics south africa€¦ · reduce child mortality ... progress...
TRANSCRIPT


1| Page
Contents
4.1 Targets and indicator ..................................................................................................... 2
4.2 Facts and figures ............................................................................................................ 2
4.3 Overview of child mortality: Global and Regional context .......................................... 3
4.4 Reducing child mortality in South Africa ..................................................................... 3
4.5 Life expectancy in South Africa .................................................................................... 7
4.6 Immunisation coverage ................................................................................................. 9
4.7 Diarrhoea and pneumonia incidence ........................................................................... 11
4.8 Prevention of Mother to Child Transmission (PMTCT) ............................................. 13
4.9 Key challenges to the achievement of the MDGs ....................................................... 14
4.10 Conclusion ................................................................................................................... 15
4.11 References ................................................................................................................... 16

2| Page
4.1 Targets and indicator Target 4A: Reduce by two-thirds between 1990 and 2015 the under-five mortality rate
Performance summary: Target will unlikely be achieved State of supportive environment: Strong
Standard MDG indicators 1. Under-five mortality rate 2. Infant mortality rate 3. Proportion of one-year-old children
immunised against measles Additional Indicators 4. Immunisation coverage of under one-
year olds 5. Life expectancy at birth 6. Diarrhoea incidence of children aged
under-5 years (per 1 000) 7. Pneumonia incidence of under 5 years
old (per 1 000)
4.2 Facts and figures REDUCE CHILD MORTALITY
Goal 4 Indicators
1994 baseline (or closest year)
Current status 2010 (or nearest year)
2015 target
Target achievability
Indicator type
Under-five mortality rate
59 (1998)
104 (2007) 20 Unlikely MDG
Infant mortality rate
54 (2001)
53 (2007)
18 Unlikely MDG
Proportion of 1 year-old children immunised against measles
68,5 (2001)
98,3 (2009) 100 Likely MDG
Immunisation coverage under 1 year of age
66,4 (2001)
95,3 (2009) 100 Likely Domestic
Life expectancy at birth for males and females
57,6 (2001)
64,8 (2001)
55,3 (2007)
60,4 (2007) 70 Unlikely Domestic
Diarrhoea incidence under 5 years of age (per 1 000)
138,0 (2001)
132,6 (2009) Domestic
Pneumonia incidence under 5 years of age (per 1 000)
21 (2003)
102,1 (2009) Domestic

3| Page
4.3 Overview of child mortality: Global and Regional context
The MDG 4 focuses on reducing mortality of under-fives years aged children. Reliable and timely estimates of childhood mortality are therefore needed to help countries monitor progress towards achieving the targets. In 2008; 8,8 million children who had been born alive across the world died before their fifth birthday. Most of these children lived in developing countries and died from a disease or a combination of diseases that could easily have been prevented or treated. Under-nutrition contributes to over a third of these deaths (UNICEF 2008).
Worldwide, substantial progress has been made towards the achievement of MDG 4. In 2008, 10 000 fewer children aged under five died every day than in 1990, the baseline year for the MDGs. Moreover, the rate of decline in under-five mortality increased for the period 2000 – 2008 compared with the 1990s (the average annual rate of decline for 2000 – 2008 is 2,3 % compared with 1,4 % for 1990 – 2000) (UNICEF 2008). It would appear that meaningful progress has been made in reducing the under-five mortality rate globally.
However, the rate of decline in under-five mortality is still grossly insufficient to reach the MDG goal by 2015, particularly in sub-Saharan Africa and South Asia. It is alarming that among the 67 countries with high mortality rates (40 per 1 000 or more), only 10 are on track to meet MDG 4.
Four diseases – pneumonia, diarrhoea, malaria and AIDS – accounted for 43 per cent of all deaths in children aged under-five years worldwide in 2008. Pneumonia and diarrhoea together account for a third of all under-five deaths. Most of these lives could have been saved through low-cost prevention and treatment measures, including antibiotics for acute respiratory infections, oral rehydration for diarrhoea, immunisation, and the use of insecticide-treated mosquito nets and appropriate drugs for malaria. The need to refocus attention on pneumonia and diarrhoea – two of the three leading killers of children – is urgent. The use of new tools, such as vaccines against pneumococcal pneumonia and rotaviral diarrhoea, could add momentum to the fight against these common diseases and provide an entry point for the revitalization of comprehensive programming. Ensuring proper nutrition is a critical aspect of prevention, since malnutrition increases the risk of death.
4.4 Reducing child mortality in South Africa
The internationally agreed quantitative target with regard to child mortality is to reduce by two thirds, between 1990 and 2015, the under-five mortality rate. The indicators for monitoring progress include under-five mortality rate, infant mortality rate, and proportion of one-year-old children immunised against measles. As a further means of monitoring progress in reducing mortality among children – a national population concern as expressed in South Africa’s population policy (Department of Welfare 1998) – additional indicators used in South Africa include prevalence of severe malnutrition amongst under-five year olds, prevalence of malnutrition amongst under –five year olds, immunisation coverage, life expectancy at birth, proportion of one-year old children fully immunised against pneumonia, pneumonia incidence in under-five year old children, diarrhoea incidence in the under-five year olds.

4| Page
Progress in the reduction of child mortality in South Africa using the above indicators will be presented.
Indicator: Under-five mortality rate
Under-five mortality rate is defined as the probability (expressed as a rate per 1 000 live births) of a child born in a specified year dying before reaching the age of five years subject to current age-specific mortality rates (United Nations 2003). The United Nations (2003) has noted that under-five mortality reflects the social, economic and environmental conditions, including healthcare, in which children (and others in society) live.
Values of under-five mortality (and infant mortality) rates are not available from Statistics South Africa although the organization has provided under-five and infant mortality ratios, which were computed from registered births and deaths without adjusting for under-registration. In view of this, other sources of under-five and infant mortality rates were used to assess progress in South Africa in reducing child mortality. Available evidence in this regard suggests that mortality in childhood has been rising in South Africa. In this regard, Udjo (2005), on the basis of his analysis of the survivorship reports in the 1996 census noted that ‘it appears that childhood mortality levels have increased in recent years across all population groups’ in South Africa. Reporting on the child mortality estimates for the period 1978 to 1996 derived from the pregnancy histories (1998 South Africa Demographic and Health Survey), the Department of Health (1999) noted ‘improvements in the level of child mortality until 1991’. The report on the 2003 South Africa Demographic and Health Survey also observed that ‘infant, child and under-five mortality have all increased over the 15-year period preceding the survey’ (Department of Health, Medical Research Council & ORC Macro, 2007). Furthermore, the results for the analysis of the 2001 Census and 2007 Community Survey ‘suggest moderate levels and rising (child) mortality…’ (Udjo 2008). Despite the rising trend in the mortality of children in recent years, current levels in absolute terms are lower compared to what they were in the 1980s and early 1990s.
Although, as already indicated, official figures are not available, other sources provide some indication of the magnitude of under-five mortality rates in South Africa as follows. The under-five mortality rate for females in 1996 was 84 deaths per 1 000 live births. It should be noted that the mortality data in the 1996 Census was problematic; hence under-five mortality was only estimated for the female population. According to the report on the 1998 South Africa Demographic and Health Survey, observed under-five mortality rates (not corrected for omission of deaths) were 59 per thousand live births during the period 1993 to mid-1998. However, note that since the estimate in the report was computed by direct methods it is probably an underestimate since omission of deaths is a common phenomenon in surveys (estimates based on indirect methods are higher). This notwithstanding, using the under-five mortality estimate from the 1998 South Africa Demographic and Health Survey as a benchmark, a reduction by two-thirds implies that South Africa’s under-five mortality is
expectedthe inter
Current Survey, and 104mortalitythousand
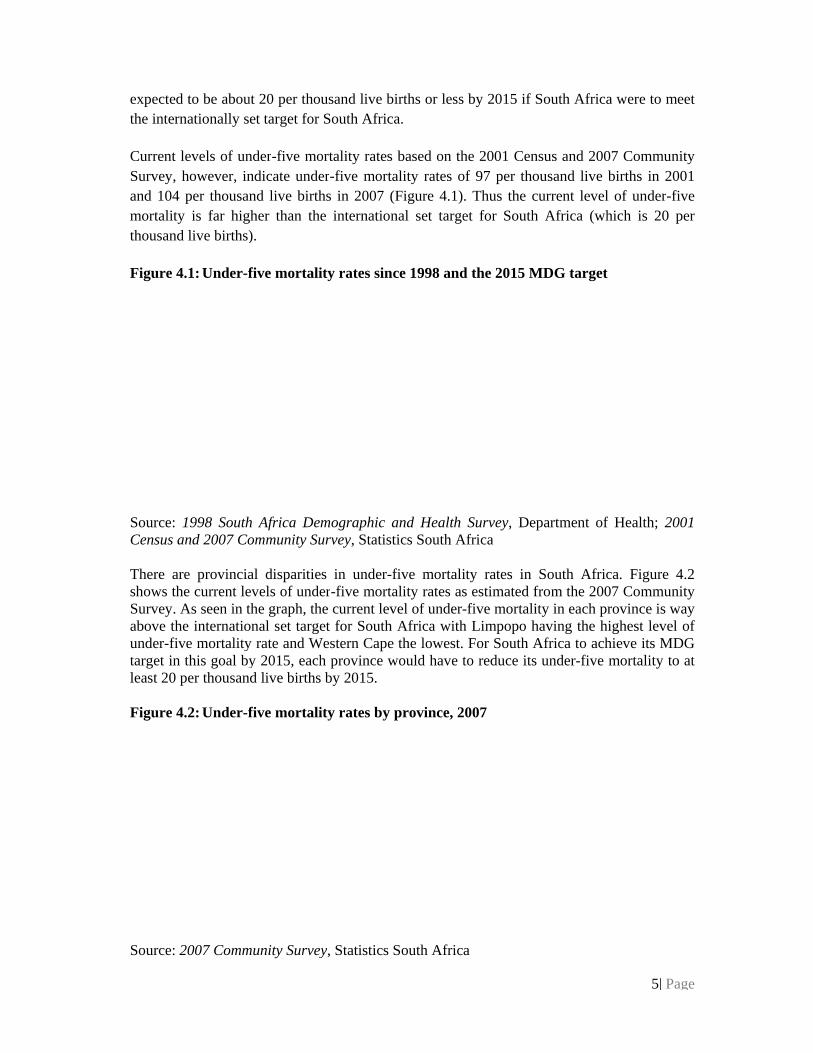
Figure 4 Source: Census a There ashows thSurvey. above thunder-fitarget inleast 20 Figure 4 Source:
d to be abournationally s
levels of unhowever, in
4 per thousany is far higd live births)
4.1: Under-f
1998 Southand 2007 Co
are provinciahe current leAs seen in t
he internatioive mortalityn this goal byper thousan
4.2: Under-f
2007 Comm
ut 20 per thoet target for
nder-five mondicate undend live birth
gher than the).
five mortali
h Africa Demommunity Su
al disparitieevels of undethe graph, thonal set targey rate and Wy 2015, each
nd live births
five mortali
munity Survey
usand live bSouth Afric
ortality rateser-five morths in 2007 (e internation
ity rates sin
mographic aurvey, Statist
es in under-er-five morta
he current levet for South
Western Capeh province ws by 2015.
ity rates by
y, Statistics
births or lessca.
s based on thality rates o(Figure 4.1)nal set targe
ce 1998 and
and Health tics South A
five mortaliality rates asvel of under- Africa with
e the lowest.would have t
province, 2
South Africa
by 2015 if
he 2001 Cenof 97 per tho. Thus the cet for South
d the 2015 M
Survey, DeAfrica
ity rates in s estimated f-five mortalih Limpopo h For South Ato reduce its
2007
a
South Africa
nsus and 200ousand live current levelh Africa (wh
MDG target
epartment of
South Africfrom the 200ity in each phaving the hAfrica to achs under-five
5| Pa
a were to me
07 Communbirths in 20l of under-fihich is 20 p
t
f Health; 20
ca. Figure 407 Communrovince is w
highest levelhieve its MDmortality to
age
eet
nity 001 ive per
001
4.2 nity way
of DG o at

Infant myear dyicurrent athe MDGfive moof mortaand fourthe firstrearing prate appfive mor
Figure 4
Source: As in uLimpopCape hainfant mmortalityunder-fidevelopreductio
mortality rateing before reage-specific Gs, it is usertality. In soality to overr years. Infant month of practices as
pears to havertality rate.
4.3: Levels o
2001 Censu
under-five mo having the
aving the lowmortality raty rates (Figive years’ mment goal in
on of infant m
In
e is more coreaching the a mortality raful to examiome developrall under-fivnt mortality life) and exwell as env
e remained m
of infant mo
us and 2007
mortality, thee highest in
west (44 per tes (Figure gure 4.2), wmortality raten reducing umortality in e
ndicator: In
rrectly definage of one yates. Althougine the levelping countrieve mortality is influence
xogenous facironmental fmore or less
ortality rate
Community
e levels of ifant mortalitthousand liv4.4) are co
we see that ie in each prunder-five yeach provinc
nfant mortal
ed as the proyear expressegh there is nl of infant mes, infant mrelative to m
ed by endogectors that infactors. As ss the same d
es 2001 and
Survey, Stat
infant mortaty rate (62 p
ve births) in ompared witinfant mortaovince in 20
year old morce in South A
lity rate
obability of es per thousano target set
mortality as itmortality cont
mortality beenous factornclude sociaseen in Figurdespite the u
2007
tistics South
ality rates vper thousand2007 (Figurth the valueality contribu007. Thus, trtality, thereAfrica.
a child bornand live birthfor infant mt is a compotributes a la
etween the as (congenita
al factors relre 4.3, the in
upward trend
Africa
ary in the pd live birthsre 4.4). Whenes of underuted at leasto achieve thalso has to
6| Pa
n in a particuhs if subject
mortality rateonent of undarge proportige of one ye
al conditionslation to chnfant mortald in the und
provinces ws) and Westen the values -five year ot 55 % of the millenniube substant
age
ular t to e in er-ion ear s in hild lity er-
with ern of old the um tial

Figure 4
Source:
4.5 Life
Any givbirth is mortalityHIV/AIDHIV/AIDlife expexaggerexpectancomponranking as a resu
Thus noFigure 4about 60about 65birth duwould ayears in
4.4: Levels o
2007 Comm
e expectancy
ven age in anthe number
y rate is a drDS in SouthDS using St
pectancy at ate the impncy at birth
nents used inof South Af
ult of the exa
otwithstandin4.5, female l0 years in 25 years, whiring the peri
appear that li2007.
of infant mo
munity Survey
y in South A
Ind
ny populatior of years ariver of life
h Africa, a sttatistics Soubirth provid
pact of AIDin South Af
n estimatingfrica in the Haggeration o
ng, life explife expectan
2007. The esich suggest iod 1996 – 2ife expectan
ortality rate
y, Statistics
Africa
dicator: Life
on has an asa person exexpectancy tudy examin
uth Africa’s ded by seveS on mortafrica (Udjo 2
g the HumanHuman Devef the impact
pectancy no ncy appears stimated levethat there w
2001 and it hncy at birth d
e in 2007 by
South Africa
e expectancy
ssociated lifexpects to liv
at birth. Whning recent scensus and eral organislity in Sout2008). Sincen Developmelopment Indt of AIDS on
doubt has to have dec
el of femalewas little or nhas declineddeclined from
y province
a
y at birth
e expectancyve after birthile not undestatistics on survey data,
sations (bothth Africa ane life expect
ment Index bdex is probabn mortality in
declined in clined from e life expectno improvem
d since 2001m about 61
y. Thus, life th in a popuermining themortality in , showed thah internationnd thus undtancy at birthby the Unitebly lower thn South Afri
South Afriabout 65 ye
tancy at birthment in life . Combiningyears in 200
7| Pa
expectancyulation. Infae magnitude the context
at estimates nal and locerestimate lh is one of td Nations, tan it should ica.
ica. As seenears in 2001 h in 1996 wexpectancy
g both sexes01 to about
age
y at ant of of of
cal) life the the be
n I to
was y at , it 58

Figure 4
Source:
ConsisteLimpop
Figure 4
Source:
4.5: Life exp
Census 200
ent with theo has the low
4.6: Life exp
Community
pectancy at
1 and Comm
e provinciawest life exp
pectancy at
y Survey 200
birth 2001
munity Surve
l pattern ofpectancy at b
birth in 200
7, Statistics
and 2007
ey 2007, Stat
f infant mobirth and We
07 by provin
South Afric
tistics South
ortality ratesestern Cape,
nce
a
Africa
s, Figure 4the highest.
WeEaNoFreKwNoGaMpLim
8| Pa
.6 shows th
estern Capeastern Capeorthern Capeee State
waZulu-Natalorth West autengpumalangampopo
age
hat
WCECNCFS
KZNNWGPMPLP

4.6 Imm
Immunirates. Thone-yearchildrencough, tthe obse(2006-2as well a
Immuniindicatein SouthvaccinesTable 4Departm
Figure 4
Source: D
munisation c
sation is ashe two MDGr-old childre
n who receivtetanus, polierved propor009) are cauas across bou
sation coves that immuh Africa as s compared
4.1 also shoment of Heal
4.7: Proport
District Healt
coverage
Ind
sociated witG indicators en immunise
ved all their o, measles, hrtions of aboused by an uundary imm
rage againsunisation aga68,5 % of cto 98,3 %
ows a similath).
tion of one-y
th Informatio
dicator: Life
th child surthat are eva
ed against mprimary vachepatitis B aove 100 % iunderestimat
munisation.
st measles iainst measlechildren ageof children ar incremen
year-old ch
n System (DH
e expectancy
rvival and haluated in thmeasles and ccines for tuband haemophin the Westetion of the t
is almost uns has increa
ed under oneof the same
ntal pattern
hildren imm
HIS), Departm
y at birth
hence infanthis section ar
the proportberculosis (Thilis influenern Cape (20target popula
niversal in sed over thee year in 20e age in 200(District He
unised agai
ment of Health
t and under-re: the propotion of undeTB), diphthe
nza. It should007-2009) aation aged u
South Africe years from001 received09. The provealth inform
inst measles
h
9| Pa
-five mortalortion of under one-year-oeria, whoopid be noted thand in Gauteunder one-ye
ca. Figure 4m 2001 to 20d their measvincial data
mation Syste
s, 2001-2009
age
lity der old ing hat eng ear
4.7 009 les in
em,
9

Table 4
Source:
Figure 4proportituberculhaemophprimary Informa
Figure 4vacc
Source: D
1 Tuberculo
ProvincWesternEastern NorthernFree StaKwaZulNorth WGautengMpumalLimpop
.1: Proport
District Hea
Indicato
4.8 and Tabion of childlosis, diphthilis influen vaccines i
ation System
4.8: Proportcines1
District Healt
osis, diphtheria,
ce 2n Cape 7Cape 7n Cape 7
ate 6lu-Natal 6
West 7g 6langa 6o 7
tion of one-y
alth Informa
or: Immuni
le 4.2 furthedren aged untheria, whonza in Soutincreased fr
m, Departmen
tion of unde
th Informatio
whooping coug
2001 200273,6 75,673,0 75,271,7 72,169,5 69,963,0 64,476,0 69,964,9 67,363,3 64,173,8 79,6
year-old ch
ation Health
isation cove
ermore suggnder one yeoping cougth Africa frrom 66,4 %nt of Health)
er one-year-
n System (DH
gh, tetanus, polio
2 2003 6 77,2 2 76,4
74,8 9 69,5 4 64,4 9 69,1 3 71,2
66,5 6 78,5
hildren imm
System (DH
erage of infa
gest that theear who recgh, tetanus,rom 2001 to
% in 2001 t).
-old childre
HIS), Departm
o, measles, hepat
2004 79,5 73,4 77,2 71,9 64,4 68,1 75,9 70,3 77,4
unised agai
HIS), Departm
ants aged un
ere has beenceived all th, polio, mo 2009. Thto 95,3 %
en who recei
ment of Health
titis and haemop
Year
2005 20085,7 9680,1 7982,3 8979,3 8069,0 8175,1 7192,6 10379,1 8382,2 90
inst measles
ment of Hea
nder one ye
n a marked iheir primary
measles, hephe immunisa
in 2009 (D
ived all prim
h
hilis influenza
06 2007 ,1 102,1 ,0 75,7 ,4 92,7 ,3 78,9 ,2 83,4 ,6 73,4
3,1 107,1 ,6 90,1 ,0 83,8
10| Pa
s, by provin
alth
ar
increase in ty vaccines fpatitis B aation rates fDistrict Hea
mary
2008 104,5 82,6 93,2 84,0 85,9 91,7
114,0 90,3 92,1
age
ce
the for
and for
alth
2009 106,7 92,1 97,0 87,9 87,4 88,1
119,1 96,6
102,4

Table 4prov
ProvincWesternEastern CNorthernFree StaKwaZuluNorth WGautengMpumalLimpopo
Source:
4.7 Diar
In
Accordihealth pdeath, pchildrenconditio
Figure 4
Source:
.2: Proportvince
ce 20n Cape 71Cape 65n Cape 70
ate 68u-Natal 62
West 73g 64langa 62o 72: District He
rrhoea and
ndicator: Di
ing to Blackproblems in articularly in
n in developioned by their
4.9: Inciden
District Hea
tion of one-y
001 2002 1,1 73,3 5,0 66,3 0,0 69,7 8,3 68,8 2,6 62,6 3,7 66,0 4,3 66,5 2,2 62,5 2,2 78,9 ealth Informa
pneumonia
iarrhoea inc
k (1984), dithe world a
n children ining countrier social, econ
nce of diarrh
alth Informa
year-old ch
2003 75,9 71,7 72,9 68,1 62,8 65,1 70,4 65,5 77,4
ation System
a incidence
cidence for
iarrhoeal disand have ben developinges exposure anomic and en
hoea among
ation System
hildren who
2004 78,4 70,9 76,1 70,7 61,9 66,5 75,2 68,8 76,4
m (DHIS), De
under-5 yea
seases remaeen found tog countries. Band responsnvironmenta
g children ag
(DHIS), De
received all
Year 2005 2084,4 9575,8 7681,3 8778,2 7966,5 7772,4 6991,8 1077,2 8181,2 88
epartment of
ars of age ch
ain one of tho be major cBlack (1984e to diseaseal milieu.
ged under-5
partment of
l primary v
006 20075,3 99,86,5 78,27,8 91,19,5 78,17,3 77,99,6 74,0
01,1 105,51,3 87,78,6 82,1f Health
hildren (per
he most imcontributors 4) further nots, including
5 years, 200
Health
11| Pa
accines, by
7 2008 8 100,9 2 80,3 1 91,6 1 83,1 9 82,1 0 93,0 5 112,6 7 86,2 1 90,7
r 1 000)
mportant pubto illness a
tes that amodiarrhoea, a
01-2009
age
2009 104,2 88,3 97,6 86,7 85,7 85,8 115,7 90,8 98,3
blic and ong are

Table 42001
Source:
Figure incidencSouth Abeen fluincidencwere hiprovincedeclinin
Figure 4
Source:
ProvinceWestern Eastern CNorthernFree StatKwaZuluNorth WGauteng MpumalaLimpopo
.3: Inciden1-2009
District Hea
4.9 and Tace of diarrho
Africa. It is ouctuating since of diarrhoighest in Lie. However
ng trend from
Indicator
4.10: Incid
District Hea
e 20Cape 83
Cape 14n Cape 22te 78u-Natal 20
West 210
anga 12o 21
nce of diarrh
alth Informa
able 4.3 depoea among observed thance 2001. Eoea in Southimpopo pro, the incide
m 2008 to 20
r: Pneumon
dence of pne
alth Informa
001 2002 3,2 89,0 2,3 104,3 9,2 151,2
8,1 72,3 6,2 191,5 3,6 156,2 ,9 0,9 9,8 123,5 0,0 163,8
hoea among
ation System
pict the natchildren ageat the incideEvidently, Kh Africa as ovince. The
ence rates a009.
nia incidenc
eumonia am
ation System
2003 276,4 8
106,6 8156,3 182,0 7
197,3 2129,5 110,7 383,0 1
152,0 1
g children ag
(DHIS), De
tional and ped under-5 yence of diarrKwaZulu-Naof 2002 up incidence o
appeared to
e in under-5
mong childre
(DHIS), De
Yea2004 200589,9 90,486,9 92,2
161,1 166,978,7 79,4
212,7 191,119,0 115,638,0 41,7
114,0 119,3164,5 166,7
ged under-5
partment of
provincial dyears for thrhoea in Souatal appears until 2009. of diarrhoea
have either
5 years of a
en aged und
partment of
ar 5 2006 4 104,7 2 87,5 9 191,7 4 76,3 1 210,7 6 118,2 7 63,1 3 108,7 7 196,5
5 years, by p
Health
data, respeche period 20uth Africa ato have ha
Thereafter, a was lower stagnated
ge children
der-5 years,
Health
2007 200117,0 14184,8 116
171,7 16871,5 83
206,8 203114,2 11658,9 6299,0 97
193,1 203
12| Pa
province,
tively, on t001 to 2009 as a whole had the highthe incidencst in Gauteor adopted
(per 1 000)
, 2003-2009
08 20091,2 140,06,3 108,88,0 160,7,0 69,6
3,6 204,46,3 110,8,5 61,1,1 81,9
3,7 203,7
age
the in
has est ces eng d a
)

13| Page
Data on the incidence of pneumonia among under-five years old children in South Africa for the period 2001 to 2009 is shown in Figure 4.10 and Table 4.4. As evidenced from the data illustrated in Figure 4.10, the incidence of pneumonia among under-five years old children in South Africa increased from 21,0 to 102,1 per 1 000 children aged under five years. Notably the wide provincial variations in the incidence of pneumonia that existed between 2004 and 2007 started to disappear between 2007 and 2009. While both the Eastern and Northern Cape have shown a slight decrease in the incidence of pneumonia among children aged under-five years between 2008 and 2009, the rest of the provinces have continued to show an increase in the number of incidences.
Table 4.4: Incidence of pneumonia among children aged under-five years, by province, 2001-2009
Source: District Health Information Health System (DHIS), Department of Health 4.8 Prevention of Mother to Child Transmission (PMTCT) The Polymerase Chain Reaction (PCR) is a major scientific advance for the diagnosis of HIV and AIDS. The data in Table 4.5 depicts the estimated number of HIV-exposed children, the proportion tested for PCR and the proportion found to be HIV positive. The proportion of HIV positive babies in the first quarter of 2008/2009 was 15,2 % compared to 9,4 % in the fourth quarter of 2009/2010. The proportion of HIV-infected babies in South Africa could be declining most likely due to the success of the prevention of mother-to-child transmission of HIV (PMTCT) programme. Table 4.6 presents data on the proportion of HIV positive women, at public primary health care facilities, receiving antiretroviral medicines to reduce the risk of mother to child transmission of HIV in 2008 and 2009 in South Africa. The data indicates that the prevention of mother to child transmission of HIV in South Africa is high in the public primary health facilities. Furthermore, South Africa achieved the National Strategic Plan for HIV and AIDS and Sexually Transmitted Infections (STIs) 2007-2011 (NSP) target of >95 % coverage in the public sector antenatal service sites in 2008. A dual therapy regimen of Nevirapine and AZT was further adopted in 2008, with additional improvements in the programme to be implemented during 2010. The dual therapy regimen has also led to the reduction of mother to child HIV transmission rates (Department of Health, 2010)
Province Year
2003 2004 2005 2006 2007 2008 2009 Western Cape 0,0 0,0 0,0 65,1 95,1 86,5 89,4 Eastern Cape 0,2 6,5 11,4 13,4 38,7 69,4 68,2 Northern Cape 0,0 4,3 91,8 153,7 126,7 118,3 116,6 Free State 102,4 130,7 142,0 122,2 112,1 107,7 110,9 KwaZulu-Natal 17,2 99,9 117,6 159,4 159,1 163,1 184,7 North West 7,2 33,8 67,3 79,0 90,4 98,9 115,3 Gauteng 9,5 34,5 36,2 57,7 52,2 57,3 61,8 Mpumalanga 68,7 74,8 74,3 62,8 53,6 58,0 60,6 Limpopo 26,3 57,2 55,3 63,1 61,9 62,3 67,0

14| Page
Table 4.5: Polymerase chain reaction (PCR) tests for diagnosis of HIV among children under 18 moths of age
2008/2009 2009/2010 1ST
quarter 2nd
quarter 3rd
quarter 4th
quarter 1ST
quarter 2nd
quarter 3rd
quarter 4th
quarterEstimated number of HIV-exposed infants 66872 66872 66872 66872 66872 66872 66872 66872 Percentage of PCR tests conducted 78,4 87,0 77,8 91,4 91,6 96,0 93,9 103,4 Percentage of HIV positive babies 15,2 13,7 13,5 11,9 9,8 9,7 10,0 9,4 Source: District Health Information System (DHIS) & National Health Laboratory Services, Department of Health
Table 4.6: Proportion of HIV positive pregnant women receiving antiretroviral medicines to reduce the risk of mother to child transmission of HIV at public primary healthcare facilities
Source: District Health Information System (DHIS), Department of Health, South Africa
4.9 Key challenges to the achievement of the MDGs
The key challenges in the achievement of the MDGs (including the under-five mortality rate) are the improvement of the environment that children are brought up in; such as water quality, nutrition, sanitation and household food security. The key challenges in reducing under-5 years olds’ morbidity and mortality lie in combating the main causes of deaths among children; which are: diarrhoea, lower respiratory tract infections, perinatal deaths associated with TB, HIV and AIDS, and malnutrition (Department of Health, 2009). South Africa will have to strengthen primary healthcare, as many children die at home but after having had some contact with the healthcare system.
Strenghtening the healthcare system to prevent mother to child transmission of HIV as well as the provision of life-long nutrition and antiretroviral therapy are key to reducing many deaths among children. Primary Health Care (PHC) must be strengthened to address the implementation of the Integrated Management of Childhood Illness amongst others. The use of the Road to Health Chart and improved primary health care providers (private practitioners) must be improved. The improvement of immunisation coverage will prevent many unnecessary deaths (Department of Health, 2009).
The District Health Information System (DHIS) must be supported to continue collecting data in healthcare facilities that are conducting births, as well as in its endeavours to improve the quality of data collected (Department of Health, 2008).
2008 2009 Percentage 86 83

15| Page
4.10 Conclusion
Using the under-five mortality estimates from the 1998 South Africa Demographic and Health Survey as a benchmark, the internationally set target for South Africa in the reduction of under-five mortality implies a value of 20 per thousand live births or less by 2015. Although South Africa has the necessary policies in place to reduce under-five mortality, available evidence suggests a rising trend in child mortality in recent years in South Africa. This report shows substantial progress has been made in South Africa in the prevention of malnutrition, mother to child transmission of HIV and immunisation coverage and access to free healthcare facilities. However, current levels of under-five mortality in the country are still far higher than the set target for South Africa of 20 deaths per thousand live births or lower by 2015.

16| Page
4.11 References Beltman JJ, Stekelenburg J & van Roosemalen J. 2010. Crisis in Human Resources for Health: Millennium Development Goals for Maternal and Child Health Threatened. Nederlands Tijdschrift Voor Geneeskunde, 154(5):A1159.
Black RE. 1984. Diarrhoeal diseases and child morbidity and mortality. Population and Development Review, Supplement to Vol. 10, pp. 141-161. Bryce J, Gilroy K, Jones G, Hazel E, Black RE & Victora CG. 2010. The Accelerated Child Survival and Development Programme in West Africa: a Retrospective Evaluation. Lancet. Feb 13;375(9714):572-82. Department of Health, Medical Research Council & ORC Macro. 1999. South Africa Demographic and Health Survey, 1998. Pretoria: Department of Health. Department of Health, Medical Research Council & ORC Macro. 2007. South Africa Demographic and Health Survey 2003. Pretoria: Department of Health. Department of Health. 2008. Report of the National Perinatal Morbidity and Mortality Committee, 2008. Pretoria: Department of Health. Department of Health. 2009. First Report of the Committee on Morbidity and Mortality in Children under-5 years (CoMMIC). Pretoria: Department of Health. Department of Health. 2010. Country Progress Report on the Declaration of Commitment on HIV/AIDS. Pretoria: Department of Health. Department of Welfare. 1998. Population Policy for South Africa. Ministry for Welfare and Population Development, Pretoria. Human Sciences Research Council. 2007. Proposal on Indicators for monitoring and evaluating the implementation of the children’s ACT in South Africa. HSRC. Monograph. Mosley WH & Chen LC. 1984. An Analytical framework for the study of child survival in developing countries. Population and Development Review, Supplement to Vol. 10, pp. 25-45. Partnership for Maternal, Newborn and Child Health. 2009. Consensus for Maternal, Newborn and Child Health. Nov (1). Programme for Appropriate Technology in Health (PATH). 2009. Diarrhoeal Disease: Solutions to Defeat a Global Killer. Washington, D.C., PATH. OECD. 1998. Core set of indicators of development progress. DCD/DAC(98)6. OECD. 2000. Indicators for the international development goals: a suggestion for some qualitative indicators. DCD(2000)7. South Africa. 2005. Millennium Development Goals Country Report.

17| Page
Udjo EO. 2005. An examination of recent census and survey data on mortality within the context of HIV/AIDS. In: Zuberi T, Sibanda A, Udjo E. (Eds). The demography of South Africa. New York, ME Sharpe; pp. 90-119. Udjo EO. 2008. A re-look at recent statistics on mortality in the context of HIV/AIDS with particular reference to South Africa. Current HIV Research, vol 6, pp143-151. Udjo E. O., Simelane S., & Booysen D. 2000a. Socio-economic indicators of development progress within the OECD framework in South Africa. Paper presented at the Millennium Conference of Commonwealth Statisticians, Gaborone, Botswana, 1-5 May. Udjo E. O., Orkin M., & Simelane S. 2000b. Levels of social indicators in South Africa in relation to international goals of development. Paper presented at the Forum 2000 Seminar on Statistics for Social Progress, Geneva, Switzerland, 27 June. UNICEF. (2008) UNICEF, The State of the World’s Children Special Edition: Celebrating 20 Years of the Convention on the Rights of the Child United Nations, 2003. Indicators for monitoring the millennium development goals. United Nations, New York. United Nations Development Programme. 2005. South Africa Millennium Development Goals Country Report. United Nations Development Programme. 2010. MDGs in South Africa. http://www.undp.org.za/mdgs-in-south-africa WHO Statistical Information System (WHOSIS), available at: http://www.who.int/whosis/en/ and WHO, World Health Statistics. 2009. Available at: http://www.who.int/whosis/whostat/2009/en/index.html