gm events & presentations canadian dealer conference
DESCRIPTION
TRANSCRIPT
Forward Looking StatementsIn this presentation and in related comments by our management, our use of the words “expect,” “anticipate,” “estimate,” “goal,” “target,” “believe,” “improve,” “intend,” “potential,” “continue,” “designed,” “opportunity,” “risk,” “may,” “would,” “could,” “should,” “project,” “projected,” “positioned” or similar expressions is intended to identify forward-looking statements that represent our current judgment about possible future events. We believe these judgments are reasonable, but these statements are not guarantees of any events or financial results, and our actual results may differ materially due to a variety of important factors. The most recent reports on SEC Forms 10-K, 10-Q and 8-K filed by us or GMAC provide information about these and other factors, which may be revised or supplemented in future reports to the SEC on those forms.
Industry and market data contained in this presentation is based on internal GM market and industry analysis. Although management believes this data is reliable as of its respective dates, this data has not been independently verified and we cannot assure you as to accuracy or completeness of this data.
Unless specifically required by law, we assume no obligation to update or revise these forward-looking statements to reflect new events or circumstances.
Ray G. YoungExecutive Vice President & CFO
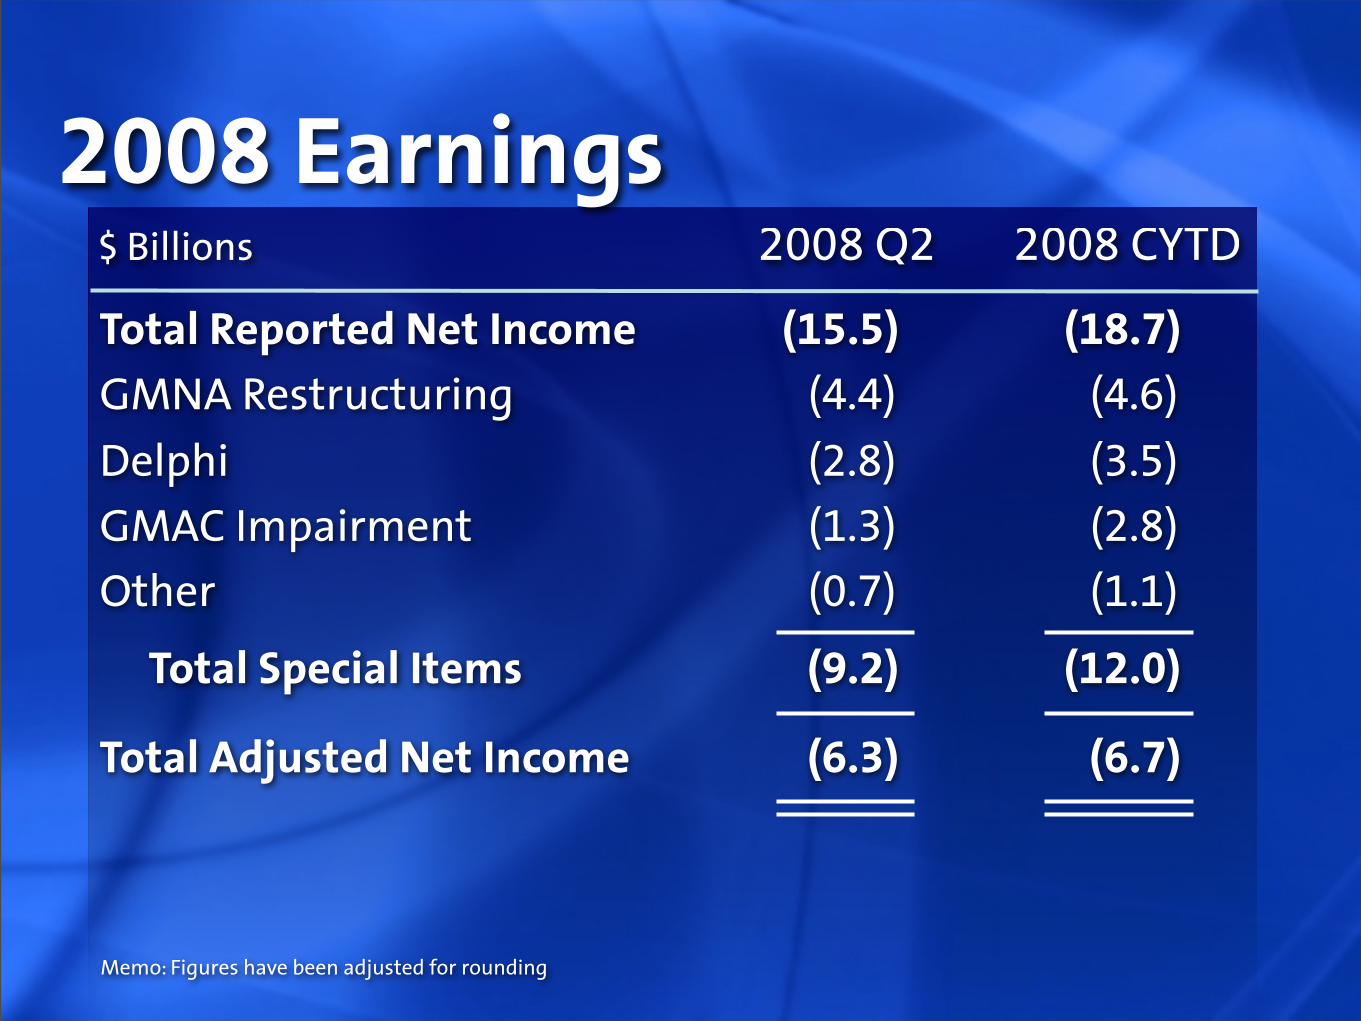
2008 Earnings$ Billions 2008 Q2 2008 CYTD
Total Reported Net Income (15.5) (18.7)GMNA Restructuring (4.4) (4.6)
Delphi (2.8) (3.5)GMAC Impairment (1.3) (2.8)Other (0.7) (1.1)
Total Special Items (9.2) (12.0)
Total Adjusted Net Income (6.3) (6.7)
Memo: Figures have been adjusted for rounding
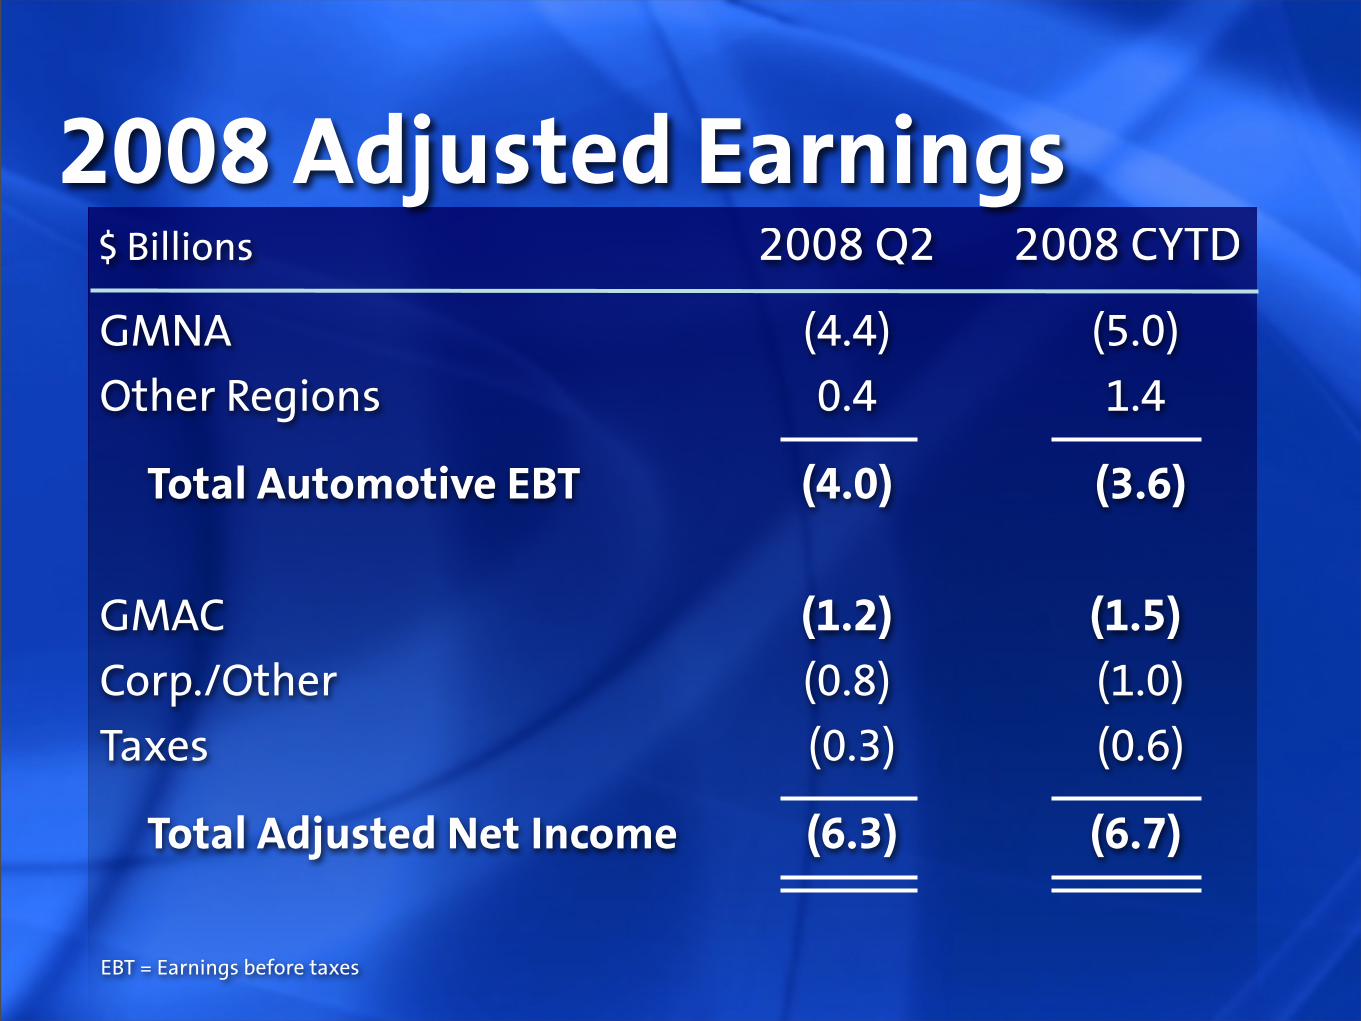
GMNA (4.4) (5.0)Other Regions 0.4 1.4
Total Automotive EBT (4.0) (3.6)
GMAC (1.2) (1.5)Corp./Other (0.8) (1.0)Taxes (0.3) (0.6)
Total Adjusted Net Income (6.3) (6.7)
2008 Adjusted Earnings
EBT = Earnings before taxes
$ Billions 2008 Q2 2008 CYTD
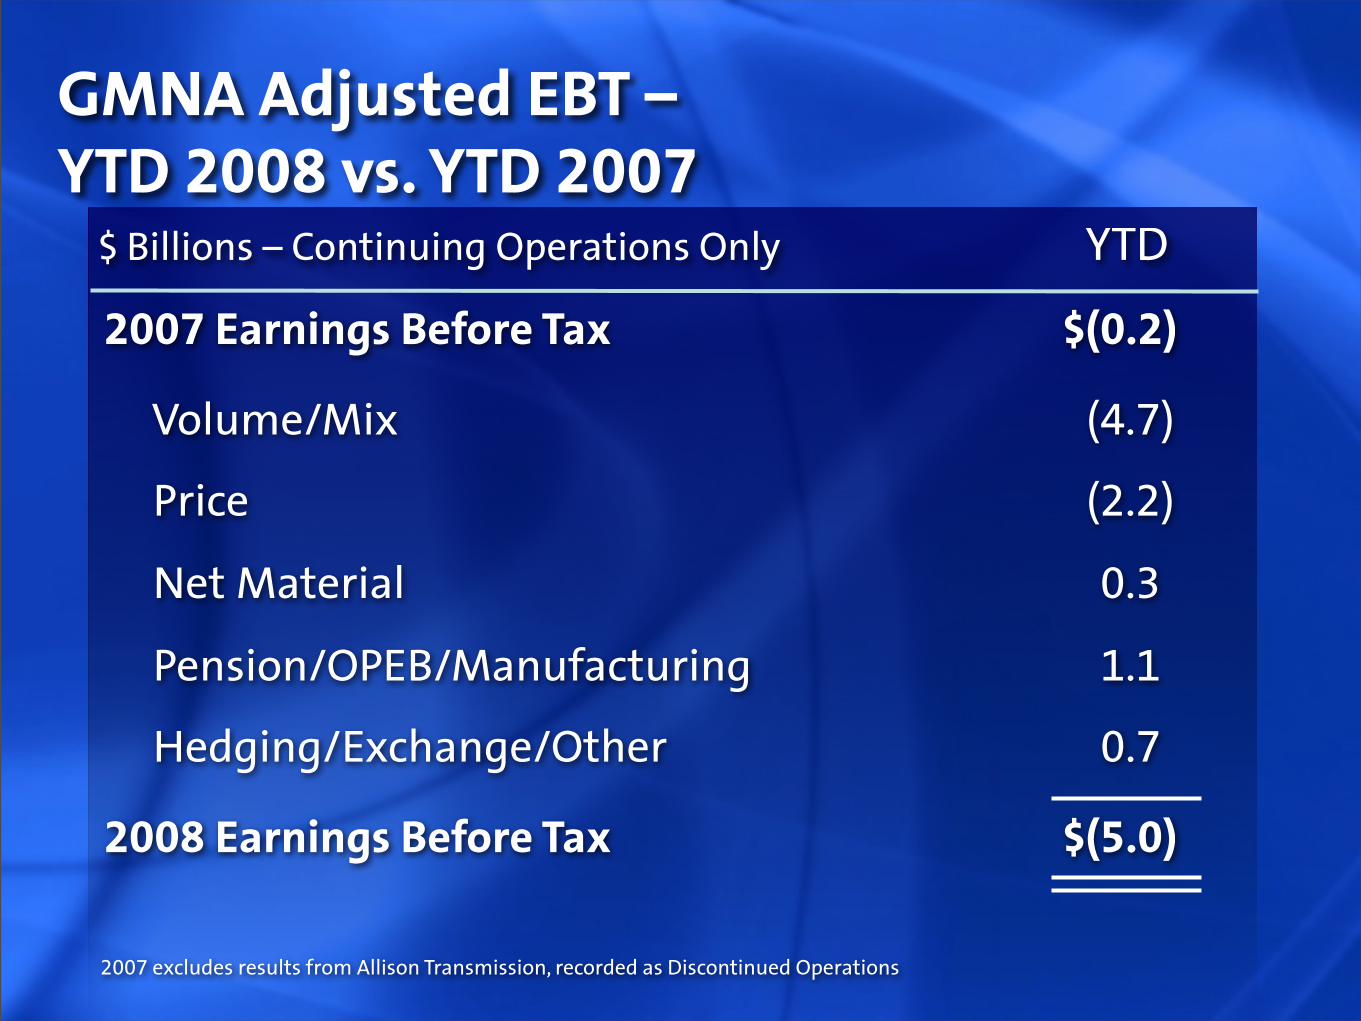
2007 Earnings Before Tax $(0.2)
Volume/Mix (4.7)
Price (2.2)
Net Material 0.3
Pension/OPEB/Manufacturing 1.1
Hedging/Exchange/Other 0.7
2008 Earnings Before Tax $(5.0)
GMNA Adjusted EBT –YTD 2008 vs. YTD 2007
2007 excludes results from Allison Transmission, recorded as Discontinued Operations
$ Billions – Continuing Operations Only YTD
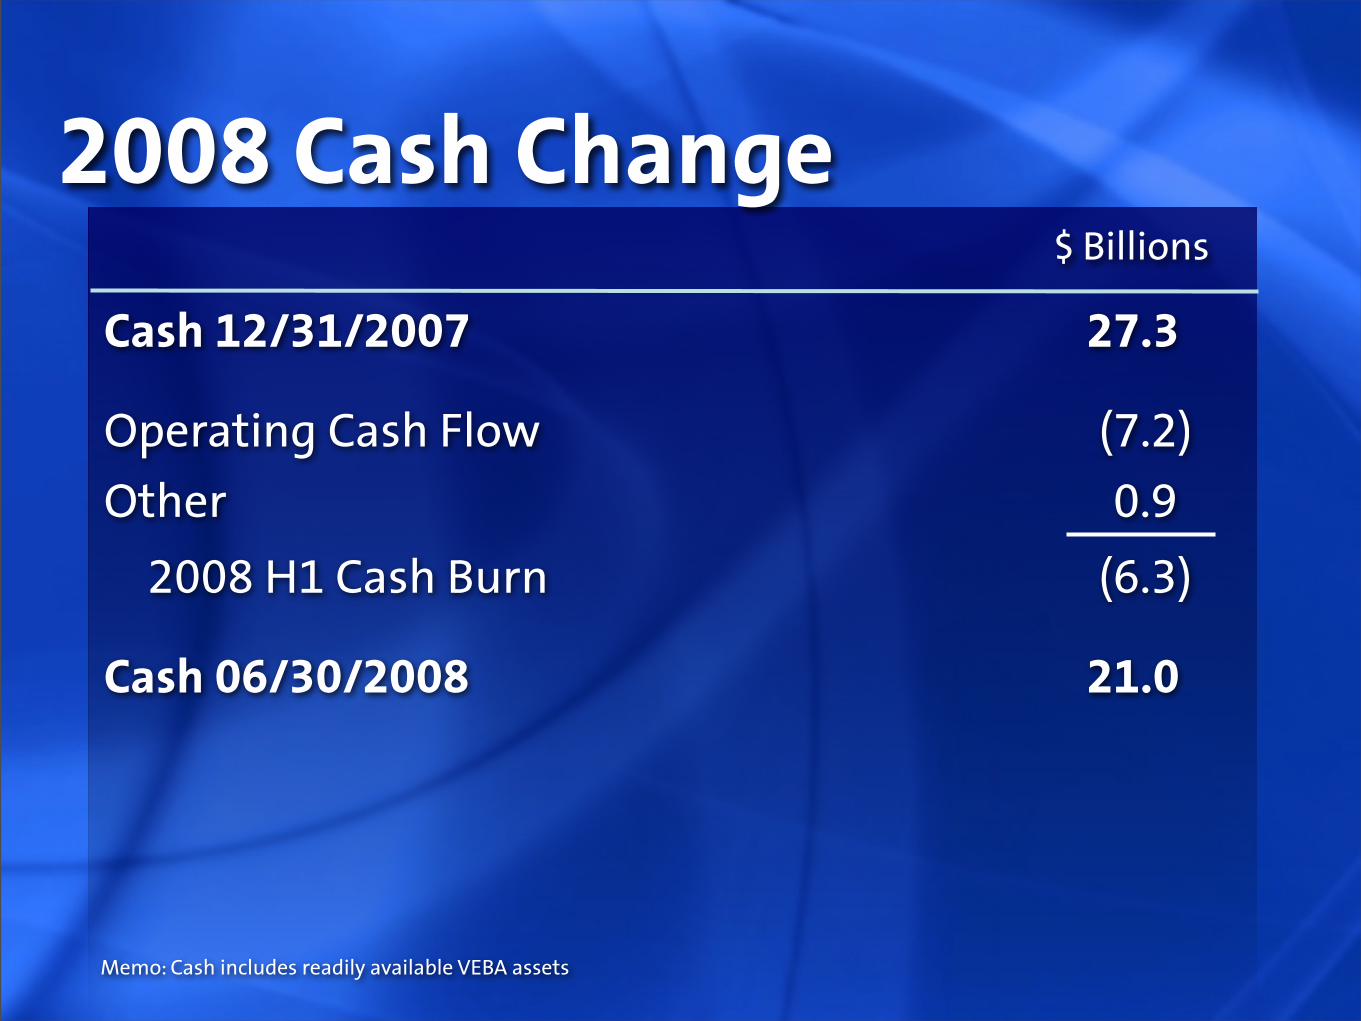
2008 Cash Change
Cash 12/31/2007 27.3
Operating Cash Flow (7.2)
Other 0.9
2008 H1 Cash Burn (6.3)
Cash 06/30/2008 21.0
$ Billions
Memo: Cash includes readily available VEBA assets

What Happened?
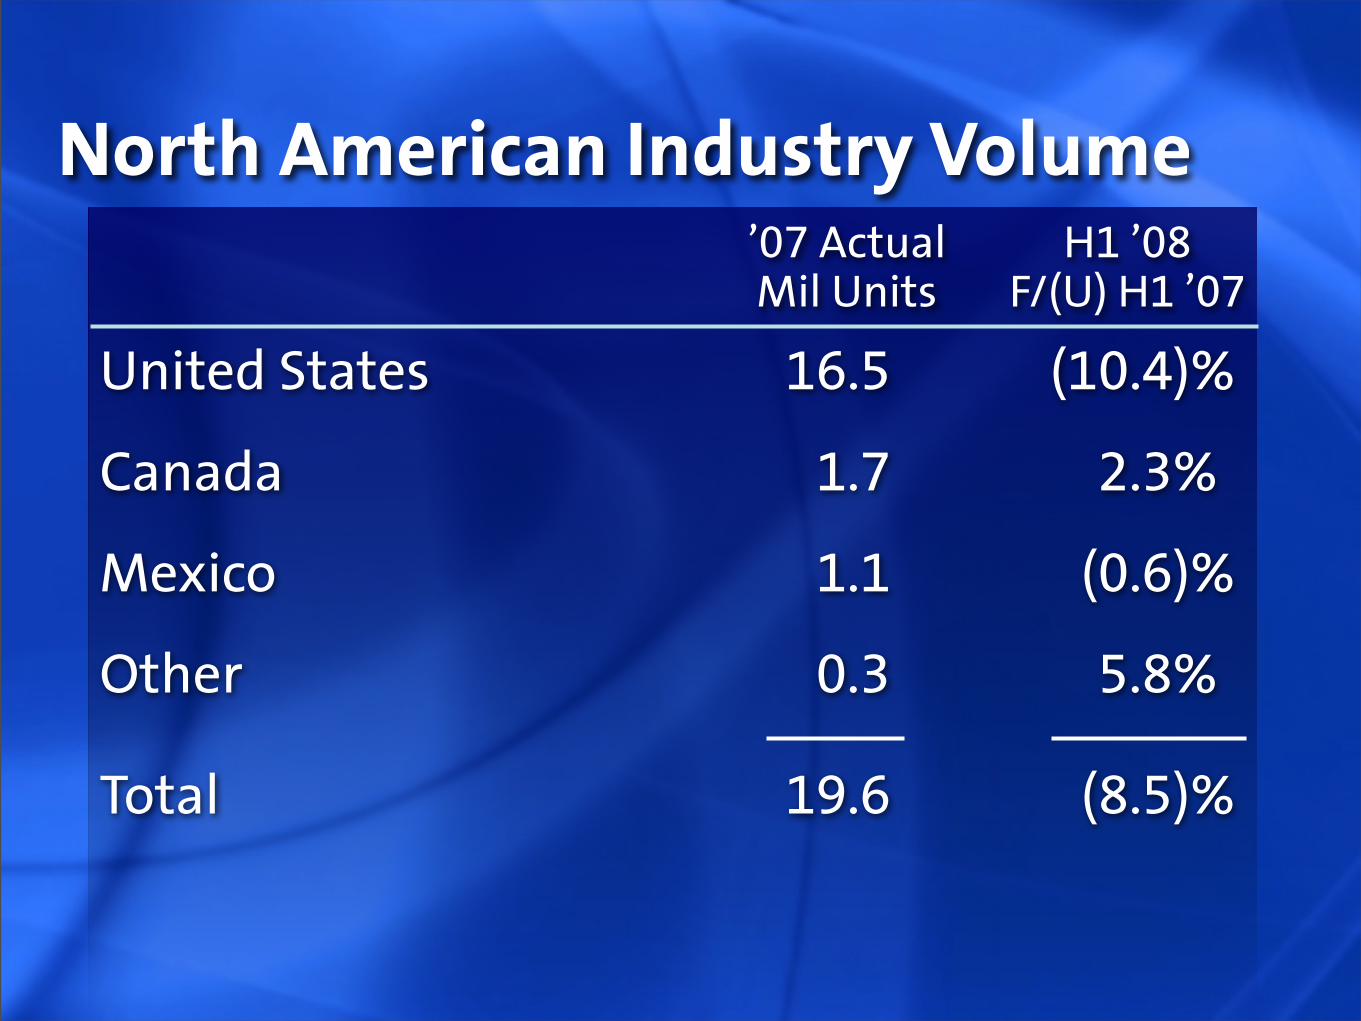
North American Industry Volume ’07 Actual H1 ’08 Mil Units F/(U) H1 ’07
United States 16.5 (10.4)%
Canada 1.7 2.3%
Mexico 1.1 (0.6)%
Other 0.3 5.8%
Total 19.6 (8.5)%
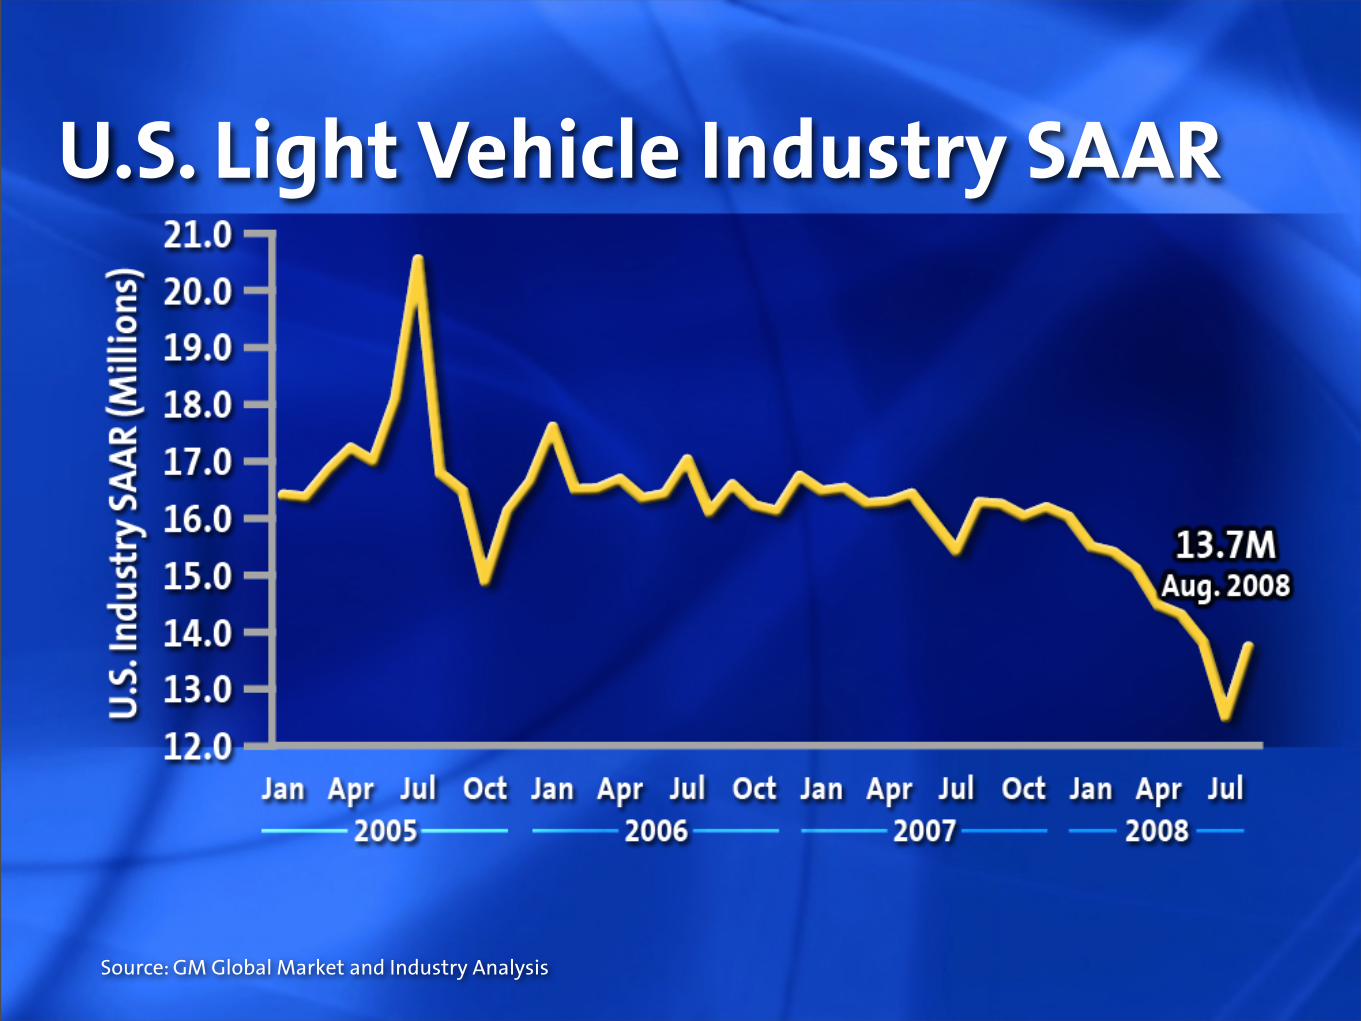
U.S. Light Vehicle Industry SAAR
Source: GM Global Market and Industry Analysis
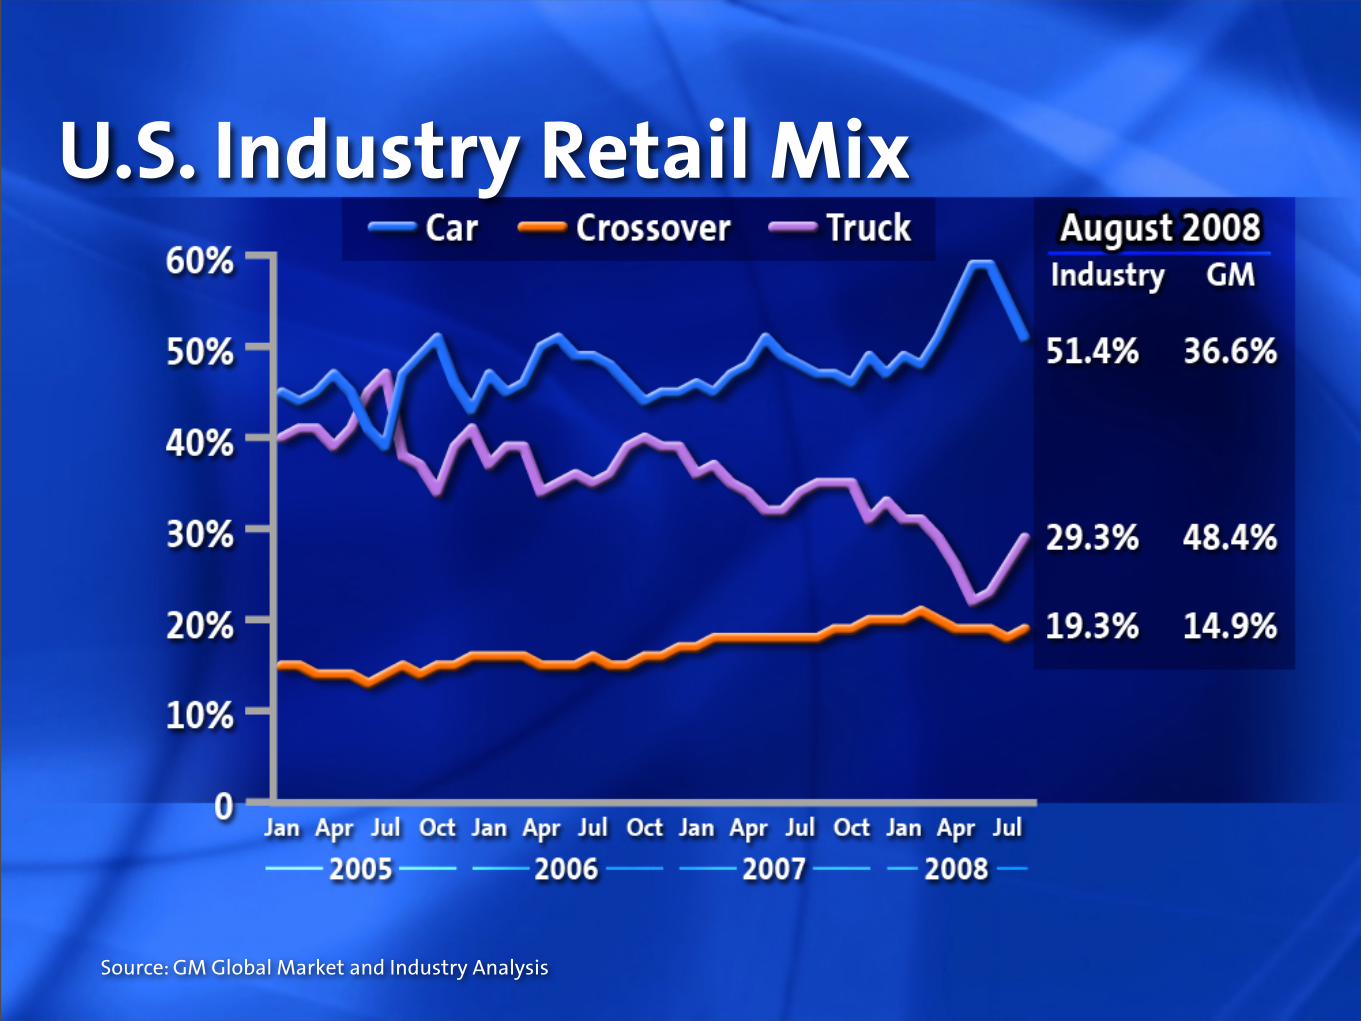
U.S. Industry Retail Mix
Source: GM Global Market and Industry Analysis

What Are We Doing?
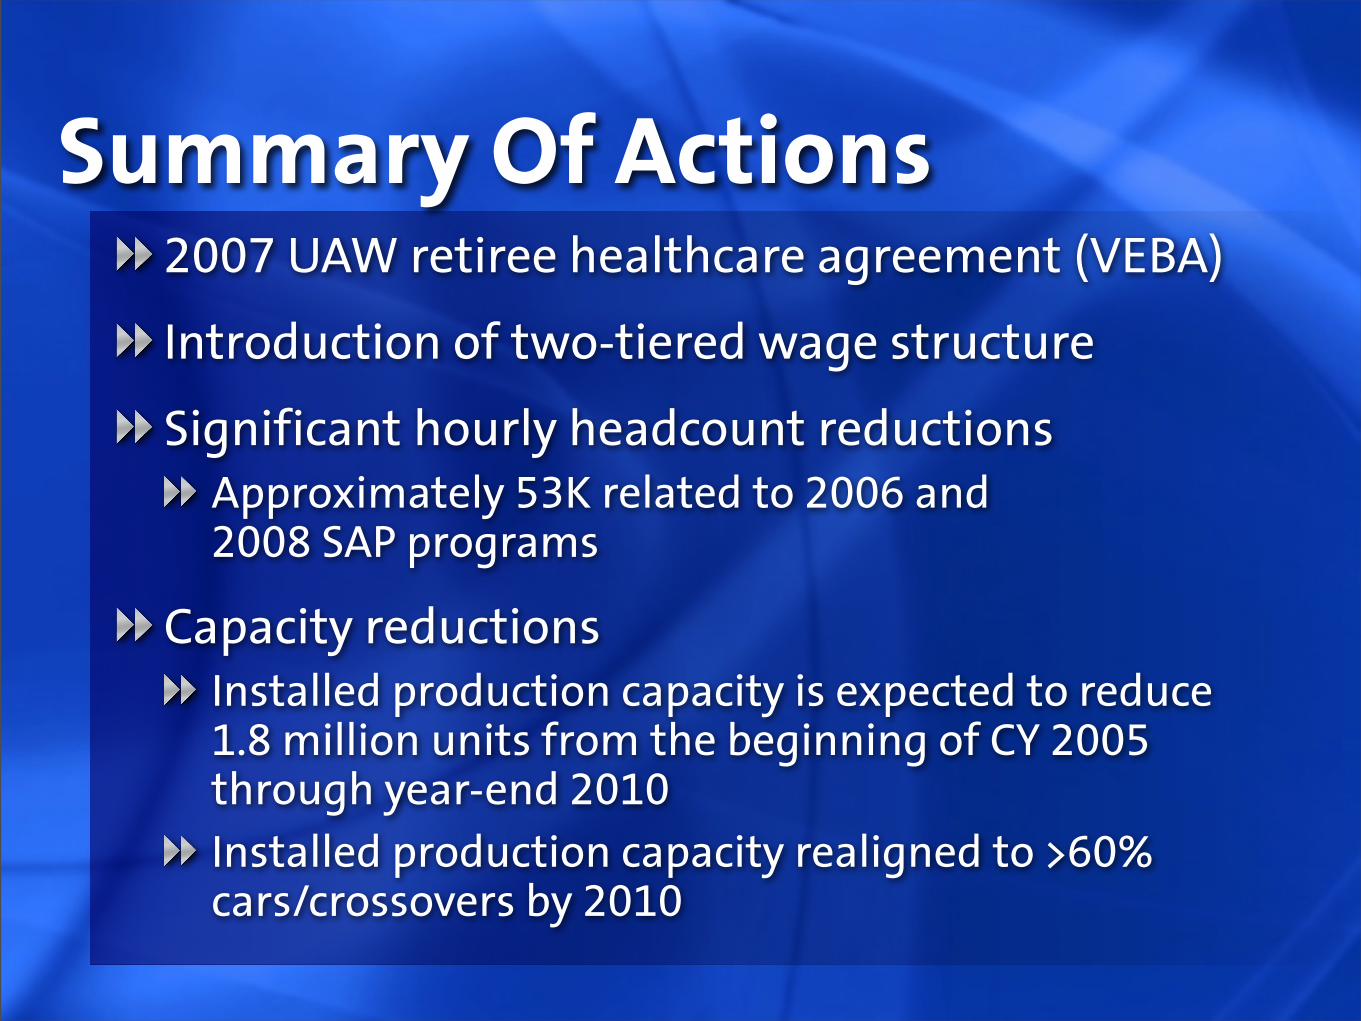
Summary Of Actions2007 UAW retiree healthcare agreement (VEBA)
Introduction of two-tiered wage structure
Significant hourly headcount reductionsApproximately 53K related to 2006 and2008 SAP programs
Capacity reductionsInstalled production capacity is expected to reduce1.8 million units from the beginning of CY 2005 through year-end 2010Installed production capacity realigned to >60% cars/crossovers by 2010
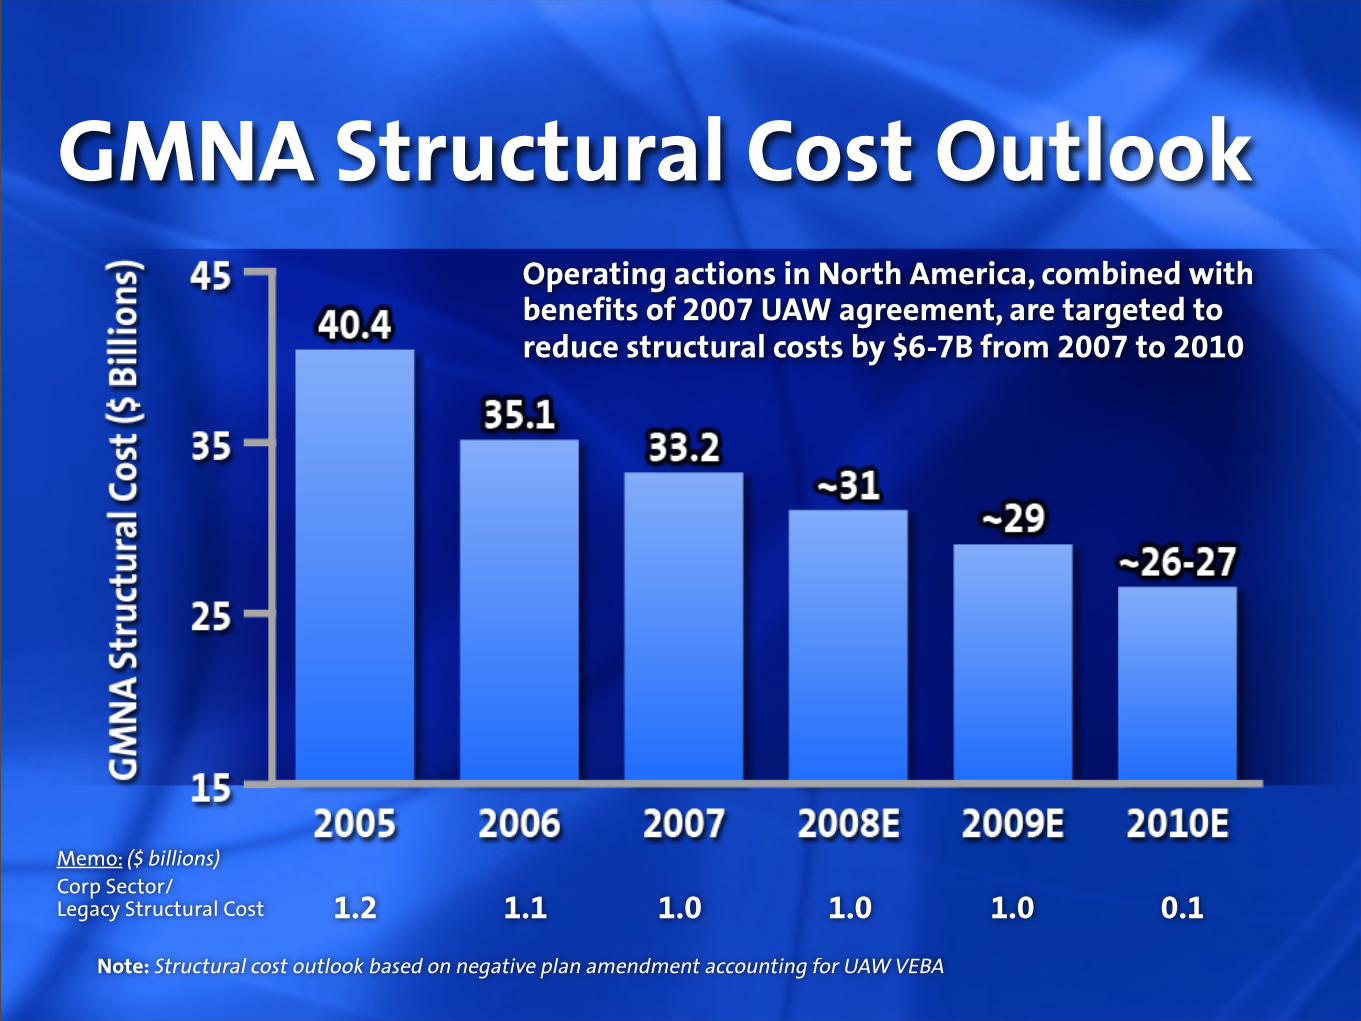
1.2 1.1 1.0 1.0 1.0 0.1
GMNA Structural Cost Outlook
Memo: ($ billions)Corp Sector/ Legacy Structural Cost
Note: Structural cost outlook based on negative plan amendment accounting for UAW VEBA
Operating actions in North America, combined with benefits of 2007 UAW agreement, are targeted to reduce structural costs by $6-7B from 2007 to 2010
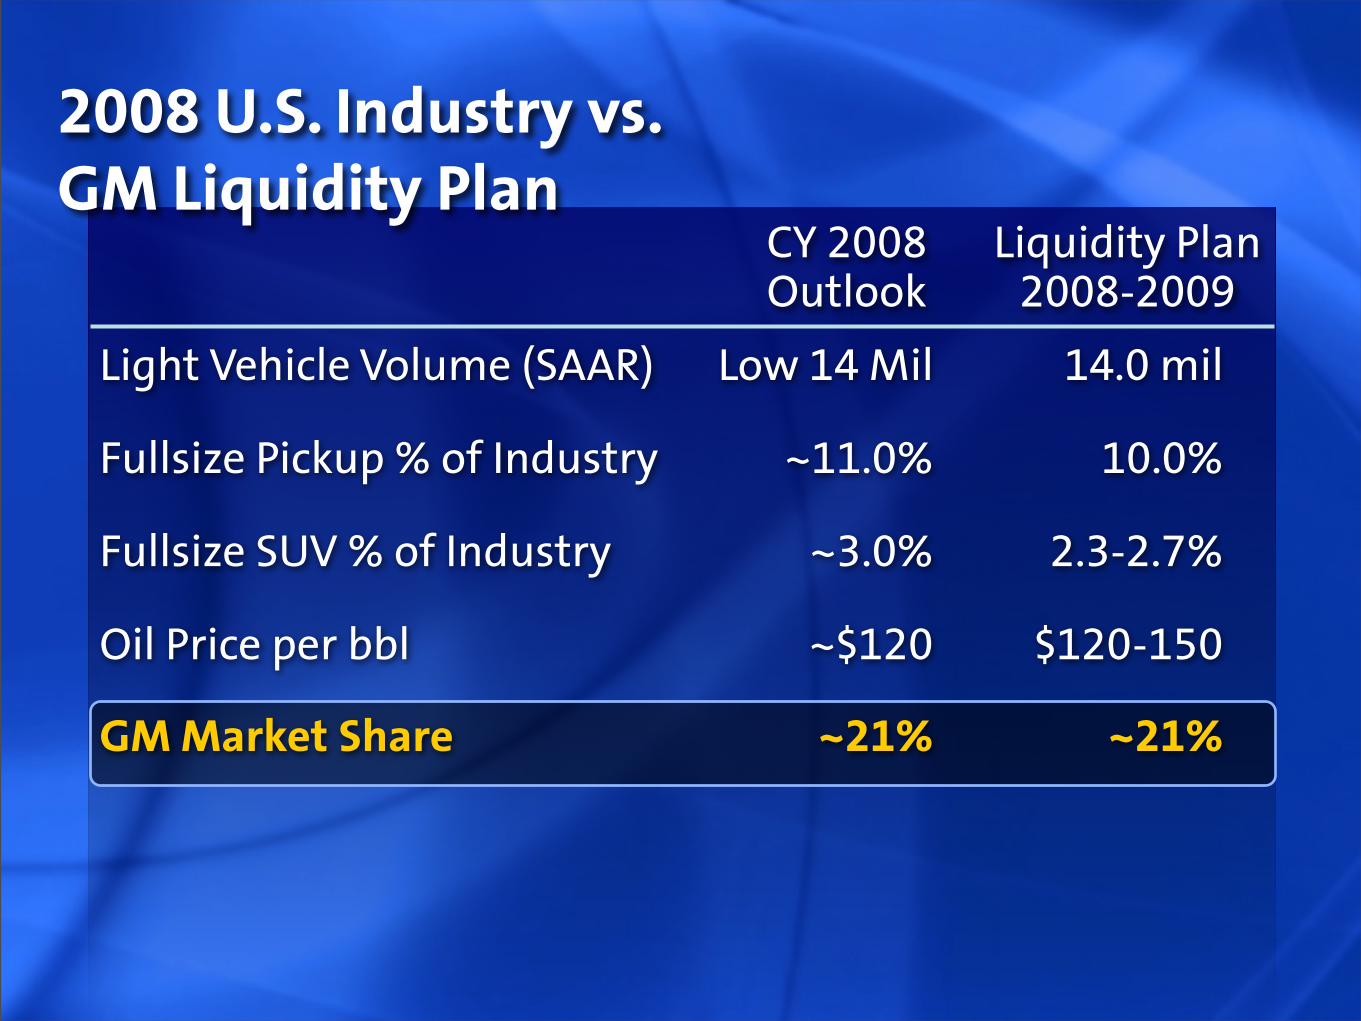
2008 U.S. Industry vs. GM Liquidity Plan
CY 2008 Liquidity Plan Outlook 2008-2009
Light Vehicle Volume (SAAR) Low 14 Mil 14.0 mil
Fullsize Pickup % of Industry ~11.0% 10.0%
Fullsize SUV % of Industry ~3.0% 2.3-2.7%
Oil Price per bbl ~$120 $120-150
GM Market Share ~21% ~21%
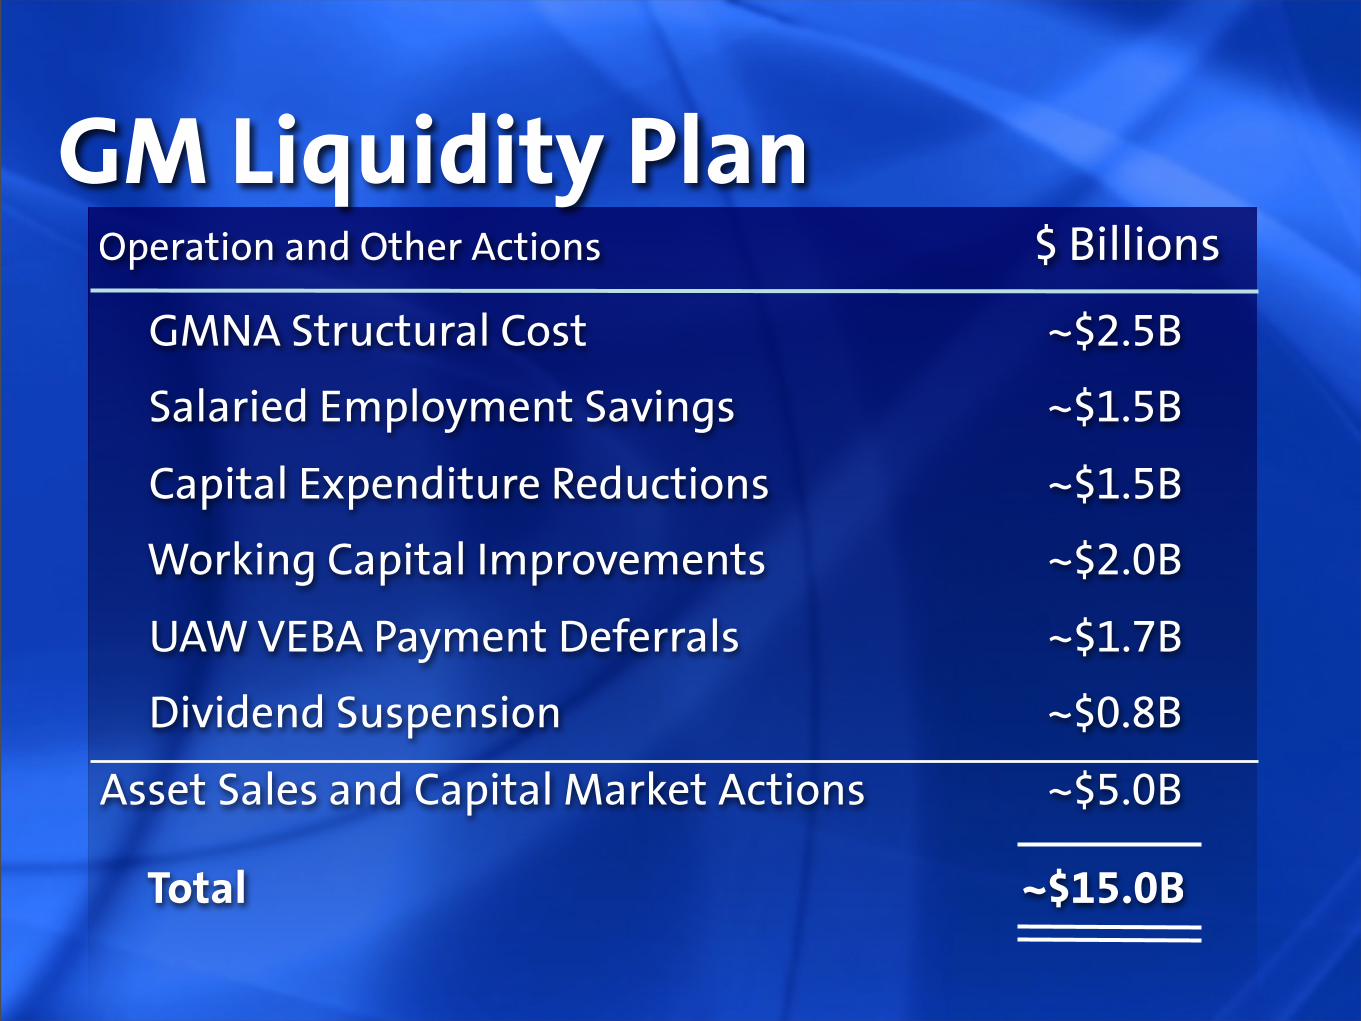
GM Liquidity Plan
GMNA Structural Cost ~$2.5B
Salaried Employment Savings ~$1.5B
Capital Expenditure Reductions ~$1.5B
Working Capital Improvements ~$2.0B
UAW VEBA Payment Deferrals ~$1.7B
Dividend Suspension ~$0.8B
Asset Sales and Capital Market Actions ~$5.0B
Total ~$15.0B
Operation and Other Actions $ Billions
What Is Happening Outside GMNA?
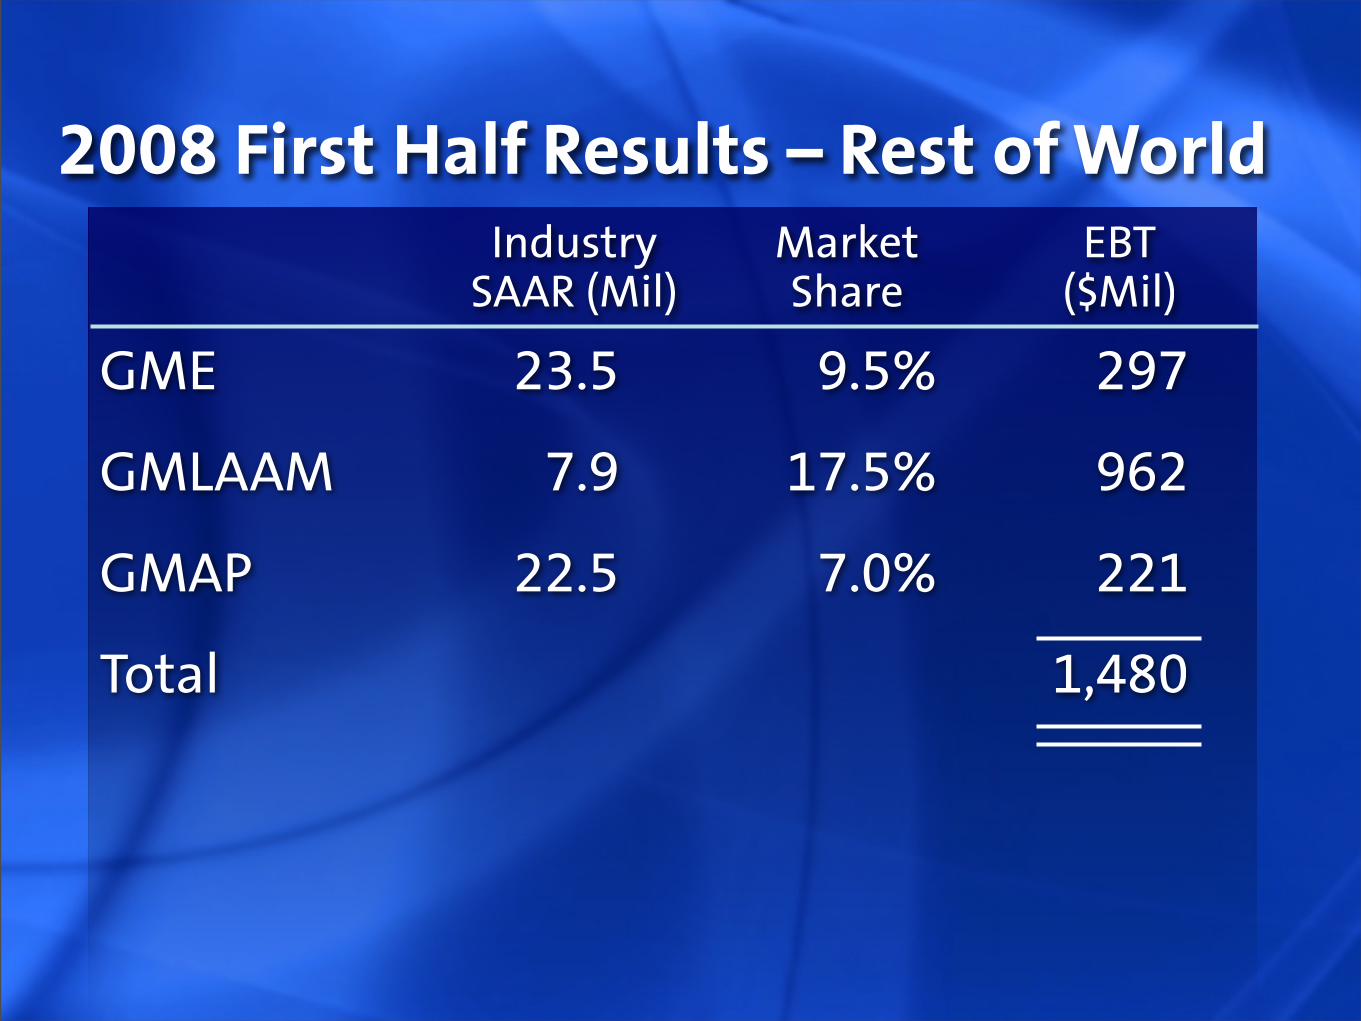
2008 First Half Results – Rest of World Industry Market EBT SAAR (Mil) Share ($Mil)
GME 23.5 9.5% 297
GMLAAM 7.9 17.5% 962
GMAP 22.5 7.0% 221
Total 1,480
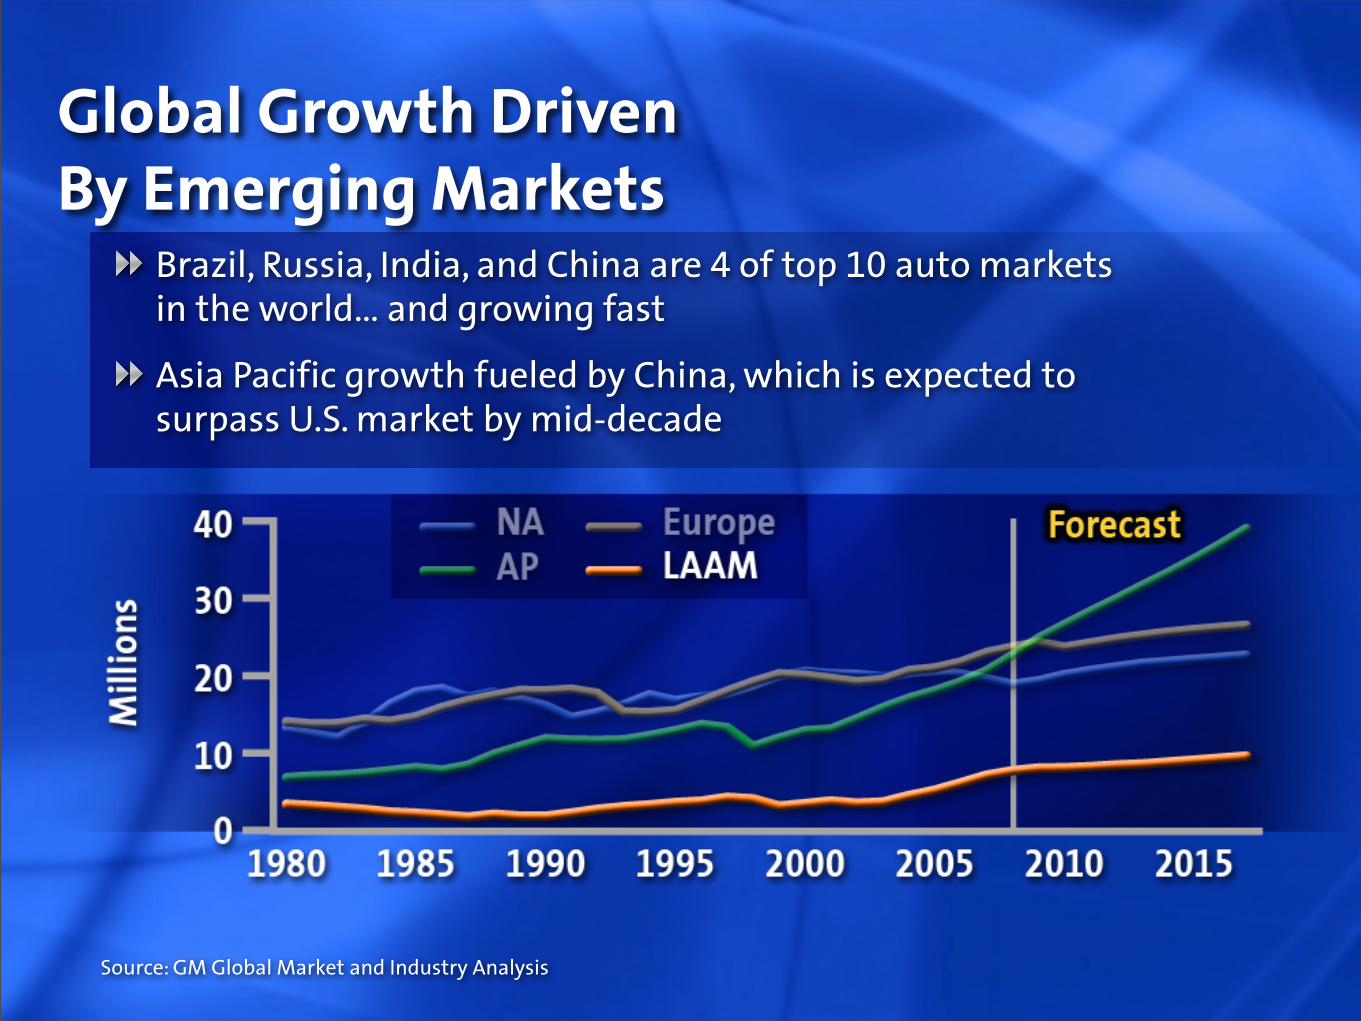
Global Growth Driven By Emerging Markets
Brazil, Russia, India, and China are 4 of top 10 auto markets in the world… and growing fast
Asia Pacific growth fueled by China, which is expected to surpass U.S. market by mid-decade
Source: GM Global Market and Industry Analysis
Running GM Globally
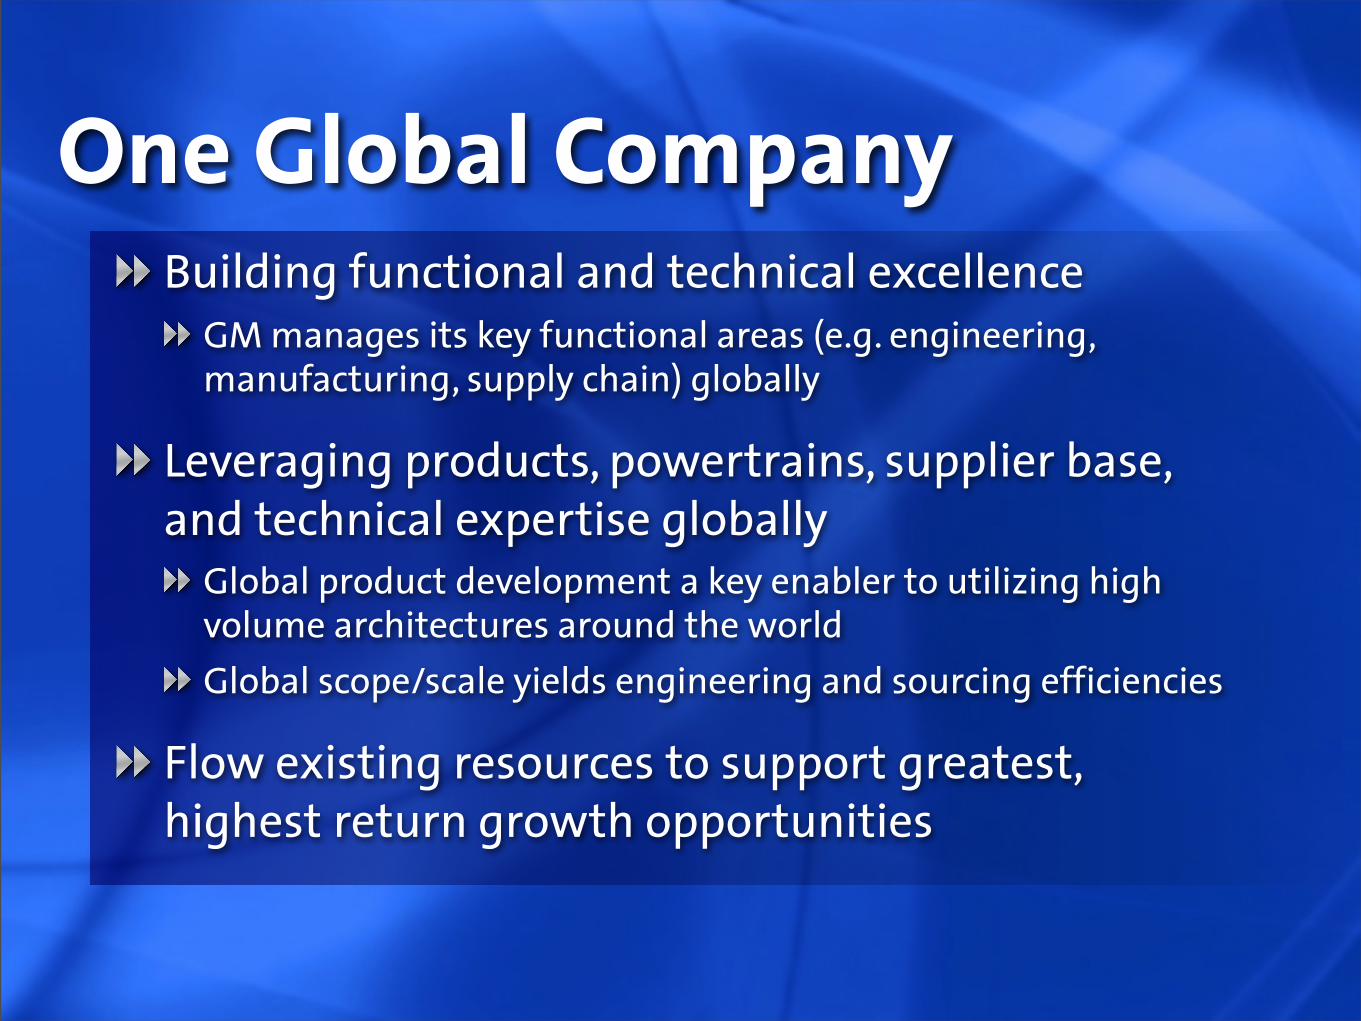
One Global CompanyBuilding functional and technical excellence
GM manages its key functional areas (e.g. engineering, manufacturing, supply chain) globally
Leveraging products, powertrains, supplier base, and technical expertise globally
Global product development a key enabler to utilizing high volume architectures around the world
Global scope/scale yields engineering and sourcing efficiencies
Flow existing resources to support greatest, highest return growth opportunities

Implications for Canada
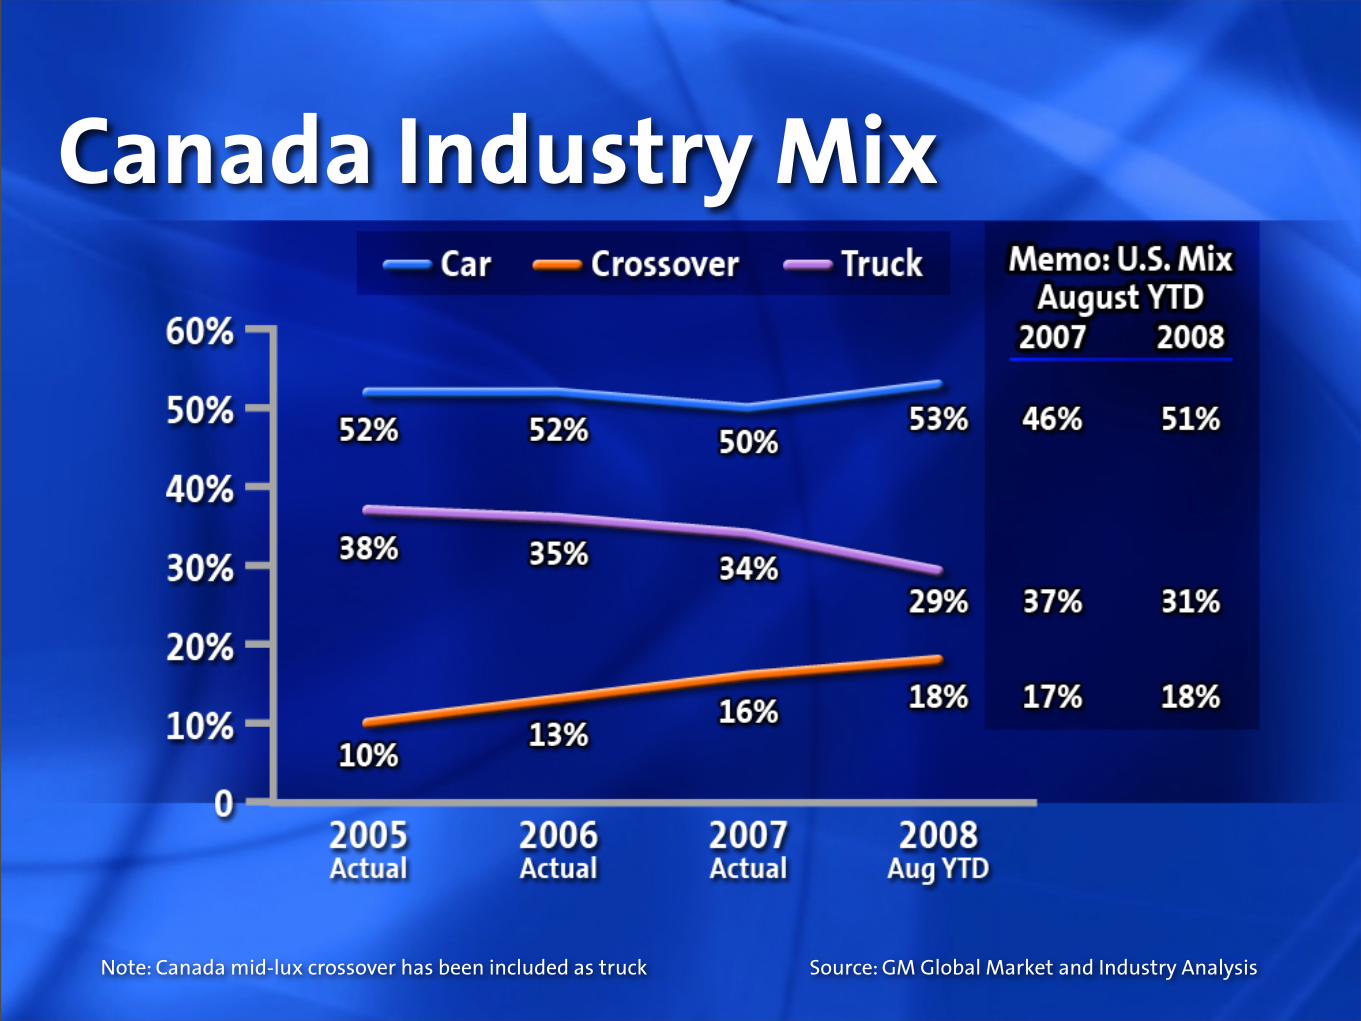
Canada Industry Mix
Note: Canada mid-lux crossover has been included as truck Source: GM Global Market and Industry Analysis
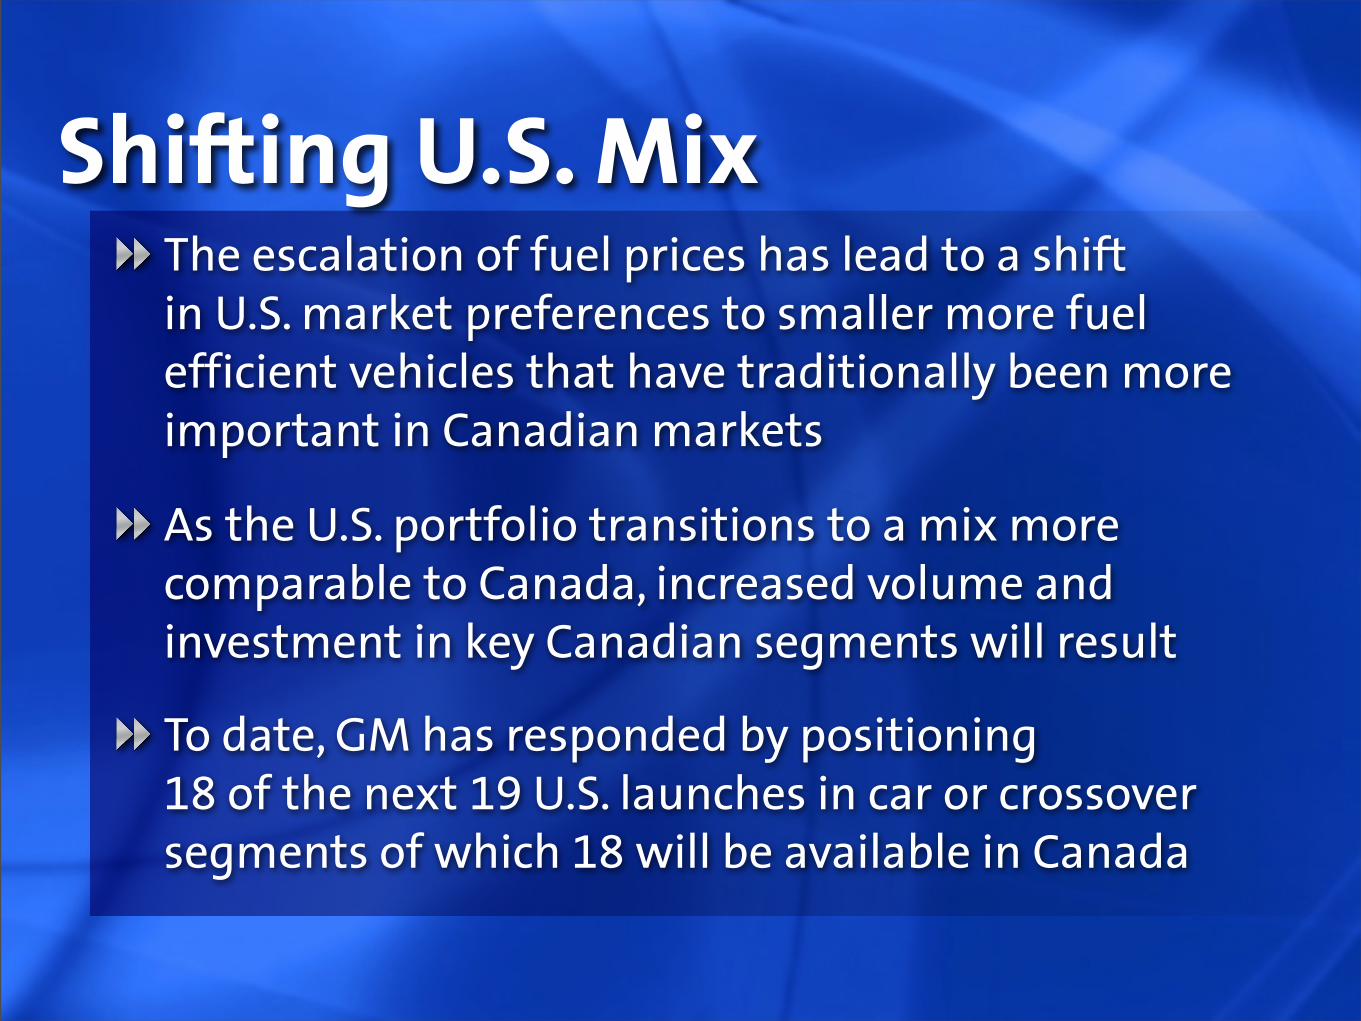
Shifting U.S. MixThe escalation of fuel prices has lead to a shift in U.S. market preferences to smaller more fuel efficient vehicles that have traditionally been more important in Canadian markets
As the U.S. portfolio transitions to a mix more comparable to Canada, increased volume and investment in key Canadian segments will result
To date, GM has responded by positioning 18 of the next 19 U.S. launches in car or crossover segments of which 18 will be available in Canada

ClosingRemarks
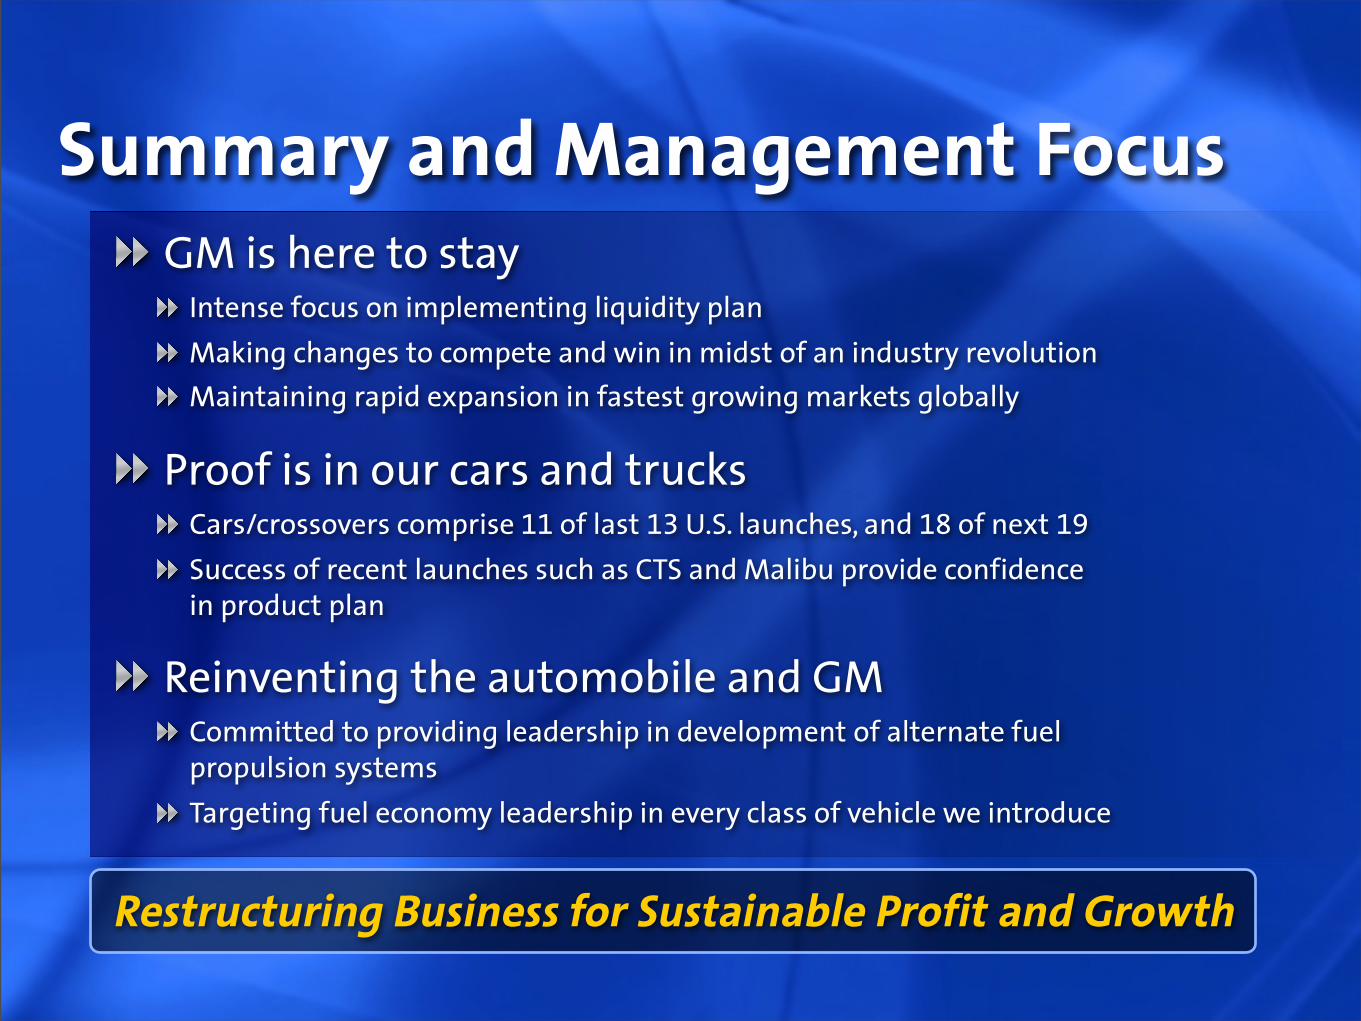
Summary and Management FocusGM is here to stay
Intense focus on implementing liquidity plan
Making changes to compete and win in midst of an industry revolution
Maintaining rapid expansion in fastest growing markets globally
Proof is in our cars and trucksCars/crossovers comprise 11 of last 13 U.S. launches, and 18 of next 19
Success of recent launches such as CTS and Malibu provide confidence in product plan
Reinventing the automobile and GMCommitted to providing leadership in development of alternate fuel propulsion systems
Targeting fuel economy leadership in every class of vehicle we introduce
Restructuring Business for Sustainable Profit and Growth