global migraration trend
TRANSCRIPT

1
INDEX
Sr. No. Paticulars Pg. No.
1. Overview 2-8
2. literature review 9-12
3. Statistics on migration and cities 13-21
4. Global Migration Trends 22-31
5. European Migrant Crisis 33-37
6. Conclusion 40-41
7. References 42

2
OVERVIEW
We live in a world which is becoming increasingly urban, where more and more people are
moving to cities. Over 54 per cent of people across the globe were living in urban areas in 2014
(UN DESA, 2014).1 The current urban population of 3.9 billion is expected to grow in the next
few decades to some 6.4 billion by 2050. It is estimated that three million people around the
world are moving to cities every week (UN-Habitat, 2009). Migration is driving much of the
increase in urbanization, making cities much more diverse places in which to live. Nearly one in
five of the world foreign-born population resides in established global gateway cities (Çağlar,
2014). In many of these cities such as Sydney, London and New York, migrants represent over a
third of the population and, in some cities such as Brussels and Dubai, migrants account for more
than half of the population. Other cities have seen a remarkable growth in migration in recent
years. For example, the number of foreign residents in Seoul has doubled in the last ten years.2
In Asia and Africa, rapidly growing small cities are expected to absorb almost all the future
urban population growth of the world (UN DESA, 2014) and this mobility pattern to cities and
urban areas is characterized by the temporality and circularity of the internal migration process
(Hugo, 2014). The fast rate of urbanization, and rising migration to cities, brings with it both
risks and opportunities for the migrants, communities and governments concerned. The World
Migration Report 2015 – Migrants and Cities: New Partnerships to Manage Mobility explores
how migration and migrants are shaping cities, and how the life of migrants, in turn, is shaped by
cities, their people, organizations and rules. This report examines the relationships between
migrants and cities on such issues as employment, housing and health, and also considers how
migrants help to build and revive cities with their resources and ideas, both in the origin and host
countries. The report also identifies innovative examples of how some cities are seeking to
manage the challenges of increased global mobility and social diversity with varying degrees of
success. It will highlight new policy developments concerning urban partnerships among migrant
groups, local governments, civil society and the private sector which are designed to meet the
challenges posed by migration and cities. Migration and how it is governed, should be an issue at
the frontline of urban planning and sustainable development. However, migration is largely
omitted from the global debate on urbanization. There is a glaring absence of the mention of

3
migrants in international planning for a new global urban agenda, such as Habitat III.3 Many city
and local governments also still do not include migration or migrants in their urban development
planning and implementation. Migrants are therefore still generally overlooked in global
discourses on urbanization and cities.
Migration is essentially an urban affair
We live in an era of unprecedented human mobility that has been markedly urban as migrants,
both internal and international, move to cities and urban areas, bring diversity and connect
communities within and across borders to create new linkages among localities. This calls for
new approaches to urban governance and migration policies. There are an estimated 232 million
international migrants (UN DESA, 2013) and 740 million internal migrants (UNDP, 2009) in the
world.
• About 50 per cent of international migrants reside in ten highly urbanized, high-income
countries5 such as Australia, Canada and the United States, several countries in Europe (France,
Germany, Spain and the United Kingdom), the Russian Federation, Saudi Arabia and the United
Arab Emirates (UN DESA, 2013). Migrants tend to concentrate in cities of these countries.
Almost all growth in the world’s population over the next few decades of another 2.5 billion is
expected to be in urban areas in low- and middle-income countries, particularly in Africa and
Asia (UN DESA, 2014).
• Although Africa is not the world’s fastest urbanizing region, its urban population has been
growing at a historically unprecedented rate for decades. In 1960, Johannesburg was the only
city in sub-Saharan Africa with a population of over a million; by 1970, there were four (Cape
Town, Johannesburg, Kinshasa and Lagos) and, by 2010, there were 33 (UN-Habitat, 2013).
• Every day an estimated 120,000 people are migrating to cities in the Asia- Pacific region and,
by 2050, the proportion of people living in urban areas is likely to rise to 63 per cent. The Asia–
Pacific region has added nearly 1 billion people to its urban population between 1990 and 2014,
about half of whom in China alone (450 million). As part of a long-term trend, the urban
population of the region has more than doubled between 1950 and 1975, and again between 1975
and 2000. It is anticipated to almost double once more between 2000 and 2025 (UN ESCAP,
2014).

4
Increased large scale migration to urban centres is inevitable due to the global realities of aging
societies, slow and uneven economic growth among regions in a country and among nations, and
environmental and climatic instability. For many cities, migration has become a more important
determinant of population growth and age structures than fertility and mortality (Skeldon, 2013).
Social networks are located in cities and newly arriving migrants can make use of these for
survival and economic opportunities. It is in cities where migrant integration primarily takes
place. The geography of migration flows is changing in line with changes in the global economy.
A much wider range of cities around the world have become destinations for migrants. For
example, migrants are increasingly attracted to countries experiencing higher economic growth
in East Asia, Brazil, southern Africa and western India. Cities everywhere are experiencing a
constant ebb and flow of people between urban, regional, national and global communities. Thus
cities face growing challenges of managing migration-induced diversity. However, at the global
level, migration policies and urbanization policies tend to be discussed in separate forums, which
results in a lack of policy coherence. At the national level, with very few exceptions, there is a
disjuncture between national and local policies. National governments may encourage migration
to urban areas for economic development without sufficient coordination with local governments
on the basic social service needs on the ground. Cities, in the meantime, have taken their own
initiatives to manage migration at the local level and directly interact with migrants, and even
with their home communities through transnational partnership arrangements. For a small and
growing number of cities, immigration policies and programmes are now integral to their urban
development and management.
Migration to cities brings both challenges and opportunities Almost all the growth in the world’s
population over the next few decades will take place in urban centres in low- and middle-income
countries where poverty reduction is slow and large deficits in provision of basic services remain
(UN DESA, 2012). Strong population growth in cities poses a great deal of pressure on
infrastructure, the environment and the social fabric of the city. There is much concern about the
pace of urbanization and the capacity of national and local governments among low-income
nations to cope with its consequences. Policymakers in these countries tend to consider rural–
urban migration as the main contributor to over-crowding, congestion, increasing exposure to
environmental hazards and to shortfalls in basic infrastructure and services. Over the last
decades, particularly in the Global South, poorly managed urban migration has often resulted in

5
the development of informal solutions to address gaps in the provision of basic needs and in the
exclusion of migrants from access to formal land, housing and job markets as well as health and
education services. UN-Habitat estimates that one out of every three people in cities in the
developing world lives in slum areas accommodating migrants and other urban poor (UN-
Habitat, 2007).
Migration policies of both origin and destination countries can affect cities in positive and
negative ways. Restrictive, inadequate or unclear policies on labour mobility in Africa, Asia
and Europe may give rise to irregular migratory flows and the growth of informal urban
settlements. Strict border control policies can lead to urban “transit hubs” where migrants
become stranded on their way to intended destinations.
Newcomers often have no choice except to settle in hazard-prone and poorly planned areas,
where they have limited access to resources and opportunities that are essential for resilience.
Furthermore, when disasters strike, they are among the worst affected. Recent studies indicate
that migrants are disproportionately represented among the urban poor in these informal
settlements (Hoang, Truong and Dinh, 2013; Rigg, Nguyen and Luong, 2014). For example,
in Accra, Ghana, 92 per cent of migrant households live in one slum, Old Fadama, without a
ready supply of water or access to toilet facilities (Awumbila, 2014). In many cities in low- and
middle- income countries, informal settlements commonly function as entry points for
incoming migrants. Despite the hardships of living in such conditions, migrants are still able to
find economic activity and opportunities to improve their current well-being and future
prospects (Awumbila, Owusu and Teye, 2014) in these informal settlements or slums, such as
Kibera in Nairobi, Kenya, or Old Fadama. Moving to cities can greatly enhance people’s well-
being. It offers an escape from the impact of the hazards of a fragile rural livelihood, and an
access to diverse employment opportunities and better health and education, all of which have
the potential to reduce the poverty of the people moving as well as those who stay behind.
Urbanization clearly brings benefits, as it is hard to find sustained economic growth without
urbanization. Cities can also turn urban diversity arising from migration into social and
economic advantages. Migration can help increase productivity if it is strategically managed and
linked to the formal economy. Fostering the inclusion of migrants into the labour market can
have positive benefits both for the place of origin and of destination as links are maintained

6
between the two.
Despite innovation in some cities, efforts for poverty reduction through the inclusion of
migrants are not yet readily prioritized by city or municipal government authorities.
Inclusive local plans, policies and measures, in particular at the city level, are critical in defining
the well-being and resilience of migrants, while effective national and international instruments
and institutions also need to be put in place.
A recent study found a strong correlation between effective provision of services and urban
development in all of the major emerging economies (EPF and CIRD, 2013). In pursuing more
inclusive urban governance, cities today link local urban social cohesion to economic growth
and global competitiveness (Metropolis, 2011). The participation and inclusion of migrants
in their host cities is an indispensable part of building stable, open and vibrant communities
that assure the socioeconomic future of a country. Migrants are resourceful partners in urban
governance Migrants make significant and essential contributions to the economic, social and
cultural development of their host countries and of their communities back home. Yet oftentimes
these contributions go unrecognized or, at best, are measured only in terms of the remittances
they manage to send back home.
Migrants as builders of resilience: Migrants also play an important role in building the
resilience of home and host communities through the exchange of resources and support. They
and their networks can contribute to managing risk for the community at large. Migrants are
often overrepresented in the healthy, productive age groups and provide diversified skills that
can support disaster preparedness, response and recovery efforts, particularly in ageing societies.
Migrants as agents of local development: Migrants play a central role in forging the links
between cities of origin and of destination and in mainstreaming migration into local
development planning. City-to-city links are often created or maintained due to the presence
of large migrant populations. Migrant and diaspora communities can play an important role in
supporting local decentralized development partnerships between cities and in facilitating or
undertaking some of the related activities such as the provision of expertise and information on
the communities of origin.
Migrants as city-makers: Migrants can help strengthen the place of cities in the global

7
economic and political hierarchy. They can do so by promoting historical, cultural, religious
and socioeconomic assets of a city if opportunities exist to enable them to do so.
As reflected in the Declaration adopted at the UN High-level Dialogue (HLD) on International
Migration and Development in New York in 2013, migrants need to be at the centre of national
and global migration and development agendas. This has been a key message of international
debates on migration since the UNDP Human Development Report 2009 dedicated to human
mobility and development. By examining how migration affects well-being, the WMR 2013
drew attention to the human development of migrants and its significance in policy debate.
Migrant-inclusive urban governance is needed
Urbanization is the dominant challenge of the twenty-first century. Most urban growth will
come from both international and internal migration. Urban growth, however, can only be
sustainable if cities invest in their communities, including migrants. Cities are well positioned
to help manage human mobility. They have the authority to develop and implement policy
frameworks for the inclusion of migrants. As service providers, they have direct access to
migrants and can assess their needs.
Urban migration governance requires, however, a multi-stakeholder approach and governance
structure so that diverse interests may be accommodated and cooperative action taken. It
includes formal institutions as well as informal arrangements and the resources of residents
including migrants. Partnerships with other cities and local governments, national government,
civil society, migrant associations and the cities’ own diasporas are necessary to reap the
benefits of the human resources of each city. In particular, public–private partnerships involving
businesses could foster the integration of migrants in the labour market and help prevent spatial
segregation. These partnerships will make urban governance more flexible, cost-effective and
increase both social cohesion and the economic competitiveness of cities.
Positive efforts are being made among city policymakers to promote social cohesion. There are
good examples of institutional structures being formed with the commitment of federal and
local-level authorities in a number of cities in Europe (such as Berlin, Athens, Bilbao and
Dublin) and in Asia (Fuzhou in the Fujian Province of China, Singapore and a network of
cities in Japan). Cities like Berlin, Dublin and Lille are also forging partnerships with migrant

8
associations to promote citizenship and political participation among migrant groups. Another
innovative approach to financing municipal inclusion policies is participatory budgeting. This
is widely practiced by over 1,700 local governments in more than 40 countries, especially
among low-income countries where municipal budgets remain low despite decentralization.
Platforms for exchange consultation and cooperation must be developed
As people increasingly live and work in more than one place, cities are challenged to manage
their growing diversity and their strategic position within a country and the world at large.
For example, openness to ethnic and cultural diversity has become an indicator of a city’s
ability to do business with the rest of the world along with such indicators of economic,
investment and trade links to the global markets.8 The capacity of a city to attract international
populations and enable them to contribute to the future success of the city9 is considered a key
benchmark for a sustainable city of the future.
Unfortunately, migration is still not taken into consideration in most urban development plans
and policies, and vice versa; and there is a glaring absence of migrants in the major
international planning for a new global urban agenda, such as Habitat III. This is in part a
reflection of the chronic gaps and variances in definitions10 as well as in data and empirical
research on migration and urbanization. It may also be a consequence of the lack of
coordination between central and local governments. The present report highlights the links
between well-governed migration and well-managed development. This, in turn, shows that
restrictive policies on migration and urbanization can be damaging for growth and development
for both origin and destination cities and countries in a globalized context.

9
LITERATURE REVIEW
Population ageing is an inevitable outcome of the demographic transition. Primarily, as a
result of declines in fertility and, secondarily, mortality declines, the age structure of a
population becomes older, with a growing number and proportion of elderly persons. In recent
years, the issue of population ageing has received renewed attention in many countries,
especially those in the more developed regions, owing to the continuance of fertility below the
replacement level and on-going trends towards lower mortality. While there is great variation
among them in terms of the level and pace of population ageing, this demographic process
is expected to increase further in these countries, and eventually their populations are
projected to level off and decline in the foreseeable future. These changes have profound
consequences and far-reaching implications, especially for pension schemes, heath-care
systems, education programmes and housing plans, as well as for the economic vitality and
growth of a country. This chapter reviews selected literature that concerns the impacts of
migration on the size and age structure of population. Whereas existing studies have paid a
great deal of attention to population ageing and its social and economic implications (see, for
instance, United Nations, 2000; Korea Institute for Health and Social Affairs, 2000;
Organisation for Economic Cooperation and Development, 1997), the review that follows
primarily gathers the literature that investigates the impact of international migration on
population dynamics in a low-fertility setting.
The future population size and age-sex structure of any country depend basically on three
demographic components: fertility, mortality and net international migration. As no policies to
increase the mortality of a population are socially desirable, there are, in theory, two possible
ways of retarding or reversing demographic ageing. First, a reversal of declines of fertility
would lead the age structure of the population back towards a younger one, thus slowing
down the ageing process. However, the recent experience of low-fertility countries suggests
that there is no reason to assume that their fertility will return anytime soon to the above-

10
replacement level (United Nations, 2000; Lutz, 2000). Although Governments in those
countries have introduced, instead of explicit pronatalist policies, a variety of social welfare
measures favorable for higher fertility (Demery, 2000), the long-term effectiveness of such
measures is often called into question.
Hence, as a second option, the potential role that international migration could play in
offsetting population decline and population ageing has been considered. International
migration has become a salient global phenomenon in recent years, with a growing number of
countries being involved as sending or receiving countries, or both. Given the possibility of
attracting larger numbers of immigrants into affluent developed economies, virtually all of
which are experiencing low fertility, it appears appropriate to consider the impact that
international migration may have on the demographic challenges of ageing. In formulating
migration policy, it is also likely that the demand for demographic considerations will
increase, as the rapid ageing process in those countries can give rise to rigidities in the labour
market and social security (Organisation for Economic Cooperation and Development, 1991).
A number of previous studies have examined the demographic impact of a constant
influx of migrants on the growth of a population with below-replacement fertility. For
example, taking the twelve countries in Europe or members of the then European Community
(EC) together, Lesthaeghe and others (1988) carried out population projections. With the
present below-replacement fertility and with no further immigration, the total population of
these European countries would be reduced by approximately 20 to 25 per cent by the year
2050. The calculations showed that an overall population decline during the first half of the
twenty-first century can be avoided if about one million immigrants move into the area every
year. Assuming the same annual migration gain of one million, Lutz (2000) recently showed
that the total population of Western Europe would grow by 13 per cent (to 505 million in
2050), as opposed to declining by three percent (to 422 million) in the case of no migration.
Similar studies have been carried out more frequently at a national level. Ulrich (1998),
however, argued that immigration can only slow an inevitable decline of the population of
Germany. He applied different fertility assumptions for natives and foreigners and different
immigration levels by group of immigrants, and estimated the population size of Germany
and its structure in 2030. His projections showed that, even with a relatively high level of

11
immigration, the population of the country would start falling in the near future. Wanner
(2000), in his study of Switzerland, also showed that in the absence of future migration the
total population of the country would start declining much earlier and would be 5.6 million in
2050, about 1.5 million less than what is currently projected.
The importance of immigration for the growth of population in traditional countries of
immigration is relatively well recognized (Appleyard, 1991; Foot, 1991; United Nations, 1998).
Nevertheless, even in these countries where relatively large numbers of migrants are
systematically admitted, the current level of immigration may not be sufficient to prevent
their population size from declining in the future. Espenshade (1986) projected the changes
in the population of the United States, assuming that both the fertility and mortality rates
remained constant at their 1980 level and that the number of immigrants remained at the
level in 1983, with the same age and sex structure. According to these assumptions, the
population in the United States would grow until 2025, but decline thereafter. In a similar
exercise for Canada it was found that in order to avoid population decline, a volume of
immigration exceeding the current annual quota would be necessary after 2050, under the
assumption that the current fertility level would be maintained (Wattelar and Roumans, 1991).
Research for the United States also indicates that immigration has relatively little effect on
overall age composition of the population and therefore will not be a realistic solution to
demographic ageing (Coale, 1986; Espenshade, 1994; Day, 1996). Assuming that immigrants
adopt the low fertility of a host population, Coale (1986) compared the age structure of the
United States population in 2100 with and without a net immigration of 700,000 per year.
He showed that the difference in the projected age distributions of the two populations is
fairly modest, regardless of the four different below-replacement fertility scenarios. Similar
results were presented a decade later by Day (1996). According to her projections, should
fertility and mortality follow the middle-series assumption and net migration be held at
820,000 per year or near the current level, the proportion aged 65 years or older in the United
States would increase from 12.8 per cent in 1990 to 20.0 per cent in 2050. Even if a fairly
larger level of immigration (1.4 million per year) occurred, it would reduce the future
percentage of elderly in the population only slightly (to 19.4 per cent).
Concerns about an ageing society often arise not only from the growing number and

12
proportion of elderly, but also from the rapidly changing ratio of the working-age population
to the retired population. In particular, the sharp drop of the ratio may directly affect the
viability of social security systems. In the study cited earlier, Lesthaeghe and others (1988)
computed the ratio of adult women (20-59 years) to elderly women (60 years or older) for
the total population of the twelve European countries under five different scenarios. If the
countries kept their current below-replacement fertility, the ratio would decline from 2.4 in
1985 to 1.5 in 2060. Immigration of 400,000 women per year from 1985 onwards would be of
some help to alleviate the decline, but would still yield a ratio of 1.8 in 2060. In his study
cited earlier, Wanner (2000) showed that in Switzerland, the ratio of the population aged
20 to 64 years to the population aged 65 years or older would be 1.5 in 2050 in the absence
of migration, as compared to 2.1, which is currently projected.
While the foregoing studies unanimously point out the limited effects of international
migration on population ageing, Ryder (1997) noted that the outcomes of these population
projections could be sensitive to the assumed age distribution of net international migrants.
As the age at entry of migrants increases, the expectation of life after migration declines, and
so does the reproductive value of a migrant. Using the data for Canada, Ryder demonstrated
that the increase in mean age of migrants at entry resulted in an increase in the dependency
ratio by about 0.6 per cent per year of age, given a projection period of a century.
13
STATISTICS ON MIGRATION AND CITIES
We live in an era of unprecedented human mobility that has been markedly urban, as migrants,
both internal and international, move to cities and urban areas, bring diversity and connect
communities within and across borders to create new linkages among localities. This calls
for new approaches to urban governance and migration policies. There are an estimated 232
million international migrants (UN DESA, 2013) and 740 million internal migrants (UNDP,
2009) in the world.
• About 50 per cent of international migrants reside in ten highly urbanized, high-income
countries1 namely Australia, Canada and the United States, several countries in Europe
(France, Germany, Spain and the United Kingdom), the Russian Federation, Saudi Arabia
and the United Arab Emirates (UN DESA, 2013).
Almost all of the growth in the world’s population over the next few decades, another 2.5
billion, is expected to be in urban areas in low- and middle-income countries, particularly in
Africa and Asia (UN DESA, 2013).
Although Africa is not the world’s fastest urbanizing region, its urban population has
been growing at a historically unprecedented rate for decades. In 1960, Johannesburg
was the only city in sub-Saharan Africa with a population of over a million; by 1970,
there were four (Cape Town, Johannesburg, Kinshasa and Lagos) and, by 2010, there
were 33 (UN-Habitat, 2013).
Every day an estimated 120,000 people migrate to cities in the Asia-Pacific region
and, by 2050, the proportion of people living in urban areas is likely to rise to 63 per
cent. The Asia-Pacific region has added nearly 1 billion people to its urban population
between 1990 and 2014, about half of whom in China alone (450 million). The
phenomenon is part of a long-term trend. The urban population of the region more

14
than doubled between 1950 and 1975 and again between 1975 and 2000 and is
projected to almost double once more between 2000 and 2025 (UNESCAP, 2014).
New partnerships for urban development
The World Migration Report 2015 explores how migration and migrants are shaping cities,
and how the life of migrants in turn is shaped by cities, their people, organizations and rules.
A key message is that urban partnerships among migrant groups, local governments, civil society
and the private sector are central to addressing the challenges and optimizing the opportunities
presented by the growing trend of migration towards cities.
Sustained and inclusive economic growth is the goal most cities strive to achieve through
practical and innovative solutions. Furthermore, for an increasing number of cities,
immigration policies and programmes are integral to their urban development planning and
management. UNESCO and UN-Habitat have undertaken joint research on the importance of
migration for the growth of urban areas, and how to enhance inclusiveness of migrants in
cities. Examples are multiple of how migrants are helping to build cities, provide services
and generally resuscitate the socioeconomic life of cities in decline, including some mid-size
cities in the United States such as Dayton, Ohio, where Turkish migrants initiated cooperation
with city authorities on a housing project. The authorities of such enterprising cities as
Cleveland, Columbus, Detroit, Indianapolis, Lansing and Saint Louis have embarked on similar
immigration-focused urban development experiments.
In recent years, there has been an increase in the number of networking initiatives among city
authorities, urban practitioners, civil society leaders, business development communities and
migrant/diaspora groups to discuss urban integration issues and foster participative economic
growth. It is important to know to what extent these activities have been translated into effective
urban policies to create “opportunity structures” for sustained and inclusive economic growth
that empower both locals and newcomers.
For successful integration and community development, both cities of origin and destination
are reaching out to each other. For example, Kavarna in Bulgaria concluded bilateral agreements
with the four Polish cities where the majority of Roma from Kavarna were employed. These

15
agreements give the Roma the right to work, register companies and facilitate tax collection. The
Roma use their savings for improving their conditions of living, especially housing in
Kavarna. In their destination cities, the Roma’s economic success has changed the way they
are perceived by the local population. Their new status as a prosperous group has improved
inter-ethnic relations.
Urban governance in developing countries can be strengthened through city-to- city
cooperation, particularly (but not only) with partner countries in the developed world. For
example, the City of Rotterdam maintains strong partnerships with cities of the countries
where most of Rotterdam’s migrants come from, including Turkey, Morocco, Suriname, the
Netherlands Antilles and Cabo Verde. In particular, Rotterdam also works on issues of water
and climate change with their partner cities of Izmir, Istanbul and Casablanca. Similar
initiatives have been developed over the past decade and are increasingly gaining popularity.
Global initiatives such as the Rockefeller Foundation’s Resilient Cities programme and IBM’s
Smarter Cities programme view cities as drivers of sustainable national, regional and global
economic growth to engage city governments, civil society and private sectors in partnerships
on the ground and encourage cities to become smart to better respond to city and global
challenges. The World Bank’s Project Greenback 2.0 identifies and works with “remittance
champion cities” to improve transparency in the market for remittance services and to leverage
the development effects of remittances.
However, many such public and private sector initiatives do not take full account of migrants as
key players in city development, growth, resilience and sustainability. Migrants themselves can
make significant and essential contributions to the economic, social and cultural
development of their host countries and their communities back home. Yet oftentimes these
contributions go unrecognized or at best are measured only in terms of the remittances they
manage to send back home. As reflected in the Declaration adopted at the UN High-level
Dialogue (HLD) on International Migration and Development in New York in 2013, migrants
need to be at the centre of national and global migration and development agendas. This has
been a core message of international debates on migration since the UNDP Human
Development Report 2009 on human mobility and development. By examining how migration
affects well-being, WMR 2013 drew attention to migrants’ human development and its

16
significance in policy debate.
Migrants may be part of the challenge, especially during and after humanitarian crises, but they
can also be part of the solution. As members of a global diaspora, migrants can act as bridge-
builders, traders, business partners and humanitarian support between cities and countries. The
economies of cities that have been built up by remittances of migrant workers are often more
closely linked to the economies of the host country than the home country (Subohi, 2009;
Klaufus, 2010). As cities plan for and manage the challenges of population growth (also from
inflows) and increased sociocultural diversity, they need to include migrants in their planning
and management for resilience.
Changing Patterns of Global Migration and Remittances
Patterns of global migration and remittances have shifted in recent decades, even as both the
number of immigrants and the amount of money they send home have grown, according to a new
Pew Research Center analysis of data from the United Nations and the World Bank. A rising
share of international migrants now lives in today’s high income countries such as the United
States and Germany, while a growing share was born in today’s middle income nations such as
India and Mexico, the analysis finds.

17
These shifts occurred as the total number of international migrants rose from 154 million in 1990
to 232 million in 2013 – but remained steady as a 3% share of the globe’s growing population.
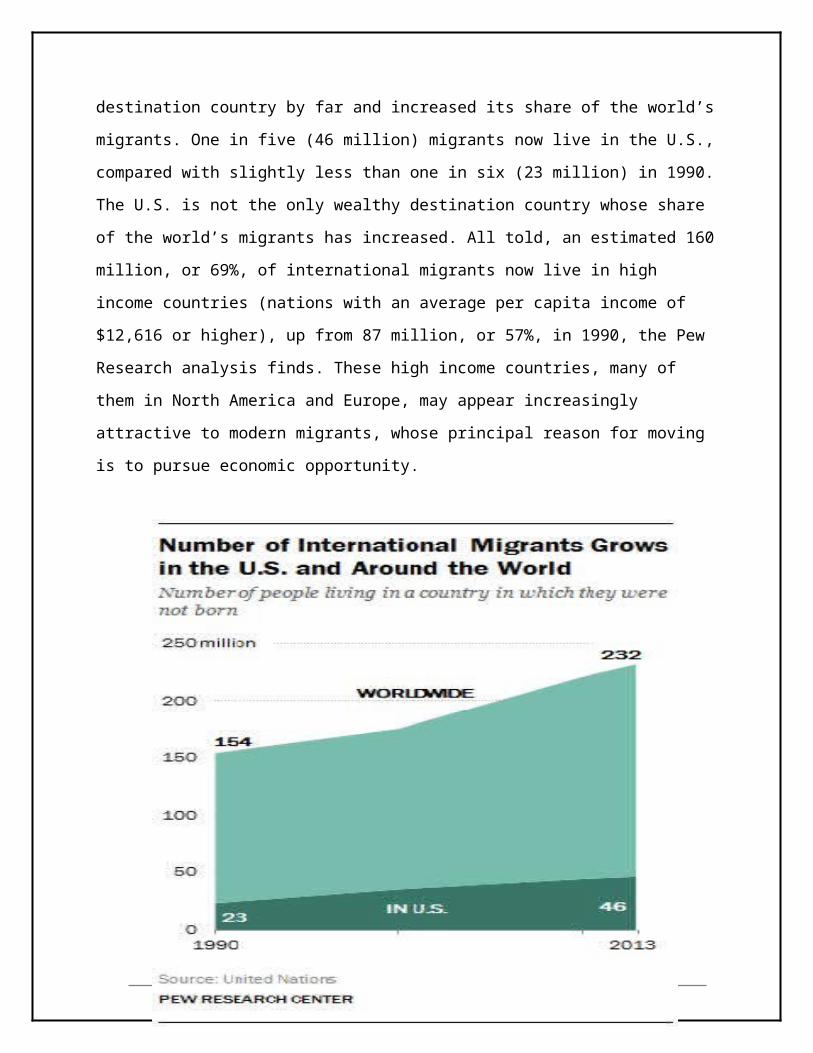
During this period, the U.S. remained the largest destination country by far and increased its share
of the world’s migrants. One in five (46 million) migrants now live in the U.S., compared with
slightly less than one in six (23 million) in 1990. The U.S. is not the only wealthy destination
country whose share of the world’s migrants has increased. All told, an estimated 160 million, or
69%, of international migrants now live in high income countries (nations with an average per
capita income of $12,616 or higher), up from 87 million, or 57%, in 1990, the Pew Research
analysis finds. These high income countries, many of them in North America and Europe, may
appear increasingly attractive to modern migrants, whose principal reason for moving is to pursue
economic opportunity.

18
Where do today’s migrants come from? Increasingly, they were born in what the World Bank
designates as middle income countries, those with per capita annual income between $1,036 and
$12,615. About sixteen (135 million) of today’s international migrants were born in such
countries, compared with fewer than half (74 million) of all migrants in 1990. Over the same
period, the share of immigrants born in high as well as low income nations has declined.
Remittances
Once they move across borders, many migrants send money, known as remittances, back to
families in their countries of origin. Despite a marked dip during the 2009 global recession, the
overall annual flow of such remittances has nearly tripled since 2000 and now tops $500 billion.
And according to the Pew Research analysis of World Bank data, the rise in the stock of
emigrants from middle income countries has been accompanied by a concomitant increase in the

19
flows of remittances back to middle income countries. The share of all remittances received by
today’s middle income countries has risen to an estimated 71% in 2013 from 57% in 2000. The
share to low income nations has doubled, while remaining a small proportion of the total—6% in
2013 compared with 3% in 2000. The share to high income nations has declined, to 23% in 2013
from 40% in 2000.
The economic importance of remittances is larger in poorer countries than in richer ones.
Remittances account for 8% of the gross domestic product in low-income nations, 2% in middle
income nations and less than 1% in high-income nations, according to analysis of World Bank
data. Total remittances to low and middle-income nations are nearly three times the amount of
foreign aid to those countries, the World Bank says. Since 2009, the World Bank has recognized
the importance of remittances by including them in its measure of creditworthiness, allowing
nations with high remittance levels to borrow more money than they otherwise could.

20
The shifting patterns in the flows of both migrants and remittances have a regional as well as
economic dimension. The Middle East and North America have grown as destination regions of
international migrants from 1990 to 2013, as have several Western European countries. A
smaller share of International migrants lives in Asia in 2013 than three decades ago. Meanwhile,
the shares of international migrants living in sub Saharan Africa and Latin America have not
changed markedly. Although policy and geography are important factors in changing patterns of
migration, migration researchers often cite economics to explain migration trends. The pattern of
migrants increasingly living in today’s high income countries but coming from middle income
nations reflects broader changes in the global economy. As free trade agreements for goods and
services increased between middle and High income countries, so has the movement of people.
Moreover, as the human capital and economic aspirations of people in middle income countries
have grown during the past quarter century, more of them have been able to take advantage of
opportunities in high income countries. By contrast, people living in lower income countries may
want to move but most do not have the resources to undertake the journey.
As a Destination, the U.S. Looms Large

21
Despite global shifts in international migration, one constant remains: The U.S. has the world’s
largest number of international migrants. The number of immigrants in the U.S. doubled from 23
million people in 1990 to 46 million in 2013. During this time, no other country has come close
to the number of foreign born people living within its borders. For example, second ranked
Russia had about 11 million immigrants in both 1990 and 2013 (many of whom had moved
within the former USSR prior to 1990). Consequently, the U.S. has bolstered its lead in the
number of international migrants, doubling second place Russia in 1990 and quadrupling it by
2013. The U.S. has also become a major recipient of migrants from key countries with large
numbers of emigrants. Although the U.S. was not a leading destination of migrants born in top
origin countries in 1990, things have changed considerably in a quarter century. By 2013, nearly
1 in 6 (2.1 million) migrants born in India—the top country of birth for international migrants in
2013–lived in the U.S. Almost the entirety of the 13 million migrants born in Mexico–the second
highest country of birth for international migrants in 2013—also lived in the U.S. And the U.S. is
the top recipient of migrants from about a quarter of the world’s countries. In 1990, the U.S. was
the top destination of migrants born in 53 countries. In 2013, that number was about the same at
52 countries.
In Other Ways, U.S. Is in the Middle of the Pack
Even with this growth, the foreign born as a share of the total population is still considerably
lower in the U.S. than in a number of other major destination nations. About 14% of the U.S.
population in 2013 was foreign born, a smaller share than in Australia (28%) and Canada (21%),
and significantly less than in some countries in the Persian Gulf, where the vast majorities of
their populations are foreign born workers. In fact, the regional origins of U.S. immigrants have
become more concentrated over time with a greater share born in Latin America and the
Caribbean. About 47% of all migrants living in the U.S. in 1990 were from Latin American and
Caribbean countries. By 2013, 55% of all foreign born people living in the U.S. were born in the
same region.
U.S. Emigrants—A Rising Number, but Still Relatively Few

22
The U.S. receives many more migrants than it sends. Nonetheless, nearly 3 million Americans
lived outside of the U.S. in 2013, up from 1.8 million in 1990. Compared with other origin
countries, the U.S. is a relatively small source of international migrants. The U.S. ranks 20th in
the list of top origin countries of international migrants, far behind world leaders such as India,
Mexico and China, which together comprised about 16 million migrants in 1990 and nearly 37
million migrants The U.S. also has a significantly lower rate of emigration than most countries.
For example, about 1% of Americans currently live outside of their country of birth, compared
with about 20% of people born in several Eastern Europe countries and more than 4% of people
born in countries such as the United Kingdom and Canada.
GLOBAL MIGRATION TRENDS
I. Main recent global migration trends
Stocks and trends
Approximately one in seven people today are migrants: 232 million people are

23
international migrants, or 3.2% of the world population, and 740 million are internal
migrants
Since 1990, the number of international migrants increased by 65% (53 million) in
the global North, and by 34% (24 million) in the global South (UN-DESA). While
the number of international migrants has increased in absolute terms, the share of
international migrants in the world population has remained fairly constant in the
same period, oscillating around 3%.
The share of international migrants in the total population varies widely across
countries: it is above 50% in some of the Gulf Cooperation Council countries
(GCC) such as the United Arab Emirates (84%), Qatar (74%), Kuwait (60%) and
Bahrain (55%) and is relatively high in traditional destination countries like
Australia (28%) and Canada (21%). In main destination countries in Europe,
namely Spain, Germany, the United Kingdom, France and Italy, it usually stands
between 10 and 12%2, but in Sweden it is 16%.
Women account for 48% of the global migrant stock. Migrants in the North are on
average older than migrants in the South (42 years as median age in the North, 33
in the South), and most international migrants are of working age (74% of the global
migrant stock; UN-DESA).
Forced migration
The number of forcibly displaced people has grown and the reality of global
displacement is increasingly complex. The number of people displaced by
violence and conflict today is the highest since World War II.
Refugees were estimated at 16.7 million by the end of 2013, up from 15.2

24
million in 2011 (UNHCR, 2014).
People internally displaced by conflict and violence were estimated at 33.3 million by
the end of 2013, up from 26.4 million in 2011 (IDMC, 2014).
Over 50% of the world’s refugees live scattered in urban areas and rural communities, not in
refugee camps or “protracted refugee situations.” By 2013, an estimated two-thirds of the world’s
refugees had been in exile for over 5 years, and half of them were children (UNHCR, 2014).
Palestinians constitute the largest refugee group worldwide. Other main countries of
origin of refugees in 2013 were Afghanistan, Syrian Arab Republic, Somalia, Sudan,
the Democratic Republic of the Congo, and the Central African Republic.
At least 1,067,500 people submitted asylum applications in 2013. The main
recipients of new individual applications were Germany, the United States of
America, South Africa, France and Sweden. Syrian Arab Republic is the main
country of origin of asylum-seekers in industrialized countries, followed by Iraq,
Afghanistan and Eritrea (UNHCR, 2014).
Over 86% of world’s refugees were being hosted by developing countries at the end
of 2013. Pakistan and the Islamic Republic of Iran are the main host countries in
absolute terms (1.6 million and over 850,000 refugees respectively), followed by
Lebanon (over 856,000), Jordan (over 640,000) and Turkey (almost 610,000;
UNCHR, 2014).
Situations change dramatically in a very short time span: 500,000 people were
displaced in Iraq just in a few days in mid-June 2014 (IDMC, 2014). According to
IOM data from the Displacement Tracking Matrix (DTM), over 1.7 million people
were newly displaced by conflict in Iraq between 1 January and 28 September, 2014.
Figure 1 – Force d migration f igure s, 2009 - 2013 (million)

25
Source: UNHCR (2014) and IDMC (2014).
21.9 million people were newly displaced by disasters in 2013 (IDMC, 2014). The
figure was 32.4 million in 2012, 15 million in 2011, 42.4 million in 2010, 16.7 million
in 2009 and 36.5 million in 2008, meaning that 128.4 million people were newly
displaced by disasters between 2008 and 2013, an average of 27.5 million people a year.
87.2% of disaster-induced displacement in 2013 occurred in Asia (19.1 million
people), followed by 8.2% in Africa (1.8 million people) and 4.1% in the Americas
(892,000). The countries with the highest absolute levels of displacement in the period
between 2008 and 2013 were China (over 54 million people), India (over 26 million),
the Philippines (over 19 million), Pakistan (over 13 million) and Bangladesh (almost 7
million).
The great majority of displaced people have been uprooted by weather-related
disasters, only a small minority by geophysical hazards.
Data on the impact of gradual environmental change on migration is less often collected.
Rising numbers of migrants are moving into urban areas which are vulnerable to climate
change. The foreign-born population in Buenos Aires reached almost 400,000 people in 2010,
2009 2010 2011 2012 2013
IDPs newly displaced by disasters IDPs displaced by violence and conflict
26.42733.3
28.815.227.5
15.2
16.757.50.915.41
731.177.515.4Total
59.970
60
50
40
30
20
0.986.20.9
100
90
1516.7 21.932.442.4

26
and internal migrants were over 770,000. In Nairobi, international migrants make up almost
2% of the city population (3 million)3. According to the last population census conducted in
China in 2010, over 1 million people from outside mainland China were residing in the
country, including almost 600,000 foreigners4. In India, the migration rate in urban areas in
2007-2008 was 35%, and 2011 census data showed that for the first time India’s urban
population grew faster than its rural population, mostly due to rural-urban migration.
Irregular migration
Difficulties remain to establish the extent of irregular migration, though this is
believed to be significant. The most recent estimates suggest that there are at least 50
million irregular migrants in the world – over one fifth of all international migrants – a
significant number of whom paid for assistance to illegally cross borders (UN). An
estimated 3 million people illegally enter the US each year, mostly smuggled across the
border (UNODC).
Data on apprehensions along international borders, a proxy of the mismatch between
desire to migrate and legal opportunities to do so, remain high. Detections of illegal
border crossing at the European Union’s external borders increased by 48% between
2012 and 2013, from 75,000 to over 107,000. Syrians, Eritreans and Afghans were the
most commonly detected nationalities, with Syrians making up almost a quarter of all
arrivals in 2013 (Frontex).
In 2013, there were about 345,000 detections of illegal stay in the EU. The trend over
the past five years has been generally stable if not slightly declining (Frontex).
Some 55,000 migrants are estimated to be smuggled from East, North and West
Africa into Europe every year (UNODC, 2010).
The number of irregular migrants living in the U.S. was estimated at 11.1 million in
2011 (Pew Hispanic Center, 2013).
92,500 people were detained for immigration reasons in the EU during 2013 (European
Migration Network, 2014). France detained the highest number of non-nationals in the EU
during the same year (38,266), followed by Spain (9,020), Hungary (6,469), Bulgaria
27
(6,303), and Belgium (6,285). The highest increase in the number of detained migrants in
2009-2013 was registered in Bulgaria and Hungary, while the number decreased in Slovakia
and the Netherlands. The average length of detention across EU Member States was 40 days.
Human Trafficking and Forced Labour
According to the U.S. State Department’s Trafficking in Persons report, the number
of identified victims of trafficking at the global level was over 44,500 in 2013. The
lack of uniformity in national reporting structures makes it impossible to collect
accurate figures
The number of identified victims has increased in all regions, and convictions
represent only a small proportion of identified cases (Figure 2).
Figure 2 – Identified victims of human trafficking and number of convictions by
region, 2008 and 2013
Region Identified victims in
2008 (of which
convictions)
Identified victims in
2013
Western Hemisphere6 6609
(161)
7818
(446)
South and Central Asia7 3510
(342)
7124
(974)
Near East8 688
(26)
1460
(60)
Europe9 8981
(1721)
10374
(2684)
East Asia and Pacific 3374
(643)
7886
(1271)
Africa 7799
(90)
10096
(341)
Source: US State Department Trafficking in Persons Report 2014.

28
An estimated 20.9 million people are victims of forced labour globally (ILO, 2014).
This is twice the 2004 estimate of 12.3 million people (ILO, 2005). ILO estimates
include victims of human trafficking for labour and sexual exploitation. The actual
number of trafficked victims remains unknown.
11.4 million victims of forced labour are women and girls, 9.5 million men and boys.
4.5 million are victims of forced sexual exploitation, 98% of which are women and
girls. The percentage of detected child victims has increased from 20% in 2003-2006 to
27% in 2007-2010.
Forced labour in the private economy – concerning 19 million individuals – generates
150 billion USD in illegal profits annually (ILO estimates). UN estimates for 2005
suggested the total market value of illicit human trafficking was around 32 billion USD.
Migrant deaths
IOM estimated that between January and early December 2014 over 4,900 migrants
died or went missing attempting to reach destinations around the world. This figure for
the whole of 2013 was of 2,400 recorded deaths.
Of the total recorded fatalities, over 3,200 occurred in the Mediterranean, making
this the deadliest route worldwide (66% of the total). An estimated 11% of deaths
globally this year occurred in the Bay of Bengal, 6% in the Horn of Africa (the vast
majority during sea crossings in Yemen), and 6% along the U.S.-Mexico border. Over
85% recorded up to early December occurred along sea routes.

29
Figure 3 – Region in which death occurred, 1 January – 8 December, 2014
Region Recorded deaths
Mediterranean 3224
North America 307
East Africa 251
Horn of Africa 265
Bay of Bengal 540
Southeast Asia 74
Caribbean 66
Sahara 56
Other Europe 51
Other Regions 34
TOTAL 4,868Source: IOM calculations based on various sources including media reports, information
gathered by IOM Field Offices, data from medical examiner offices, UNHCR (for
figures on the Bay of Bengal), and US Border Patrol.
Globally, migrants who lost their lives are mainly from Africa and the Middle East: 27% from
sub- Saharan Africa, 19% from the Middle East and North Africa, 13% from the Horn of
Africa. A large share of those whose region of origin is unknown is likely to be from Africa or
the Middle East as well, so the above figures are likely higher.
IOM estimates that over 40,000 migrants have died in transit since 2000.
According to IOM calculations based on The Migrant Files data, over 22,400 of
them have lost their lives trying to reach Europe.
Existing figures may greatly underestimate the real number of dead migrants, given
the number of people who go missing and are never found. Experts estimate that for
every dead body found there are at least two others that are never recorded.

30
Figure 4 – Regional estimates of migrant border-related deaths as compiled by various
sources
Region N. of deaths Period Source
Sahara 1,790 1996-
2013
Fortress Europe
US-Mexico border 6,029 1998-
2013
US Border Patrol
European external
borders
22,394 2000-
2014
IOM based on The Migrant
Files
Australian waters 1,495 2000-
2014
Australian Border Deaths
Database
Horn of Africa 3,104 2006-
2014
UNHCR; IOM for 2014
Bay of Bengal 1,500-2000 2012-
2014
UNHCR; Arakan Project
Caribbean 188 2012-
2014
UNHCR; IOM for 2014
Source: IOM, 2014
Remittances
There has been an exponential growth in remittances but transfer costs remain high.
The link between rising remittances and the relatively stable stock of migrants needs
to be explored.
The World Bank estimated that remittances to developing countries amounted to 404
billion USD in 2013, up by 3.5% relative to the previous year (World Bank).

31
Growth in remittance flows to developing countries is expected to accelerate at an annual
average of 8.4% per year over the next 3 years. Remittances to developing countries are
projected to grow by 5% and reach 435 billion USD in 2014, and increase further by
4.4% to 454 billion in 2015.
However, recent research suggests that much of the recorded increase in remittances to
developing countries is due to better reporting systems and changes in the ways remittances
have been measured over time, and might therefore not be as high as often claimed
(McKenzie and Clemens, 2014).
The global average cost of sending remittances fell to 7.9% of the value sent in the
third quarter of 2014 from 8.9% in the same period last year. Efforts to reduce the
cost of remittances have resulted in estimated savings to migrants and their families
of 42.5 billion USD over the period 2009-2013 (World Bank, 2013).
Yet more remains to be done: in 173 corridors (78% of those surveyed), average
costs of transmitting remittances are above 5%, while only in 47 corridors remittance
costs are below 5%. Sub-Saharan Africa is the costliest region to which to send
remittances (11.3% of value sent).
Changing geography of international migration
South-South migration slightly exceeds South-North migration. In 2013, 82.3 million
international migrants who were born in developing countries resided in
developing countries, while 81.9 million international migrants born in developing
countries were living in developed countries (OECD, UN-DESA, 2013).

32
Figure 5 – Remittances to low-, middle- and high-income countries, 2012-2016 (US
billion dollars)
Source: World Bank. *Forecast.
Figure 6 – Distribution of international migrants by origin and destination, 2013
Direction Stock
(million)
% of total migrant stock
South South 82.3 36%
South North 81.9 35%
North North 53.7 23%
North South 13.7 6%
Source: UN-DESA, 2013
2016*
High incomeLow-income countries
2014* 2015*
Middle-income
20132012
700
600
500
400
300
200
100
0

33
About 50% of international migrants reside in 10 countries. The U.S. is the first
destination country (45.8 million in 2013), followed by the Russian Federation (11
million), Germany (9.8 million), Saudi Arabia (9.1 million), the United Arab
Emirates and the United Kingdom (7.8 million each), France (7.5 million), Canada
(7.3 million), Australia and Spain (6.5 million each; UN-DESA, 2013).
Within OECD countries, permanent labour migration is falling, particularly due to
recession in Italy and Spain. Germany is the second country of destination in the
OECD after the U.S., and migration to the country is increasing. Intra-EU migration
is also growing but migration trends vary widely across OECD countries (OECD,
2014).
There are new countries of destination globally, and more and more migrants are
concentrated in cities, often within the same region: India and China continue to be
important countries of origin, particularly for immigration in OECD countries. China
is increasingly a country of destination: the country’s international migrant stock
increased by more than 50% between 2000 and 2013. The annual rate of change of
international migrants in China between 2000 and 2013 was 3.9%, compared to
3% in 1990-2000. The same rate was 0.7% for Germany IN 2000-2013, compared to
4.2% in 1990-2000, and 2.1% for the U.S., compared to 4% in 1990-2000.

34
CHANGING GOVERNMENT APPROACH TO MIGRATION.
National immigration policies are arguably not increasingly restrictive
In 2011, among 195 countries with available data, 73% of governments either had
policies to maintain the current level of immigration or were not intervening to
change it, while 16% had policies to lower it and 11% had policies to raise it.
More and more governments have been increasingly open to regular migration in
the last 2 decades. Globally, the share of governments with policies to lower
immigration declined from 40% in 1996 to 16% in 2011, while those seeking to raise
immigration increased from 4% in 1996 to 11% in 2011.
In developed regions, the trend toward greater openness to immigration is
particularly pronounced. Only 10% of countries in 2011 implemented policies to
lower immigration, down from 60% in 1996.
In developing regions, the percentage of governments with policies to lower the level
of immigration declined to 18% in 2011 from 34% in 1996.
An increasing number of countries have adopted policies to promote the integration of non- nationals.
Integration policies were adopted by 62% of governments in 2011 (up from 44% in
1996). Such policies are more common in countries in developed regions than in
developing regions – 91% against 47% of countries respectively. Also 29% of least
developed countries adopted them.
Efforts to promote diaspora engagement are growing.
Many governments are encouraging diaspora members to become involved in the
development of their countries of origin – namely through mobilization of diaspora’s
financial resources, but also through promotion of investment in the origin country.
Out of 144 countries with available data on diaspora units in 2011, 114 had special
government units to deal with matters of interest to emigrants and their families
abroad.

35
Countries are increasingly selective towards migrant workers.
Many destination countries are adopting policies to attract highly skilled migrants
through facilitated conditions for admission and family reunification, and fewer
restrictions than for low- skilled migrants.
39% of governments globally had policies to encourage immigration of highly-skilled
workers in 2011, up from 22% in 2005.
In 2011, 60% of countries in developed regions had such policies (41% in 2005),
against 32% in developing regions (14% in 2005). The growing trend can be seen
even in the poorest regions (18% of countries in 2011, up from 6% in 2005).
A growing number of governments have attempted to address irregular migration by
reform of their immigration systems, promotion of return of irregular migrants or
regularization programmes. 75% of 146 countries with available data in 2011 thought
irregular migration was a major concern (developed and developing countries alike).
Labor migration: labour and skill shortages globally
Approximately 105 million people are international labour migrants (almost 50% of
the global migrant stock; ILO, 2014).
Immigrants from developing economies contributed an estimated 40% of labour force
growth in advanced economies between 1980 and 2010 (McKinsey Global Institute,
2012).
Particularly in the past few years, more workers have arrived with advanced skills;
e.g. by 2008, foreign-born workers constituted 17% of all employment in science,
technology, engineering and math occupations in the United States (Ibid).
By 2020, there will be a 38-40 million potential shortage of workers with tertiary
education (13% of demand), 45 million too few workers with secondary education
in developing countries, and 90-95 million more low-skill workers than employers
will need (11% oversupply; Ibid.).

36
The gap between demand and supply of high-skill workers is estimated to be
equivalent to 16-18 million workers in advanced economies, 23 million in China. The
total shortage for medium-skilled workers for the next 20 years is estimated at 45
million workers – 10 million in India, and 31 million in Young Developing
economies.
There will be estimated surpluses of low-skill workers, 32-35 million in advanced
economies, and 58 million in India and Young Developing economies. This means
that millions of people will be trapped in subsistence agriculture or urban poverty in
developing countries (namely India) if job opportunities at home or abroad are not
created for them.
According to research from the Boston Consulting Group13, Germany could experience a
labour shortage of up to 2.4 million workers by 2020. Australia could have a shortfall of
2.3 million workers by 2030. Brazil will have a shortage of up to 8.5 million workers by
2020. China is expected to have a surplus of 55.2 to 75.3 million workers by the same year,
but by 2030 the surplus could turn into a shortage of up to 24.5 million people. The U.S. is
expected to have a surplus of between 17.1 million and 22 million people in 2020. France,
Italy and the United Kingdom are projected to have surpluses in 2020 but face shortages
thereafter. South Africa has a projected surplus of 36% of the labour supply in 2020, and
expectations are it will grow to 39% by the following decade.
According to the Hays Global Skill Index (based on an analysis of main aspects
of labour markets in 30 countries), the US and Mexico had a high level of talent
mismatch in the Americas last year (available labour does not have the skills
employers want); they were followed by Canada, Chile, and Brazil. In the Asia-
Pacific region, Japan had the highest level of talent mismatch, followed by China. In
Europe, high levels of talent mismatch were found in Ireland, Spain, Portugal, the
United Kingdom and Hungary, but also moderately high in France, Denmark and
Sweden.
The Talent Shortage Survey 2014 carried out by the Manpower Group (obtained from
a survey of 37,000 employers in 42 countries and territories) revealed that 36% of

37
employers globally report difficulty in filling jobs, the highest proportion since 2007.
Regionally, employers reporting having difficulties in filling jobs were 48% in the
Americas, 45% in the Asia-Pacific region, and 27% in Europe, part of the Middle
East and South Africa.
Employers in the Americas are having difficulties in filling jobs as technicians,
skilled traders, engineers, sales managers and labourers; in countries in the Asia-
Pacific region, jobs as engineers, sales representatives, skilled traders, accounting
and finance staff, and sales managers were reported as the most difficult to fill. In
Europe, South Africa and part of the Middle East, employers listed skilled traders,
engineers, sales representatives, technicians and management/executives as the most
difficult positions to fill.
As for leading global economies, employers reporting difficulties in filling jobs were
12% in the United Kingdom, 21% in France, 24% in China, 40% in Germany and the
US, 64% in India and 81% in Japan. The top 10 countries that have difficulties in
filling jobs are Japan (81%), Peru (67%), India (64%), Argentina, Brazil and
Turkey (63%), New Zealand (59%), Panama (58%), Colombia (57%) and Hong
Kong, China (56%; Manpower Group, 2014).
Better data needed
The figures above present a snapshot of what we know about global migration trends.
There is a need for a concerted effort to collect more and better quality international
and internal migration data, in a systematic and consistent way, as well as make
better use of existing data in both crisis and non-crisis settings, in order to enhance
efforts to assist migrants, improve our understanding of the impact of migration on
development of countries of origin and destination, as well as on migrants
themselves, and our capacity to help countries design and implement evidence-based
migration and development policies.
European migrant crisisThe European migrant crisis or European refugee crisis began in 2015, when a rising number
of refugees andmigrants made the journey to the European Union (EU) to seek asylum, travelling
across the Mediterranean Sea or through Southeast Europe. They came from areas such

38
as Western and South Asia, Africa,[11][12] and the Western Balkans.[13] According to the United
Nations High Commissioner for Refugees, the top three nationalities of the over one million
Mediterranean Sea arrivals in 2015 were Syrian (49%), Afghan (21%) and Iraqi (8%). Of the
refugees and migrants arriving in Europe by sea in 2015, 58% were men, 17% women and 25%
children.[14][15] The phrases "European migrant crisis" and "European refugee crisis" became
widely used in April 2015,[citation needed] when five boats carrying almost 2,000 migrants to
Europe sank in the Mediterranean Sea, with a combined death toll estimated at more than 1,200
people.
The shipwrecks took place in a context of ongoing conflicts and refugee crises in several Asian
and African countries, which increased the total number of forcibly displaced people worldwide at
the end of 2014 to almost 60 million, the highest level since World War II.[16][17] Amid an upsurge
in the number of sea arrivals in Italy from Libya in 2014, several European Union governments
refused to fund the Italian-run rescue option Operation Mare Nostrum, which was replaced
by Frontex's Operation Triton in November 2014. In the first six months of 2015, Greece
overtook Italy as the first EU country of arrival, becoming, in the summer 2015, the starting point
of a flow of refugees and migrants moving through Balkan countries to northern European
countries, mainly Germany and Sweden. Since April 2015, the European Union has struggled to
cope with the crisis, increasing funding for border patrol operations in the Mediterranean,
devising plans to fight migrant smuggling, launching Operation Sophia and proposing a new
quota system to relocate and resettle asylum seekers among EU states and alleviate the burden on
countries on the external borders of the Union. Individual countries have at times reintroduced
border controls within the Schengen Area, and rifts have emerged between countries willing to
accept asylum seekers and others trying to discourage their arrival.
According to Eurostat, EU member states received 626,000 asylum applications in 2014, the
highest number since the 672,000 applications received in 1992, and granted protection status to
more than 185,000 asylum seekers. The number of asylum applications doubled to 1,221,855 in
2015. Four states – Germany, Sweden, Italy, and France – received around two-thirds of the EU's
asylum applications and granted almost two-thirds of protection status in 2014; while Sweden,
Hungary, and Austria were among the top recipients of EU asylum applications per capita.

39
More than a million migrants and refugees crossed into Europe in 2015, sparking a crisis as
countries struggle to cope with the influx, and creating division in the EU over how best to deal
with resettling people. The symbolic milestone was passed on 21 December, the International
Organisation for Migration (IOM) said, with the total for land and sea reaching more than
1,006,000. The figure covers entries via six European Union nations - Greece, Bulgaria, Italy,
Spain, Malta and Cyprus. The vast majority arrived by sea but about 34,000 made their way over
land via Turkey.
Winter has not stemmed the flow of people - with 80,754 people reaching Europe by sea since the
start of 2016. Although not all of those arriving claim asylum, more than 942,400 people have
done so in the EU, according to monthly figures from the EU statistics agency, Eurostat. Germany
received the highest number of new asylum applications, with more than 315,000 by the end of
October 2015. But far more people have arrived in the country - German officials said more than
a million had been counted in Germany's "EASY" system for counting and distributing people
before they make asylum claims. This includes a large number from the Balkan states who are not
counted in the sea arrivals. Hungary moved into second place for asylum applications, as more
migrants have tried to make the journey overland through Greece and the Western Balkans. It
had 174,055applications by the end of October. Although Germany has had the most asylum
applications in 2015, Sweden had the highest in proportion to its population, More than 1,575
refugees per 100,000 of Sweden's local population claimed asylum in 2015. Hungary followed
close behind with 1,508 per 100,000, despite having closed its border with Croatia in an attempt
to stop the flow in October. The figure for Germany was 520 and for the UK it was 42
applications for every 100,000 residents.
Resettlement plan
Tensions in the EU have been rising because of the disproportionate burden faced by some
countries, particularly Greece, Italy and Hungary where migrants have been arriving by boat
and overland.
In September, EU ministers voted by a majority to relocate 120,000 refugees EU-wide, but for
now the plan will only apply to 66,000 who are in Italy and Greece.

40
The other 54,000 were to be moved from Hungary, but now this number will be held "in reserve",
until the governments decide where they should go.
The UK has opted out of any plans for a quota system but, according to Home Office figures,
1,000 Syrian refugees have been resettled under the Vulnerable Persons Relocation scheme.
Prime Minister David Cameron has said the UK will accept up to 20,000 refugees from Syria over
the next five years.
Granting asylum
Although huge numbers have been applying for asylum, the number of people being given asylum
is far lower. In 2014, EU countries offered asylum to 184,665 refugees. In the same year, more
than 570,000 migrants applied for asylum - although applying for asylum can be a lengthy
procedure so many of those given refugee status may have applied in previous years.
In the year to the end of September, the UK has granted asylum or another form or protection to
1,868 Syrians.
Impact of the Syrian crisis
Asylum applications from Syrians in Europe surged in 2015, fuelled by the country's vicious civil
war which began more than four years ago and shows no sign of ending. The vast majority of
refugees have fled to neighbouring countries such as Turkey, Lebanon and Jordan, and the
number of Syrians there far outweighs those who have made the difficult journey to Europe.
Migrants redistributed within Germany
Germany is currently the preferred destination for tens of thousands of migrants in central Europe.
It is expected to receive up to 800,000 asylum-seekers this year, four times the figure for 2014.
Germany has a quota system which redistributes asylum seekers around its federal states based on
their tax income and existing population density.

41
CONCLUSION
The EU will remain vulnerable geographically to mass migrations sparked by pervasive conflict
and economic hardship in nearby regions. Such factors already have produced nearly a million
refugees and asylum-seekers from the Balkans within EU borders and this flow likely will
persist. Continuing economic pressures and political upheaval in parts of the FSU and North
Africa also will produce a steady flow. Difficult Choices Ahead. Most EU states will face
politically painful dilemmas requiring them to choose among substantially more liberal
immigration and integration policies or alternative economic and social policy remedies for their
looming labor and fiscal shortfalls. A failure to permit substantially increased migration is likely
to lead to growing labor and tax base shortfalls. It also threatens to undermine social safety nets
and constrain defense spending and force modernization in the absence of other compensatory
measures such as substantial pension reform and improvements in productivity. The EU’s
looming demographic and labor force imbalances are beginning to generate a reappraisal of its
restrictive immigration policies among the business community in particular. Segments of the
media and political parties also support an expanded temporary worker and limited permanent
immigrant programs.
Most recently, the European Commission called for expanded immigration to ensure future
growth and ensure the social contract. The beginnings of this trend are visible in the move by the
German government to loosen citizenship requirements and initiate a limited visa program for
high-tech workers; the Swiss Government’s success in defeating a referendum to limit
immigrants to 18 percent of the population; and the British Government’s loosening of
requirements for some immigrant categories.
The current debate on international migration and development has focused primarily on how
migrants can impact upon the development of countries of origin and destination through

42
transnational flows of capital and skills. The extent to which these flows of remittances and
talent have positive and negative consequences on development is still contested. Nevertheless,
the debate needs to move on to consider the likely impact of expected new patterns of
development on global migration. It is highly deceptive to apply the term “South-South “
migration to movements towards centres of dynamism not just in East Asia but in parts of Africa
and Latin America where those centres are coming to challenge the position of economies in the
so-called “North”. This process is likely to be irregular, with periods of standstill and even
reversal, but ultimately will bring about a transformation in the global economy and in the
resultant patterns of migration.
Future shifts in migration will be affected by the observed convergence in economies with the
evolution of a much more poly-centered economy and global migration system. Distinct regional
systems are likely to emerge that account for the majority of migrants but held together by a
global system of migrants for whom a global market for their skills exists. As societies become
more highly urbanized and populations age, a trend may emerge towards a decline in migration,
in terms of longer-term movements, but towards a rise in shorter-term mobility. People will
become less migratory but more mobile, paradoxical though that might seem. Mobility will be
highly complex in terms of types of movers as well as countries of origin and destination and the
impact of environmental change on migration will be felt primarily at the local and regional
levels. Tourists will be but one type of mover with a profound impact on local and global
development. Students, people moving for medical reasons, as well as those moving to undertake
short-term skilled and less skilled work all fall into these categories of mobility, which
increasingly come under the term “circular migration” or “circulation” (Skeldon, 2012a).
Managing and monitoring such systems of mobility will continue to present major challenges to
policymakers and analysts alike, not least because of a continued lack of timely and accurate data
on population movements both long-term and short-term. The paper stressed that despite some
progress, there is an urgent need to improve the collection and dissemination of timely and
comparable data on migration, both internal and international.

43
REFERENCES
https://en.wikipedia.org/wiki/European_migrant_crisis
Http://www.un.org/esa/population/publications/ReplMigED/chap2-Litrev.pdf
http://www.bbc.com/news/world-europe-34131911
http://www.cic.gc.ca/english/resources/statistics/facts2010/index.asp
http://www.pewsocialtrends.org/2013/12/17/
changingpatternsofglobalmigrationandremittances/sdt20131217globalmigration0104
Http://www.migrationpolicy.org/article/internal-labor-migration-india-raises-integration-
challenges-migrants
http://thehagueprocess.org/publications/migrant-refugee-integration-global-cities-role-
cities-businesses/