global macro and markets 2021 a synchronous global upturn?
TRANSCRIPT

Global macro and markets 2021
Rob Carnell
A synchronous global upturn?
February 2021

2
The big questions for 2021
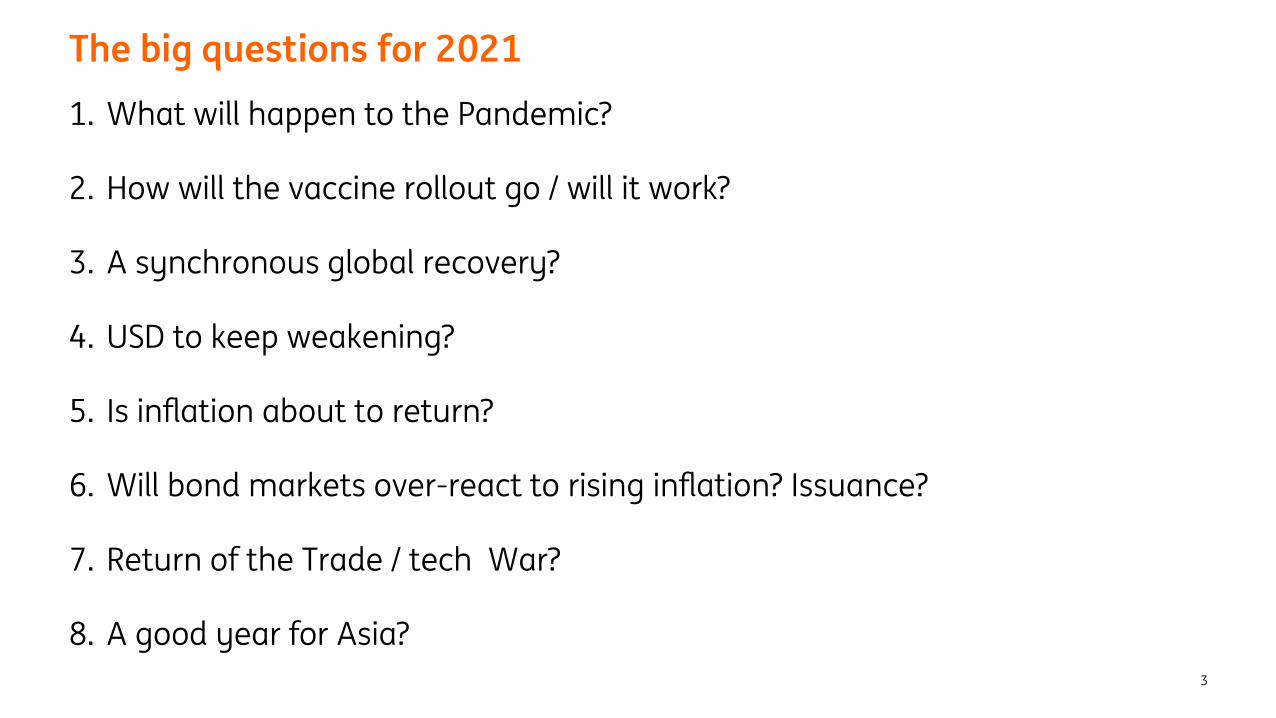
The big questions for 2021
1. What will happen to the Pandemic?
2. How will the vaccine rollout go / will it work?
3. A synchronous global recovery?
4. USD to keep weakening?
5. Is inflation about to return?
6. Will bond markets over-react to rising inflation? Issuance?
7. Return of the Trade / tech War?
8. A good year for Asia?
3
4
House Forecasts
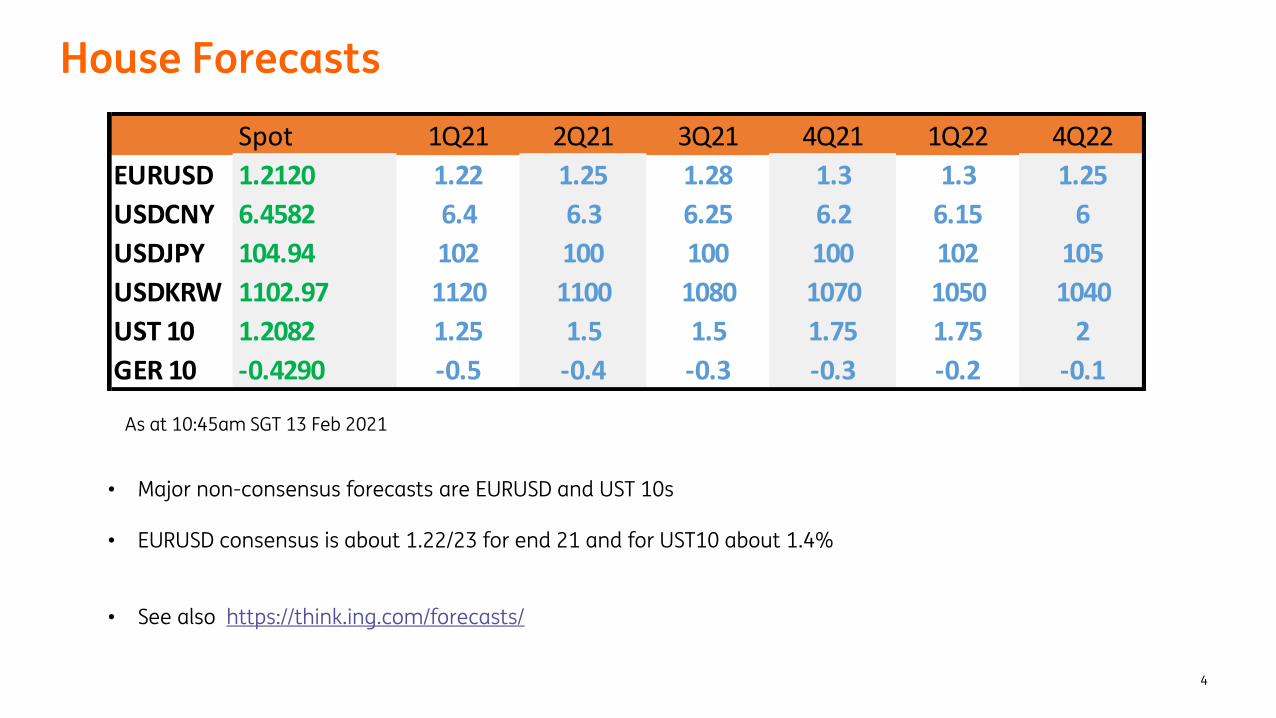
• Major non-consensus forecasts are EURUSD and UST 10s
• EURUSD consensus is about 1.22/23 for end 21 and for UST10 about 1.4%
• See also https://think.ing.com/forecasts/
Spot 1Q21 2Q21 3Q21 4Q21 1Q22 4Q22
EURUSD 1.2120 1.22 1.25 1.28 1.3 1.3 1.25
USDCNY 6.4582 6.4 6.3 6.25 6.2 6.15 6
USDJPY 104.94 102 100 100 100 102 105
USDKRW 1102.97 1120 1100 1080 1070 1050 1040
UST 10 1.2082 1.25 1.5 1.5 1.75 1.75 2
GER 10 -0.4290 -0.5 -0.4 -0.3 -0.3 -0.2 -0.1
As at 10:45am SGT 13 Feb 2021

5
Pandemic in 2021
Pandemic
6
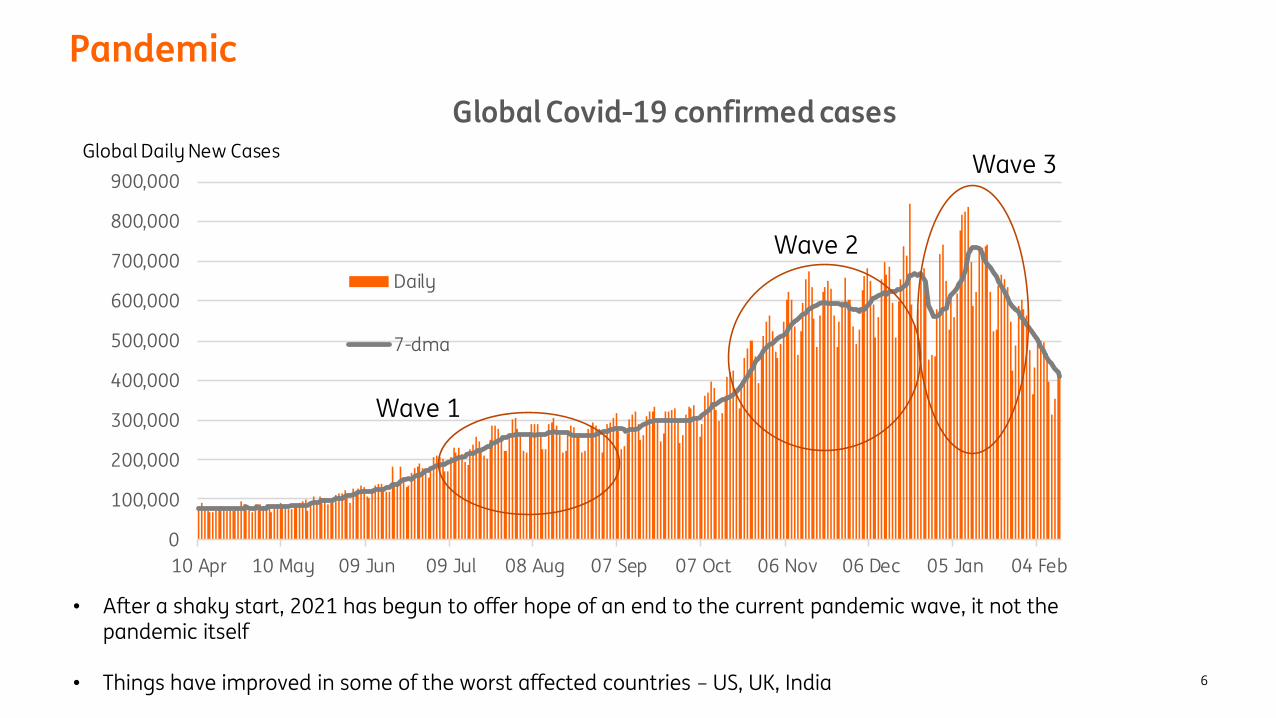
• After a shaky start, 2021 has begun to offer hope of an end to the current pandemic wave, it not the pandemic itself
• Things have improved in some of the worst affected countries – US, UK, India
0
100,000
200,000
300,000
400,000
500,000
600,000
700,000
800,000
900,000
10 Apr 10 May 09 Jun 09 Jul 08 Aug 07 Sep 07 Oct 06 Nov 06 Dec 05 Jan 04 Feb
Global Covid-19 confirmed cases
Daily
7-dma
Wave 1
Wave 2
Wave 3Global Daily New Cases
Pandemic Asia vs rest of the world
7
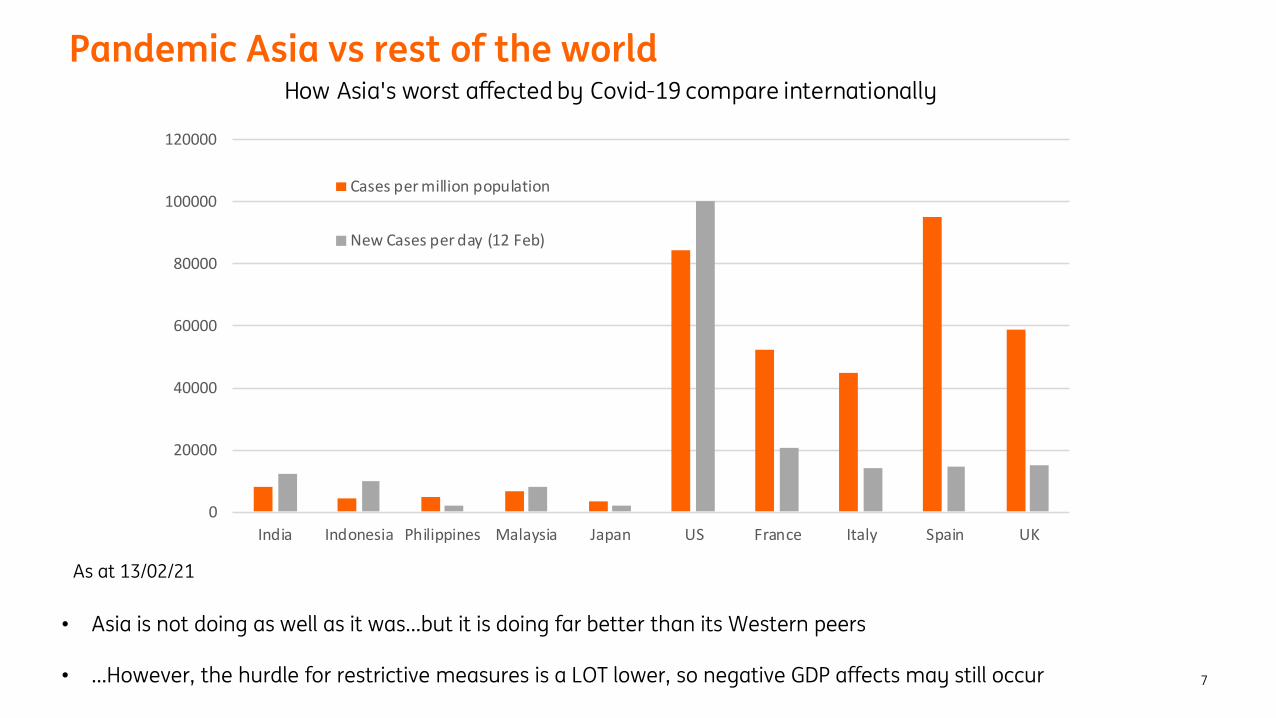
• Asia is not doing as well as it was…but it is doing far better than its Western peers
• …However, the hurdle for restrictive measures is a LOT lower, so negative GDP affects may still occur
0
20000
40000
60000
80000
100000
120000
India Indonesia Philippines Malaysia Japan US France Italy Spain UK
Cases per million population
New Cases per day (12 Feb)
How Asia's worst affected by Covid-19 compare internationally
As at 13/02/21

8
Vaccine Rollout
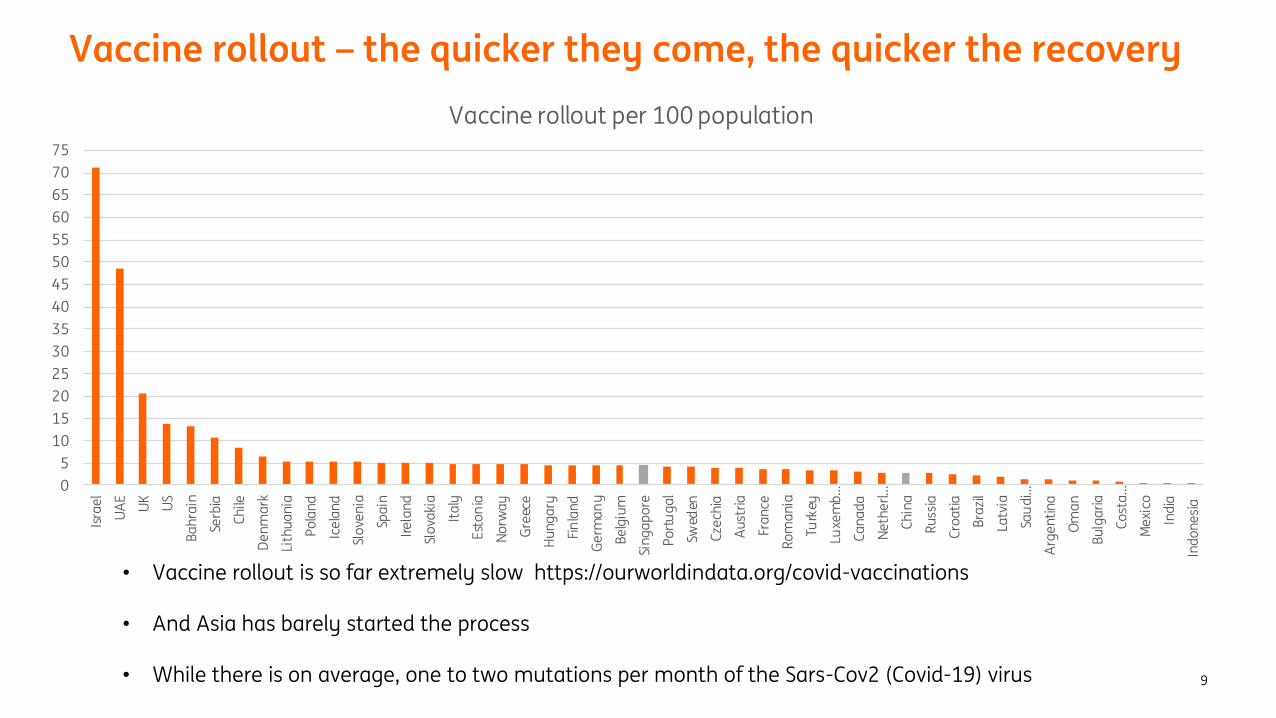
Vaccine rollout – the quicker they come, the quicker the recovery
9
0
5
10
15
20
25
30
35
40
45
50
55
60
65
70
75
Isra
el
UA
E
UK
US
Ba
hra
in
Serb
ia
Ch
ile
De
nm
ark
Lith
ua
nia
Po
lan
d
Ice
lan
d
Slo
ven
ia
Spa
in
Ire
lan
d
Slo
vaki
a
Ita
ly
Est
on
ia
No
rwa
y
Gre
ece
Hu
ng
ary
Fin
lan
d
Ge
rma
ny
Be
lgiu
m
Sin
ga
po
re
Po
rtu
ga
l
Swed
en
Cze
chia
Au
stri
a
Fra
nce
Ro
ma
nia
Turk
ey
Luxe
mb
…
Ca
na
da
Ne
the
rl…
Ch
ina
Ru
ssia
Cro
ati
a
Bra
zil
Latv
ia
Sau
di…
Arg
en
tin
a
Om
an
Bu
lga
ria
Co
sta
…
Me
xico
Ind
ia
Ind
on
esi
a
Vaccine rollout per 100 population
• Vaccine rollout is so far extremely slow https://ourworldindata.org/covid-vaccinations
• And Asia has barely started the process
• While there is on average, one to two mutations per month of the Sars-Cov2 (Covid-19) virus
10
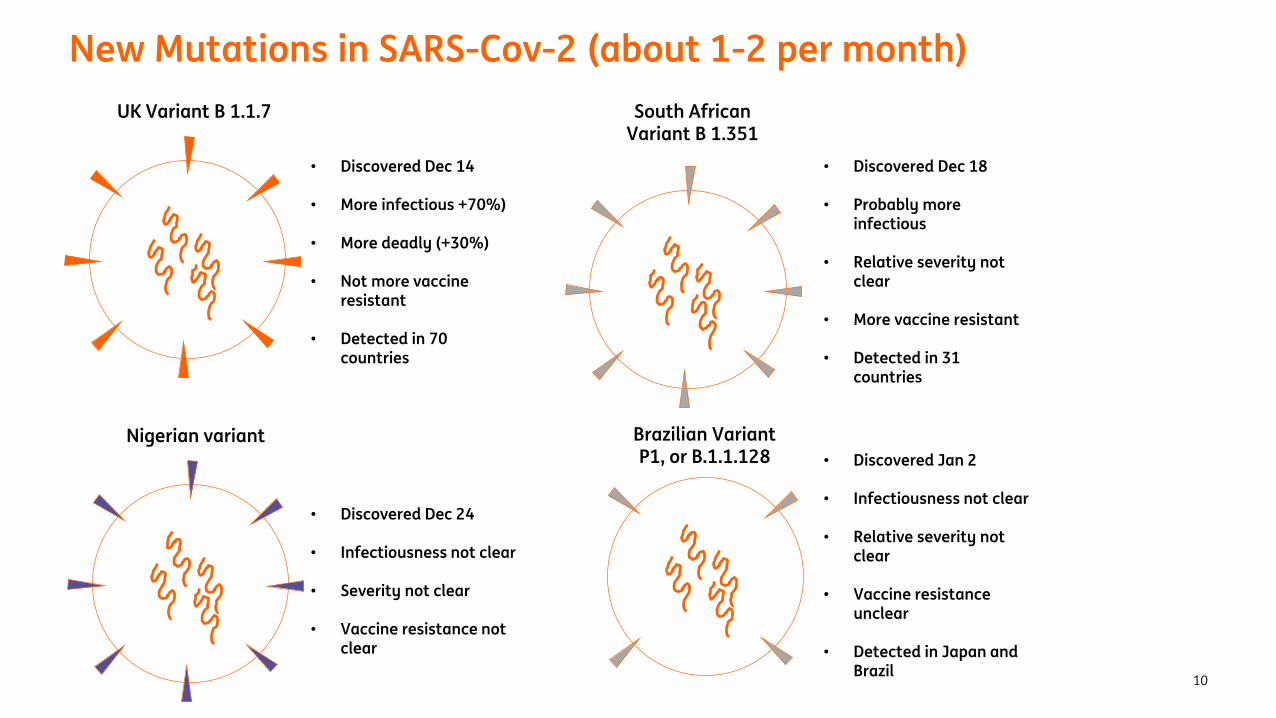
New Mutations in SARS-Cov-2 (about 1-2 per month)
UK Variant B 1.1.7
• Discovered Dec 14
• More infectious +70%)
• More deadly (+30%)
• Not more vaccine resistant
• Detected in 70 countries
South African Variant B 1.351
• Discovered Dec 18
• Probably more infectious
• Relative severity not clear
• More vaccine resistant
• Detected in 31 countries
Brazilian Variant P1, or B.1.1.128 • Discovered Jan 2
• Infectiousness not clear
• Relative severity not clear
• Vaccine resistance unclear
• Detected in Japan and Brazil
Nigerian variant
• Discovered Dec 24
• Infectiousness not clear
• Severity not clear
• Vaccine resistance not clear
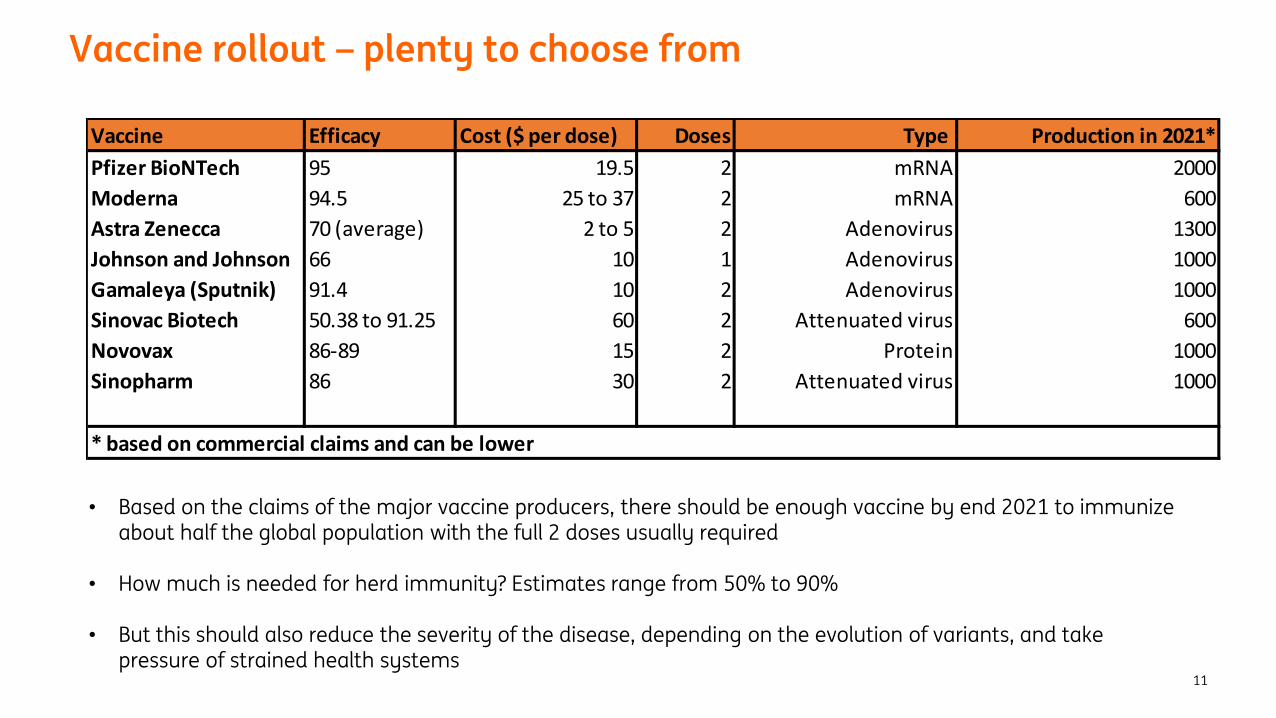
Vaccine rollout – plenty to choose from
11
• Based on the claims of the major vaccine producers, there should be enough vaccine by end 2021 to immunize about half the global population with the full 2 doses usually required
• How much is needed for herd immunity? Estimates range from 50% to 90%
• But this should also reduce the severity of the disease, depending on the evolution of variants, and take pressure of strained health systems
Vaccine Efficacy Cost ($ per dose) Doses Type Production in 2021*
Pfizer BioNTech 95 19.5 2 mRNA 2000
Moderna 94.5 25 to 37 2 mRNA 600
Astra Zenecca 70 (average) 2 to 5 2 Adenovirus 1300
Johnson and Johnson 66 10 1 Adenovirus 1000
Gamaleya (Sputnik) 91.4 10 2 Adenovirus 1000
Sinovac Biotech 50.38 to 91.25 60 2 Attenuated virus 600
Novovax 86-89 15 2 Protein 1000
Sinopharm 86 30 2 Attenuated virus 1000
* based on commercial claims and can be lower

12
Synchronous global recovery
13
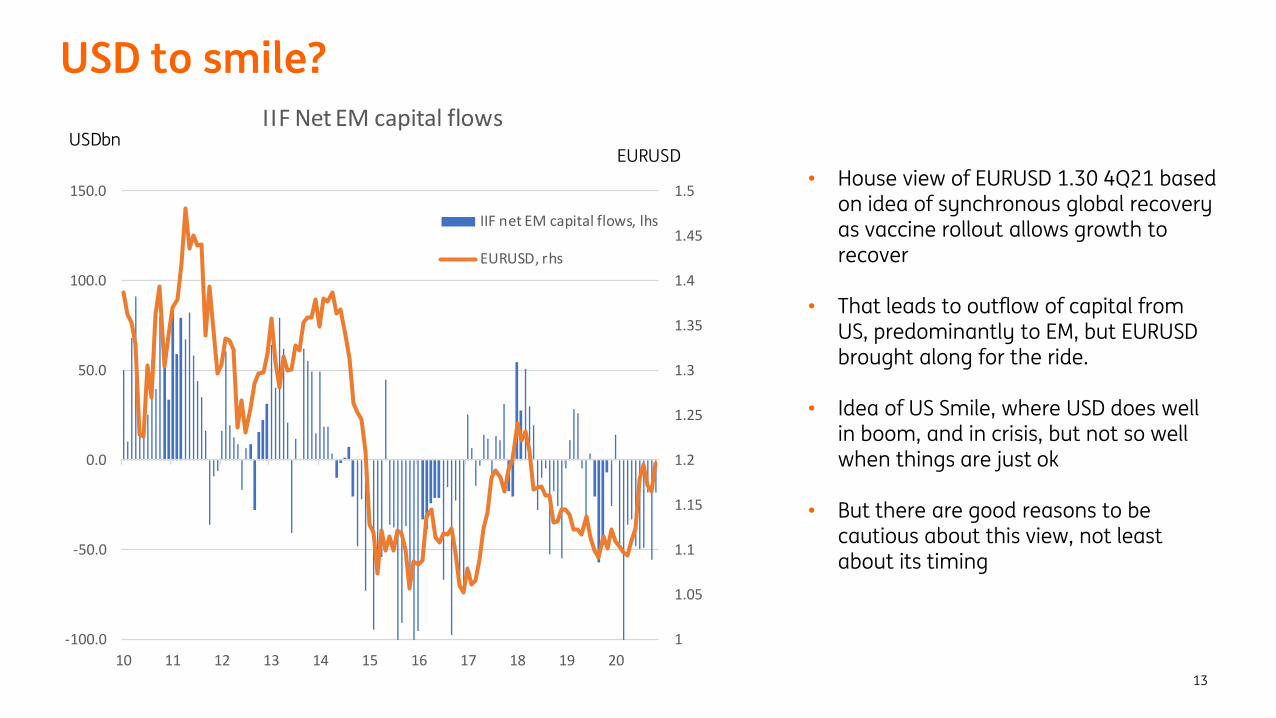
USD to smile?
• House view of EURUSD 1.30 4Q21 based on idea of synchronous global recovery as vaccine rollout allows growth to recover
• That leads to outflow of capital from US, predominantly to EM, but EURUSD brought along for the ride.
• Idea of US Smile, where USD does well in boom, and in crisis, but not so well when things are just ok
• But there are good reasons to be cautious about this view, not least about its timing
1
1.05
1.1
1.15
1.2
1.25
1.3
1.35
1.4
1.45
1.5
-100.0
-50.0
0.0
50.0
100.0
150.0
10 11 12 13 14 15 16 17 18 19 20
IIF Net EM capital flows
IIF net EM capital flows, lhs
EURUSD, rhs
USDbnEURUSD
14
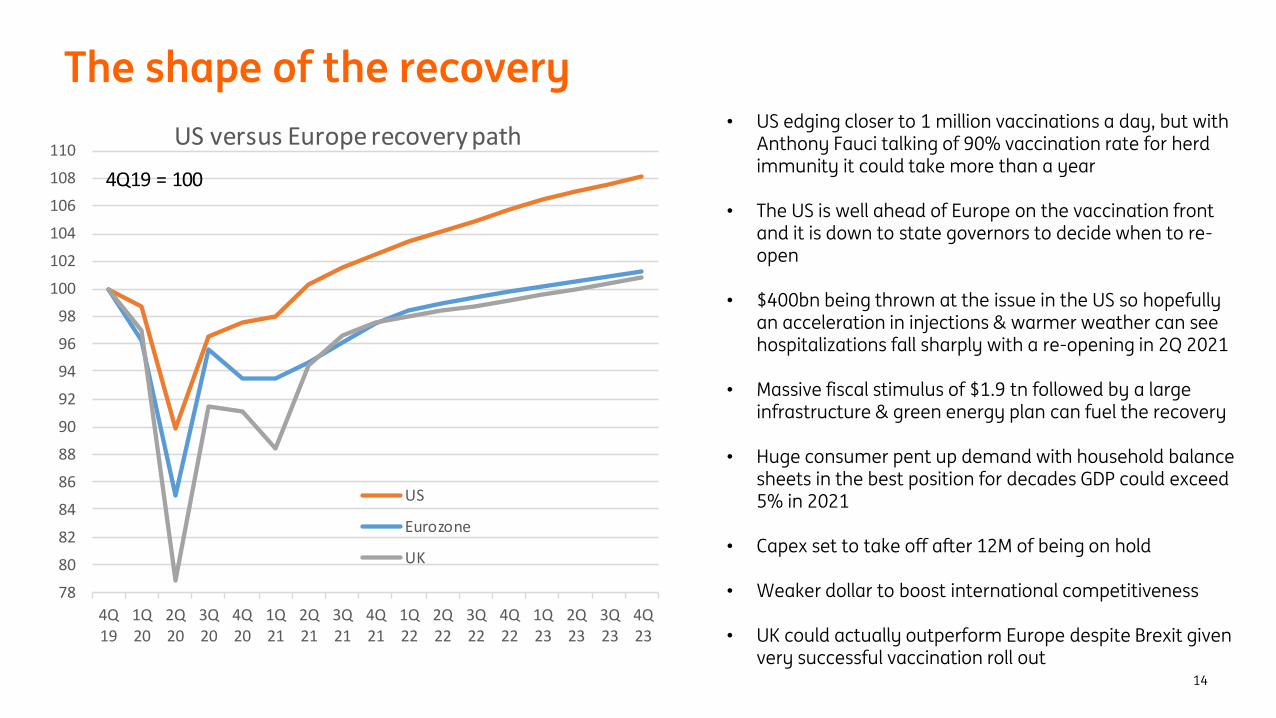
The shape of the recovery• US edging closer to 1 million vaccinations a day, but with
Anthony Fauci talking of 90% vaccination rate for herd immunity it could take more than a year
• The US is well ahead of Europe on the vaccination front and it is down to state governors to decide when to re-open
• $400bn being thrown at the issue in the US so hopefully an acceleration in injections & warmer weather can see hospitalizations fall sharply with a re-opening in 2Q 2021
• Massive fiscal stimulus of $1.9 tn followed by a large infrastructure & green energy plan can fuel the recovery
• Huge consumer pent up demand with household balance sheets in the best position for decades GDP could exceed 5% in 2021
• Capex set to take off after 12M of being on hold
• Weaker dollar to boost international competitiveness
• UK could actually outperform Europe despite Brexit given very successful vaccination roll out
78
80
82
84
86
88
90
92
94
96
98
100
102
104
106
108
110
4Q19
1Q20
2Q20
3Q20
4Q20
1Q21
2Q21
3Q21
4Q21
1Q22
2Q22
3Q22
4Q22
1Q23
2Q23
3Q23
4Q23
US versus Europe recovery path
US
Eurozone
UK
4Q19 = 100
15
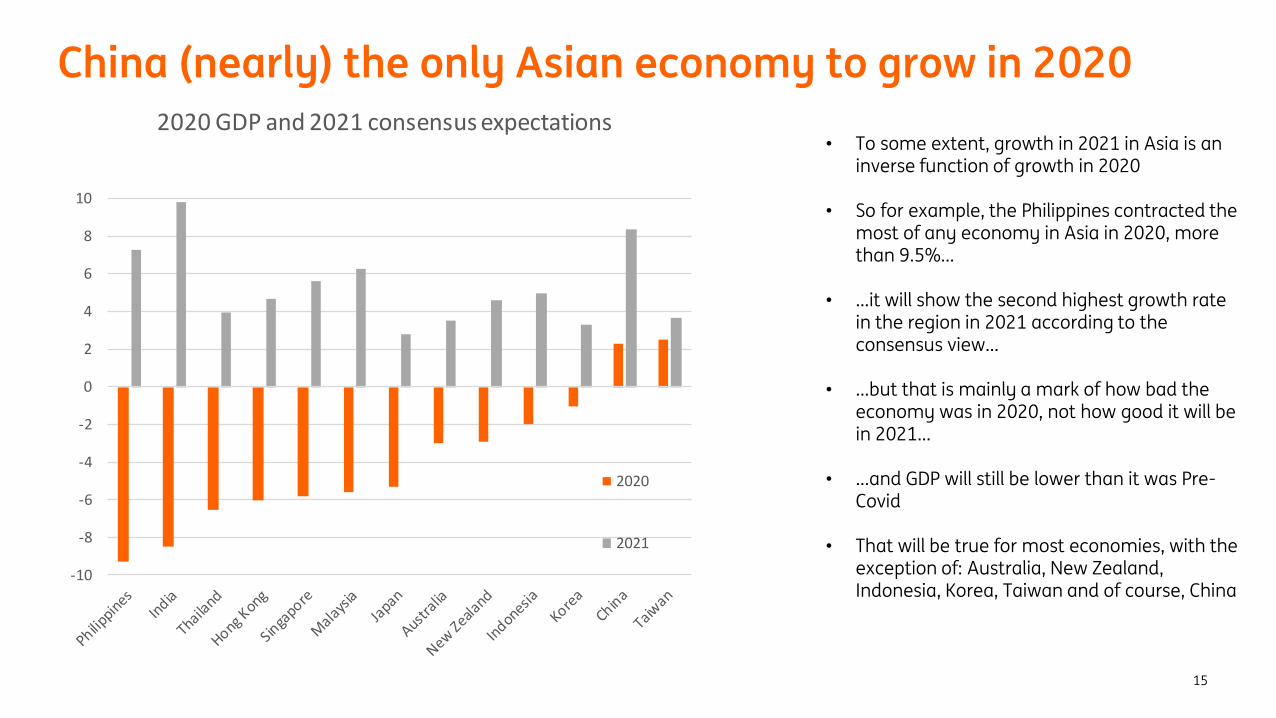
China (nearly) the only Asian economy to grow in 2020
• To some extent, growth in 2021 in Asia is an inverse function of growth in 2020
• So for example, the Philippines contracted the most of any economy in Asia in 2020, more than 9.5%...
• …it will show the second highest growth rate in the region in 2021 according to the consensus view…
• …but that is mainly a mark of how bad the economy was in 2020, not how good it will be in 2021…
• …and GDP will still be lower than it was Pre-Covid
• That will be true for most economies, with the exception of: Australia, New Zealand, Indonesia, Korea, Taiwan and of course, China
-10
-8
-6
-4
-2
0
2
4
6
8
10
2020 GDP and 2021 consensus expectations
2020
2021

16
Is inflation about to return?
17
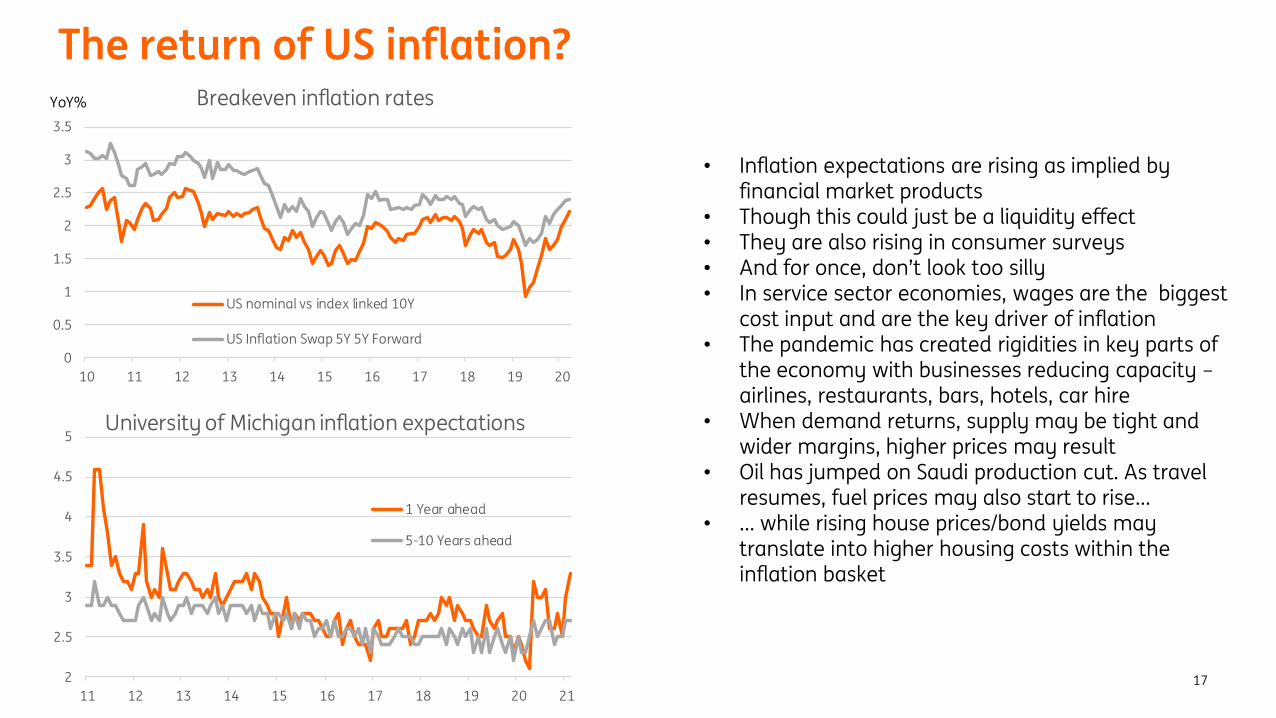
The return of US inflation?
• Inflation expectations are rising as implied by financial market products
• Though this could just be a liquidity effect• They are also rising in consumer surveys• And for once, don’t look too silly• In service sector economies, wages are the biggest
cost input and are the key driver of inflation• The pandemic has created rigidities in key parts of
the economy with businesses reducing capacity –airlines, restaurants, bars, hotels, car hire
• When demand returns, supply may be tight and wider margins, higher prices may result
• Oil has jumped on Saudi production cut. As travel resumes, fuel prices may also start to rise…
• … while rising house prices/bond yields may translate into higher housing costs within the inflation basket
0
0.5
1
1.5
2
2.5
3
3.5
10 11 12 13 14 15 16 17 18 19 20
Breakeven inflation rates
US nominal vs index linked 10Y
US Inflation Swap 5Y 5Y Forward
YoY%
2
2.5
3
3.5
4
4.5
5
11 12 13 14 15 16 17 18 19 20 21
University of Michigan inflation expectations
1 Year ahead
5-10 Years ahead
18
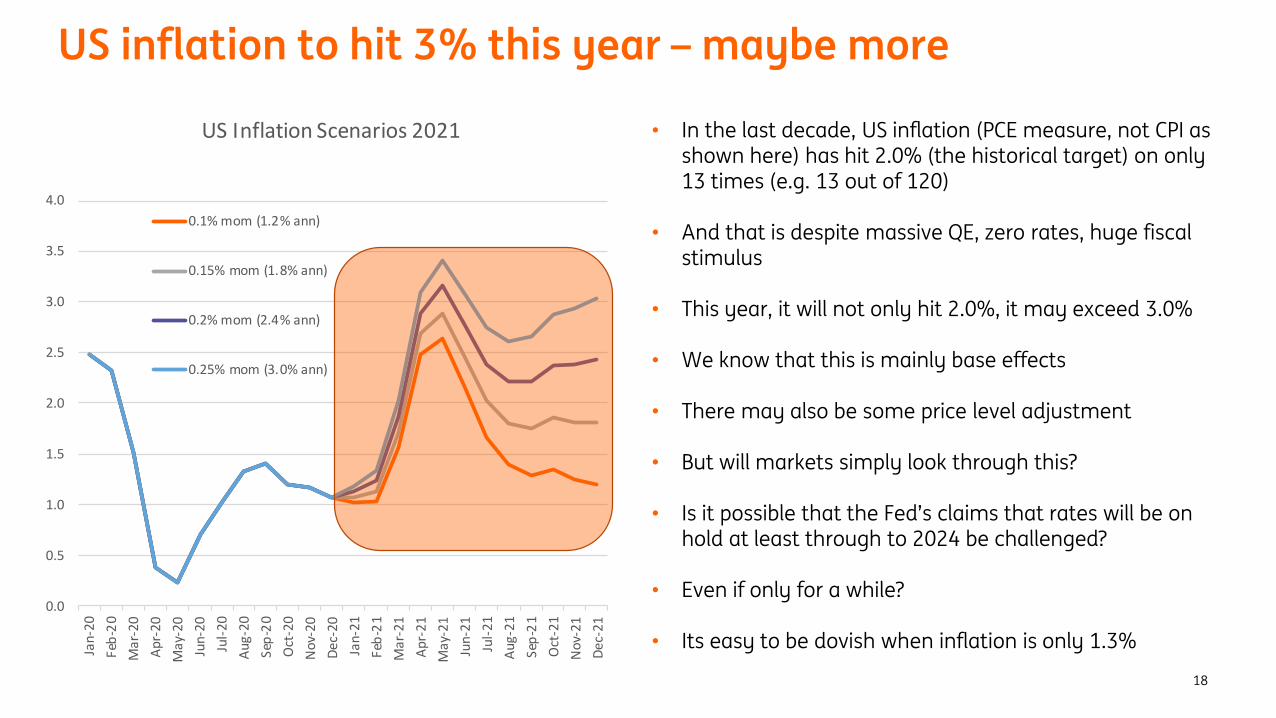
US inflation to hit 3% this year – maybe more
• In the last decade, US inflation (PCE measure, not CPI as shown here) has hit 2.0% (the historical target) on only 13 times (e.g. 13 out of 120)
• And that is despite massive QE, zero rates, huge fiscal stimulus
• This year, it will not only hit 2.0%, it may exceed 3.0%
• We know that this is mainly base effects
• There may also be some price level adjustment
• But will markets simply look through this?
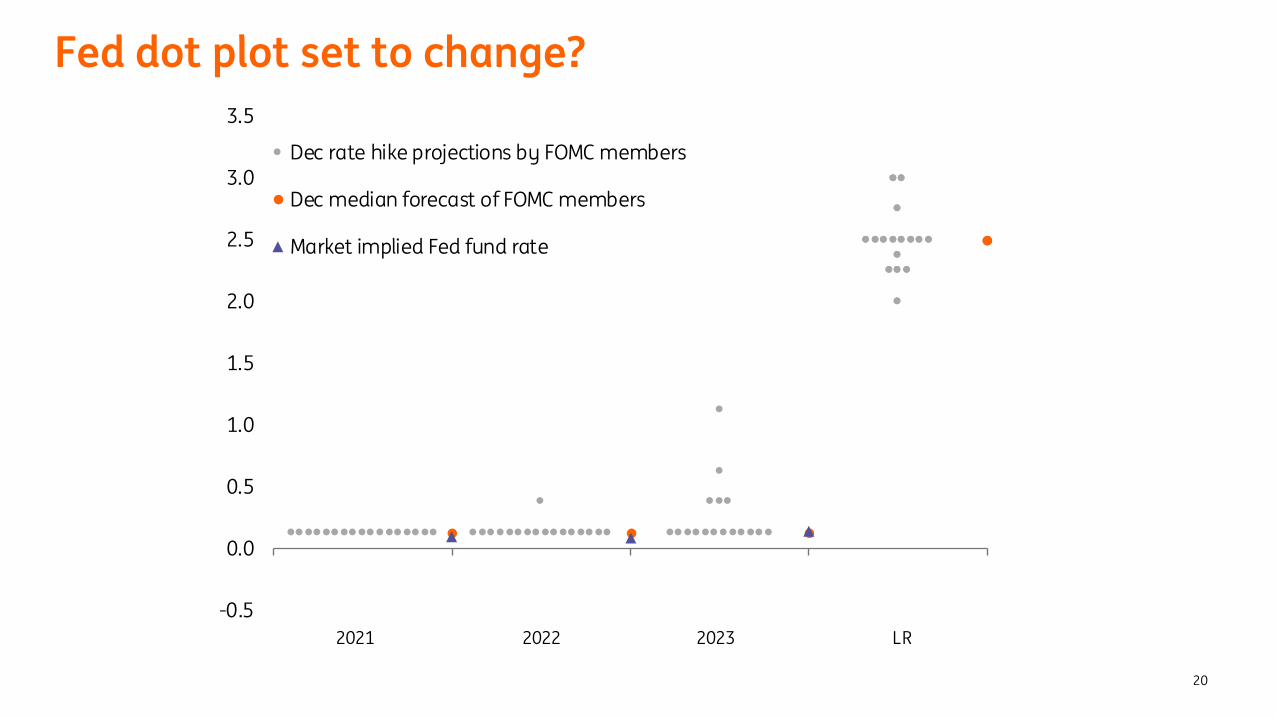
• Is it possible that the Fed’s claims that rates will be on hold at least through to 2024 be challenged?
• Even if only for a while?
• Its easy to be dovish when inflation is only 1.3%
0.0
0.5
1.0
1.5
2.0
2.5
3.0
3.5
4.0
Jan
-20
Feb
-20
Mar
-20
Ap
r-2
0
May
-20
Jun
-20
Jul-
20
Au
g-2
0
Sep
-20
Oct
-20
Nov
-20
Dec
-20
Jan
-21
Feb
-21
Mar
-21
Ap
r-2
1
May
-21
Jun
-21
Jul-
21
Au
g-2
1
Sep
-21
Oct
-21
Nov
-21
Dec
-21
US Inflation Scenarios 2021
0.1% mom (1.2% ann)
0.15% mom (1.8% ann)
0.2% mom (2.4% ann)
0.25% mom (3.0% ann)
19
Bond market response to inflation – over-reaction?
20
Fed dot plot set to change?
-0.5
0.0
0.5
1.0
1.5
2.0
2.5
3.0
3.5
Dec rate hike projections by FOMC members
Dec median forecast of FOMC members
Market implied Fed fund rate
2021 2022 2023 LR
21
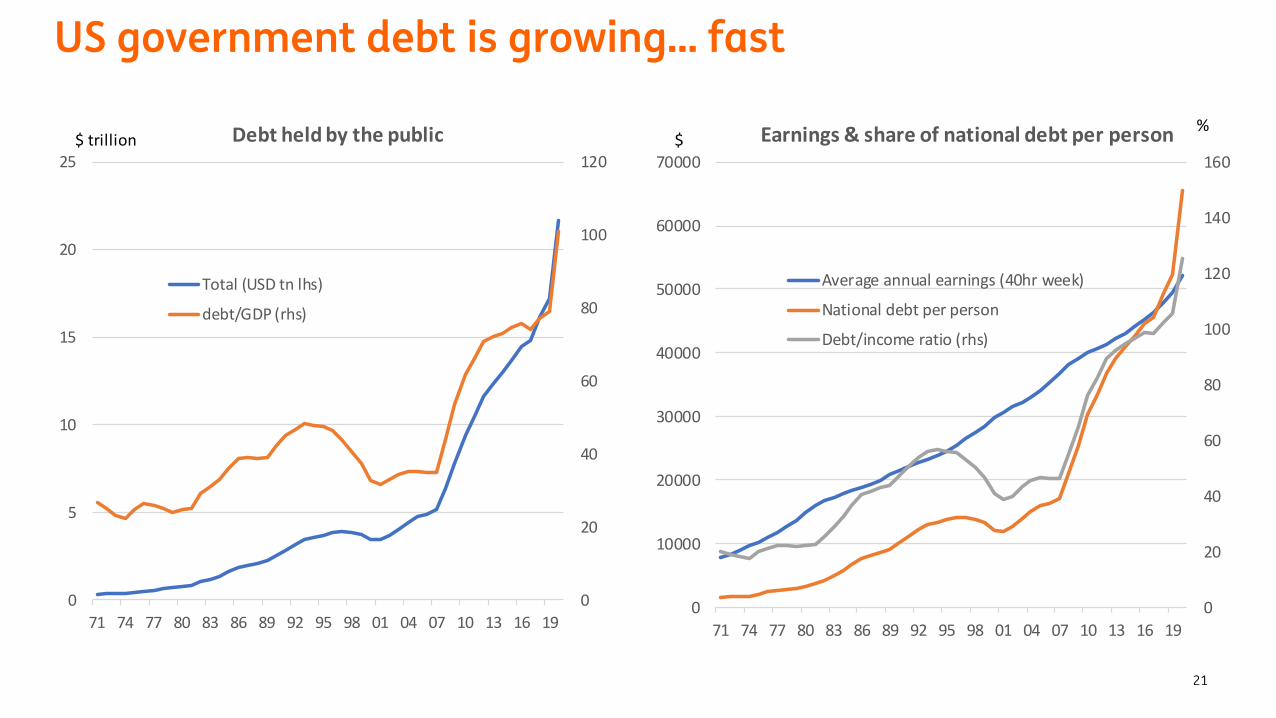
US government debt is growing… fast
0
20
40
60
80
100
120
0
5
10
15
20
25
71 74 77 80 83 86 89 92 95 98 01 04 07 10 13 16 19
Debt held by the public
Total (USD tn lhs)
debt/GDP (rhs)
$ trillion
0
20
40
60
80
100
120
140
160
0
10000
20000
30000
40000
50000
60000
70000
71 74 77 80 83 86 89 92 95 98 01 04 07 10 13 16 19
Earnings & share of national debt per person
Average annual earnings (40hr week)
National debt per person
Debt/income ratio (rhs)
$ %
22
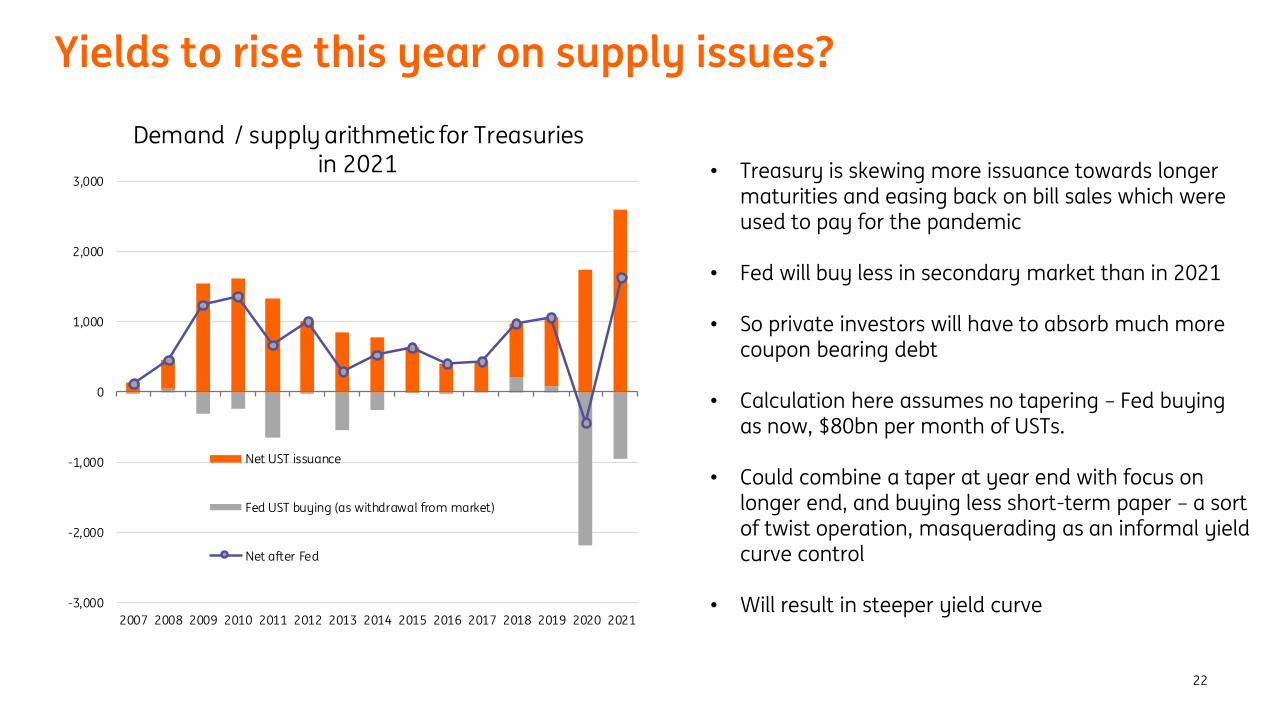
Yields to rise this year on supply issues?
-3,000
-2,000
-1,000
0
1,000
2,000
3,000
2007 2008 2009 2010 2011 2012 2013 2014 2015 2016 2017 2018 2019 2020 2021
Demand / supply arithmetic for Treasuries in 2021
Net UST issuance
Fed UST buying (as withdrawal from market)
Net after Fed
• Treasury is skewing more issuance towards longer maturities and easing back on bill sales which were used to pay for the pandemic
• Fed will buy less in secondary market than in 2021
• So private investors will have to absorb much more coupon bearing debt
• Calculation here assumes no tapering – Fed buying as now, $80bn per month of USTs.
• Could combine a taper at year end with focus on longer end, and buying less short-term paper – a sort of twist operation, masquerading as an informal yield curve control
• Will result in steeper yield curve

23
Return of Trade / tech War
24
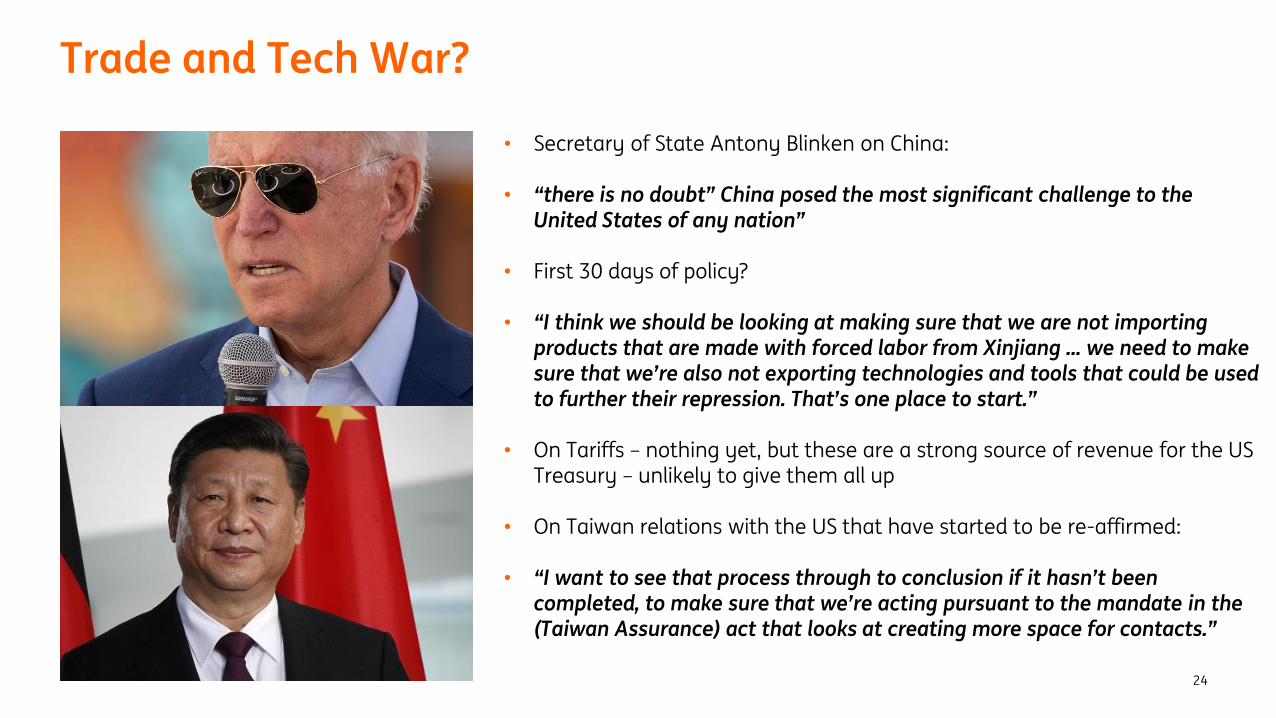
Trade and Tech War?
• Secretary of State Antony Blinken on China:
• “there is no doubt” China posed the most significant challenge to the United States of any nation”
• First 30 days of policy?
• “I think we should be looking at making sure that we are not importing products that are made with forced labor from Xinjiang ... we need to make sure that we’re also not exporting technologies and tools that could be used to further their repression. That’s one place to start.”
• On Tariffs – nothing yet, but these are a strong source of revenue for the US Treasury – unlikely to give them all up
• On Taiwan relations with the US that have started to be re-affirmed:
• “I want to see that process through to conclusion if it hasn’t been completed, to make sure that we’re acting pursuant to the mandate in the (Taiwan Assurance) act that looks at creating more space for contacts.”
25
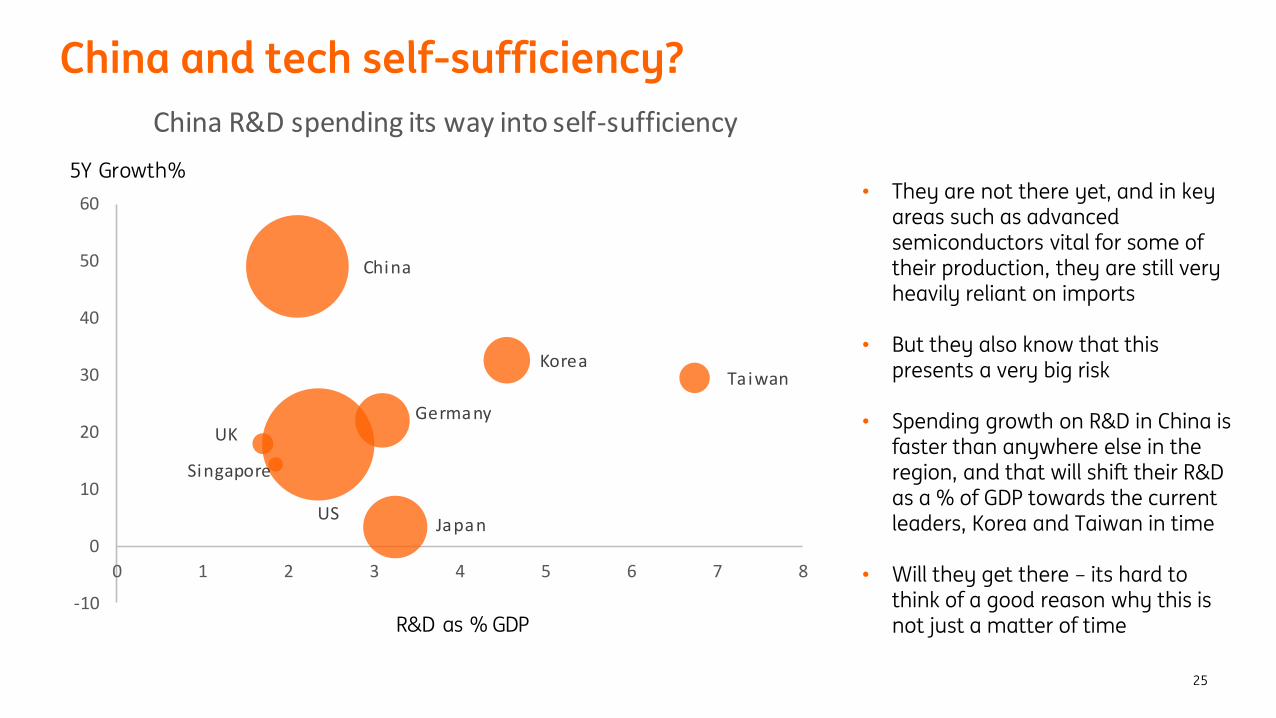
China and tech self-sufficiency?
• They are not there yet, and in key areas such as advanced semiconductors vital for some of their production, they are still very heavily reliant on imports
• But they also know that this presents a very big risk
• Spending growth on R&D in China is faster than anywhere else in the region, and that will shift their R&D as a % of GDP towards the current leaders, Korea and Taiwan in time
• Will they get there – its hard to think of a good reason why this is not just a matter of time
China
UK
Singapore
Germany
USJapan
KoreaTaiwan
-10
0
10
20
30
40
50
60
0 1 2 3 4 5 6 7 8
China R&D spending its way into self-sufficiency
5Y Growth%
R&D as % GDP

26
A good year for Asia?
27
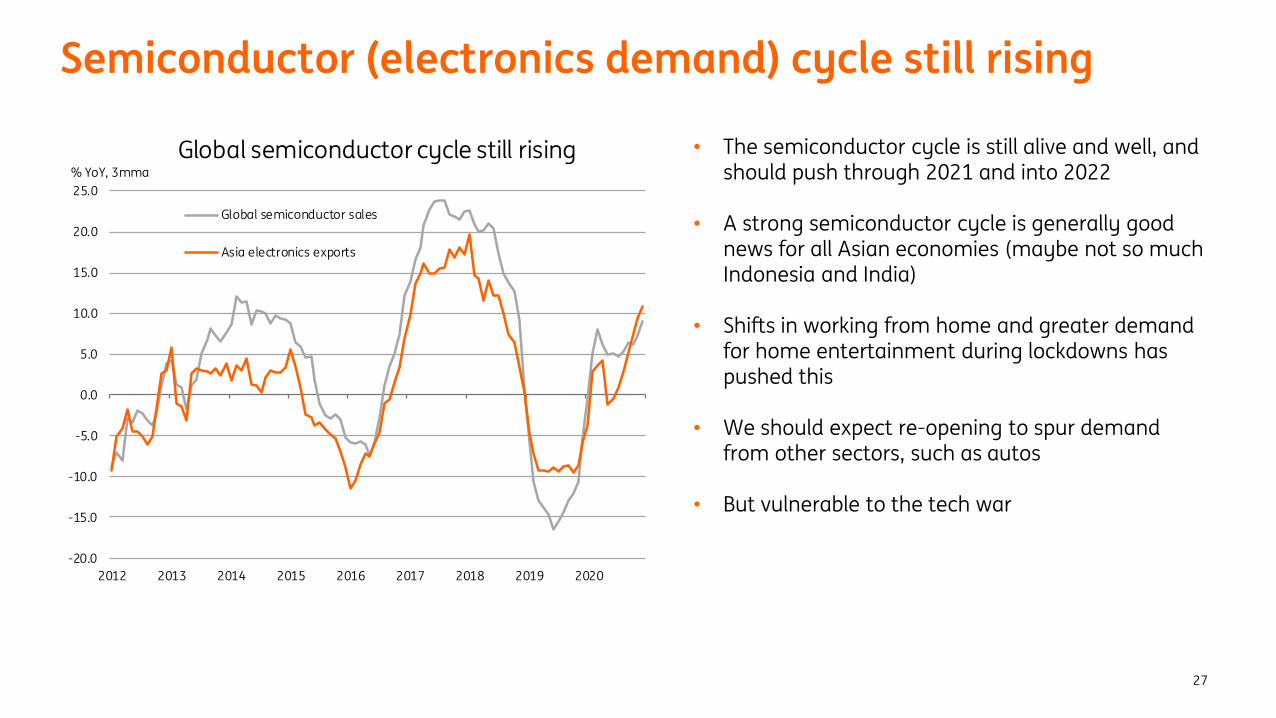
Semiconductor (electronics demand) cycle still rising
• The semiconductor cycle is still alive and well, and should push through 2021 and into 2022
• A strong semiconductor cycle is generally good news for all Asian economies (maybe not so much Indonesia and India)
• Shifts in working from home and greater demand for home entertainment during lockdowns has pushed this
• We should expect re-opening to spur demand from other sectors, such as autos
• But vulnerable to the tech war
-20.0
-15.0
-10.0
-5.0
0.0
5.0
10.0
15.0
20.0
25.0
2012 2013 2014 2015 2016 2017 2018 2019 2020
% YoY, 3mma
Global semiconductor sales
Asia electronics exports
Global semiconductor cycle still rising

28
Europe – double dip, but then recovery
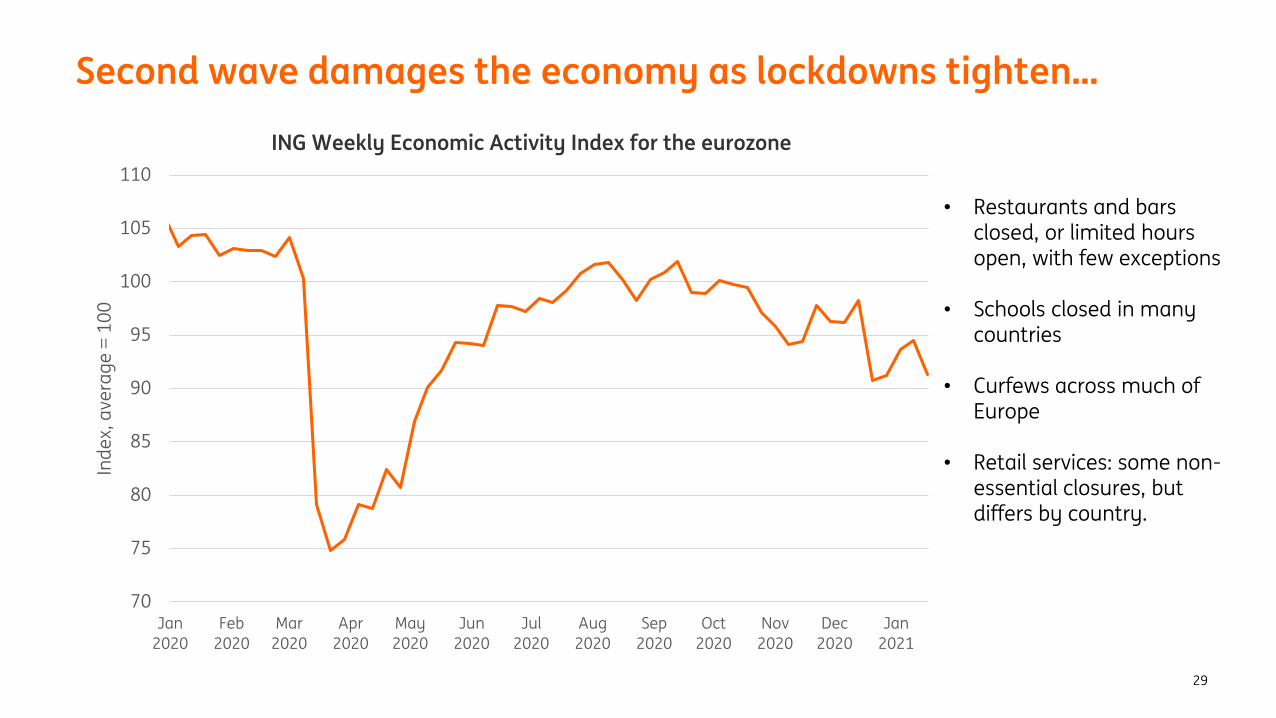
Second wave damages the economy as lockdowns tighten…
29
ING Weekly Economic Activity Index for the eurozone
70
75
80
85
90
95
100
105
110
Jan
2020
Feb
2020
Mar
2020
Apr
2020
May
2020
Jun
2020
Jul
2020
Aug
2020
Sep
2020
Oct
2020
Nov
2020
Dec
2020
Jan
2021
Ind
ex,
ave
rag
e=
10
0
• Restaurants and bars closed, or limited hours open, with few exceptions
• Schools closed in many countries
• Curfews across much of Europe
• Retail services: some non-essential closures, but differs by country.
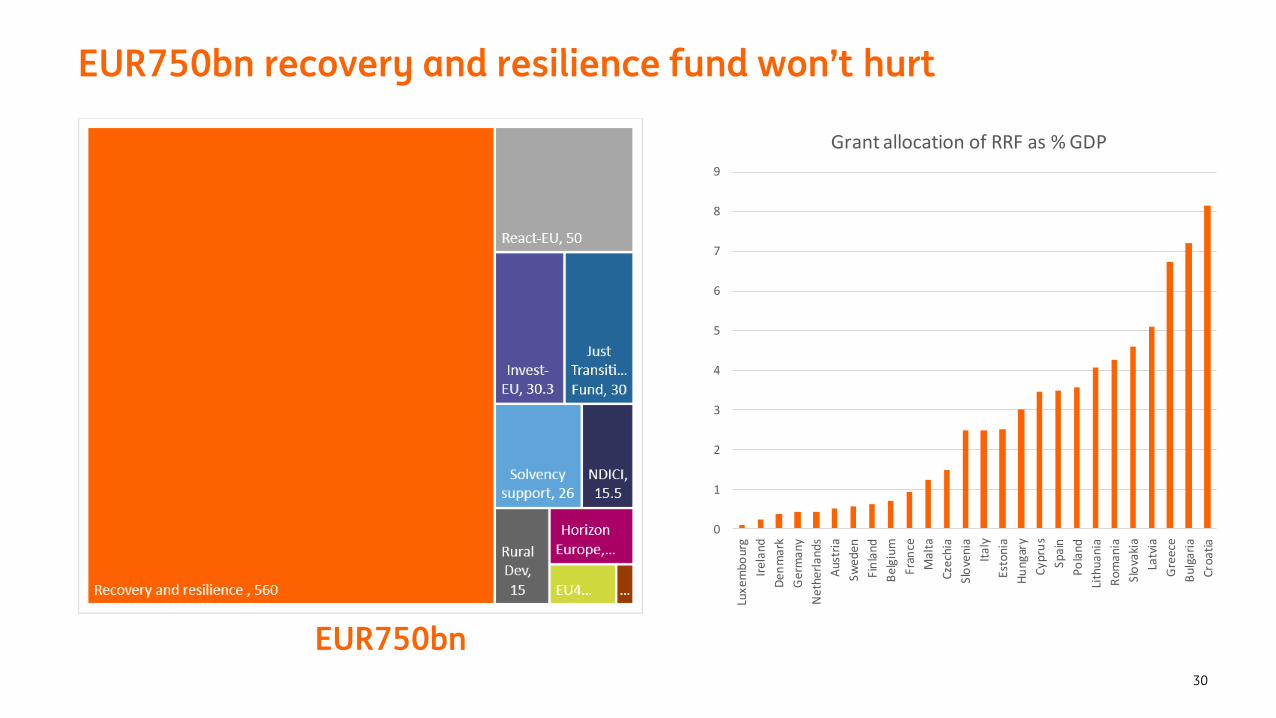
EUR750bn recovery and resilience fund won’t hurt
30
0
1
2
3
4
5
6
7
8
9
Luxe
mbo
urg
Ire
lan
d
De
nm
ark
Ger
man
y
Net
herl
ands
Au
stri
a
Swed
en
Fin
lan
d
Bel
giu
m
Fra
nce
Mal
ta
Cze
chia
Slo
veni
a
Ital
y
Esto
nia
Hu
ngar
y
Cyp
rus
Spai
n
Pola
nd
Lith
uani
a
Ro
ma
nia
Slo
vaki
a
Latv
ia
Gre
ece
Bul
gari
a
Croa
tia
Grant allocation of RRF as % GDP
EUR750bn
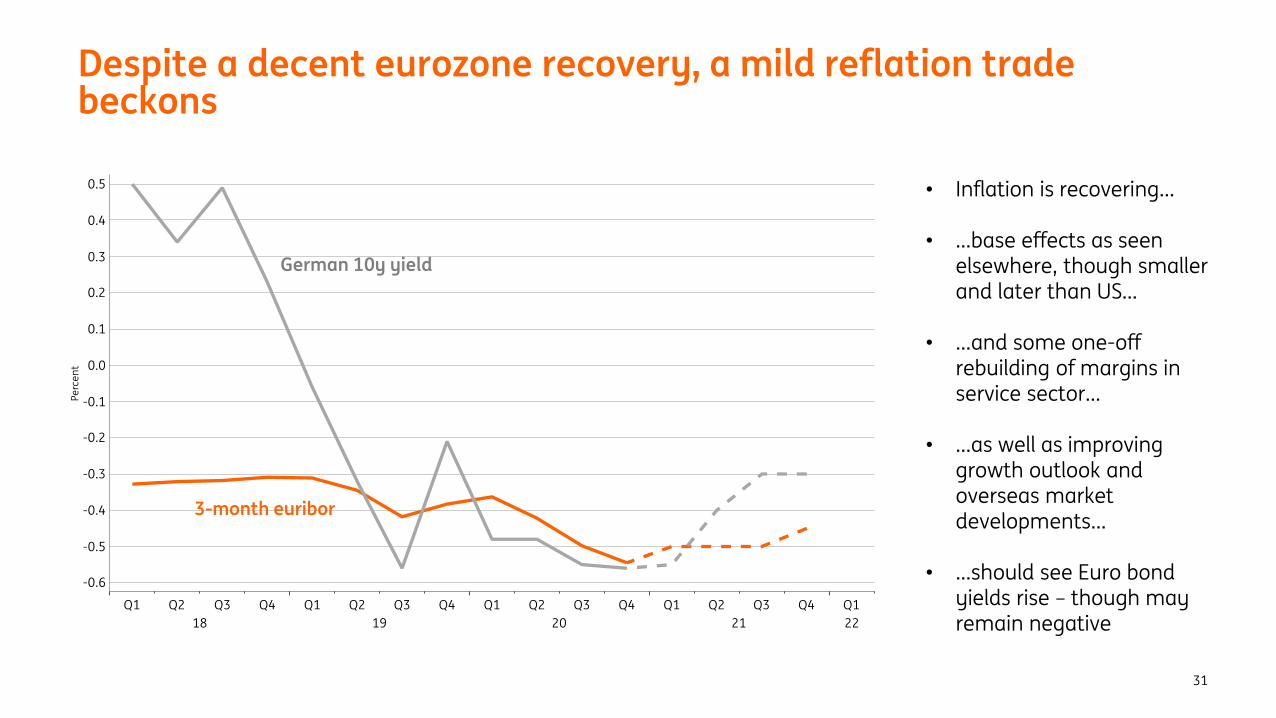
Despite a decent eurozone recovery, a mild reflation trade beckons
31
German 10y yield
3-month euribor
• Inflation is recovering…
• …base effects as seen elsewhere, though smaller and later than US…
• …and some one-off rebuilding of margins in service sector…
• …as well as improving growth outlook and overseas market developments…
• …should see Euro bond yields rise – though may remain negative

THINK Economic and Financial Analysising.com/THINK
Follow us@ING_EconomicsJanuary 2021
2021: Bounce back year?Growth vs recovery
Nicholas Mapa
33
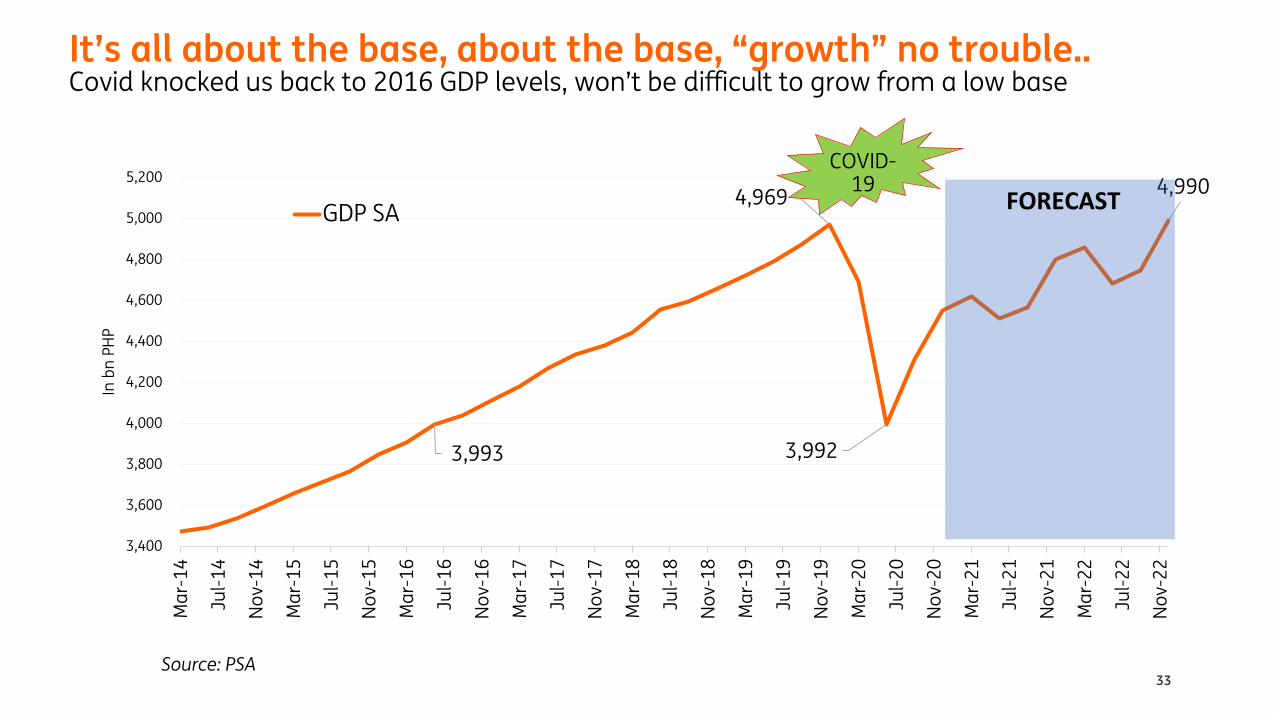
It’s all about the base, about the base, “growth” no trouble..Covid knocked us back to 2016 GDP levels, won’t be difficult to grow from a low base
Source: PSA
3,993
4,969
3,992
4,990
3,400
3,600
3,800
4,000
4,200
4,400
4,600
4,800
5,000
5,200M
ar-
14
Jul-
14
No
v-1
4
Ma
r-1
5
Jul-
15
No
v-1
5
Ma
r-1
6
Jul-
16
No
v-1
6
Ma
r-1
7
Jul-
17
No
v-1
7
Ma
r-1
8
Jul-
18
No
v-1
8
Ma
r-1
9
Jul-
19
No
v-1
9
Ma
r-2
0
Jul-
20
No
v-2
0
Ma
r-2
1
Jul-
21
No
v-2
1
Ma
r-2
2
Jul-
22
No
v-2
2
In b
n P
HP
GDP SAFORECAST
COVID-19
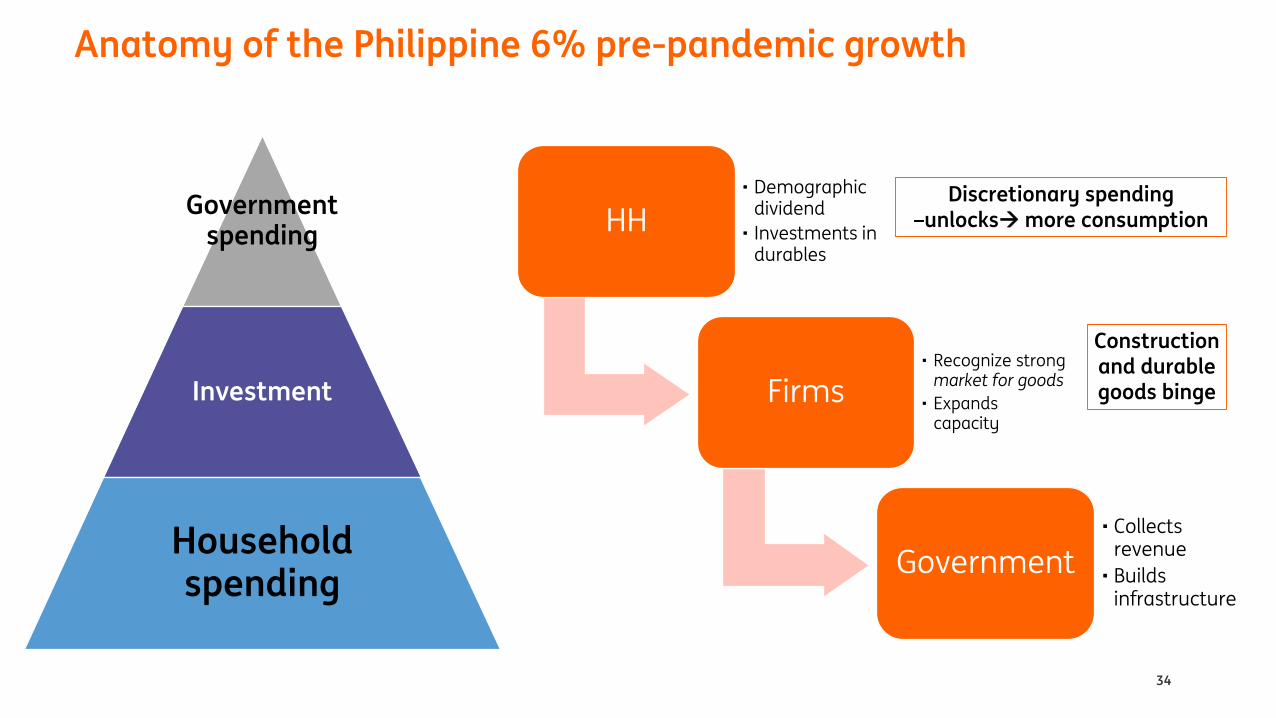
HH• Demographic
dividend
• Investments in durables
Firms• Recognize strong
market for goods
• Expands capacity
Government
• Collects revenue
• Builds infrastructure
Governmentspending
Investment
Household spending
34
Anatomy of the Philippine 6% pre-pandemic growth
Discretionary spending –unlocks→more consumption
Construction and durable goods binge
35
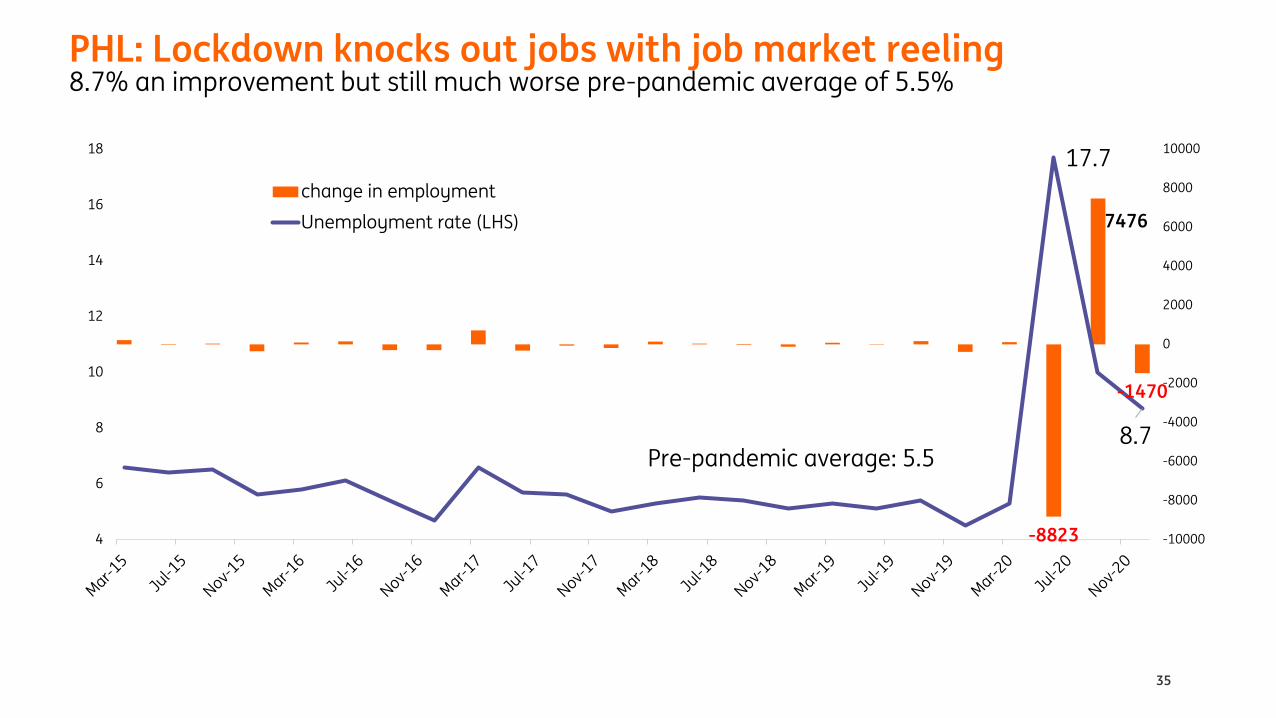
PHL: Lockdown knocks out jobs with job market reeling8.7% an improvement but still much worse pre-pandemic average of 5.5%
-8823
7476
-1470
17.7
8.7
-10000
-8000
-6000
-4000
-2000
0
2000
4000
6000
8000
10000
4
6
8
10
12
14
16
18
change in employment
Unemployment rate (LHS)
Pre-pandemic average: 5.5
36
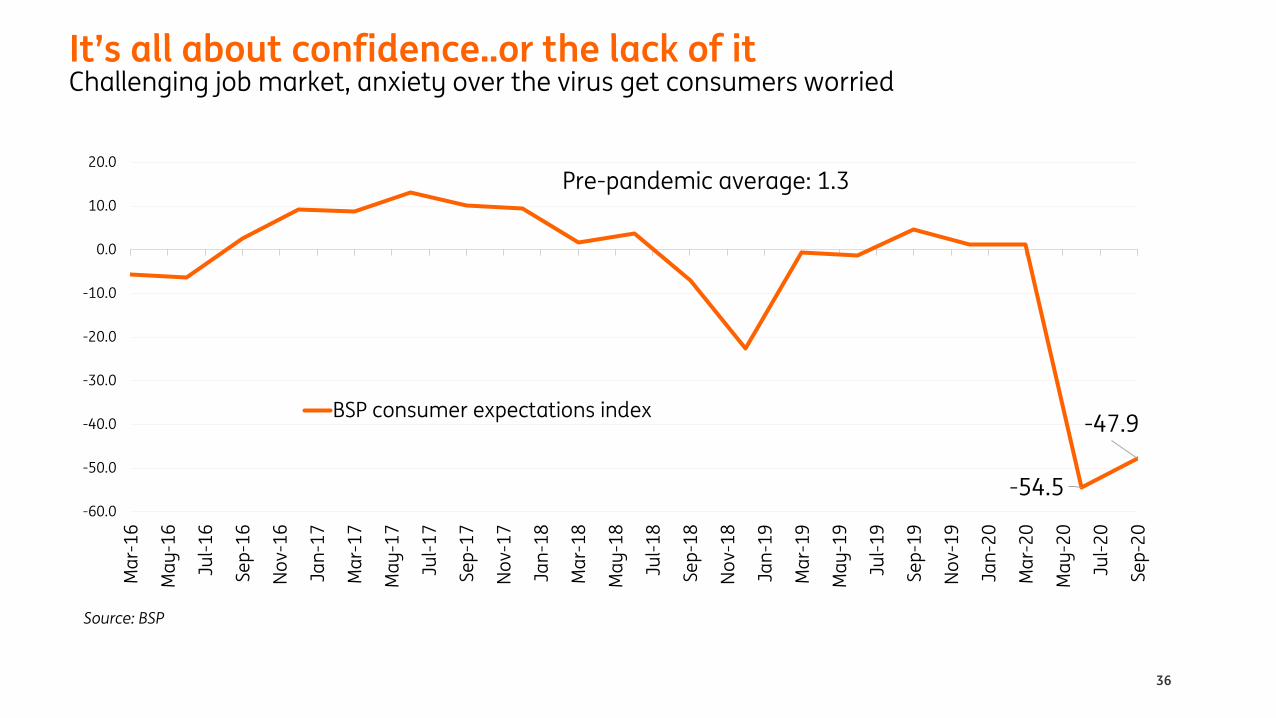
It’s all about confidence..or the lack of itChallenging job market, anxiety over the virus get consumers worried
-54.5
-47.9
-60.0
-50.0
-40.0
-30.0
-20.0
-10.0
0.0
10.0
20.0
Ma
r-1
6
Ma
y-1
6
Jul-
16
Se
p-1
6
No
v-1
6
Jan
-17
Ma
r-1
7
Ma
y-1
7
Jul-
17
Se
p-1
7
No
v-1
7
Jan
-18
Ma
r-1
8
Ma
y-1
8
Jul-
18
Se
p-1
8
No
v-1
8
Jan
-19
Ma
r-1
9
Ma
y-1
9
Jul-
19
Se
p-1
9
No
v-1
9
Jan
-20
Ma
r-2
0
Ma
y-2
0
Jul-
20
Se
p-2
0
BSP consumer expectations index
Pre-pandemic average: 1.3
Source: BSP
37
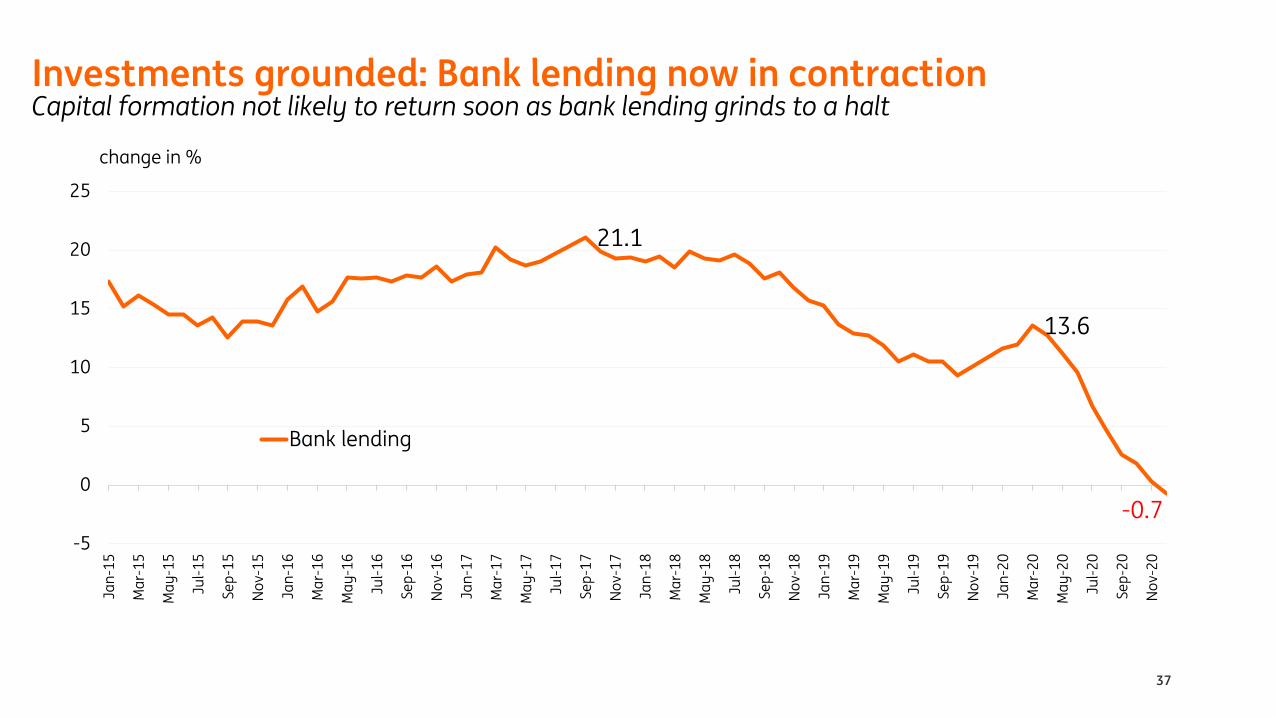
Investments grounded: Bank lending now in contractionCapital formation not likely to return soon as bank lending grinds to a halt
21.1
13.6
-0.7
-5
0
5
10
15
20
25
Jan
-15
Ma
r-1
5
Ma
y-1
5
Jul-
15
Se
p-1
5
No
v-1
5
Jan
-16
Ma
r-1
6
Ma
y-1
6
Jul-
16
Se
p-1
6
No
v-1
6
Jan
-17
Ma
r-1
7
Ma
y-1
7
Jul-
17
Se
p-1
7
No
v-1
7
Jan
-18
Ma
r-1
8
Ma
y-1
8
Jul-
18
Se
p-1
8
No
v-1
8
Jan
-19
Ma
r-1
9
Ma
y-1
9
Jul-
19
Se
p-1
9
No
v-1
9
Jan
-20
Ma
r-2
0
Ma
y-2
0
Jul-
20
Se
p-2
0
No
v-2
0
change in %
Bank lending
38
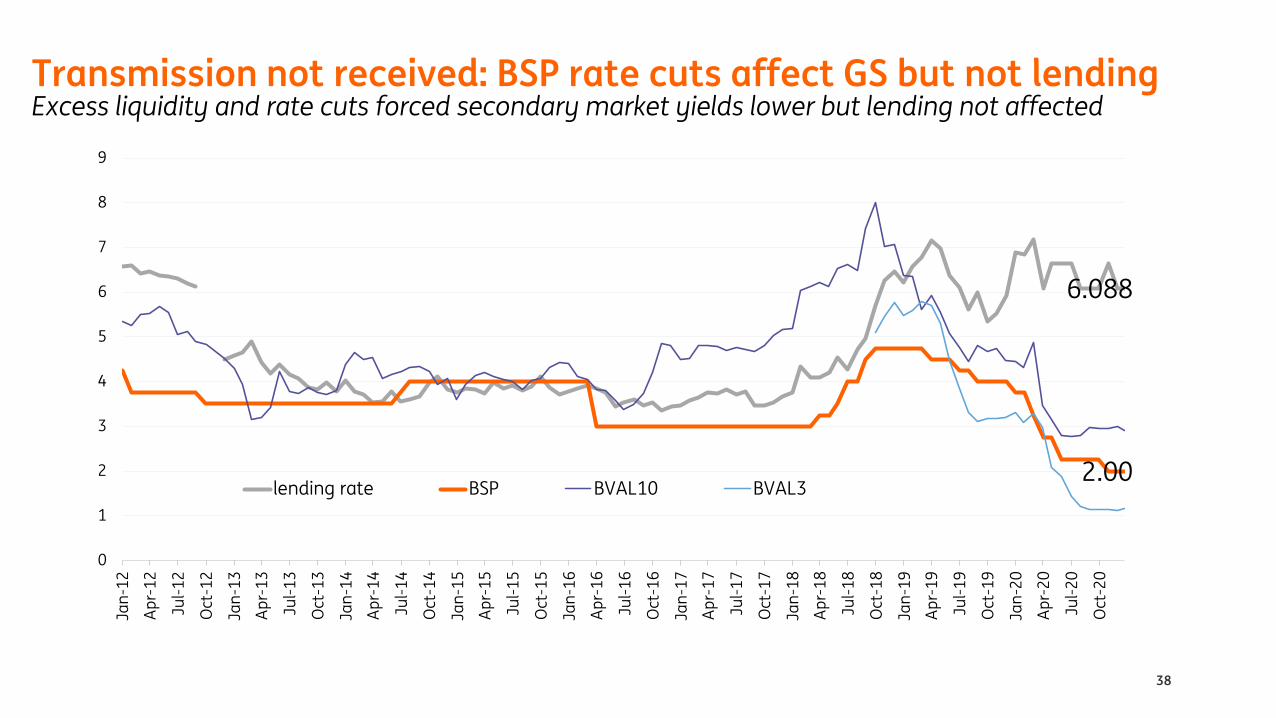
Transmission not received: BSP rate cuts affect GS but not lendingExcess liquidity and rate cuts forced secondary market yields lower but lending not affected
6.088
2.00
0
1
2
3
4
5
6
7
8
9
Jan
-12
Ap
r-1
2
Jul-
12
Oct
-12
Jan
-13
Ap
r-1
3
Jul-
13
Oct
-13
Jan
-14
Ap
r-1
4
Jul-
14
Oct
-14
Jan
-15
Ap
r-1
5
Jul-
15
Oct
-15
Jan
-16
Ap
r-1
6
Jul-
16
Oct
-16
Jan
-17
Ap
r-1
7
Jul-
17
Oct
-17
Jan
-18
Ap
r-1
8
Jul-
18
Oct
-18
Jan
-19
Ap
r-1
9
Jul-
19
Oct
-19
Jan
-20
Ap
r-2
0
Jul-
20
Oct
-20
lending rate BSP BVAL10 BVAL3
39
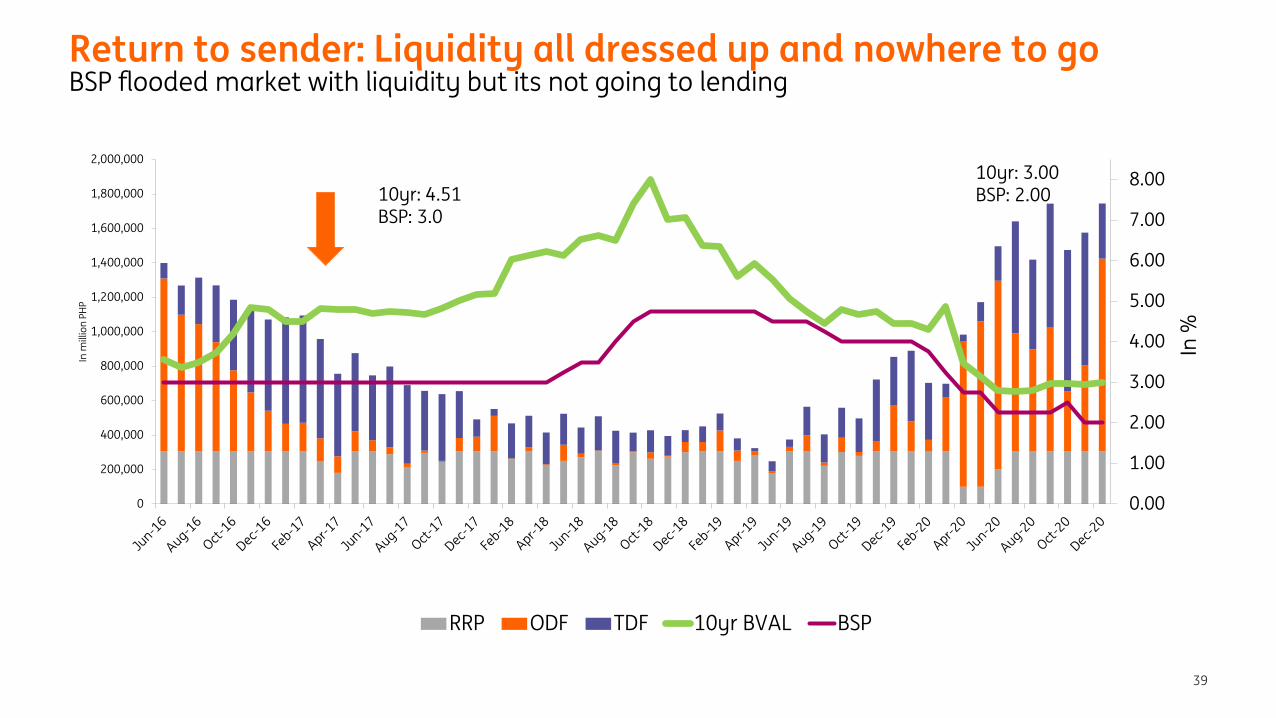
Return to sender: Liquidity all dressed up and nowhere to goBSP flooded market with liquidity but its not going to lending
0.00
1.00
2.00
3.00
4.00
5.00
6.00
7.00
8.00
0
200,000
400,000
600,000
800,000
1,000,000
1,200,000
1,400,000
1,600,000
1,800,000
2,000,000
In %
In m
illio
n P
HP
RRP ODF TDF 10yr BVAL BSP
10yr: 4.51BSP: 3.0
10yr: 3.00BSP: 2.00
40
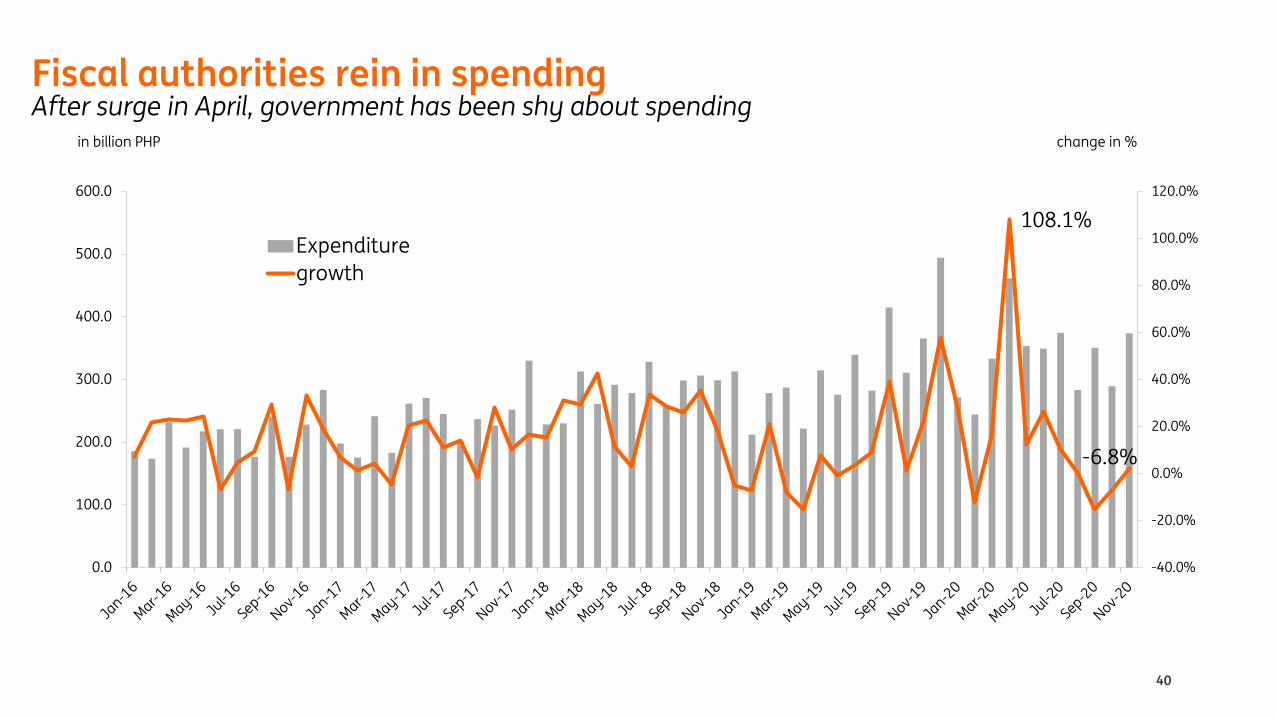
Fiscal authorities rein in spendingAfter surge in April, government has been shy about spending
108.1%
-6.8%
-40.0%
-20.0%
0.0%
20.0%
40.0%
60.0%
80.0%
100.0%
120.0%
0.0
100.0
200.0
300.0
400.0
500.0
600.0
change in %in billion PHP
Expenditure
growth
HH• Demographic
dividend
• Investments in durables
Firms• Recognize strong
market for goods
• Expands capacity
Government
• Collects revenue
• Builds infrastructure
Governmentspending
Investment
Household spending
41
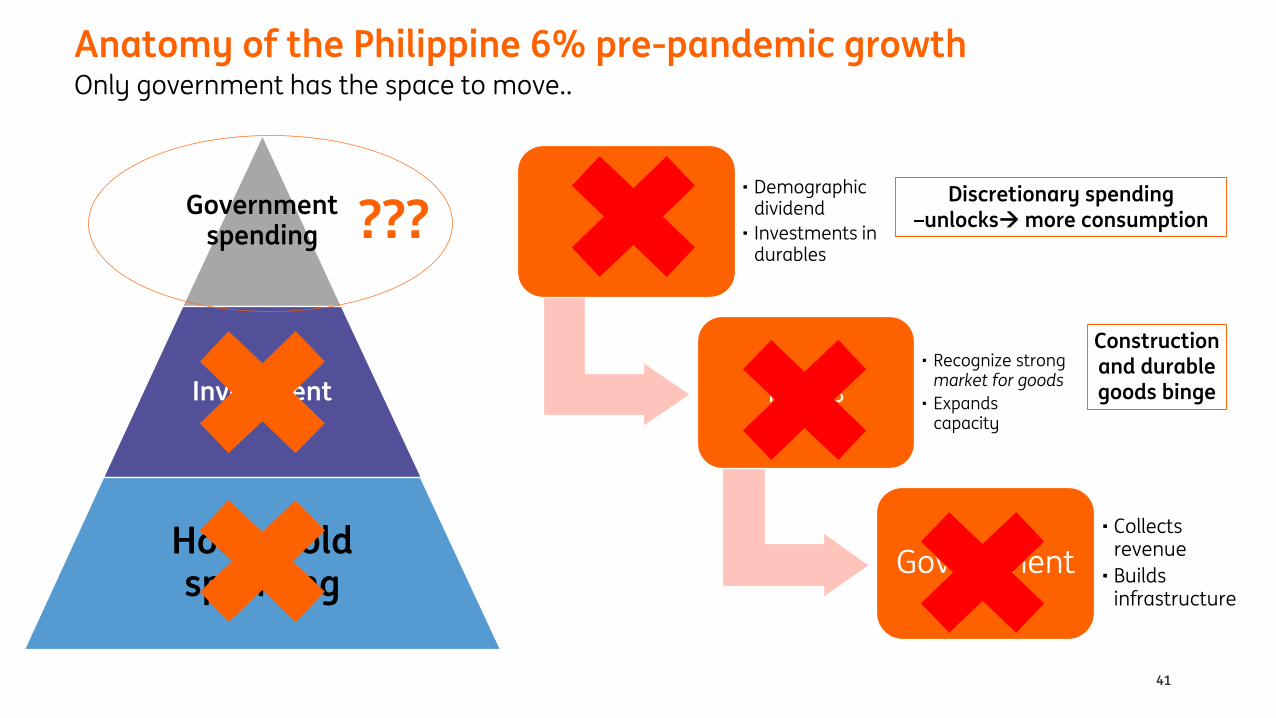
Anatomy of the Philippine 6% pre-pandemic growthOnly government has the space to move..
Discretionary spending –unlocks→more consumption
Construction and durable goods binge
???

42
PHL: What goes down, must go up..Dirty L-shaped recovery as economy fails to return to pre-pandemic trajectory of 6.2%
-16.9
-11.4
-4.4
13.0
-20
-15
-10
-5
0
5
10
15
Q118 Q218 Q318 Q418 Q119 Q219 Q319 Q419 1Q20 2Q20F 3Q20F 4Q20F 1Q21F 2Q21F 3Q21F 4Q21F 1Q22F 2Q22F 3Q22F 4Q22F
V recovery Dirty L recovery
V recovery average: 5.6
Dirty L recovery average: 4.7
Pre-pandemic average: 6.2
6.7
3.0
0.8
4.754.5
4.0
2.00
-1
0
1
2
3
4
5
6
7
8
2014 2015 2016 2017 2018 2019 2020 2021
in p
erc
en
t
INFL BSP Target lower bound Target upper bound
Forecast
43
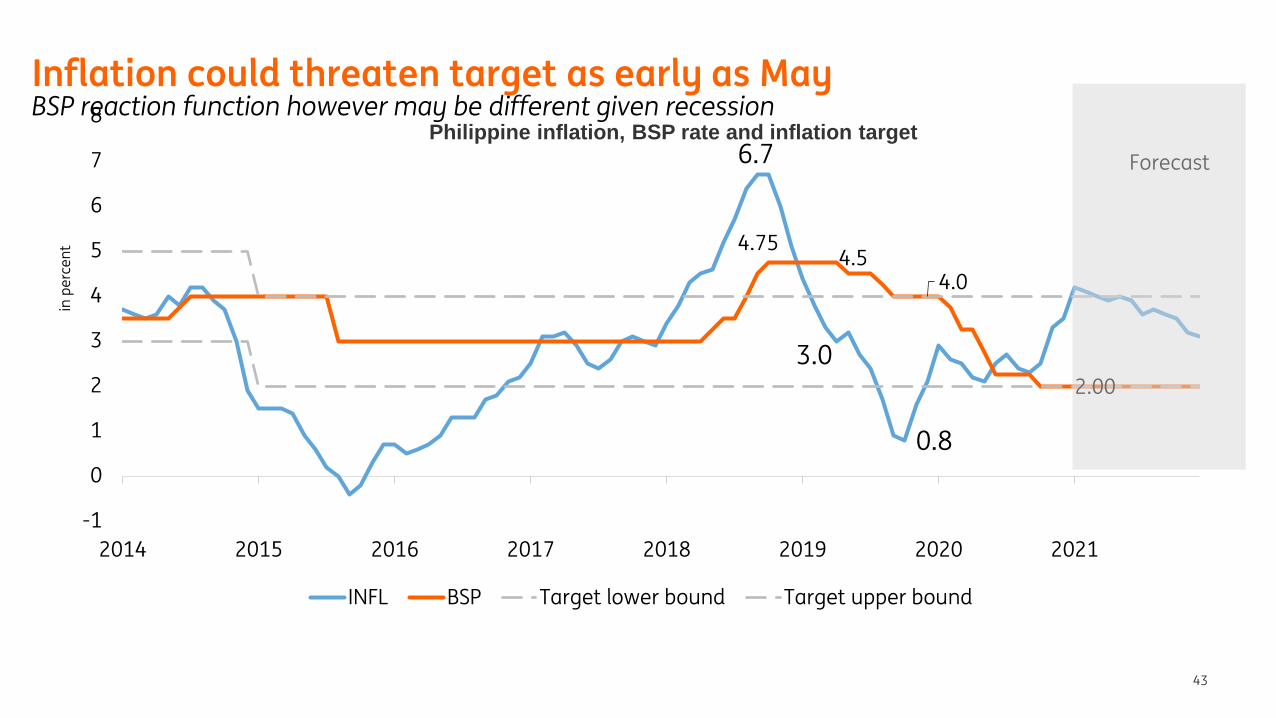
Inflation could threaten target as early as MayBSP reaction function however may be different given recession
Philippine inflation, BSP rate and inflation target
44
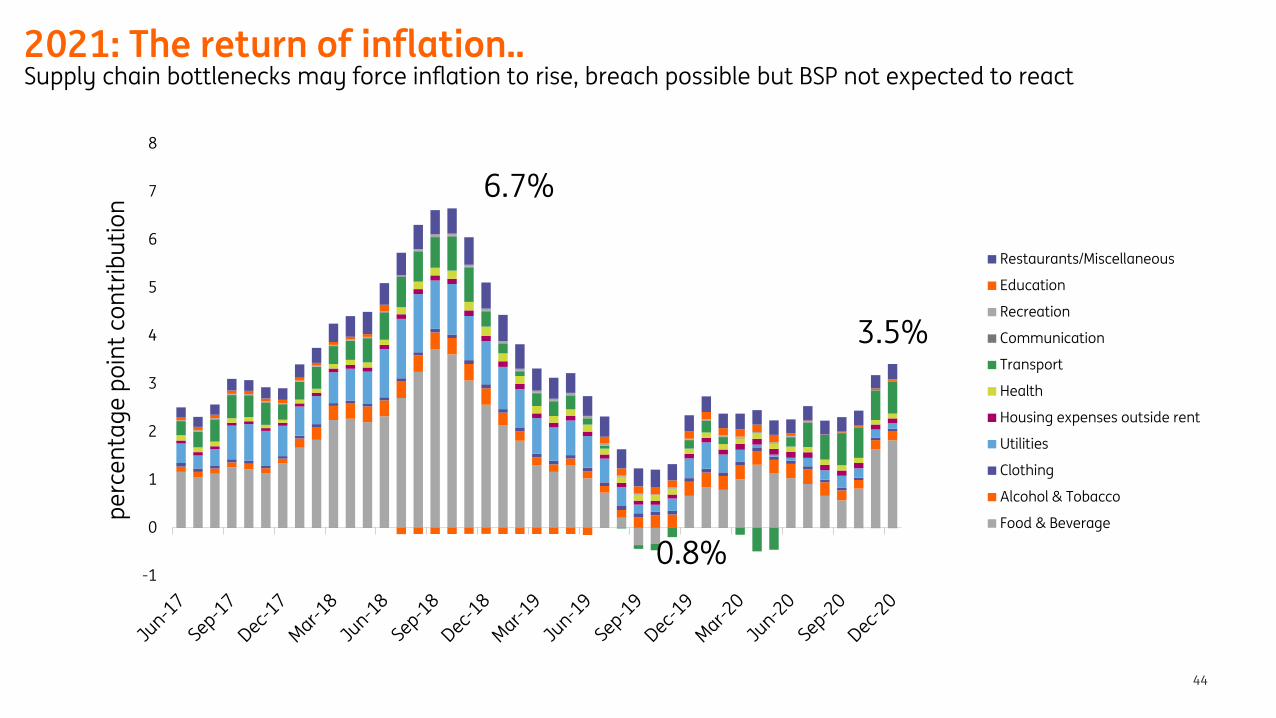
2021: The return of inflation..Supply chain bottlenecks may force inflation to rise, breach possible but BSP not expected to react
-1
0
1
2
3
4
5
6
7
8
pe
rce
nta
ge
po
int
con
trib
uti
on
Restaurants/Miscellaneous
Education
Recreation
Communication
Transport
Health
Housing expenses outside rent
Utilities
Clothing
Alcohol & Tobacco
Food & Beverage
3.5%
6.7%
0.8%
45
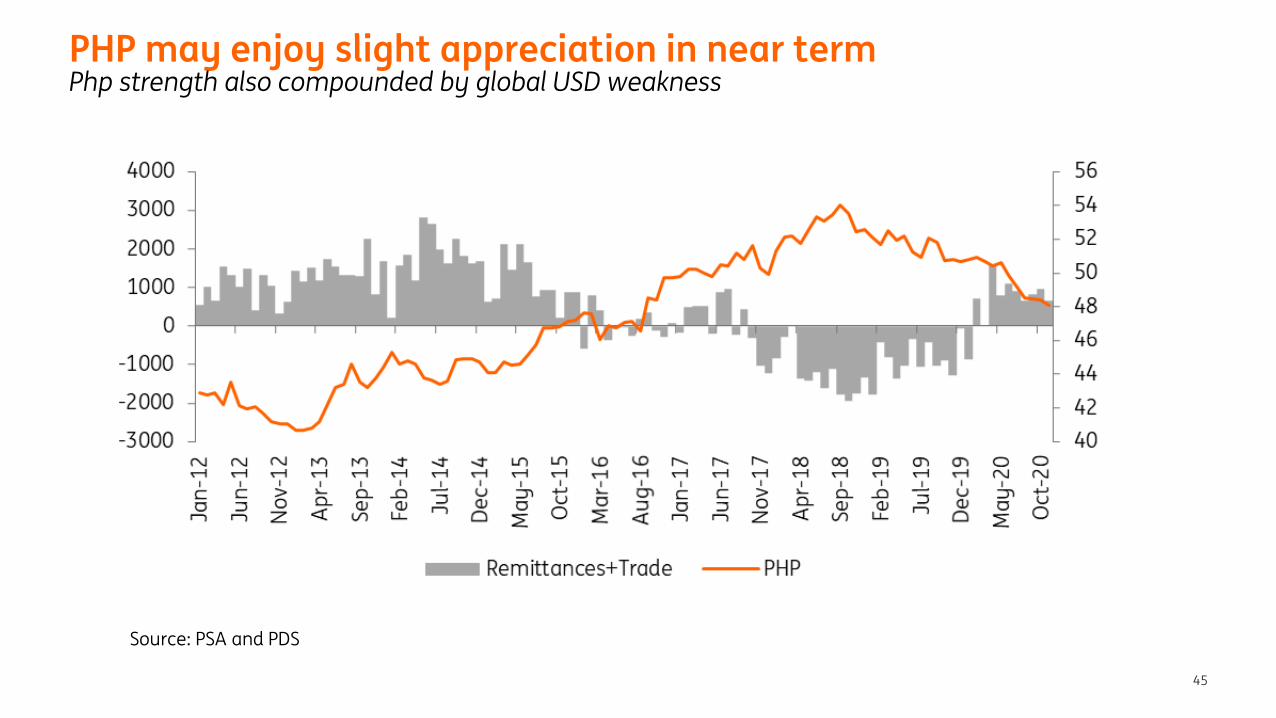
PHP may enjoy slight appreciation in near termPhp strength also compounded by global USD weakness
Source: PSA and PDS
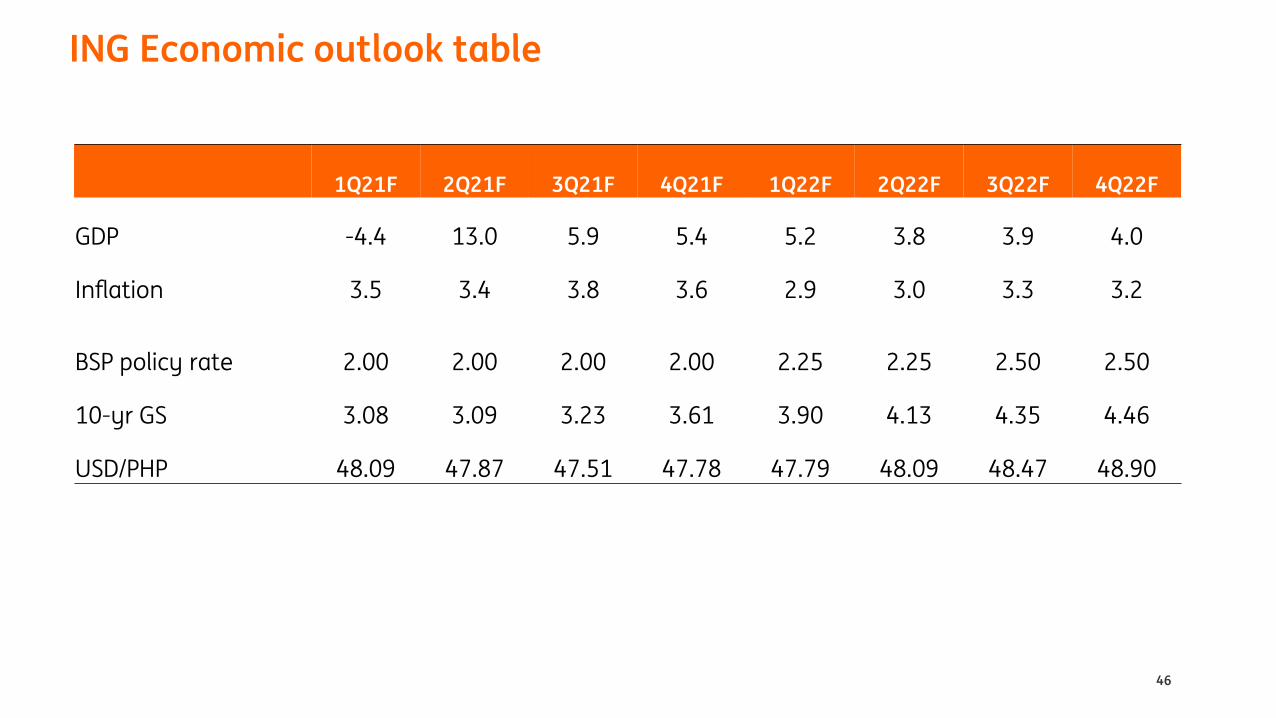
ING Economic outlook table
46
1Q21F 2Q21F 3Q21F 4Q21F 1Q22F 2Q22F 3Q22F 4Q22F
GDP -4.4 13.0 5.9 5.4 5.2 3.8 3.9 4.0
Inflation 3.5 3.4 3.8 3.6 2.9 3.0 3.3 3.2
BSP policy rate 2.00 2.00 2.00 2.00 2.25 2.25 2.50 2.50
10-yr GS 3.08 3.09 3.23 3.61 3.90 4.13 4.35 4.46
USD/PHP 48.09 47.87 47.51 47.78 47.79 48.09 48.47 48.90

Disclaimer
48
This publication has been prepared by the Economic and Financial Analysis Division of ING Bank N.V. (“ING”) solely for information purposes without regard to any particular user's investment objectives, financial situation, or means. ING forms part of ING Group (being for this purpose ING Group N.V. and its subsidiary and affiliated companies). The information in the publication is not an investment recommendation and it is not investment, legal or tax advice or an offer or solicitation to purchase or sell any financial instrument. Reasonable care has been taken to ensure that this publication is not untrue or misleading when published, but ING does not represent that it is accurate or complete. ING does not accept any liability for any direct, indirect or consequential loss arising from any use of this publication. Unless otherwise stated, any views, forecasts, or estimates are solely those of the author(s), as of the date of the publication and are subject to change without notice.
The distribution of this publication may be restricted by law or regulation in different jurisdictions and persons into whose possession this publication comes should inform themselves about, and observe, such restrictions.
Copyright and database rights protection exists in this report and it may not be reproduced, distributed or published by any person for any purpose without the prior express consent of ING. All rights are reserved. ING Bank N.V. is authorised by the Dutch Central Bank and supervised by the European Central Bank (ECB), the Dutch Central Bank (DNB) and the Dutch Authority for the Financial Markets (AFM). ING Bank N.V. is incorporated in the Netherlands (Trade Register no. 33031431 Amsterdam). In the United Kingdom this information is approved and/or communicated by ING Bank N.V., London Branch. ING Bank N.V., London Branch is subject to limited regulation by the Financial Conduct Authority (FCA). ING Bank N.V., London branch is registered in England (Registration number BR000341) at 8-10 Moorgate, London EC2 6DA. For US Investors: Any person wishing to discuss this report or effect transactions in any security discussed herein should contact ING Financial Markets LLC, which is a member of the NYSE, FINRA and SIPC and part of ING, and which has accepted responsibility for the distribution of this report in the United States under applicable requirements.
Additional information is available on request. For more information about ING Group, please visit http://www.ing.com.