global environmental change of technology, department of production engineering and logistics,...
TRANSCRIPT

Global Environmental Change 28 (2014) 84–97
When enough should be enough: Improving the use of currentagricultural lands could meet production demands and spare naturalhabitats in Brazil
Bernardo B.N. Strassburg a,b,*, Agnieszka E. Latawiec a,c,d, Luis G. Barioni e, Carlos A. Nobre f,Vanderley P. da Silva g, Judson F. Valentim h,i, Murilo Vianna e, Eduardo D. Assad e
a International Institute for Sustainability, Estrada Dona Castorina, 124, 22460-320 Rio de Janeiro, Brazilb Department of Geography and the Environment, Pontificia Universidade Catolica, 22453-900 Rio de Janeiro, Brazilc Opole University of Technology, Department of Production Engineering and Logistics, Luboszycka 5, 45-036 Opole, Polandd School of Environmental Sciences, University of East Anglia, Norwich, Norfolk NR4 7TJ, UKe Embrapa Informatica Agropecuaria, Campinas, SP 13083-886, Brazilf National Institute for Space Research, Sao Jose dos Campos, SP 12227-010, Brazilg Embrapa Florestas, Colombo, PR 83411-000, Brazilh Embrapa Acre, Rio Branco, AC 69908-970, Brazili Mossavar-Rahmani Center for Business and Government, Harvard Kennedy School, 79 John F. Kennedy Street, Mailbox 81, Cambridge, MA 02138, USA
A R T I C L E I N F O
Article history:
Received 12 April 2013
Received in revised form 29 May 2014
Accepted 1 June 2014
Available online
Keywords:
Pasturelands
Increasing demand
Agriculture
Sustainable intensification
Land sparing
A B S T R A C T
Providing food and other products to a growing human population while safeguarding natural
ecosystems and the provision of their services is a significant scientific, social and political challenge.
With food demand likely to double over the next four decades, anthropization is already driving climate
change and is the principal force behind species extinction, among other environmental impacts. The
sustainable intensification of production on current agricultural lands has been suggested as a key
solution to the competition for land between agriculture and natural ecosystems. However, few
investigations have shown the extent to which these lands can meet projected demands while
considering biophysical constraints. Here we investigate the improved use of existing agricultural lands
and present insights into avoiding future competition for land. We focus on Brazil, a country projected to
experience the largest increase in agricultural production over the next four decades and the richest
nation in terrestrial carbon and biodiversity. Using various models and climatic datasets, we produced
the first estimate of the carrying capacity of Brazil’s 115 million hectares of cultivated pasturelands. We
then investigated if the improved use of cultivated pasturelands would free enough land for the
expansion of meat, crops, wood and biofuel, respecting biophysical constraints (i.e., terrain, climate)
and including climate change impacts. We found that the current productivity of Brazilian cultivated
pasturelands is 32–34% of its potential and that increasing productivity to 49–52% of the potential would
suffice to meet demands for meat, crops, wood products and biofuels until at least 2040, without further
conversion of natural ecosystems. As a result up to 14.3 Gt CO2 Eq could be mitigated. The fact that
the country poised to undergo the largest expansion of agricultural production over the coming decades
can do so without further conversion of natural habitats provokes the question whether the same can
be true in other regional contexts and, ultimately, at the global scale.
� 2014 Elsevier Ltd. All rights reserved.
Contents lists available at ScienceDirect
Global Environmental Change
jo ur n al h o mep ag e: www .e lsev ier . co m / loc ate /g lo envc h a
* Corresponding author at: International Institute for Sustainability, Estrada
Dona Castorina, 124, 22460-320 Rio de Janeiro, Brazil. Tel.: +55 2138756218.
E-mail address: [email protected] (Bernardo B.N. Strassburg).
http://dx.doi.org/10.1016/j.gloenvcha.2014.06.001
0959-3780/� 2014 Elsevier Ltd. All rights reserved.
1. Introduction
Driven by the global population increase and the concomitantper capita rise in consumption (Godfray et al., 2010), the globaldemand for agricultural products is projected to rise over the nextdecades (Alexandratos and Bruinsma, 2012), likely entailingfurther competition for land (Smith et al., 2010). Competitionfor land is transboundary (Lambin and Meyfroidt, 2011; Strassburg
B.B.N. Strassburg et al. / Global Environmental Change 28 (2014) 84–97 85
et al., 2014) and although demand increase occurs in one part ofthe world, pressure to provide commodities may be shiftedelsewhere. Lambin and Meyfroidt (2011) show that suchdisplacement, amplified by economic globalization, is drivingland conversion in developing countries. Indeed, in the 1980s and1990s, tropical forests were primary sources of new agriculturalland (Gibbs et al., 2010). According to projections from the Foodand Agriculture Organization of the United Nations (FAO), landunder crop cultivation in developing countries may increase bysome 110 million hectares by 2050 (FAO, 2006a,b) while othersforecast that as much as one billion additional tropical hectarescould be converted into cultivated land by 2050 (Tilman et al.,2001). Moreover, land use and land-use change may contribute to32% of anthropogenic greenhouse gas emissions (IPCC, 2007) andrepresent the main driving force behind the extinction of species(Baillie et al., 2004).
Currently, nowhere this conflict over land has the magnitudeobserved in Brazil. Brazil is the world’s second-largest agricul-tural producer, with the largest forecasted increases in outputover the next four decades of any country worldwide (FAO,2006a). At the same time, Brazil is the first deforesting country(55 million hectares over 1990–2010, versus 24 million hectaresin second-place Indonesia) (FAO, 2010), the nation richest inforest carbon (63 billion tonnes, versus 33 billion tonnes inRussia) (FAO, 2010) and the most biodiverse country on theplanet (56,000 known plant species, versus 29,375 in Indonesia)(UNEP-WCMC, 2010). Brazilian society is currently discussing itsplans for forestry and agriculture, and the government has laidout ambitious plans to reduce deforestation and land-useemissions while simultaneously increasing agricultural output(BMA, 2010). However, there are doubts whether recentreductions in Amazon deforestation can be sustained in thefuture without further plans that include projected demand(Nepstad et al., 2009; Lapola et al., 2014). In addition, there isevidence of increased pressure elsewhere in Brazil throughproduction displacement, especially the Cerrado savanna(Mesquita, 2009). Cerrado is a global biodiversity hotspot, whichover the last 15 years has lost 20% of its area (Mesquita, 2009).
Worldwide, sustainably increasing production on currentagricultural lands has been proposed as a solution to the conflictbetween expanding agricultural production and conservingnatural ecosystems (Godfray et al., 2010; Herrero et al., 2010;Phalan et al., 2011, 2013; Foresight, 2011; Mueller et al., 2012;Latawiec et al., 2014). It has been shown (Herrero et al., 2010;Lapola et al., 2010; Tilman et al., 2002; Burney et al., 2010) that itis possible to increase agricultural efficiency and mitigategreenhouse gases through resource conservation and improve-ments in land management.
In this paper, we hypothesise that Brazil existing agriculturallands are enough to sustain production at levels expected to meetfuture demand (including both internal consumption and exports)for meat, crops, wood and biofuels until 2040 without furtherconversion of natural habitats. Increasing productivity ofpasturelands has been suggested as a promising resource inreconciling agricultural expansion with the reduction of theenvironmental impacts of agriculture in Brazil (Arima et al.,2011; Bowman et al., 2012; Bustamante et al., 2012). On account oftheir low productivity and total area (170 million hectares, versus60 million hectares for crops) pasturelands indeed present anopportunity for sustainable intensification (producing more foodfrom the same area while reducing the environmental impacts;Royal Society of and London, 2009; Godfray et al., 2010). A recentstudy estimates that the livestock sector holds the largestmitigation potential in Brazil because the emissions from thissector account for approximately half of all Brazilian GHGemissions (Bustamante et al., 2012).
The extent to which sustainable intensification of currentpasturelands in Brazil could contribute to meeting future demandsfor agricultural products (including for exports) while respectingbiophysical constraints has not been tested. Here we, first, showthe spatial description of current pasture stocking rates (number ofanimals per unit of area) for Brazil. Second, we estimated thepotential productivity of pasturelands expressed as their potentialcarrying capacity (the stocking rate at the optimum grazingpressure (Mott, 1960) which is consistent with maintaining thepasture productivity) for two climatic datasets and for Brazil’smain types of fodder grass, given edaphoclimatic conditions. Third,we allocated future land uses in order to meet demands until 2040.We finally calculated greenhouse gases mitigation potential fromavoided deforestation and from improved livestock management.The results presented here are not only relevant in the Braziliancontext, but may also have wider implications for land-usedecision-making, especially in the developing world. The analysispresented here may also be repeated at other scales to investigatewhether the hypothesis tested here is true globally.
2. Materials and methods
2.1. Current productivity of Brazilian cultivated pasturelands
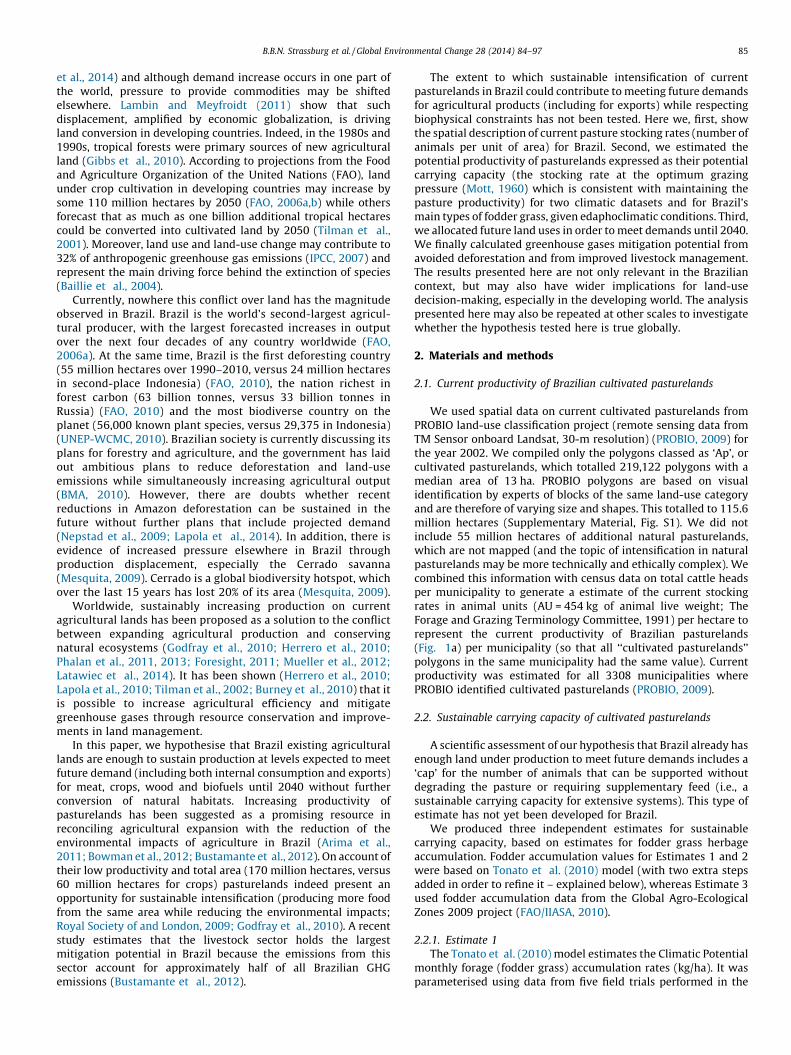
We used spatial data on current cultivated pasturelands fromPROBIO land-use classification project (remote sensing data fromTM Sensor onboard Landsat, 30-m resolution) (PROBIO, 2009) forthe year 2002. We compiled only the polygons classed as ‘Ap’, orcultivated pasturelands, which totalled 219,122 polygons with amedian area of 13 ha. PROBIO polygons are based on visualidentification by experts of blocks of the same land-use categoryand are therefore of varying size and shapes. This totalled to 115.6million hectares (Supplementary Material, Fig. S1). We did notinclude 55 million hectares of additional natural pasturelands,which are not mapped (and the topic of intensification in naturalpasturelands may be more technically and ethically complex). Wecombined this information with census data on total cattle headsper municipality to generate a estimate of the current stockingrates in animal units (AU = 454 kg of animal live weight; TheForage and Grazing Terminology Committee, 1991) per hectare torepresent the current productivity of Brazilian pasturelands(Fig. 1a) per municipality (so that all ‘‘cultivated pasturelands’’polygons in the same municipality had the same value). Currentproductivity was estimated for all 3308 municipalities wherePROBIO identified cultivated pasturelands (PROBIO, 2009).
2.2. Sustainable carrying capacity of cultivated pasturelands
A scientific assessment of our hypothesis that Brazil already hasenough land under production to meet future demands includes a‘cap’ for the number of animals that can be supported withoutdegrading the pasture or requiring supplementary feed (i.e., asustainable carrying capacity for extensive systems). This type ofestimate has not yet been developed for Brazil.
We produced three independent estimates for sustainablecarrying capacity, based on estimates for fodder grass herbageaccumulation. Fodder accumulation values for Estimates 1 and 2were based on Tonato et al. (2010) model (with two extra stepsadded in order to refine it – explained below), whereas Estimate 3used fodder accumulation data from the Global Agro-EcologicalZones 2009 project (FAO/IIASA, 2010).
2.2.1. Estimate 1
The Tonato et al. (2010) model estimates the Climatic Potentialmonthly forage (fodder grass) accumulation rates (kg/ha). It wasparameterised using data from five field trials performed in the
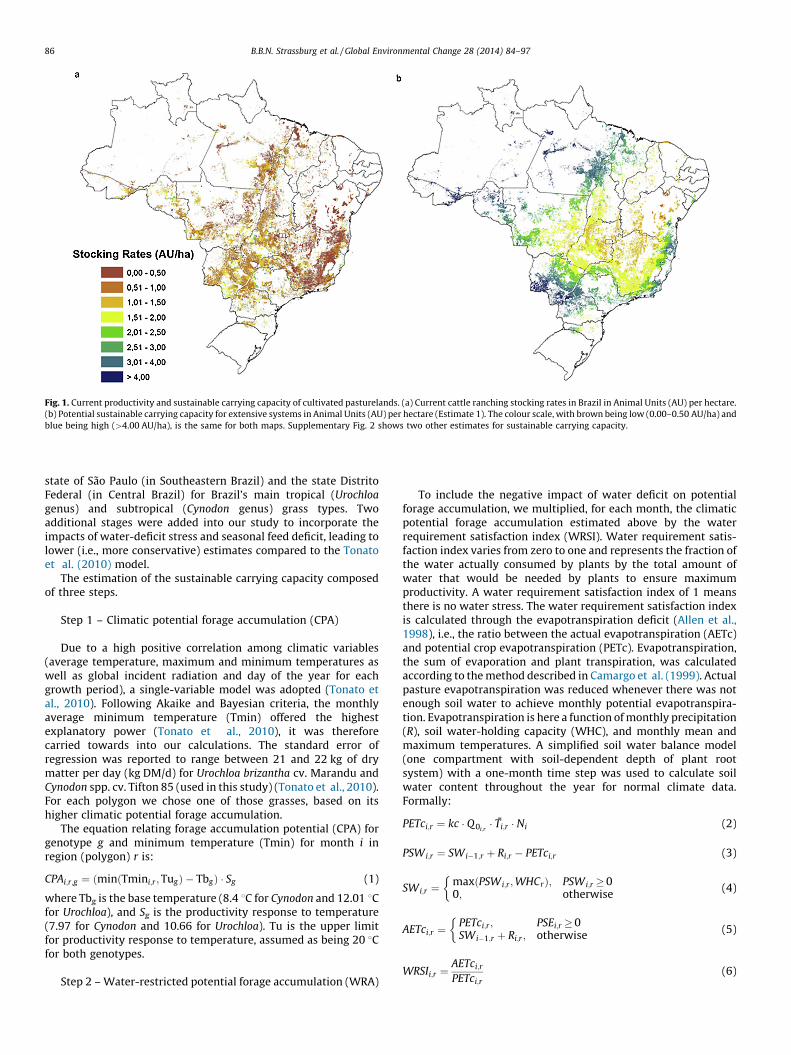
Fig. 1. Current productivity and sustainable carrying capacity of cultivated pasturelands. (a) Current cattle ranching stocking rates in Brazil in Animal Units (AU) per hectare.
(b) Potential sustainable carrying capacity for extensive systems in Animal Units (AU) per hectare (Estimate 1). The colour scale, with brown being low (0.00–0.50 AU/ha) and
blue being high (>4.00 AU/ha), is the same for both maps. Supplementary Fig. 2 shows two other estimates for sustainable carrying capacity.
B.B.N. Strassburg et al. / Global Environmental Change 28 (2014) 84–9786
state of Sao Paulo (in Southeastern Brazil) and the state DistritoFederal (in Central Brazil) for Brazil’s main tropical (Urochloa
genus) and subtropical (Cynodon genus) grass types. Twoadditional stages were added into our study to incorporate theimpacts of water-deficit stress and seasonal feed deficit, leading tolower (i.e., more conservative) estimates compared to the Tonatoet al. (2010) model.
The estimation of the sustainable carrying capacity composedof three steps.
Step 1 – Climatic potential forage accumulation (CPA)
Due to a high positive correlation among climatic variables(average temperature, maximum and minimum temperatures aswell as global incident radiation and day of the year for eachgrowth period), a single-variable model was adopted (Tonato etal., 2010). Following Akaike and Bayesian criteria, the monthlyaverage minimum temperature (Tmin) offered the highestexplanatory power (Tonato et al., 2010), it was thereforecarried towards into our calculations. The standard error ofregression was reported to range between 21 and 22 kg of drymatter per day (kg DM/d) for Urochloa brizantha cv. Marandu andCynodon spp. cv. Tifton 85 (used in this study) (Tonato et al., 2010).For each polygon we chose one of those grasses, based on itshigher climatic potential forage accumulation.
The equation relating forage accumulation potential (CPA) forgenotype g and minimum temperature (Tmin) for month i inregion (polygon) r is:
CPAi;r;g ¼ ðminðTmini;r ; TugÞ � TbgÞ � Sg (1)
where Tbg is the base temperature (8.4 8C for Cynodon and 12.01 8Cfor Urochloa), and Sg is the productivity response to temperature(7.97 for Cynodon and 10.66 for Urochloa). Tu is the upper limitfor productivity response to temperature, assumed as being 20 8Cfor both genotypes.
Step 2 – Water-restricted potential forage accumulation (WRA)
To include the negative impact of water deficit on potentialforage accumulation, we multiplied, for each month, the climaticpotential forage accumulation estimated above by the waterrequirement satisfaction index (WRSI). Water requirement satis-faction index varies from zero to one and represents the fraction ofthe water actually consumed by plants by the total amount ofwater that would be needed by plants to ensure maximumproductivity. A water requirement satisfaction index of 1 meansthere is no water stress. The water requirement satisfaction indexis calculated through the evapotranspiration deficit (Allen et al.,1998), i.e., the ratio between the actual evapotranspiration (AETc)and potential crop evapotranspiration (PETc). Evapotranspiration,the sum of evaporation and plant transpiration, was calculatedaccording to the method described in Camargo et al. (1999). Actualpasture evapotranspiration was reduced whenever there was notenough soil water to achieve monthly potential evapotranspira-tion. Evapotranspiration is here a function of monthly precipitation(R), soil water-holding capacity (WHC), and monthly mean andmaximum temperatures. A simplified soil water balance model(one compartment with soil-dependent depth of plant rootsystem) with a one-month time step was used to calculate soilwater content throughout the year for normal climate data.Formally:
PETci;r ¼ kc � Q0i;r� Ti;r � Ni (2)
PSWi;r ¼ SWi�1;r þ Ri;r � PETci;r (3)
SWi;r ¼maxðPSWi;r ; WHCrÞ; PSWi;r � 00; otherwise
�(4)
AETci;r ¼PETci;r ; PSEi;r � 0SWi�1;r þ Ri;r ; otherwise
�(5)
WRSIi;r ¼AETci;r
PETci;r(6)
B.B.N. Strassburg et al. / Global Environmental Change 28 (2014) 84–97 87
where SWi,r is the soil water content for the ith month in region r
(mm), Ri,r is the rainfall in the ith month (mm) in region r, kc is thesingle crop coefficient (assumed to be equal to 1.0 for grazedpastures, which is a conservative value within the range of 0.75 to1.05 recommended for grazing pasture (Allen et al., 1998)), PETci,r
is the potential crop evapotranspiration in the ith month in region r
(mm), AETci is the actual crop evapotranspiration in the ith month(mm), Q0 is the global solar radiation, (TTi;r and WHC is the soilwater-holding capacity (mm)).
Water-restricted pasture forage accumulation (WRA, kg/ha/d)for month i, region r and genotype g was then estimated, in dry-matter basis, as:
WRAi;r;g ¼ CPAi;r;g � WRSIi;r (7)
Step 3 – Seasonal deficit and the Potential Stocking Rates (PSR)
In Brazil, most of the feed (>95%) consumed by cattle comesfrom pasture. Therefore, stocking rates were calculated byassuming pastures as the only feed source (again, a conservativeapproach). Constant stocking rates were assumed throughout theyear, as seasonal slaughter and calving are not usual in Brazil.Therefore, daily demand for feed (DDF, kg/ha/d) is calculated as afunction of stocking rate, expressed as animal-units per ha, (SR,AU/ha) through Eq. (8).
DDFðSRÞ ¼ SR � IE
(8)
where I is the daily feed intake per animal unit (constant, kg/AU/d)and E is the grazing efficiency (dimensionless). We adoptedI = 8 kg/AU/d, following the Forage and Grazing TerminologyCommittee (FGTC, 1992). Grazing efficiency (dimensionless) wasset at 0.5 (i.e., 50%), considered a realistic value for advancedsystems in Brazil (Barioni et al., 2005).
Feed deficits, resulting from year-round grazing with constantdaily demand for feed (for a given stocking rate) and pastureforage accumulation (WRA) varying seasonally, may precludereaching the stocking rates that would be attainable withoutsupplementation, if average pasture production was evenlydistributed. Some of the uneven distribution of pasture productioncan be tolerable because pasture herbage mass can vary withinsome limits, therefore working as a stock of feed (Santos et al., 2013;Euclides et al., 2007). In our estimate, we constrained stockingrates to not result in more than 1500 kg/ha of accumulated seasonalfeed deficit (ASFD, kg/ha) during the year (Eq. (9)).
ASFDi;r;gðSRÞ ¼Xi
j¼1
minðWRA j;r;g � DDFðSRÞ; 0Þ (9)
where j is an auxiliary index to allow computing ASFD.Sustainable carrying capacity SCC (AU/ha) of pastures of
genotype g in a region r is then estimated by maximising thestocking rate, solving the optimisation problem described by Eqs.(10) and (11):
SCCr;g ¼ MaximizeðSRÞ (10)
Subject to:
ASFDi;r;gðSRÞ � � 1500; 8 i (11)
The potential stocking rate is finally estimated by finding thehighest sustainable carrying capacity attainable in the region withany of the genotypes, g = Cynodon or Urochloa considered in theanalysis, i.e.,
SCCr ¼ maxðSCCr;gÞ; 8 g (12)
Climate data were obtained from the Climatic Research Unit(University of East Anglia; CRU-UEA) database, available at 50 by
50 resolution and we used 1961–1990 averages for all variables.Soil data was obtained from the Brazilian Institute of Geographyand Statistics (IBGE, 2001).
2.2.2. Estimate 2
For Estimate 2, we applied the same process as for Estimate 1,but used a Brazilian climatic dataset (data from a network of 3437meteorological stations in Brazil (Assad and Pinto, 2008),interpolated using the Ordinary Kriging interpolation method, infunction of their latitudes and longitudes).
2.2.3. Estimate 3
For Estimate 3, data for pasture forage accumulation wasobtained from the Global Agro-Ecological Zones 2009 project(FAO/IIASA, 2010) (Supplementary Material). Sustainable carry-ing capacity was then obtained through the same process asEstimates 1 and 2 (Fig. 1b and Supplementary Material Fig. S2aand b).
2.2.4. Sustainable carrying capacity in 2040
We also modelled the carrying capacity in 2040 by substituting,in Estimate 1, the current climatic data for those projected for 2040according to the HadCM3 model using the A2 emissions scenario,also available from the CRU-UEA. To assess the impact of changesin temperature and precipitation, we ran the model three times.First, we kept precipitation at current levels and used 2040temperature projections (Supplementary Material; Fig. S3a). Then,we kept temperatures constant at current levels and used 2040precipitation projections (Supplementary Material; Fig. S3b).Finally, we applied 2040 projections for both parameters(Supplementary Material; Fig. S3c).
There were positive impacts due to temperature changesbecause of increases in minimum temperature, whereas nega-tive impacts arose from heightened water stress due toincreased evapotranspiration. Precipitation changes impactedthe water deficit, leading to positive impact where precipitationincreased and negative impact where it decreased. Bothparameters also impacted seasonal deficits. These estimatesdo not capture the potential impact of an increase in thefrequency of extreme events, which might have a substantialnegative impact on yields (IPCC, 2007). As the estimated positiveimpact is largely due to changes in precipitation patterns, andthese are highly variable across climate models (Malhi et al.,2009), we opted for a conservative approach of only includingnegative impacts of climate change on the potential carryingcapacity used for the subsequent steps.
Because all analyses were performed independently for eachcarrying capacity estimate, our results are independently basedboth on the grass model based on (Tonato et al., 2010) and onGlobal Agro-ecological Assessment study (GAEZ) data. Comparisonof total potential carrying capacity for three different estimates ispresented in Appendix A (Table A.1). For further details onmodelling please refer to Supplementary Material.
2.3. Future demand for land
We obtained future demand projections for meat, crops andbiofuel from the Brazilian Ministry of Agriculture and FAO. The FAOstudy was a comprehensive modelling effort and included dietarychanges, price elasticity feedbacks and a range of policies scenarios(FAO, 2006b). Beef demand, herd productivity and herd necessaryto meet demands until 2040 along with areas demanded for cropsand planted forest until 2040 are presented in Appendix B. In orderto be conservative, for each product and time period, the projecteddemand in this study was the highest among Brazilian and FAOprojections.

B.B.N. Strassburg et al. / Global Environmental Change 28 (2014) 84–9788
2.4. Allocation process and scenarios
We investigated two allocation scenarios for the future landuse. In the ‘Current Reality’ scenario, crop–livestock and forest–livestock systems are allocated following current productionpatterns. For each use, suitable polygons in municipalities withhigher current production are selected first, then additionalpolygons are selected until enough land is allocated to producethe necessary outcome in 2040. The rationale is that, given currentconditions, it might be easier to expand the production of a givencrop or timber production in regions that already have consolidat-ed industries for that product. Cattle productivity is then increasedby the same fraction on all polygons with cattle production untilenough meat is produced to meet demands in 2040.
In the ‘Restoration’ scenario, the goal was to maximise the arealiberated for restoration of natural ecosystems. Crops wereallocated to suitable polygons with the lowest potential carryingcapacity while silvopastoral systems were allocated to polygonswith the highest carrying capacity. Stocking rates were thenincreased to 90% of the sustainable carrying capacity, starting inthe polygons where carrying capacity is higher, until enough meatwas produced. This extreme scenario provides a theoretical upperlimit (with 90% of the carrying capacity) for the area that could beliberated for restoration.
A simple iterative process was applied to spatially allocatedifferent land uses (sugarcane, soybean, maize) and stockingrates across cultivated pasturelands to meet 2040 demands. First,the allocation order of each land use was decided according tothe scenario being analysed (see above). Then, ‘unrestricted’(given use-specific constraints) polygons are ranked according tocriteria pertaining to the use and scenario (SupplementaryMaterial, Figs. S4, S5 and Table S3). In the third step, polygons areselected, beginning with the top-ranking ones and movingdownward, until enough land is allocated to meet demand.Finally, the cattle herd necessary to meet projected meat demandis allocated following scenario-specific criteria, always respect-ing the estimated sustainable carrying capacity (SupplementaryMaterial; Table 4).
Crop and timber production were restricted to pasturelandareas free of use-specific constraints. Sugarcane (for consumptionand biofuel) was restricted to suitable areas according to the recentsugarcane zoning assessment, which included climate risk (bothnow and in 2040) and slope constraints (Supplementary Material,Fig. S4c). Crop production (using agropastoral systems) wereallocated in areas that presented low climatic risk for each cropboth in 2000 and 2040, and steep areas (inclination >158) wereexcluded (Supplementary Material, Fig. S4a–c). Timber production(using silvopastoral systems) was also excluded from steep areas.
2.5. Greenhouse gas mitigation estimate and herd growth constraints
We applied the IPCC Good Practice Guidance (Penman et al.,2003) in order to estimate the mitigation impact of avoideddeforestation arising from improving cattle ranching productivityon existing pasturelands. We also investigated whether theprojected increase in herd productivity would be feasible giveninitial conditions and herd growth constraints, applying IPCC Tier 2guidelines (IPCC, 2009). Detailed methods on greenhouse gasescalculations are available online in Supplementary Material.
3. Results and discussion
3.1. Current and potential productivity of Brazilian pasturelands
We found that the current productivity of Brazilian pasture-lands (94 million animal units) is 32–34% of their estimated
carrying capacity (274–293 million animal units), indicating asubstantial potential to increase productivity. The potentialcarrying capacity of Brazilian pasturelands was found to be 286million animal units, 293 million animal units and 274 millionanimal units for Estimates 1, 2 and 3, respectively (Appendix A,Table A.1). Final values for Estimate 1 are shown in Fig. 1b, whereasfinal values for Estimates 2 and 3 are shown in Fig. S2a and Fig. S2b(Supplementary Material). The proximity among our threeestimates (Fig. 2a) suggests that our results are consistent acrossdifferent fodder grass models and climatic datasets.
The current low productivity of Brazilian pasturelands hasmultiple causes (Bowman et al., 2012; Bustamante et al., 2012;Macedo et al., 2012; Valentim and Andrade, 2009) including: (i)low technology level characterised by inadequate pasture man-agement (overgrazing and lack of maintenance fertilisation)leading to a widespread degradation and deficient animalmanagement (health, nutrition and breeding) resulting in lowanimal performance; (ii) land speculation, where cattle ranching isa means to secure land ownership with an aim to sell the landwhen the cropland frontier advances (in Brazil, farms that are notactively used can be expropriated for land reform, and extensivecattle ranching is among the simplest form of occupation); (iii)insecure tenure, which discourages investments in increasedproductivity and incentivise an extractivist model that leads todegradation; (iv) lack of long-term credit for the upfront costs ofincreasing productivity and lack of compliance of the propertieswith the environmental laws which prevents access to credit; (v)lack of appropriate extension and training services dedicated tocattle ranching productivity.
Pasture degradation is indeed one of the main causes of lowproductivity of cattle production systems and is driving conversionof native vegetation in the different Brazilian biomes (Fearnsideand Barbosa, 1998; Costa and Rehman, 1999; Valentim andAndrade, 2009; Bustamante et al., 2012). It is estimated that morethan 50% of the total area of cultivated pastures in the Cerrado(Costa and Rehman, 1999) and more than 60% in the Amazonbiome (Dias-Filho and Andrade, 2006) are degraded. In 2010, 39%of the deforested area in the Amazon biome was reported to beeither degrading pasture or abandoned area occupied by secondaryvegetation (Embrapa and INPE, 2013). More intensive, sustainablepasture and cattle production systems can however be already alsofound in Brazil (Vosti et al., 2001; Martha et al., 2012; Valentimet al., 2010). These systems are characterised with pastures ofhigher carrying capacity resulting in more animal products thatcan be sustained for longer than traditional extensive systems.These higher productivity systems require however more capitaland labour to be established and managed (Vosti et al., 2001).
3.2. Meeting future demands on already converted lands
We confirm our hypothesis that Brazil has enough land to meetdemand for products analysed here at least until 2040 withoutfurther conversion of natural habitats. Under the ‘Current Reality
scenario (Fig. 3a), which is keyed to current geographical patternsof production, these needs can be met within this time frame ifpasture productivity increases to 49–52% of the carrying capacityand increases in herd productivity follow historical trends(Appendix D). This 53% increase over 30 years would be equivalentto an annual increase of approximately 1.4%. In fact, despitedifferent spatial distributions, our hypothesis is confirmed in everycombination of scenarios and carrying capacity estimates (Fig. 3;Appendix C, Fig. C.1, Supplementary Material; Table S.5). Thisfinding suggests that there are several possible alternatives forland allocation able to meet demand in 2040. If, for instance,pasture productivity increases to 70% of its carrying capacity andherd productivity increases according to historical trends (Fig. 3b),

Fig. 2. Relations between productivity increase, land sparing, historical trends and avoided emissions. (a) Distribution of stocking rates across the 115 million hectares of
cultivated pasturelands for the current situation, and three estimates for potential carrying capacity. (b) Distribution of stocking rates across the 115 million hectares of
cultivated pasturelands for the current situation, Estimate 1 of potential carrying capacity and two scenarios that fulfil demands in 2040. In the reforestation scenario, low
productivity pastures are reforested and, as a consequence, their stocking rates equals zero. (c) Relationship between pasture productivity (x-axis, in % of carrying capacity)
and the extent of land liberated for restoration of native ecosystems (y-axis, in million hectares), for three herd productivity levels in 2040 (2008 levels, an annual increase
following the historical average and an annual increase that is half of the historical average). (d) Cattle ranching productivity over time: historical productivity, projected
productivity assuming that average annual growth remains constant and productivity required to meet all demands on current lands. (e) Relationship between herd
productivity levels (x-axis) and pasture productivity (in % of carrying capacity) necessary to meet all demands on current lands (highlighted herd productivity levels are:
minimum level required, constant at 2008 levels, projected following average historical increase, projected following half the average historical increase and projected
following the average increase after the 1994 Brazilian economic stabilisation; also highlighted are the herd productivity necessary to keep pasture productivity at 2002 levels
and still meet all demands (84 kg y�1/live animal) and current U.S.A. levels (125 kg y�1/live animal). (f) Mitigated emissions from avoided land use change, reduced enteric
herd emissions and total emissions (sum of emissions from land use change and enteric herd emissions) in CO2 equivalent.
B.B.N. Strassburg et al. / Global Environmental Change 28 (2014) 84–97 89
36 million hectares of cultivated pasturelands could be liberated.This area is 70% larger than the estimated 21 million hectares of‘legal deficit’ (deforested areas that should be restored so thatfarmers are in compliance with the environmental legislation)
(Soares-Filho, 2013). This ‘Restoration’ scenario (Fig. 3b) alsoillustrates the relation between intensification and land sparing(Fig. 2c). In particular, our results show that there is enough landfor a large-scale restoration of the Atlantic Rainforest, the ‘hottest

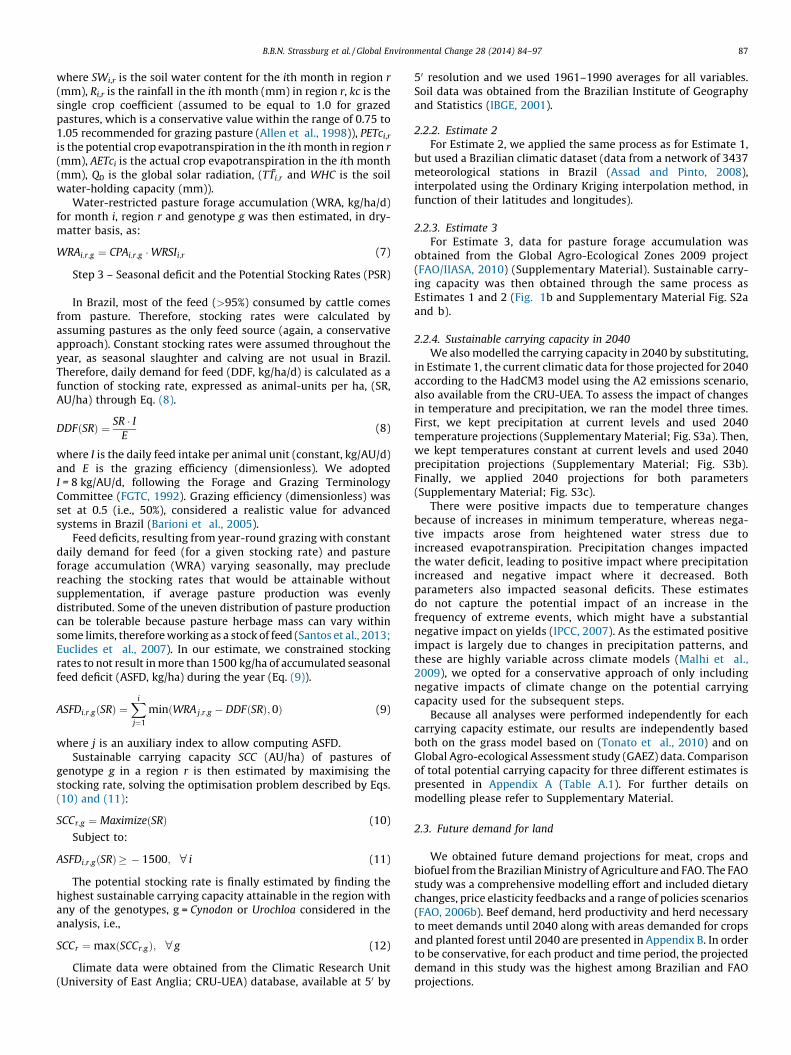
Fig. 3. Possible allocations of land-use systems in 2040 that satisfies demands for land-based products without further conversion of natural ecosystems. Alternative
allocations of cattle, sugarcane, crop–livestock (for soybean and maize), silvopastoral (for wood production) and reforestation areas in 2040. Two possible allocations
scenarios are presented for Estimate 1, incorporating negative climate change impacts. The ‘Current Reality scenario (a) follows current geographical patterns of production
and includes no reforestation. The ‘Restoration’ scenario (b) assumes that areas of low potential for cattle production and/or degraded areas will be recuperated for
reforestation. As a consequence, cattle required to meet demand in 2040 in the ‘‘Restoration’’ scenario was allocated into pastures of high-carrying capacity. Yellow
corresponds to sugarcane areas, green to reforestation, shades of blue correspond to mixed cattle–crop systems, shades of brown correspond to mixed cattle–timber systems
and shades of red correspond to pure cattle systems. Light shades correspond to low carrying capacity of pastures (0.00–1.00), medium shades to medium carrying capacity
(1.01–2.00) and dark shades to high carrying capacity (>2.00).
B.B.N. Strassburg et al. / Global Environmental Change 28 (2014) 84–9790
of hotspots’ (Laurance, 2009), where up to 18 million hectarescould be restored (Supplementary Material; Table S.6) withoutimpeding national agricultural expansion (Brancalion et al., 2012).This would more than double the remaining area of this biome,slow the massive species extinctions (Strassburg et al., 2012a) andsequester 7.5 billion tonnes of CO2 Eq.
Notably, the yearly increase in cattle ranching productivityrequired to meet anticipated demands for meat production whilefreeing up enough land for other uses is smaller than the averageyearly increase in productivity since 1970 (Fig. 2d). In fact,the productivity levels required in 2040 would be similar to whatmany countries (including developing nations) have alreadyachieved (Supplementary Material, Table S.1).
Indeed, there is already evidence in Brazil of agriculturalintensification and land sparing. A comparison of data betweenthe last two Brazilian agricultural censuses show that in theseven states where total cultivated lands remained constant orcontracted between 1995 and 2006, an expansion of croplandsand planted forests was compensated by a greater contraction ofcultivated pasturelands (Fig 4; Appendix D, Table D.1).Furthermore, despite a combined loss of 8.5 million hectaresof cultivated pasturelands (and further 7.8 million hectares ofnatural pasturelands), the combined cattle herd in these statesincreased by 5.8 million animals. In other words, the recenthistory in the most developed centre-south of Brazil has showedthat when the option of expanding the agricultural frontier islimited, the pressure to improve the use of available land has ledto increased productivity in pasturelands, which in turnliberated enough land for the expansion of croplands andplanted forests. Here we show that the same could be possible inthe rest of the country. Recent observations further suggest anincipient shift in this direction at the Amazon frontier (Macedoet al., 2012).
3.3. How improved cattle ranching productivity can be achieved
The necessary increase in cattle ranching productivity (annualmeat production per unit of pasture area) can be met by acombination of pasture productivity (number of animals per unitof pasture area) and herd productivity (annual meat productionper total number of animals) increases (Fig. 2e). Pastureproductivity can increase through improved fodder grass selection,the incorporation of legumes, tillage reduction, electric fencing,rotational grazing and the introduction of mixed systems (Tilmanet al., 2002). Herd productivity can increase for example throughimproved breed selection, reproductive management and earlierslaughtering.
Transition to improved cattle farming requires howeverinitial financial investment not only to provide fencing or soilenhancers (e.g. lime) and more sophisticated machinery forbetter pasture management and labour investments from thefarmers, but also requires provision of training, extension,market support and marketing organisations, access to roadsand relevant policy. This is critical as the capacity of farmers todetect, learn, and adapt to change within complex intensifiedsystems is a key component of successfully functioning pastureand avoiding environmental degradation. In particular, asignificant challenge is the training of the personnel fromdifferent sectors of the beef supply chain, including those whodeal directly with cattle, data collection and health managementand also those responsible for the property administration,slaughterhouse companies, distribution and handling andpreparation of intermediate and final products (Euclides-Filho,2004). In order for these changes to gain scale, technologytransfer, training services and credit provision would need tobe expanded (Van Vliet et al., 2012). The creation ofthe Low Carbon Agriculture Plan is a first step in addressing

Fig. 4. Recent trends in agricultural lands in Brazil (1995–2006). States in green experienced a contraction of their cultivated land areas. In each of these states, croplands and
planted forests expanded, but their expansion was compensated by an even greater reduction in cultivated pasturelands area. This reduction derived from greater
productivity, with average stocking rates rising from 0.71 to 0.94 animal units per hectare over the period. States in yellow also experienced increase of croplands and planted
forests alongside reduction of cultivated pasturelands, but the latter was smaller than the former, leading to an expansion of cultivated area. States in blue experienced the
opposite trend, with pastureland area expanding and croplands and planted forests contracting. States in brown experienced expansion of pasturelands, croplands and
planted forests. Calculations by the authors using data from the Brazilian Census Bureau (IBGE), full results shown in Table D1.
B.B.N. Strassburg et al. / Global Environmental Change 28 (2014) 84–97 91
the latter (BMA, 2010). Technologies and approaches incenti-vised by the Low Carbon Agriculture Plan (ABC in Portuguese)include implementation of crop–livestock–forestry systems,recuperation of degraded pasturelands and biological nitrogenfixation. Although the uptake of low-interest loans to apply theLow Carbon Agriculture Plan was very low between 2010 and2011, it has risen almost by 50% in 2012 (Angelo, 2012).
3.4. Climate change mitigation
Increasing cattle productivity while stopping the conversionof natural environments would be a major contribution totackling climate change, even without including the mitigationpotential from restoration. Indeed, we estimated emissionsreductions of 14.3 Gt CO2 until 2040 (Fig. 2f and SupplementaryMaterial). This mitigation potential stems from a reduction indeforestation (12.5 Gt CO2) and reduced enteric emissionsfrom the cattle herd due to smaller herd size and earlierslaughtering (1.8 Gt CO2). The economic value of thismitigation in 2040, if captured via the Reducing Emissions
from Deforestation and Forest Degradation (REDD) (Strassburget al., 2009) or similar mechanisms, could amount to US$143–286 billion at carbon prices of US$ 10–20/t CO2. Atthe same time, it has been estimated that increasing theproductivity of Brazilian pasturelands would require invest-ments of US$ 83 billion (World Bank, 2010), both in-farmand wider policy costs.
Although the establishment of cultivated pastures has beenthe main driver of conversion of native vegetation in the lastdecades in Brazil, there is still no clear understanding of thedirection of the resulting changes in soil carbon (C) stocks. Soil Cdynamics in pastures and whether pastures of increasedproductivity provide a net C sink or a net source of carbondepends of the soil type, history of land use, amount anddistribution of annual precipitation and, most importantly, ofpasture management (Fearnside and Barbosa, 1998; Neill andDavidson, 1999; Bustamante et al., 2012). It has however beendemonstrated (Vosti et al., 2001; Nepstad et al., 2009; Valentimand Andrade, 2009; Bustamante et al., 2012) that improvedpasture management and the adoption of more intensive cattle
B.B.N. Strassburg et al. / Global Environmental Change 28 (2014) 84–9792
production systems based on reclamation of degradedand degrading pasture areas, with species of grassesand legumes adapted to the different environmental conditionscan contribute to increase soil C stocks. Although aptlyperformed pasture intensification can lead to increased soil C,there is need for more research on how pastures of increasedproductivity impact soil C stocks.
3.5. Mitigating risks: the ‘‘rebound effect’’ and social considerations
Although an increase in productivity carries the potential forland sparing (Lapola et al., 2010), if complementary policies arenot implemented it can unintentionally lead to increaseddeforestation (Perfecto and Vandermeer, 2010). Since moreproductive systems are generally more profitable, policies fortheir implementation on a large scale must be coupled witheffective environmental governance to avoid further deforesta-tion for pasture expansion – a ‘‘rebound effect’’ (Angelsen, 1999;Bustamante et al., 2012; Nepstad et al., 2009; Vosti et al., 2001;Strassburg et al., 2012a,b). Brazil can take lessons from recentdevelopments in its own soybean industry, where a remarkableincrease in productivity made soybean farming much moreprofitable, transforming it into a leading cause of deforestation(Morton et al., 2006). The moratorium on soy production inareas deforested after 2006 virtually eliminated direct defores-tation related to soybean, although indirect deforestation,where soybean expands into pasturelands and pushes ranchersinto the forest, remains a challenge (Arima et al., 2011). Aproposed approach aimed both at tackling the rebound effectand indirect deforestation and at realising the land-sparingpotential of improved cattle ranching is the ‘‘Land NeutralAgricultural Expansion’’ mechanism (Strassburg et al., 2012b).There are number of positive outcomes for the farmersresulting from increasing pasture productivity, including in-creased profits (Strassburg et al., 2012b) and the growingdemand for livestock products may also represent an opportu-nity for livestock enterprises to provide food security and offerpathways out of poverty (Steinfeld and Gerber, 2010). However,transition from extensive systems may also result in loss oftraditional agriculture and way of farming (such as slash andburn), although the sustainability of some types of this‘traditional agriculture’ can be called into question. In addition,particularly small-scale livestock producers may be disadvan-taged by the industrialisation of livestock production. Attentionis therefore needed to ensure that improvements in agriculturalproductivity do not result in negative social consequences.Policies, such as territorial planning (e.g. through Brazil’seconomic-ecological zoning plans), security of land tenure,incorporating original landowners in any process of technologi-cal improvement, improved enforcement of existing environ-mental regulations, monitoring of land-use practices and othersocial considerations are paramount to ensuring that increasedcattle productivity results in environmental and social benefitsin the long-term (Calle et al., 2012).
4. Limitations
The central results of our study are based on two foddergrass biomass models and a range of spatial and climaticdatasets, and therefore carry the uncertainties associated tothose. We derived three distinct estimates for carrying capacity,one of which was based on a widely-used external database(FAO/IIASA, 2010) and attempted to be conservative in ourestimates where possible. There might be biological or chemicalfactors impacting carrying capacity unconsidered here, forinstance prevalence of cattle diseases or extreme soil acidity.
Soil acidity would however likely have limited impacts becausewe are focusing on areas already used as cultivated pasture-lands. Our estimates of climate change impacts and mitigationpotential are simplified.
The fact that our results indicate a substantial gap between thepotential carrying capacity of current pasturelands and theproductivity necessary to fulfil all demands additionally givesnevertheless confidence in conclusions drawn here.
The study is limited to examining the biophysical potentialof pastureland areas to support the future expansion ofBrazilian agriculture. Further research could focus on a rangeof associated aspects, including economic, social and culturalbarriers and opportunities for large scale implementation ofimproved agricultural systems, developing predictive spatialscenarios and planning to aide policy implementation.
5. Conclusions
The potential for increased productivity in croplands hasbeen previously demonstrated globally (Mueller et al., 2012),but less is known about pasturelands. Pasturelands occupy 2.8billion hectares globally (compared to 1.5 billion hectares ofcroplands) and meat consumption is expected to increase morerapidly in the coming decades (Smith et al., 2010; Tilman et al.,2002). In this paper, we demonstrated that Brazil already hasenough land under agricultural production in order to meetunprecedented increase in future demand for agriculturalproducts, while sparing land for nature. We exploredtwo scenarios and developed a simple iterative process toallocate land uses and stocking rates, and we estimatedsustainable carrying capacity for 2040, incorporating onlynegative climate change impacts and applying product-specificclimatic and terrain constraints, and pasturelands in legallyrestricted areas. Our results therefore refute the argumentoften raised by some agricultural stakeholders that there wouldnot be enough land to increase food production and restoreillegally deforested areas, often claimed in relation to therevision of the Brazilian agricultural and forest laws (Sparoveket al., 2010). Furthermore, sustainable intensification generatesan opportunity to plan and implement ‘whole landscapeapproach’ (Defries and Rosenzweig, 2010), combining increasedproductivity of agriculture with conservation and restoration ofnatural environments.
Yet, in order to realise the land-sparing potential fromincreased cattle ranching productivity, complementary policiessuch as territorial planning, improved law enforcement,monitoring and tenure security must be put in place. Furtherresearch could investigate whether our conclusion that Brazilhas already enough agricultural lands to support its futureneeds is true in other regional contexts and, ultimately, at theglobal level.
The next few decades may see the fastest, largest andperhaps last significant expansion of human demands on landsystems since the dawn of agriculture ten thousand years ago.How these demands are met will have profound and lastingimpacts on Earth’s natural and human systems.
Acknowledgements
B.B.N.S. and A.E.L. gratefully acknowledge the support of theWorld Wide Fund for Nature – Brazil (WWF-Brazil), the Gordonand Betty Moore Foundation, and the Norwegian Agency forDevelopment Cooperation (Norad). J.F.V. acknowledges the sup-port of the Gordon and Betty Moore Foundation. We thank fouranonymous Reviewers for their time and constructive commentsthat significantly improved this manuscript.

Appendix A. Comparison of total potential carrying capacity for different estimates analysed in this study
See Table A.1.
Table A.1Comparison of total potential carrying capacity for three different estimates. Estimate 1 is based on EMBRAPA model including
CRU climate data, Estimate 2 is based on EMBRAPA model including climatic data from (Pinto and Assad, 2008), Estimate 3 is
based on FAO GAEZ model and CRU. Estimates for 2040 were performed using EMBRAPA fodder model and HADCM3 (A2
Scenario) climate change projections also available from CRU. We also produced an estimate for 2040 considering only
negative impacts of climate change, which was used in place of Estimate 1 for allocations in 2040 (Fig. 3 in the main text).
Estimate Total carrying capacity (animal units)
Estimate 1 year 2000 286,038,163
Estimate 2 292,769,702
Estimate 3 273,519,070
Estimate 1 year 2040 – all climate change impacts 377,440,819
Estimate 1 year 2040 – only negative climate change impacts 276,351,928
Appendix B. Areas demanded for meat, crops and planted forest until 2040
See Figs. B.1 and B.2.
Fig. B.1. Beef demand (a), herd productivity (b) and herd necessary to meet demands until 2040 (c). In order to derive conservative estimates for this study, the highest
projected demand for beef was chosen from different future projections. Green line represents values used in this study, yellow dashed line represents estimates from
Brazilian Ministry of Agriculture, blue dashed line represents FAO estimates. Herd productivity consists of the slaughter rate (ratio between total animals and slaughtered
animals per year) and the meat production per slaughtered animal. Blue line represents historical increase in herd productivity, green line presents future projections of herd
productivity increase. Total herd required to meet the projected demand was then calculated based on projected demand and productivity.
B.B.N. Strassburg et al. / Global Environmental Change 28 (2014) 84–97 93

Fig. B.2. Areas demanded for crops and planted forest until 2040. (a) Soybean, (b) maize, (c) sugarcane, (d) planted forest. In order to derive conservative estimates for this
study, the highest projected growth rates were adopted from different future projections, thus leading to higher demands in land area. Green line represents values used in
this study, yellow dashed line represents estimates from Brazilian Ministry of Agriculture, blue dashed line represents FAO estimates. For planted forest we adopted values
from FAO.
B.B.N. Strassburg et al. / Global Environmental Change 28 (2014) 84–9794

Appendix C. Alternative allocations of cattle, sugarcane, crop-livestock (for soybean and maize), silvopastoral (for woodproduction) and reforestation areas in 2040
See Fig. C.1.
Fig. C.1. Alternative allocations of cattle, sugarcane, crop–livestock (for soybean and maize), silvopastoral (for wood production) and reforestation areas in 2040. Two possible
allocations scenarios are presented for Estimates 2 and 3 for carrying capacity of pastures (two scenarios for Estimate 1, incorporating negative climate change impacts, are
presented in Fig. 3 in the main text). The ‘current reality’ scenario assumes business-as-usual of current geographical patterns of production and no reforestation. The
‘Restoration’ scenario assumes that areas of low potential for cattle production and/or degraded areas will be recuperated for reforestation. As a consequence, cattle required
to meet demand in 2040 in the ‘‘Restoration’’ scenario was allocated into pastures of high-carrying capacity. (a) ‘‘Current reality’’ scenario, Estimate 2, (b) ‘‘Current reality’’
scenario, Estimate 3, (c) ‘‘Restoration’’ scenario, Estimate 2, (d) ‘‘Restoration’’ scenario, Estimate 3. Yellow corresponds to sugarcane areas, green to reforestation, shades of blue
correspond to mixed cattle–crop systems, shades of brown correspond to mixed cattle–timber systems and shades of red correspond to pure cattle systems. Light shades
correspond to low carrying capacity of pastures (0.00–1.00), medium shades to medium carrying capacity (1.01–2.00) and dark shades to high carrying capacity (>2.00).
B.B.N. Strassburg et al. / Global Environmental Change 28 (2014) 84–97 95

Appendix D. Trends in total cultivated area, croplands, planted forests, pasturelands area and stocking rates for all Brazilian statesbetween 1995 and 2006
See Table D.1.
Table D.1Trends in total cultivated area, croplands, planted forests, pasturelands area and stocking rates for all Brazilian states between 1995 and 2006. Own calculations, based on data
from the Brazilian Census Bureau (IBGE).
States Total cultivated area Croplands and planted forests Cultivated pasturelands Stocking rates (AU/ha)
1995 2006 % Change 1995 2006 % Change 1995 2006 % Change 1995 2006 % Change
Acre 639 1052 65 87 171 96 552 881 60 0.54 1.65 206
Alagoas 1222 1257 3 850 907 7 373 350 �6 0.68 0.83 22
Amapa 130 202 55 105 158 51 26 44 72 0.27 0.29 7
Amazonas 445 1459 228 236 883 273 208 576 176 1.07 1.08 1
Bahia 10,840 13,157 21 4187 5450 30 6653 7708 16 0.48 0.59 23
Ceara 1591 2249 41 1393 1934 39 197 314 59 0.6 0.63 5
Distrito Federal 149 147 �1 86 101 16 62 47 �25 0.89 0.87 �2
Espırito Santo 2060 2158 5 1001 938 �6 1058 1220 15 0.76 1.11 46
Goias 16,515 16,263 �2 2248 3687 64 14,267 12,576 �12 0.67 0.92 37
Maranhao 3756 6536 74 850 2518 196 2907 4018 38 0.55 0.81 47
Mato Grosso 18,282 23,809 30 3020 6392 112 15,262 17,417 14 0.46 0.84 83
Mato Grosso do Sul 17,293 17,032 �2 1565 2286 46 15,728 14,747 �6 0.72 0.79 10
Minas Gerais 17,574 17,000 �3 5880 6173 5 11,694 10,826 �7 0.56 0.86 54
Para 6748 10,983 63 923 1939 110 5825 9043 55 0.76 1.13 49
Paraıba 849 877 3 656 668 2 193 210 9 0.4 0.46 15
Parana 11,113 10,482 �6 5814 7086 22 5300 3395 �36 0.98 1.45 48
Pernambuco 1947 2380 22 1246 1720 38 700 660 �6 0.45 0.74 64
Piauı 1139 2012 77 679 1386 104 459 626 36 0.62 0.48 �23
Rio de Janeiro 1007 992 �1 363 363 0 644 629 �2 0.86 1.14 33
Rio Grande do Norte 682 773 13 594 685 15 88 88 0 0.41 0.6 46
Rio Grande do Sul 7422 8638 16 6266 7684 23 1157 954 �18 0.85 1.06 25
Rondonia 3052 5048 65 473 514 9 2579 4534 76 0.94 1.67 78
Roraima 430 435 1 134 117 �13 296 318 7 0.13 0.49 277
Santa Catarina 2692 2785 3 2132 2339 10 560 446 �20 0.9 1.42 58
Sao Paulo 12,909 11,279 �13 5853 7247 24 7056 4032 �43 1.02 1.3 27
Sergipe 811 874 8 282 320 13 529 555 5 0.48 0.79 65
Tocantins 5545 5901 6 267 678 154 5277 5223 �1 0.35 0.67 91
Brazil (total) 146,842 165,781 13 47,190 64,344 36 99,652 101,437 2 0.64 0.91 42
B.B.N. Strassburg et al. / Global Environmental Change 28 (2014) 84–9796
Appendix E. Supplementary data
Supplementary data associated with this article can be found, inthe online version, at doi:10.1016/j.gloenvcha.2014.06.001.
References
Alexandratos, N., Bruinsma, J., 2012. World Agriculture Towards 2030/2050. The2012 Revision. ESA Working Paper No. 12-03. FAO, Rome.
Allen, R.G., Pereira, L.S., Raes, D., Smith, M., 1998. Crop Evapotranspiration - Guide-lines for Computing Crop Water Requirements. FAO Irrigation and DrainagePaper 56. FAO, Rome.
Angelo, C., 2012. Brazil’s fund for low-carbon agriculture lies fallow. Nature, http://dx.doi.org/10.1038/nature.2012.11111.
Angelsen, A., 1999. Agricultural expansion and deforestation: modelling the impactof population, market forces and property rights. J. Dev. Econ. 58 (1), 185–218.
Arima, E.Y., Richards, P., Walker, R., Caldas, M.M., 2011. Statistical confirmation ofindirect land use change in the Brazilian Amazon. Environ. Res. Lett. 6.
Assad, E.D., Pinto, H.S., 2008. Aquecimento Global e a Nova Geografia da ProducaoAgrıcola no Brasil. Publicacoes Tecnico-Cientıficas, EMBRAPA. Available from:http://www.embrapa.br/publicacoes/tecnico/aquecimentoglobal.pdf/view.
Baillie, J.E.M., Hhilton-Taylor, C., Stuart, S.N., 2004. IUCN Red List of ThreatenedSpecies. A Global Species Assessment. Gland, Switzerland/Cambridge, UK.
Barioni, L.G., Ramos, A.K.B., Martha Jr., G.B., Ferreia, A.C., Silva, F.A.M., Vilela, L.,Veloso, R.F., 2005. Orcamentacao forrageira e Ajustes em Taxas de Lotacao. In:Simposio sobre manejo da pastagem, Piracicaba, vol. 22, pp. 217–245.
BMA, 2010. Brazilian Ministry of Agriculture, Programa Agricultura de BaixoCarbono-ABC. Ministerio da Agricultura, Pecuaria e Abastecimento, Brasılia,Brazil. Available from: http://www.agricultura.gov.br/desenvolvimento-sus-tentavel/programa-abc (accessed 12.12).
Bowman, M.S., Soares-Filho, B.S., Merry, F.D., Nepstad, D.C., Rodrigues, H.,Almeida, O.T., 2012. Persistence of cattle ranching in the Brazilian Amazon:a spatial analysis of the rationale for beef production. Land Use Policy 29,558–568.
Brancalion, P.H.S., viani, R.A.G., Strassburg, B.B.N., Rodrigues, R.R., 2012. Finding themoney for tropical forest restoration. Unasylva 63, 239.
Burney, J.A., Davis, S.J., Lobell, D.B., 2010. Greenhouse gas mitigation by agriculturalintensification. Proc. Natl. Acad. Sci. U.S.A. 107, 12052–12057.
Bustamante, M.M.C., Nobre, C.A., Smeraldi, R., Aguiar, A.P.D., Barioni, L.G., Fer-reira, L.G., Longo, K., May, P., Pinto, A.S., Ometto, J.P.H.B., 2012. Estimatinggreenhouse gas emissions from cattle raising in Brazil. Clim. Change 115,559–577.
Calle, Z., Murgueitio, E., Chara, J., 2012. Intensive silvopastoral systems integrateforestry, sustainable cattle ranching and landscape restoration. Unasylvia 63,31–40.
Camargo, A.P., Marin, F.R., Sentelhas, P.C., Picini, A.G., 1999. Ajuste da equacao deThornthwaite para estimar a evapotranspiracao potencial em climas aridos esuperumidos, com base na amplitude termica diaria. Rev. Bras. Agrometeorol. 7,251–257.
Costa, F.P., Rehman, T., 1999. Exploring the link between farmers’ objectives and thephenomenon of pasture degradation in the beef production systems of CentralBrazil. Agric. Syst. 61 (2), 135–146.
Defries, R., Rosenzweig, C., 2010. Toward a whole-landscape approach for sustain-able land use in the tropics. Proc. Natl. Acad. Sci. U.S.A. 107, 19627–19632.
Dias-Filho, M.B., Andrade, C.M.S., 2006. Pastagens no tropico umido. Documentos241. Embrapa Amazonia Oriental.
Embrapa & INPE, 2013. Levantamento de informacoes de uso e cobertura da terra naAmazonia – 2010. Available from: http://www.inpe.br/cra/projetos_pesquisas/sumario_terraclass_2010.pdf.
Euclides-Filho, K., 2004. Supply chain approach to sustainable beef production froma Brazilian perspective. Livest. Prod. Sci. 90, 53–61.
Euclides, V.P.B., Flores, R., Medeiros, R.N., Oliveira, M.P., 2007. Diferimento de pastosde braquiaria cultivares Basilisk e Marandu, na regiao do Cerrado. Pesq. Agro-pec. Bras. 42, 273–280.
FAO (Food and Agriculture Organization), 2006a. World Agriculture: Towards 2030/2050. FAO, Rome.
FAO, 2006b. World Agriculture: Towards 2030/2050. Prospects for Food, Nutrition,Agriculture and Major Commodity Groups. Interim Report Prospects for Food,Nutrition, Agriculture and Major Commodity Groups. Global Perspective Stud-ies Unit Food and Agriculture Organization of the United Nations, Rome.

B.B.N. Strassburg et al. / Global Environmental Change 28 (2014) 84–97 97
FAO (Food and Agriculture Organization of the United Nations)/IIASA (InternationalInstitute for Applied Systems Analysis), 2010. FAO/IIASA Global Agro-ecologicalAssessment Study. GAEZ.
IBGE, 2001. Mapa de Solos do Brasil. Brazilian Institute of Geography and Statistics.Available from: http://mapas.ibge.gov.br/solos/viewer.htm.
Fearnside, P.M., Barbosa, R.I., 1998. Soil carbon changes from conversion of forest topasture in Brazilian Amazonia. Forest Ecol. Manag. 108 (1–2), 147–166.
FGTC, Forage and Grazing Terminology Committee, 1992. Terminology for grazinglands and grazing animals. J. Prod. Agric. 5, 191–201.
Foresight, 2011. The Future of Food and Farming 2011. Final Project Report. TheGovernment Office for Science, London.
FAO, 2010. Global Forest Resources. Main Report. FAO Forestry Paper. Food andAgriculture Organization.
Gibbs, H.K., Ruesch, A.S., Achard, F., Clayton, M.K., Holmgren, P., Ramankutty, N.,Foley, J.A., 2010. Tropical forests were the primary sources of new agriculturalland in the 1980s and 1990s. Proc. Natl. Acad. Sci. U.S.A. 107, 16732–16737.
Godfray, H.C.J., Beddington, J.R., Crute, I.R., Haddad, L., Lawrence, D., Muir, J.F., Pretty,J., Robinson, S., Thomas, S.M., Toulmin, C., 2010. Food security: the challenge offeeding 9 billion people. Science 327, 812–818.
Herrero, M., Thornton, P.K., Notenbaert, A.M., Wood, S., Msangi, S., Freeman, H.A.,Bossio, D., Dixon, J., Peters, M., Van De Steeg, J., Lynam, J., Rao, P.P., Macmillan, S.,Gerard, B., Mcdermott, J., Sere, C., Rosegrant, M., 2010. Smart investments insustainable food production: revisiting mixed crop–livestock systems. Science327, 822–825.
IPCC, 2007. Intergovernmental Panel on Climate Change. IPCC Fourth AssessmentReport: Climate Change 2007.
IPCC, 2009. In: Eggleston, H.S., Buendia, L., Miwa, K., Ngara, T., Tanabe, K. (Eds.),Intergovernmental Panel on Climate Change Guidelines for National Green-house Gas Inventories, Prepared by the National Greenhouse Gas InventoriesProgramme. IGES, Japan.
Latawiec, A.E., Strassburg, B.N.S., Rodriguez, A.M., Matt, E., Nijbroek, R., Silos, M.,2014. Suriname: reconciling agricultural development and conservation ofunique natural wealth. Land Use Policy, http://dx.doi.org/10.1016/j.landuse-pol.2014.01.007.
Lambin, E.F., Meyfroidt, P., 2011. Global land use change, economic globalization,and the looming land scarcity. Proc. Natl. Acad. Sci. U.S.A. 108, 3465–3472.
Lapola, D.M., Schaldach, R., Alcamo, J., Bondeau, A., Koch, J., Koelking, C., Priess, J.A.,2010. Indirect land-use changes can overcome carbon savings from biofuels inBrazil. Proc. Natl. Acad. Sci. U.S.A. 107, 3388–3393.
Lapola, D.M., Martinelli, L.A., Peres, C.A., Ometto, J.P.H.B., Ferreira, M.E., Nobre, C.A.,Aguiar, A.P.D., Bustamante, M.M.C., Cardoso, M.F., Costa, M.H., 2014. Pervasivetransition of the Brazilian land-use system. Nat. Clim. Change 4, 27–35.
Laurance, W.F., 2009. Conserving the hottest of the hotspots Preface. Biol. Conserv.142, 1137.
Macedo, M.N., Defries, R.S., Morton, D.C., Stickler, C.M., Galford, G.L., Shimabukuro,Y.E., 2012. Decoupling of deforestation and soy production in the southernAmazon during the late 2000s. Proc. Natl. Acad. Sci. U.S.A. 109, 1341–1346.
Malhi, Y., Aragao, L.E.O.C., Galbraith, D., Huntingford, C., Fisher, R., Zelazowski, P.,Sitch, S., Mcsweeney, C., Meir, P., 2009. Exploring the likelihood and mechanismof a climate-change-induced dieback of the Amazon rainforest. Proc. Natl. Acad.Sci. U.S.A. 106, 20610–20615.
Martha, G.B., Alves, E., Contini, E., 2012. Land-saving approaches and beef produc-tion growth in Brazil. Agric. Syst. 110, 173–177.
Mesquita, H.N.E.A., 2009. Relatorio Tecnico De Monitoramento do Desmantamentono Bioma Cerrado, 2002 a 2008: Dados Revisados. Centro de SensoriamentoRemoto – CSR/IBAMA.
Morton, D.C., Defries, R.S., Shimabukuro, Y.E., Anderson, L.O., Arai, E., Espirito-Santo,F.D.B., Freitas, R., Morisette, J., 2006. Cropland expansion changes deforestationdynamics in the southern Brazilian Amazon. Proc. Natl. Acad. Sci. U.S.A. 103,14637–14641.
Mott, G.O., 1960. Grazing pressures and the measurement of pastures production.In: Proceedings of the 8th International Grassland Congress. pp. 606–611.
Mueller, N.D., Gerber, J.S., Johnston, M., Ray, D.K., Ramankutty, N., Foley, J.A., 2012.Closing yield gaps through nutrient and water management. Nature 490, 254–257.
Neill, C., Davidson, E.A., 1999. Soil carbon accumulation for loss following defores-tation for pasture in the Brazilian Amazon. Global Clim. Change Trop. Ecosyst.197–211.
Nepstad, D., Soares-Filho, B.S., Merry, F., Lima, A., Moutinho, P., Carter, J., Bowman,M., Cattaneo, A., Rodrigues, H., Schwartzman, S., Mcgrath, D.G., Stickler, C.M.,Lubowski, R., Piris-Cabezas, P., Rivero, S., Alencar, A., Almeida, O., Stella, O., 2009.The end of deforestation in the Brazilian Amazon. Science 326, 1350–1351.
Penman, J., Gytarsky, M., Hiraishi, T., Krug, T., Kruger, D., Pipatti, R., Buendia, L.,Miwa, K., Ngara, T., Tanabe, K., Wagner, F., 2003. Good Practice Guidance forLand Use. In: Land-Use Change and Forestry. IPCC National Greenhouse GasInventories Programme and Institute for Global Environmental Strategies,
Kanagawa, Japan. Available at: http://www.ipcc-nggip.iges.or.jp/public/gpglulucf/gpglulucf_contents.
Perfecto, I., Vandermeer, J., 2010. The agroecological matrix as alternative to theland-sparing/agriculture intensification model. Proc. Natl. Acad. Sci. U.S.A. 107,5786–5791.
Phalan, B., Balmford, A., Green, R.E., Scharlemann, J.P.W., 2011. Minimising the harmto biodiversity of producing more food globally. Food Policy 36, S62–S71.
Phalan, B., Bertzky, M., Butchart, S.H.M., Donald, P.F., Scharlemann, J.P.W., Statters-field, A.J., Balmford, A., 2013. Crop expansion and conservation priorities intropical countries. PLoS One 8.
Pinto, H.S., Assad, E.D., 2008. Global warming and the new geography of agriculturalproduction in Brazil.
PROBIO, 2009. Land Use and Land Cover Classification of Brazilian Biomes. Ministryof Environment, Brazil. Available from: www.mma.gov.br/probio.
Royal Society of London, 2009. Reaping the Benefits: Science and the SustainableIntensification of Global Agriculture. Royal Society, London.
Santos, M.E.R., Silveira, M.C.T., Gomes, V.M., Fonseca, D.M., Sousa, B.M.L., Santos,A.D.D., 2013. Pasture height at the beginning of deferment as a determinant ofsignal grass structure and potential selectivity by cattle. Anim. Sci. 35, 379–385.
Smith, P., Gregory, P.J., Van Vuuren, D., Obersteiner, M., Havlik, P., Rounsevell, M.,Woods, J., Stehfest, E., Bellarby, J., 2010. Competition for land. Philos. Trans. R.Soc. B: Biol. Sci. 365, 2941–2957.
Soares-Filho, B.S., 2013. Impacto da revisao do Codigo Florestal: como viabilizar ogrande desafio adiante? Brasılia, DF. , pp. 28. Retrieved from: http://www.sae.-gov.br/site/wp-content/uploads/Artigo-codigo-florestal.pdf.
Sparovek, G., Berndes, G., Klug, I.L.F., Barretto, A.G.O.P., 2010. Brazilian agricultureand environmental legislation: status and future challenges. Environ. Sci.Technol. 44, 6046–6053.
Steinfeld, H., Gerber, P., 2010. Livestock production and the global environment:consume less or produce better? Proc. Natl. Acad. Sci. U.S.A. 107, 18237–18238.
Strassburg, B., Latawiec, A.E., Creed, A., Nguyen, N., Sunnenberg, G., Miles, L., Lovett,A., Joppa, L., Ashton, R., Scharlemann, J.P.W., Cronenberger, F., Iribarrem, A.,2014. Biophysical suitability, economic pressure and land-cover change: aglobal probabilistic approach and insights for REDD+. Sustain. Sci. 9 (2),129–141.
Strassburg, B., Turner, R.K., Fisher, B., Schaeffer, R., Lovett, A., 2009. Reducingemissions from deforestation – the ‘‘combined incentives’’ mechanism andempirical simulations. Global Environ. Change: Hum. Policy Dimens. 19,265–278.
Strassburg, B.B.N., Rodrigues, A.S.L., Gusti, M., Balmford, A., Fritz, S., Obersteiner, M.,Turner, R.K., Brooks, T.M., 2012. Impacts of incentives to reduce emissions fromdeforestation on global species extinctions. Nat. Clim. Change 2, 350–355.
Strassburg, B.B.N., Micol, L., Ramos, F., Seroa, D.A., Motta, R., Latawiec, A., Lisauskas,F., 2012. Increasing Agricultural Output While Avoiding Deforestation – A CaseStudy for Mato Grosso, Brazil. International Institute for Sustainability, Rio deJaneiro, Brazil.
Tilman, D., Cassman, K.G., Matson, P.A., Naylor, R., Polasky, S., 2002. Agriculturalsustainability and intensive production practices. Nature 418, 671–677.
Tilman, D., Fargione, J., Wolff, B., D’antonio, C., Dobson, A., Howarth, R., Schindler, D.,Schlesinger, W.H., Simberloff, D., Swackhamer, D., 2001. Forecasting agricul-turally driven global environmental change. Science 292, 281–284.
Tonato, F., Barioni, L.G., Silveira Pedreira, C.G., Dantas, O.D., malaquias, J.V., 2010.Desenvolvimento de modelos preditores de acumulo de forragem em pastagenstropicais. Pesq. Agropec. Bras. 45, 522–529.
UNEP-WCMC, 2010. United Nations Environment Programme World ConservationMonitoring Centre (UNEP-WCMC), 2009–2010. UNEP-WCMC Species Database.UNEP-WCMC, Cambridge, UK., In: http://www.unep-wcmc.org.
Valentim, J.F., Andrade, C.M.S., 2009. Tendencias e perspectivas da pecuaria bovinana Amazonia brasileira. Amazonia: Ciencia & Desenvolvimento, Belem 4 (8),7–27.
Valentim, J.F., Andrade, C.M.S., Barioni, L.G., 2010. Reconciling Cattle Ranching andEnvironmental Conservation in the Legal Brazilian Amazon. Embrapa Acre.Available from: http://iquiri.cpafac.embrapa.br/upload_files/policy_brief_re-conciling_cattle_ranching_and_enviromental_conservation_in_teh_brazilia-n_amazon.pdf.
Van Vliet, N., Mertz, O., Heinimann, A., Langanke, T., Pascual, U., Schmook, B., Adams,C., Schmidt-Vogt, D., Messerli, P., Leisz, S., Castella, J.-C., Jorgensen, L., Birch-Thomsen, T., Hett, C., Bruun, T.B., Ickowitz, A., Kim Chi, V., Yasuyuki, K., Fox, J.,Padoch, C., Dressler, W., Ziegler, A.D., 2012. Trends, drivers and impacts ofchanges in swidden cultivation in tropical forest-agriculture frontiers: a globalassessment. Global Environ. Change: Hum. Policy Dimens. 22, 418–429.
Vosti, S.A., Carpentier, C.L., Witcover, J., Valentim, J.F., 2001. Intensified small-scalelivestock Brazilian Amazon. In: Angelsen, A., Kaimowitz, D. (Eds.), AgriculturalTechnologies and Tropical Deforestation. pp. 113–133.
World Bank, 2010. Brazil Low-Carbon Country Case Study. The World Bank Group.