global coal and coke flowspetcokeconsulting.com/content/pdfs/201212061919123.pdfglobal coal and coke...
TRANSCRIPT
Global Coal and Coke Flows,
2008
Phil Fisher
Pet Coke Consulting
Argus Petroleum Coke Summit
September 17-18, 2009
Houston, TX
www.petcokeconsulting.com cell 01 (415) 265 9324
1 How much steam coal is produced/ consumed?
2 Who are biggest Producers? Consumers?
3 How much /where is the steam coal trade?
4 How much/why/where is the FG coke trade?
5 Anomalies in FG coke trade
6. Where is FG coke trade headed?
Global Coal and Coke Flows What we will see:
• Paris based
• Energy Policy Advisor to 28 Member countries
• Policies: – Energy Security
– Economic Development
– Environmental Protection
About the International Energy Agency (IEA)
www.petcokeconsulting.com cell 01 (415) 265 9324
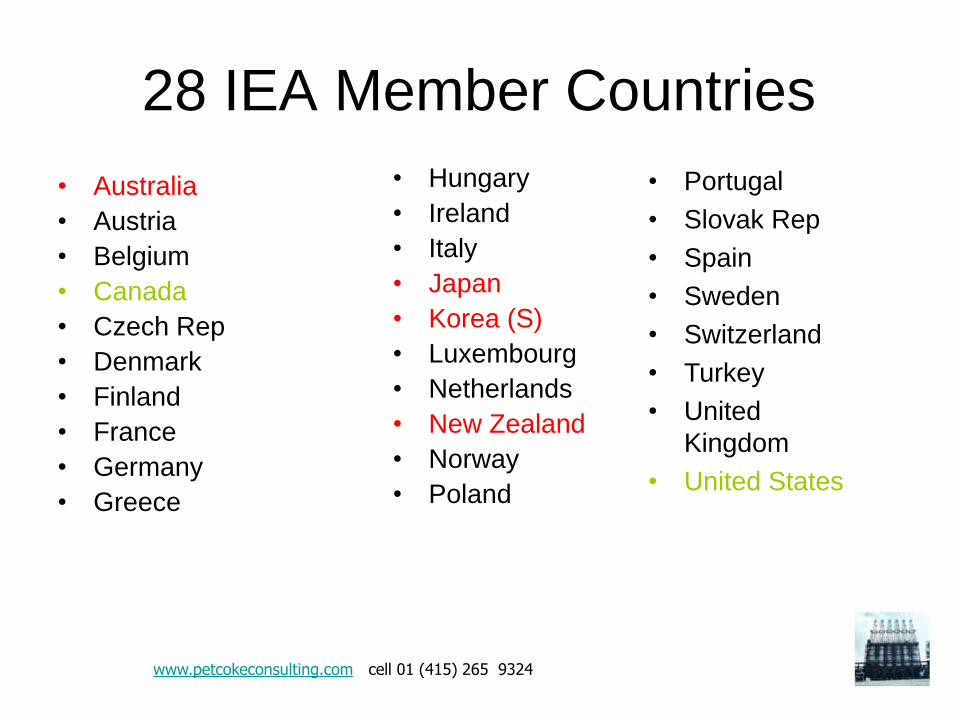
28 IEA Member Countries
• Australia
• Austria
• Belgium
• Canada
• Czech Rep
• Denmark
• Finland
• France
• Germany
• Greece
• Hungary
• Ireland
• Italy
• Japan
• Korea (S)
• Luxembourg
• Netherlands
• New Zealand
• Norway
• Poland
• Portugal
• Slovak Rep
• Spain
• Sweden
• Switzerland
• Turkey
• United
Kingdom
• United States
www.petcokeconsulting.com cell 01 (415) 265 9324
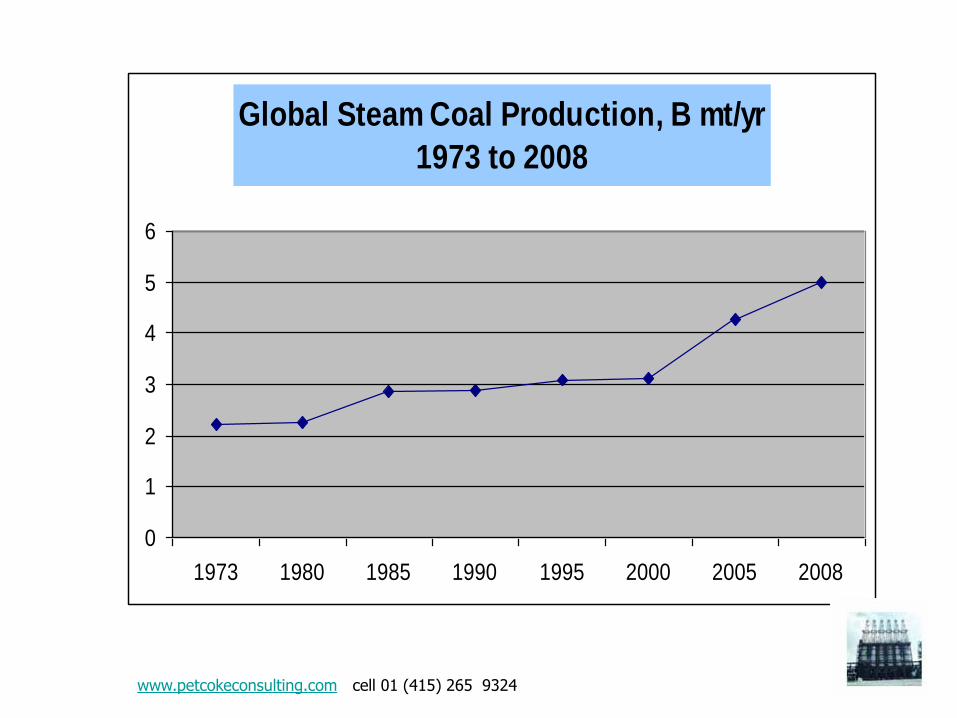
Global Steam Coal Production, B mt/yr
1973 to 2008
0
1
2
3
4
5
6
1973 1980 1985 1990 1995 2000 2005 2008
www.petcokeconsulting.com cell 01 (415) 265 9324
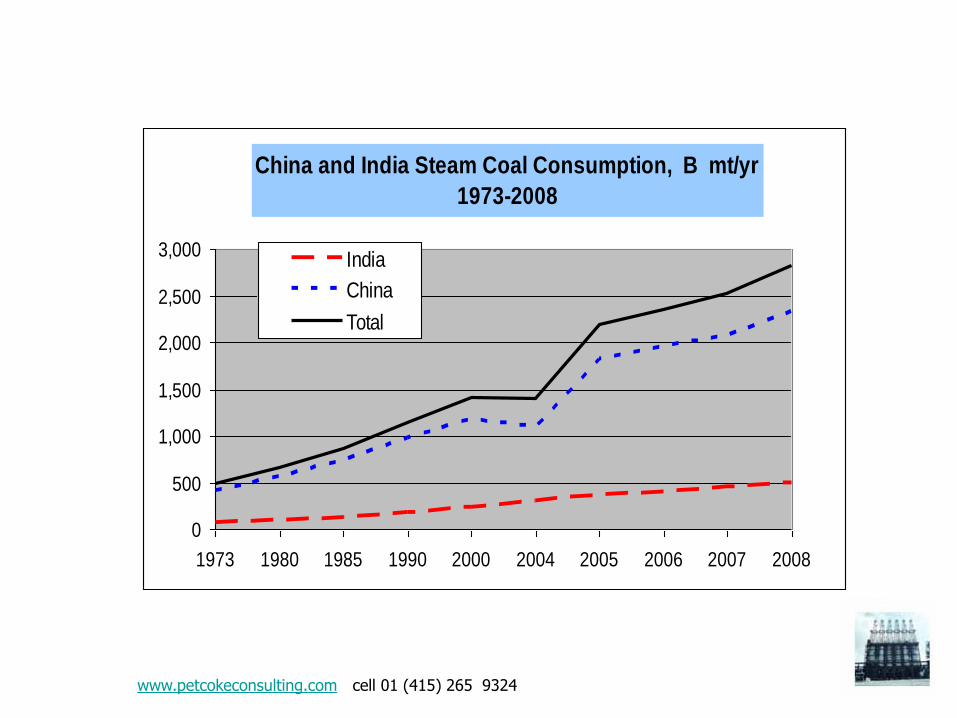
China and India Steam Coal Consumption, B mt/yr
1973-2008
0
500
1,000
1,500
2,000
2,500
3,000
1973 1980 1985 1990 2000 2004 2005 2006 2007 2008
India
China
Total
www.petcokeconsulting.com cell 01 (415) 265 9324
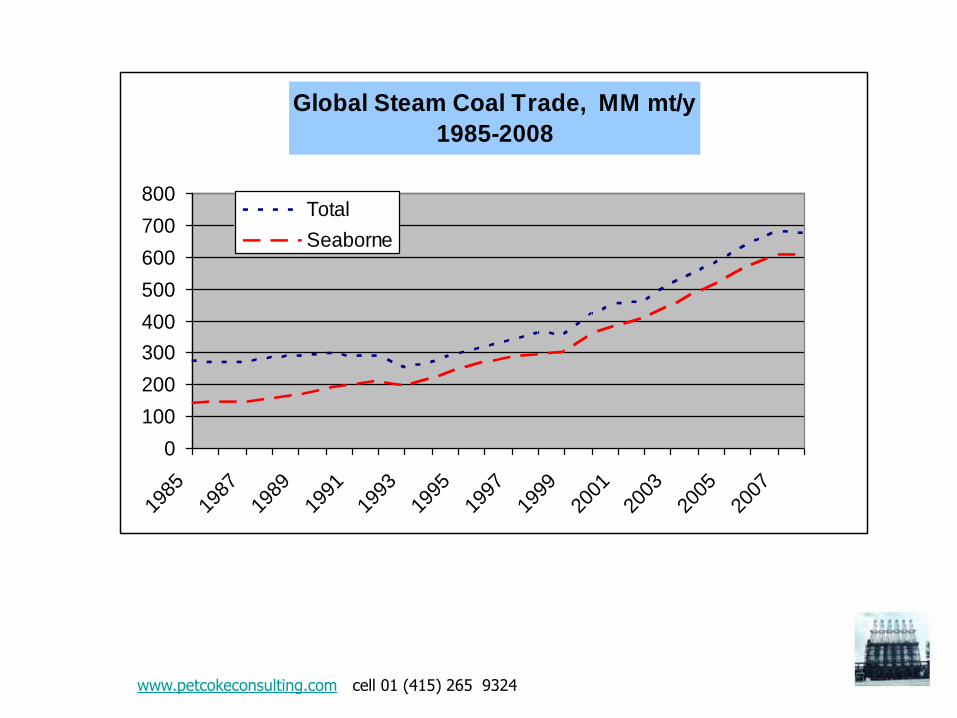
Global Steam Coal Trade, MM mt/y
1985-2008
0
100
200
300
400
500
600
700
800
1985
1987
1989
1991
1993
1995
1997
1999
2001
2003
2005
2007
Total
Seaborne
www.petcokeconsulting.com cell 01 (415) 265 9324
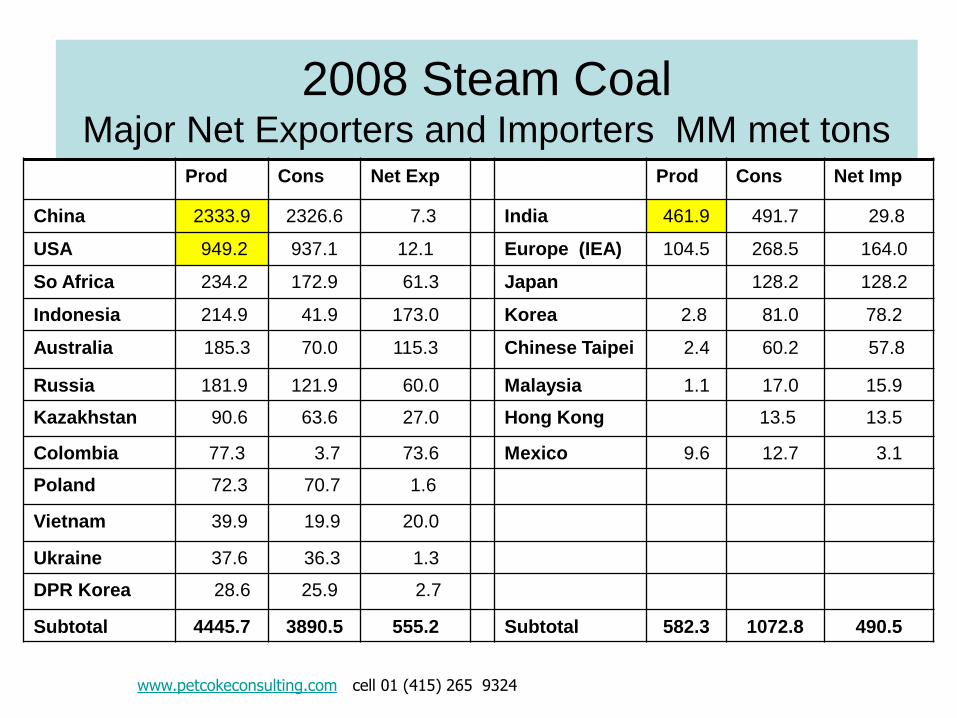
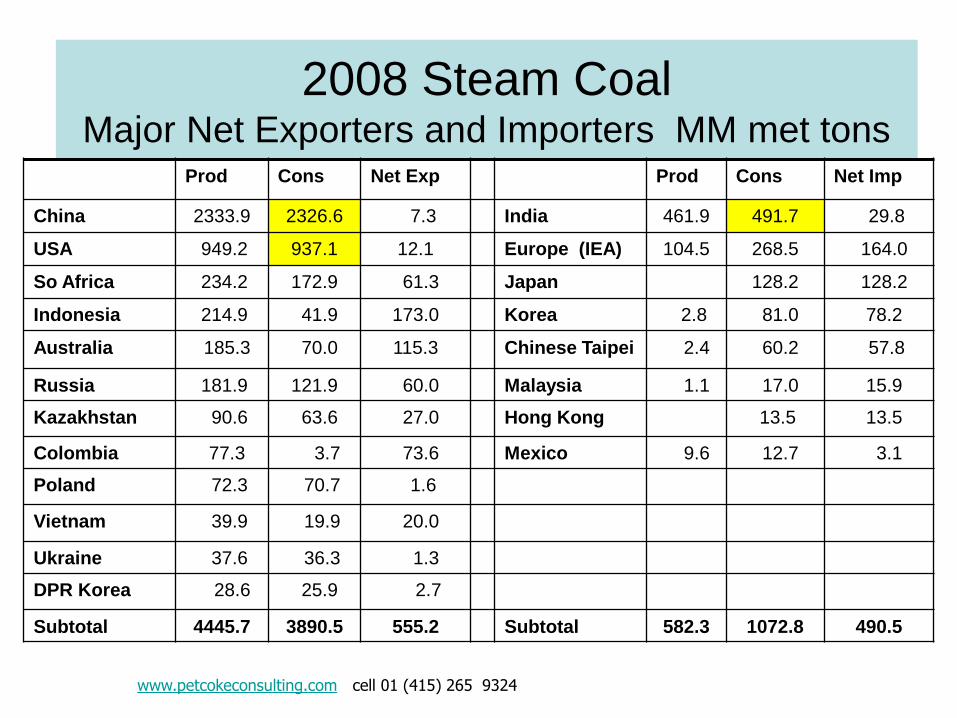
2008 Steam Coal Major Net Exporters and Importers MM met tons
Prod Cons Net Exp Prod Cons Net Imp
China 2333.9 2326.6 7.3 India 461.9 491.7 29.8
USA 949.2 937.1 12.1 Europe (IEA) 104.5 268.5 164.0
So Africa 234.2 172.9 61.3 Japan 128.2 128.2
Indonesia 214.9 41.9 173.0 Korea 2.8 81.0 78.2
Australia 185.3 70.0 115.3 Chinese Taipei 2.4 60.2 57.8
Russia 181.9 121.9 60.0 Malaysia 1.1 17.0 15.9
Kazakhstan 90.6 63.6 27.0 Hong Kong 13.5 13.5
Colombia 77.3 3.7 73.6 Mexico 9.6 12.7 3.1
Poland 72.3 70.7 1.6
Vietnam 39.9 19.9 20.0
Ukraine 37.6 36.3 1.3
DPR Korea 28.6 25.9 2.7
Subtotal 4445.7 3890.5 555.2 Subtotal 582.3 1072.8 490.5
www.petcokeconsulting.com cell 01 (415) 265 9324
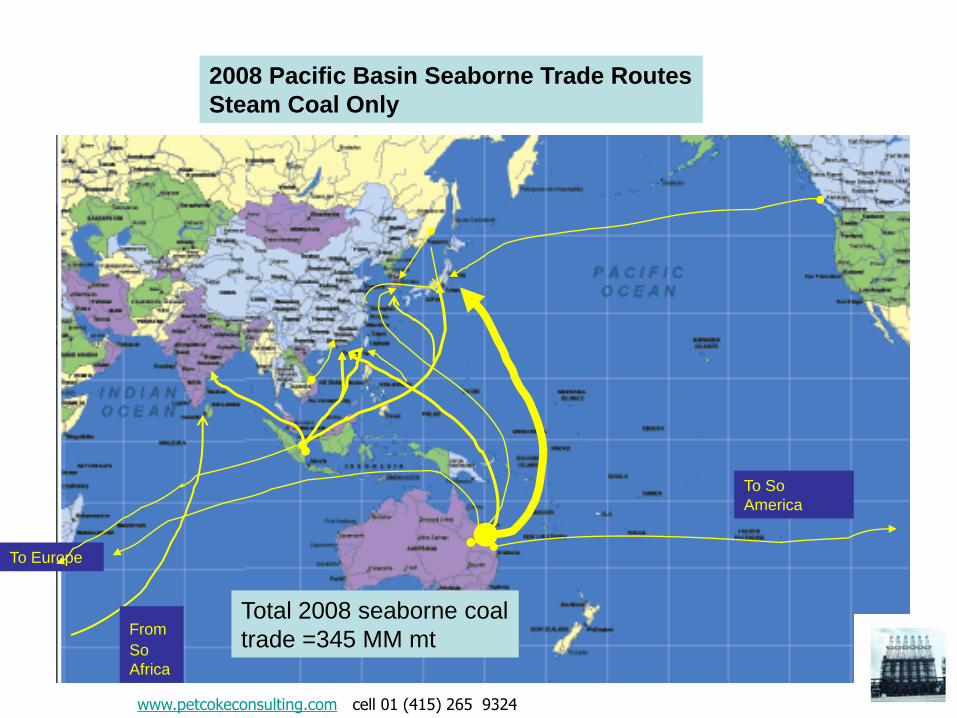
To Europe
To So
America
2008 Pacific Basin Seaborne Trade Routes
Steam Coal Only
Total 2008 seaborne coal
trade =345 MM mt From So
Africa
www.petcokeconsulting.com cell 01 (415) 265 9324
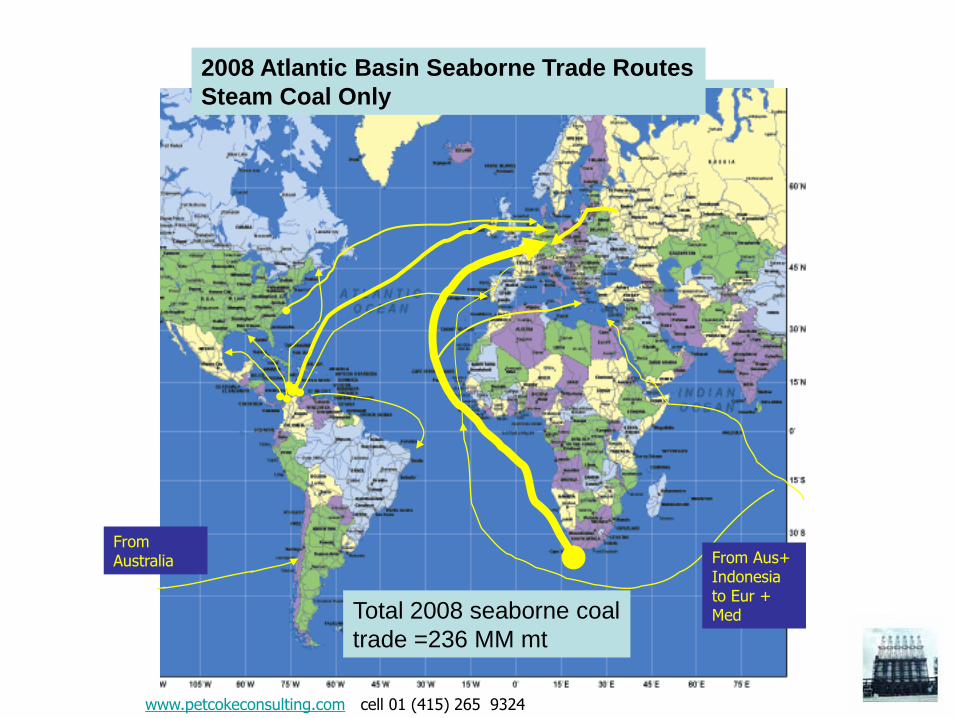
2006 Atlantic Basin Steam Coal
2008 Atlantic Basin Seaborne Trade Routes
Steam Coal Only
Total 2008 seaborne coal
trade =236 MM mt
From Aus+ Indonesia to Eur + Med
www.petcokeconsulting.com cell 01 (415) 265 9324
From Australia
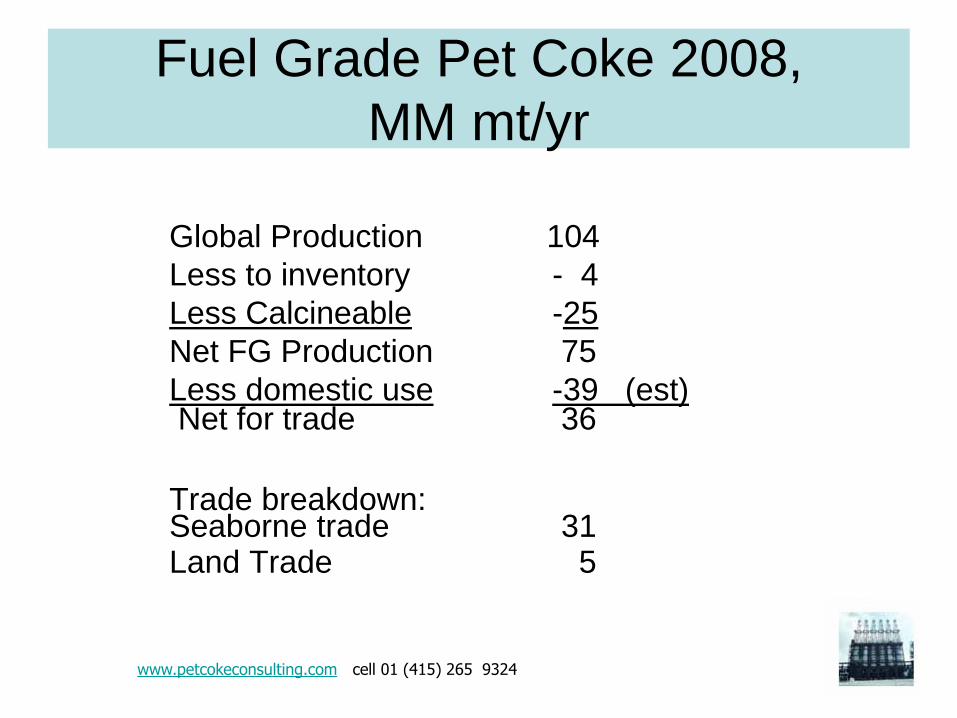
Fuel Grade Pet Coke 2008,
MM mt/yr
Global Production 104
Less to inventory - 4
Less Calcineable -25
Net FG Production 75
Less domestic use -39 (est) Net for trade 36 Trade breakdown: Seaborne trade 31 Land Trade 5
www.petcokeconsulting.com cell 01 (415) 265 9324
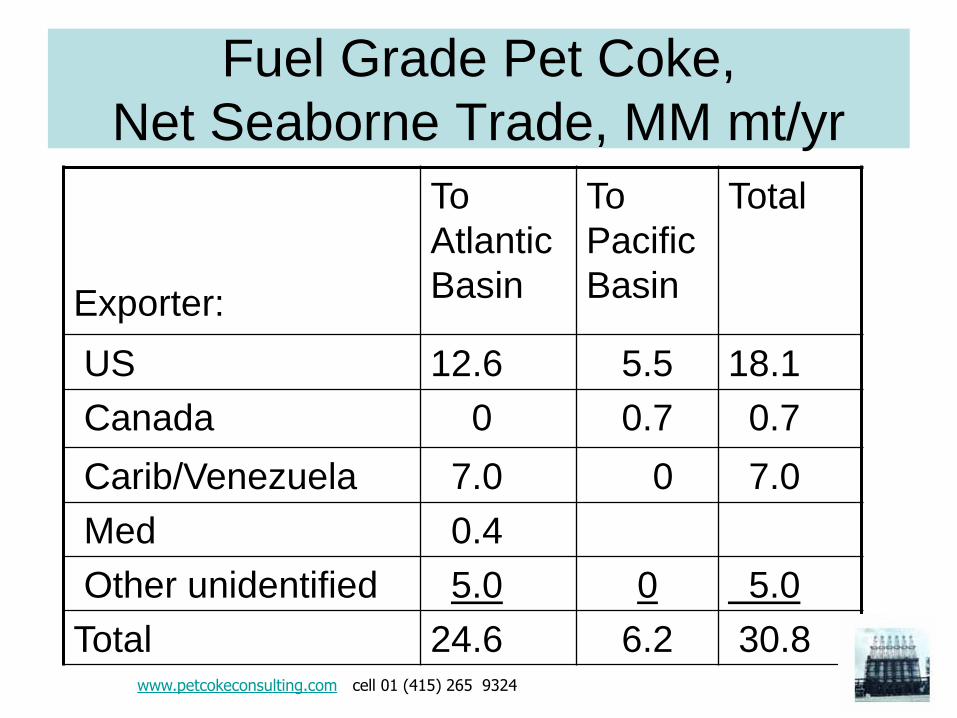
Fuel Grade Pet Coke,
Net Seaborne Trade, MM mt/yr
Exporter:
To
Atlantic
Basin
To
Pacific
Basin
Total
US 12.6 5.5 18.1
Canada 0 0.7 0.7
Carib/Venezuela 7.0 0 7.0
Med 0.4
Other unidentified 5.0 0 5.0
Total 24.6 6.2 30.8 www.petcokeconsulting.com cell 01 (415) 265 9324
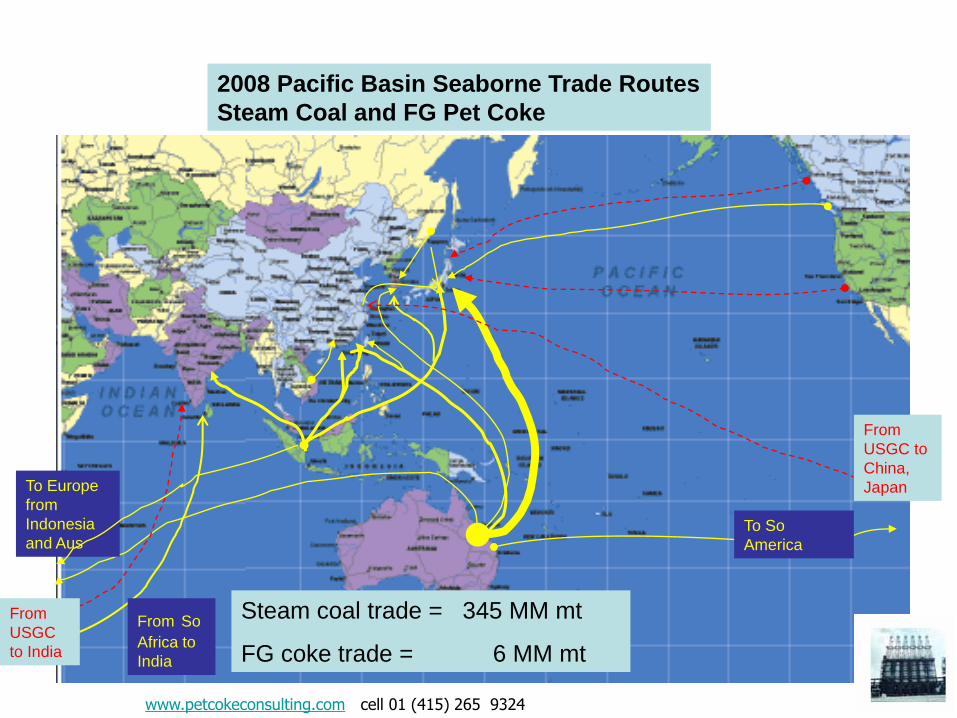
To Europe
from
Indonesia
and Aus To So
America
2008 Pacific Basin Seaborne Trade Routes
Steam Coal and FG Pet Coke
Steam coal trade = 345 MM mt
FG coke trade = 6 MM mt
From So
Africa to
India
From
USGC to
China,
Japan
www.petcokeconsulting.com cell 01 (415) 265 9324
From
USGC
to India
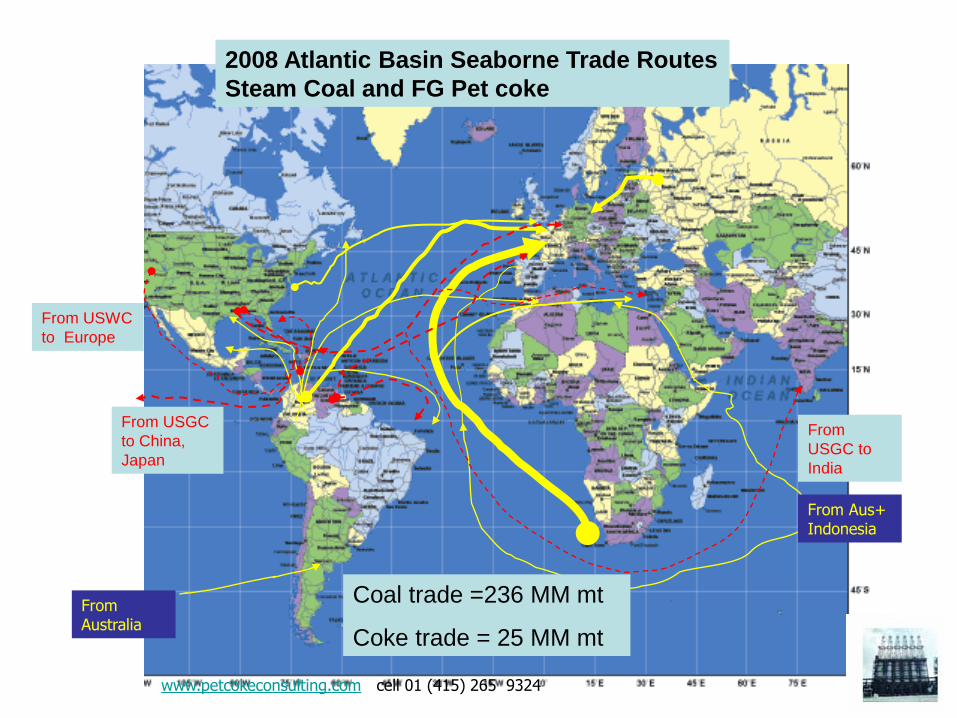
2006 Atlantic Basin Steam Coal
2008 Atlantic Basin Seaborne Trade Routes
Steam Coal and FG Pet coke
Coal trade =236 MM mt
Coke trade = 25 MM mt
From Aus+ Indonesia
www.petcokeconsulting.com cell 01 (415) 265 9324
From USGC
to China,
Japan
From USWC
to Europe
From Australia
From
USGC to
India
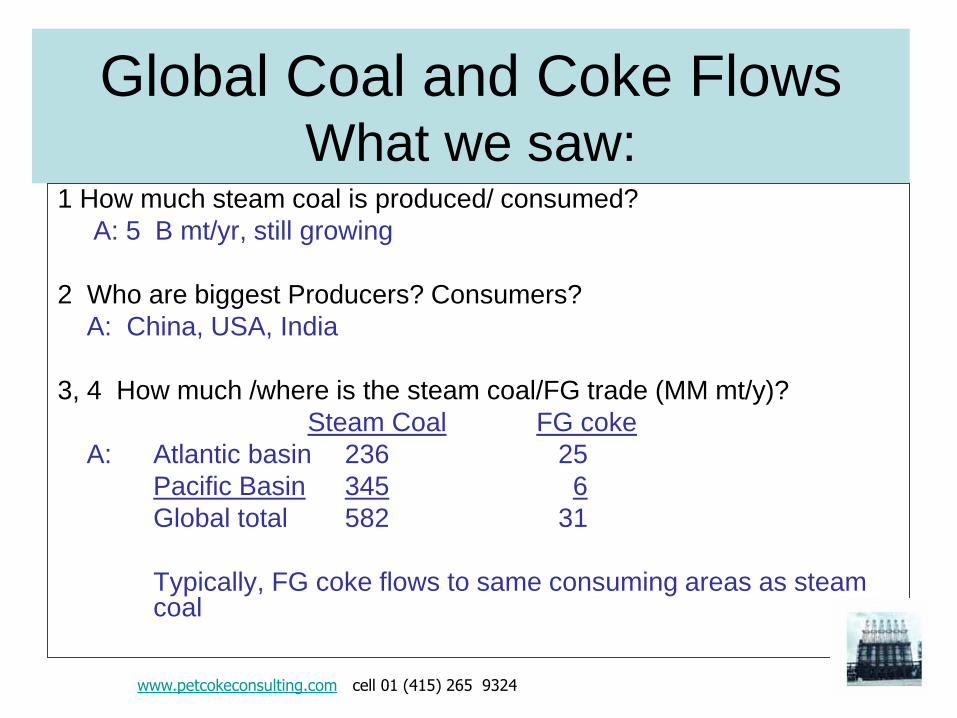
Global Coal and Coke Flows What we saw:
1 How much steam coal is produced/ consumed?
A: 5 B mt/yr, still growing
2 Who are biggest Producers? Consumers?
A: China, USA, India
3, 4 How much /where is the steam coal/FG trade (MM mt/y)?
Steam Coal FG coke
A: Atlantic basin 236 25
Pacific Basin 345 6
Global total 582 31
Typically, FG coke flows to same consuming areas as steam coal
www.petcokeconsulting.com cell 01 (415) 265 9324
Global Coal and Coke Flows
What we saw (cont’d)
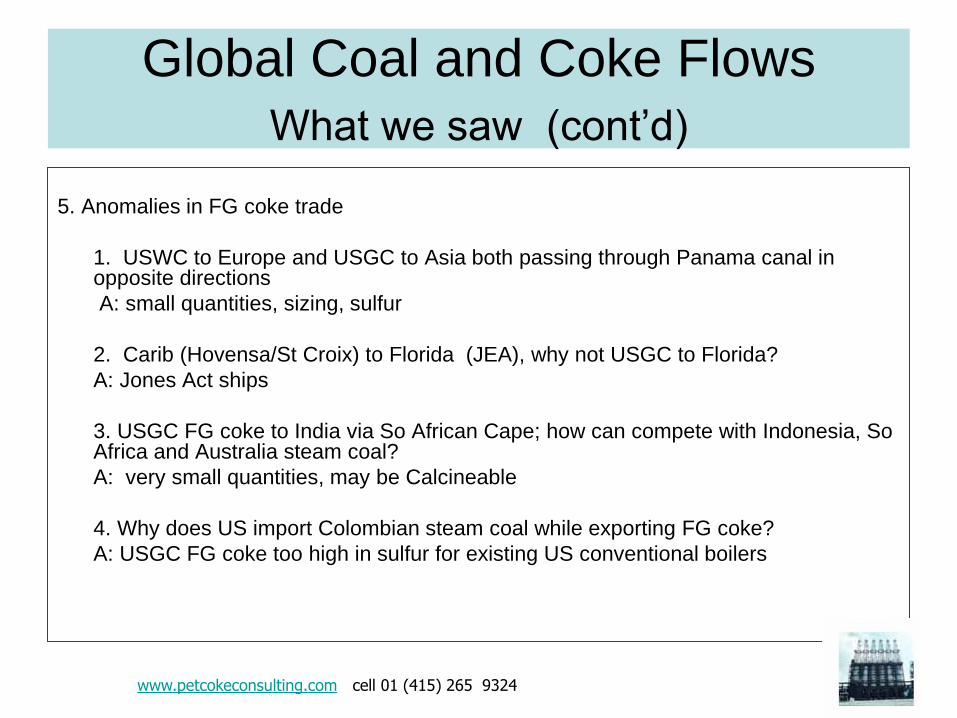
5. Anomalies in FG coke trade
1. USWC to Europe and USGC to Asia both passing through Panama canal in opposite directions
A: small quantities, sizing, sulfur
2. Carib (Hovensa/St Croix) to Florida (JEA), why not USGC to Florida?
A: Jones Act ships
3. USGC FG coke to India via So African Cape; how can compete with Indonesia, So Africa and Australia steam coal?
A: very small quantities, may be Calcineable
4. Why does US import Colombian steam coal while exporting FG coke?
A: USGC FG coke too high in sulfur for existing US conventional boilers
www.petcokeconsulting.com cell 01 (415) 265 9324
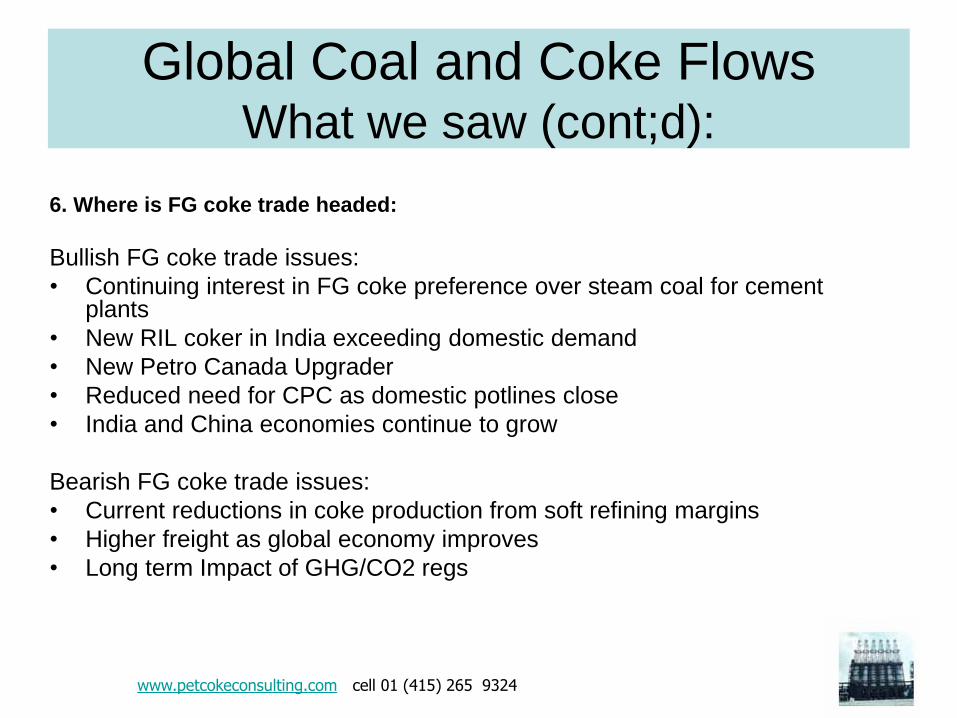
6. Where is FG coke trade headed:
Bullish FG coke trade issues:
• Continuing interest in FG coke preference over steam coal for cement plants
• New RIL coker in India exceeding domestic demand
• New Petro Canada Upgrader
• Reduced need for CPC as domestic potlines close
• India and China economies continue to grow
Bearish FG coke trade issues:
• Current reductions in coke production from soft refining margins
• Higher freight as global economy improves
• Long term Impact of GHG/CO2 regs
Global Coal and Coke Flows What we saw (cont;d):
www.petcokeconsulting.com cell 01 (415) 265 9324
Steam Coal And FG Coke trade
Reference charts
Following 4 slides are for reference
• Steam coal producers rank 1990, 2000, 2008
• Pacific Basin Steam Coal seaborne trade
(majors only)
• Atlantic Basin Steam Coal seaborne trade
(majors only)
• FG Coke seaborne trade
www.petcokeconsulting.com cell 01 (415) 265 9324
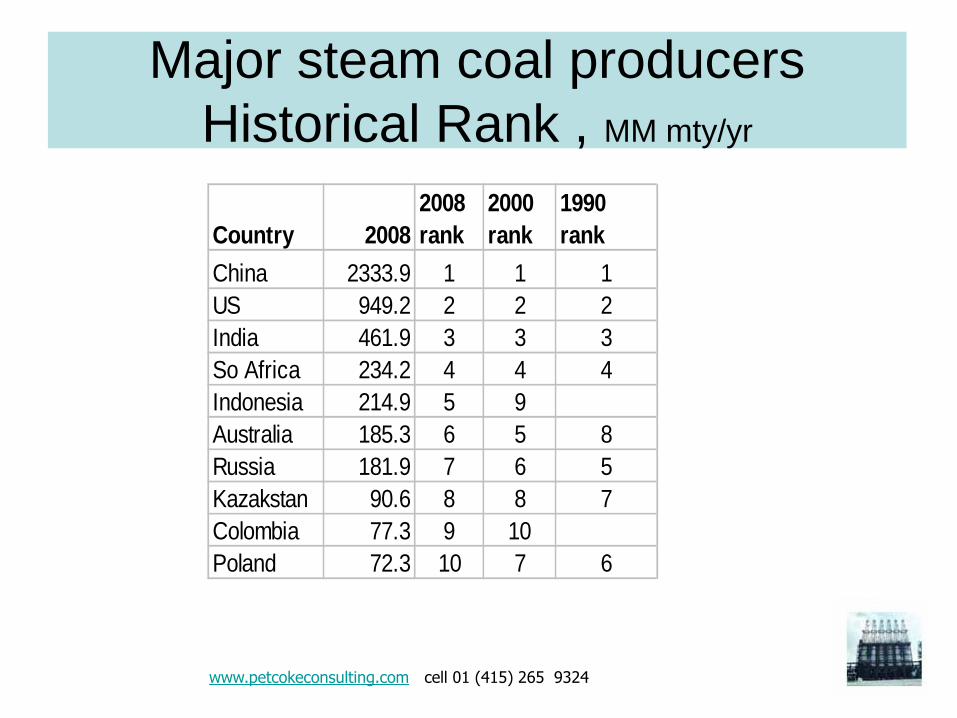
Major steam coal producers
Historical Rank , MM mty/yr
Country 2008
2008
rank
2000
rank
1990
rank
China 2333.9 1 1 1
US 949.2 2 2 2
India 461.9 3 3 3
So Africa 234.2 4 4 4
Indonesia 214.9 5 9
Australia 185.3 6 5 8
Russia 181.9 7 6 5
Kazakstan 90.6 8 8 7
Colombia 77.3 9 10
Poland 72.3 10 7 6
www.petcokeconsulting.com cell 01 (415) 265 9324
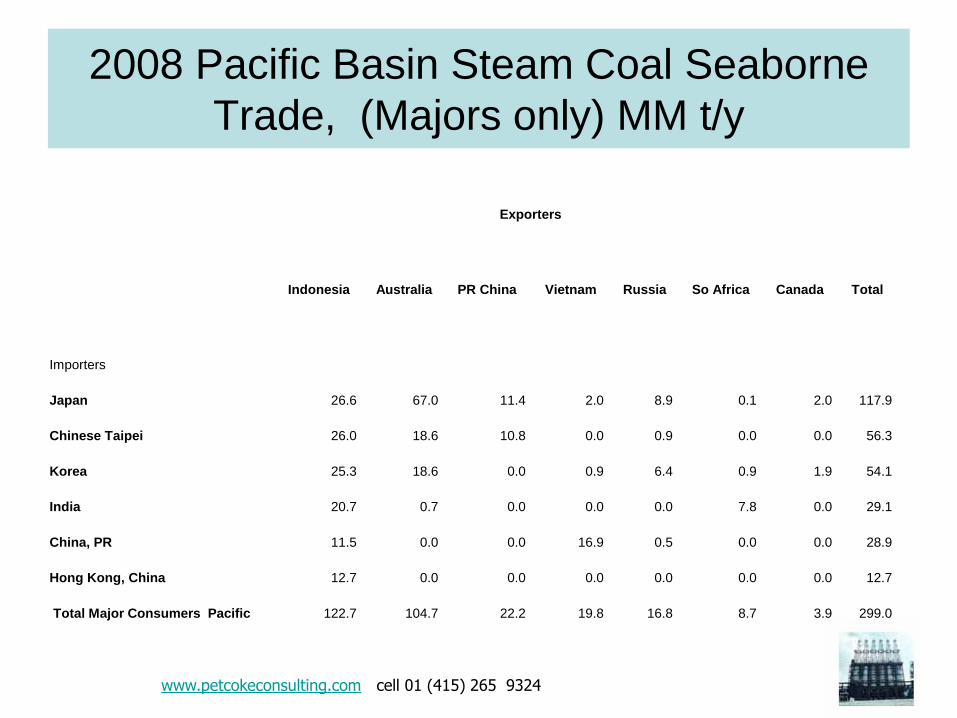
2008 Pacific Basin Steam Coal Seaborne
Trade, (Majors only) MM t/y
www.petcokeconsulting.com cell 01 (415) 265 9324
Exporters
Indonesia Australia PR China Vietnam Russia So Africa Canada Total
Importers
Japan 26.6 67.0 11.4 2.0 8.9 0.1 2.0 117.9
Chinese Taipei 26.0 18.6 10.8 0.0 0.9 0.0 0.0 56.3
Korea 25.3 18.6 0.0 0.9 6.4 0.9 1.9 54.1
India 20.7 0.7 0.0 0.0 0.0 7.8 0.0 29.1
China, PR 11.5 0.0 0.0 16.9 0.5 0.0 0.0 28.9
Hong Kong, China 12.7 0.0 0.0 0.0 0.0 0.0 0.0 12.7
Total Major Consumers Pacific 122.7 104.7 22.2 19.8 16.8 8.7 3.9 299.0
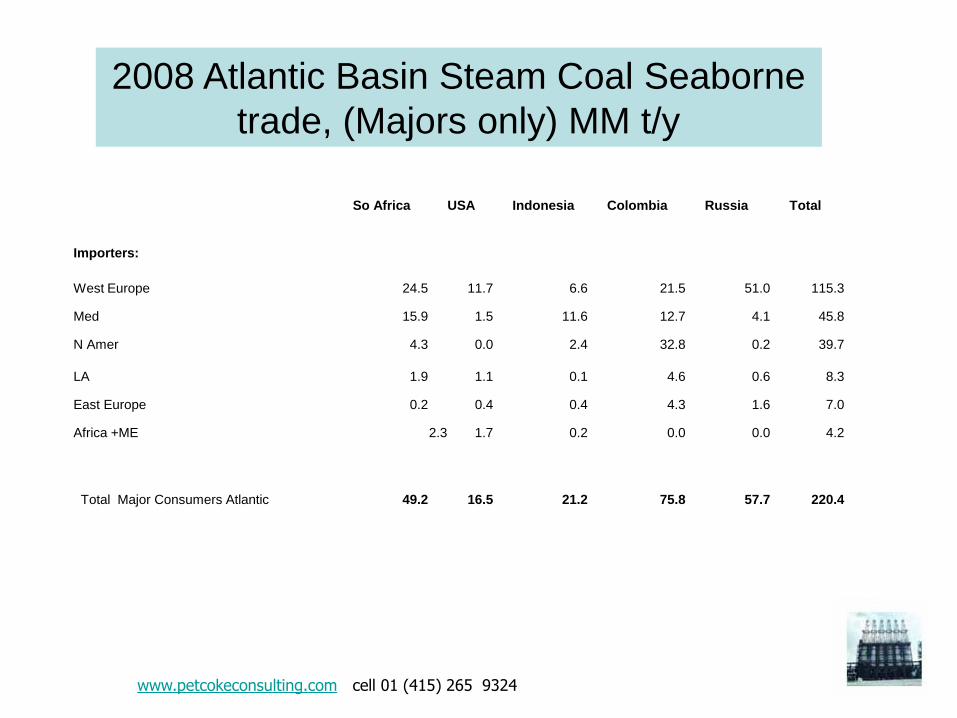
So Africa USA Indonesia Colombia Russia Total
Importers:
West Europe 24.5 11.7 6.6 21.5 51.0 115.3
Med 15.9 1.5 11.6 12.7 4.1 45.8
N Amer 4.3 0.0 2.4 32.8 0.2 39.7
LA 1.9 1.1 0.1 4.6 0.6 8.3
East Europe 0.2 0.4 0.4 4.3 1.6 7.0
Africa +ME 2.3 1.7 0.2 0.0 0.0 4.2
Total Major Consumers Atlantic 49.2 16.5 21.2 75.8 57.7 220.4
2008 Atlantic Basin Steam Coal Seaborne
trade, (Majors only) MM t/y
www.petcokeconsulting.com cell 01 (415) 265 9324
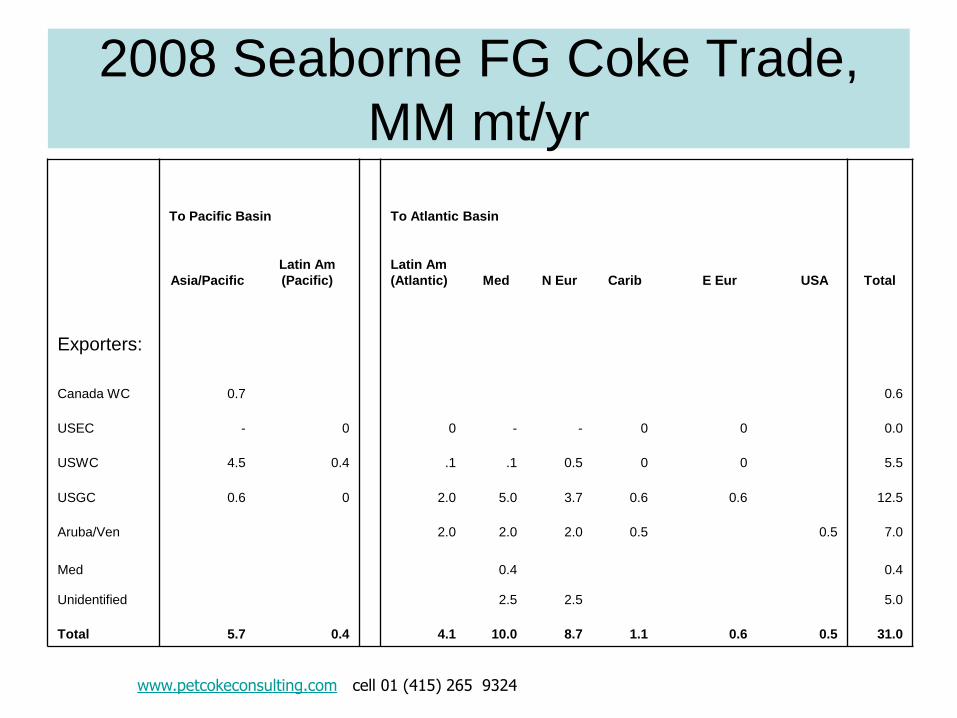
2008 Seaborne FG Coke Trade,
MM mt/yr
To Pacific Basin To Atlantic Basin
Asia/Pacific
Latin Am
(Pacific)
Latin Am
(Atlantic) Med N Eur Carib E Eur USA Total
Exporters:
Canada WC 0.7 0.6
USEC - 0 0 - - 0 0 0.0
USWC 4.5 0.4 .1 .1 0.5 0 0 5.5
USGC 0.6 0 2.0 5.0 3.7 0.6 0.6 12.5
Aruba/Ven 2.0 2.0 2.0 0.5 0.5 7.0
Med 0.4 0.4
Unidentified 2.5 2.5 5.0
Total 5.7 0.4 4.1 10.0 8.7 1.1 0.6 0.5 31.0
www.petcokeconsulting.com cell 01 (415) 265 9324