gis mapping of environmental justice census characteristics · pdf filegis mapping of...
TRANSCRIPT
GIS MAPPING OF ENVIRONMENTAL JUSTICE CENSUS CHARACTERISTICS
Final Report
SPR 304-291

GIS MAPPING OF ENVIRONMENTAL JUSTICE CENSUS CHARACTERISTICS
Final Report
SPR 304-291
by
Randal S. Johnson Department of Civil, Construction & Environmental Engineering
Oregon State University Corvallis, Oregon
and
Alan R. Kirk Oregon Department of Transportation
Research Unit Salem, Oregon
for
Oregon Department of Transportation Research Unit
200 Hawthorne Ave. SE -- Suite B-240 Salem, OR 97301-5192
and
Federal Highway Administration 400 Seventh Street SW Washington, DC 20590
October 2004

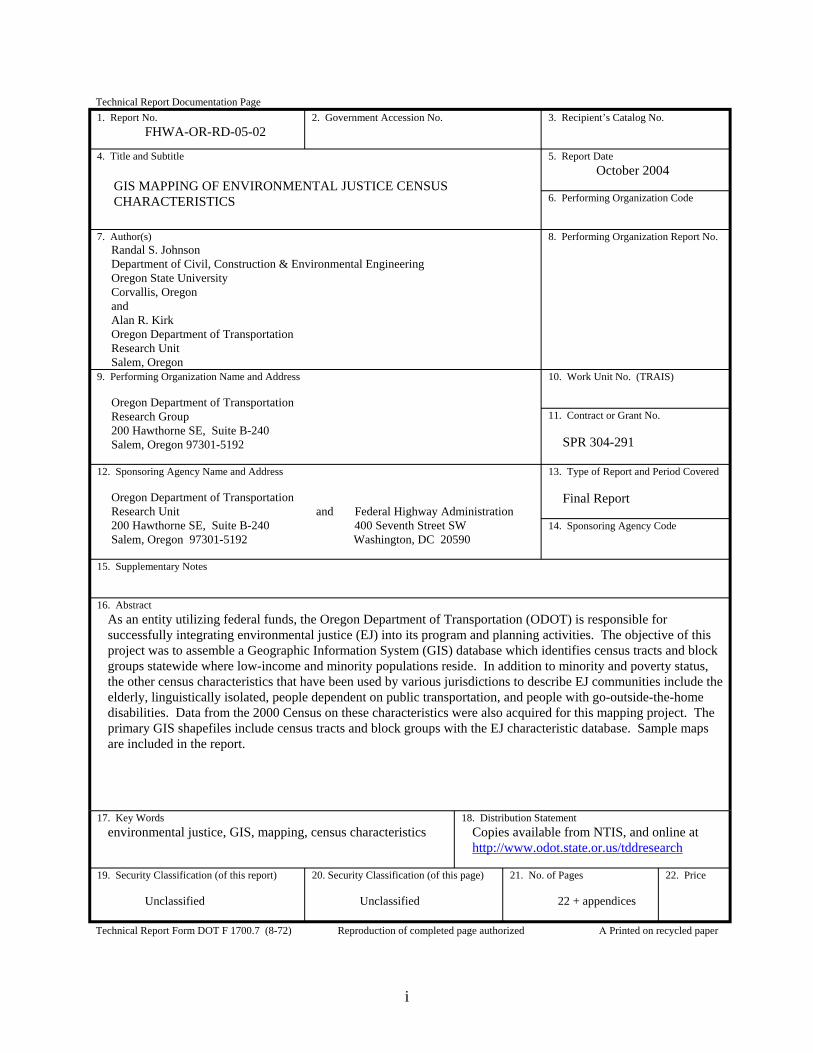
Technical Report Documentation Page 1. Report No.
FHWA-OR-RD-05-02 2. Government Accession No. 3. Recipient’s Catalog No.
4. Title and Subtitle
GIS MAPPING OF ENVIRONMENTAL JUSTICE CENSUS CHARACTERISTICS
5. Report Date October 2004
6. Performing Organization Code
7. Author(s) Randal S. Johnson Department of Civil, Construction & Environmental Engineering Oregon State University Corvallis, Oregon and Alan R. Kirk Oregon Department of Transportation Research Unit Salem, Oregon
8. Performing Organization Report No.
9. Performing Organization Name and Address
Oregon Department of Transportation Research Group 200 Hawthorne SE, Suite B-240 Salem, Oregon 97301-5192
10. Work Unit No. (TRAIS)
11. Contract or Grant No.
SPR 304-291
12. Sponsoring Agency Name and Address
Oregon Department of Transportation Research Unit and Federal Highway Administration 200 Hawthorne SE, Suite B-240 400 Seventh Street SW Salem, Oregon 97301-5192 Washington, DC 20590
13. Type of Report and Period Covered
Final Report
14. Sponsoring Agency Code
15. Supplementary Notes
16. Abstract As an entity utilizing federal funds, the Oregon Department of Transportation (ODOT) is responsible for successfully integrating environmental justice (EJ) into its program and planning activities. The objective of this project was to assemble a Geographic Information System (GIS) database which identifies census tracts and block groups statewide where low-income and minority populations reside. In addition to minority and poverty status, the other census characteristics that have been used by various jurisdictions to describe EJ communities include the elderly, linguistically isolated, people dependent on public transportation, and people with go-outside-the-home disabilities. Data from the 2000 Census on these characteristics were also acquired for this mapping project. The primary GIS shapefiles include census tracts and block groups with the EJ characteristic database. Sample maps are included in the report.
17. Key Words environmental justice, GIS, mapping, census characteristics
18. Distribution Statement Copies available from NTIS, and online at http://www.odot.state.or.us/tddresearch
19. Security Classification (of this report)
Unclassified
20. Security Classification (of this page)
Unclassified
21. No. of Pages
22 + appendices
22. Price
Technical Report Form DOT F 1700.7 (8-72) Reproduction of completed page authorized Α Printed on recycled paper
i
ii
SI* (MODERN METRIC) CONVERSION FACTORS APPROXIMATE CONVERSIONS TO SI UNITS APPROXIMATE CONVERSIONS FROM SI UNITS
Symbol When You Know Multiply By To Find Symbol Symbol When You Know Multiply By To Find Symbol
LENGTH In inches 25.4 Millimeters Mm
Ft feet 0.305 Meters M Yd yards 0.914 Meters M Mi miles 1.61 Kilometers Km
AREA In2 square inches 645.2 Millimeters squared mm2
ft2 square feet 0.093 Meters squared m2
Yd2 square yards 0.836 Meters squared m2
Ac acres 0.405 Hectares Ha Mi2 square miles 2.59 Kilometers squared km2
VOLUME fl oz fluid ounces 29.57 Milliliters mL
Gal gallons 3.785 Liters L ft3 cubic feet 0.028 Meters cubed m3
Yd3 cubic yards 0.765 Meters cubed m3
NOTE: Volumes greater than 1000 L shall be shown in m3 . MASS
Oz ounces 28.35 Grams G Lb pounds 0.454 Kilograms Kg T short tons (2000 lb) 0.907 Megagrams Mg
TEMPERATURE (exact)
°F Fahrenheit temperature
5(F-32)/9 Celsius temperature °C
LENGTH mm millimeters 0.039 inches inm meters 3.28 feet ftm meters 1.09 yards yd
km kilometers 0.621 miles mi AREA
mm2 millimeters squared 0.0016 square inches in2
m2 meters squared 10.764 square feet ft2
ha hectares 2.47 acres ac km2 kilometers squared 0.386 square miles mi2
VOLUME mL milliliters 0.034 fluid ounces fl oz L liters 0.264 gallons galm3 meters cubed 35.315 cubic feet ft3
m3 meters cubed 1.308 cubic yards yd3
MASS g grams 0.035 ounces oz kg kilograms 2.205 pounds lb
Mg megagrams 1.102 short tons (2000 lb) TTEMPERATURE (exact)
°C Celsius temperature 1.8C + 32 Fahrenheit °F
* SI is the symbol for the International System of Measurement (4-7-94 jbp)
ACKNOWLEDGEMENTS
The authors would like to thank the following people for their valued contribution to this research:
Richard Beck, ODOT Geo-Environmental John DeTar, ODOT Area 4 Joyce Felton, ODOT Planning Lesley Hegewald, Mid-Willamette Valley COG Milt Hill, ODOT GIS Unit Greg Holthoff, ODOT Geo-Environmental Kurt Jun, ODOT Civil Rights Susan Mead, ODOT GIS Unit Fred Patron, FHWALucia Ramirez, ODOT Planning
DISCLAIMER
This document is disseminated under the sponsorship of the Oregon Department of Transportation and the United States Department of Transportation in the interest of information exchange. The State of Oregon and the United States Government assume no liability of its contents or use thereof.
The contents of this report reflect the views of the author(s) who are solely responsible for the facts and accuracy of the data presented herein. The contents do not necessarily reflect the official policies of the Oregon Department of Transportation or the United States Department of Transportation.
The State of Oregon and the United States Government do not endorse products of manufacturers. Trademarks or manufacturers’ names appear herein only because they are considered essential to the object of this document.
This report does not constitute a standard, specification, or regulation.
iii

iv
GIS MAPPING OF ENVIRONMENTAL JUSTICE CENSUS CHARACTERISTICS
TABLE OF CONTENTS
1.0 INTRODUCTION..................................................................................................................1
1.1 BACKGROUND .................................................................................................................1 1.2 PROBLEM STATEMENT ..................................................................................................1 1.3 OBJECTIVE OF THE PROJECT .......................................................................................1
2.0 METHODOLOGIES USED .................................................................................................3
2.1 BACKGROUND RESEARCH............................................................................................3 2.2 DEFINITIONS AND THRESHOLDS FOR EJ CHARACTERISTICS .............................3
2.2.1 Minority Populations ...................................................................................................3 2.2.2 Low-income populations .............................................................................................4
2.3 LEVEL OF ANALYSIS ......................................................................................................4 2.4 CENSUS DATA ACQUISITION .......................................................................................4
2.4.1 Required census categories .........................................................................................4 2.4.2 Non-required census categories...................................................................................5
2.5 GIS DATA ACQUISITION AND CREATION .................................................................5 2.6 GIS & COMPUTER TECHNOLOGY ................................................................................6
3.0 OUTCOMES ..........................................................................................................................7
4.0 LESSONS LEARNED ...........................................................................................................9
4.1 COMPARABILITY OF POVERTY DESIGNATIONS .....................................................9 4.2 USE OF REFERENCE MEASURES..................................................................................9 4.3 USE OF CENSUS DEFINITIONS......................................................................................9
5.0 USE OF THE GIS LAYERS BY ODOT ...........................................................................11
6.0 REFERENCES.....................................................................................................................13
APPENDICES
APPENDIX A: EXAMPLES OF DEFINITIONS AND THRESHOLDS OF MINORITY AND LOW-INCOME AREAS USED BY OTHER AGENCIES
APPENDIX B: 2000 U.S. CENSUS DATASETS USED APPENDIX C: SAMPLE ENVIRONMENTAL JUSTICE CHARACTERISTIC MAPS
v

vi
1.0 INTRODUCTION
1.1 BACKGROUND
Executive Order 12898, Federal Actions to Address Environmental Justice in Minority Populations and Low-income Populations (1994) was enacted to reinforce Title VI of the Civil Rights Act of 1964. In the Civil Rights Act it is stated that “No person in the United States shall, on the grounds of race, color, or national origin be excluded from participation in, be denied the benefits of, or be subjected to discrimination under any program or activity receiving Federal financial assistance” (U.S. Code 1964). Executive Order 12898 states, “Each Federal agency shall make achieving environmental justice part of its mission by identifying and addressing, as appropriate, disproportionately high and adverse human health or environmental effects of its programs, policies, and activities on minority populations and low-income populations” (Federal Register 1994).
1.2 PROBLEM STATEMENT
As an entity utilizing federal funds, the Oregon Department of Transportation (ODOT) is responsible for successfully integrating environmental justice (EJ) into its program and planning activities. Environmental justice requires ODOT to avoid, minimize, or mitigate disproportionately high and adverse effects of its activities on minority populations and low-income populations; ensure their full and fair participation; and prevent the denial of benefits to them.
For any given program or project area, census data can show the minority and low-income characteristics. While published census data is available, it is not in a form that is readily usable for ODOT staff to associate these characteristics with the geographic area of interest. Mapping of these characteristics has been undertaken for specific projects, but these data are not currently mapped for all areas of the state. The mapping of census tracts and block groups according to the concentration of low-income and minority populations would serve as a useful screening tool for transportation planners and project managers to determine where environmental justice issues may have to be addressed.
1.3 OBJECTIVE OF THE PROJECT
The objective of this project was to assemble a Geographic Information System (GIS) database which would identify census tracts and block groups statewide where low-income and minority populations reside.
1

Maps showing the basic census data related to the presence of low-income and minority populations can give planners a general indication of whether a given planning area or transportation improvement project location may be in or near EJ communities. They can thus serve as a screening tool for providing an initial look at potential EJ issues for the project. Additional on-site analysis would likely be needed to confirm the EJ status of a given area.
The mapping of EJ characteristics would be a useful tool in assisting ODOT to more effectively fulfill its responsibilities to Oregon citizens. Identification of EJ communities is important in enhancing the public involvement process; involving EJ communities early in the process; and avoiding disproportionately high and adverse impacts of transportation projects and programs.
2
2.0 METHODOLOGIES USED
2.1 BACKGROUND RESEARCH
The research team reviewed the approaches that other jurisdictions have taken in mapping EJ characteristics and researched related materials at the national level and within Oregon. Particular attention was given to definitions of “Minority” and “Low-income” populations used by other agencies (Cambridge Systematics 2002). See Appendix A for examples.
In addition to the federally required categories, some transportation agencies have identified other census characteristics that may be relevant in assuring that transportation projects do not disproportionately impact specific communities of people (Cambridge Systematics 2002; SKATS 2002). These include the elderly, people with disabilities, people with language barriers, and households with no access to vehicles.
2.2 DEFINITIONS AND THRESHOLDS FOR EJ CHARACTERISTICS
In analyzing the EJ characteristics of an area, one must decide the point at which the area contains a significant population. The National Guidance for Conducting Environmental Justice Analyses gives several recommendations for minority and low-income “thresholds” (EPA 1998). In determining thresholds, the guidance allows for both a fixed percentage “absolute threshold” and a “relative threshold” derived from a reference area. A comparison approach can also be used to determine a threshold if a target area is statistically different from a reference area.
2.2.1 Minority Populations
The National Guidance defines minorities as American Indian or Alaskan Native, Asian or Pacific Islander, Black, and Other races plus Hispanic. The Hispanic population includes those who identify themselves as both “white only” and Hispanic (EPA 1998).
For a minority population, the specific thresholds recommended by the National Guidance are as follows: 50 percent minority population (absolute threshold); the national average minority population – 25% (absolute threshold); and the state average plus 20% (i.e., state average times 1.2) (relative threshold) (EPA 1998). Oregon has a relatively low minority population in comparison with the national average; therefore it seemed most appropriate to use the state average plus 20% as a threshold for the sample maps of minority populations in this project.
It should be noted that these thresholds are only recommendations. The agency in authority needs to make the decision on an appropriate threshold for their jurisdiction and for the type of project or program being considered. This EJ characteristic mapping project uses the term
3
“sample threshold” to indicate the threshold selected from the National Guidance recommendation.
2.2.2 Low-income populations
A National Guidance recommended threshold for determining a low-income population is based on “very low-income” and/or “low-income” characteristics. The very low-income characteristic is defined as persons in households below the U.S. Census Bureau’s poverty threshold. The low-income characteristic is defined as below two times the poverty threshold (EPA 1998). The poverty thresholds are designated by the Census Bureau for the nation. The 2000 Census uses 1999 income data.
The National Guidance recommends a relative threshold for low or very low-income populations as the state average percent of persons in low or very low income households (EPA 1998).
The Federal Highway Administration’s (FHWA) Actions to Address Environmental Justice defines low-income as “a household income at or below the Department of Health and Human Services poverty guidelines” (FHWA 1998). Since the Department of Health and Human Services poverty guidelines are based on the U.S. Census poverty threshold, this is essentially the same definition as the “very low-income” characteristic under the National Guidance document. While the FHWA document is more recent, there is no set standard; therefore both characteristics from the National Guidance are provided for this EJ mapping project, using the state average as the sample threshold.
In order to minimize confusion, this project uses the terms “below the poverty level” and “below two times the poverty level” instead of “very low-income” and “low-income.”
2.3 LEVEL OF ANALYSIS
Census data on EJ characteristics are available by census tract and by census block group. While other agencies such as the Colorado Department of Transportation and Mid-Willamette Valley Council of Governments have done similar GIS mapping at the tract level, this does not provide the greatest resolution possible. In rural areas, such as Eastern Oregon, census tracts are very large and do not provide the desired resolution for a project level analysis. Thus both census tracts and block groups are used in this EJ mapping project to provide both levels of resolution for the available data.
2.4 CENSUS DATA ACQUISITION
2.4.1 Required census categories
Census tract and block group data were compiled from the 2000 U.S. Census using Summary File 3 datasets. (See Appendix B for a list of the specific tables used.) The census block group data for the EJ categories were combined into a single database and reduced to display the percent population of minority, those below the poverty level, and those below two times the
4
poverty level for each block group. The census data was also acquired on a state and county basis. The state and county averages were then incorporated into the block group database. The same database was also created at the census tract level, but does not provide as high a resolution as the census block groups.
2.4.2 Non-required census categories
In addition to minority and poverty status, the other census characteristics that have been used by various jurisdictions to describe EJ communities include the elderly, linguistically isolated, people dependent on public transportation, and people with go-outside-the-home disabilities. Data from the 2000 Census on these characteristics were also acquired for this mapping project.
The elderly population is defined as persons age 65 and older in the year 2000.
The 2000 Census data describes linguistically isolated populations in terms of households. Linguistically isolated households are defined as households in 2000 having no person age 14 or older who speaks English well.
People dependent on public transit services are derived from the 2000 Census as occupied housing units with no vehicles available. An available vehicle is defined as being 1-ton capacity or less and available for use by household members for non-business use.
Census data on persons with disabilities include people with a “go-outside-the-home” disability. The U.S. Census defines a person with a go-outside-the-home disability as having a condition that impedes one from going outside the home alone or to work at a job or business. These are people age 16 and older and non-institutionalized civilians. Disability data is only available at the census tract level.
2.5 GIS DATA ACQUISITION AND CREATION
Statewide census tract, block group and block shapefiles were acquired from the Oregon Geospatial Data Clearinghouse (OGDC). In addition, county boundary and county seat shape files were obtained from the OGDC. All shape files from the OGDC use the Lambert Conformal Conic projection and the North American Datum of 1983 coordinates.1
Optional layers helpful for use in mapping EJ characteristics may include highways, cities, streams, transit district boundaries, etc. These layers can be obtained from the ODOT GIS Unit or the OGDC. See the sample maps in Appendix C for an example.
The census database of EJ characteristics as described in Section 2.4 was joined to the tract and block group shapefiles. From this file individual layers were created for each EJ characteristic. Using ArcView, queries were performed to select block groups that met the corresponding
1 Persons external to ODOT trying to overlay standard Lambert projections from a non-Oregon state agency source should be aware that OGDC has created a Lambert projection idealized for Oregon statewide maps (see http://www.gis.state.or.us/coord/project/gpl.html ).
5
sample threshold. This method was used to create layers of the required EJ characteristics using sample relative thresholds.
Since census boundaries must comprise all land area, not all census blocks contain population. Thus the census block shapefile from the OGDC was queried to show blocks that contain zero population. These blocks were then overlaid on the block group maps of EJ characteristics to mask the zero population blocks, leaving only populated areas. The resulting maps thus achieved a higher resolution, especially in rural areas were vast areas of large block groups contain zero population.
Each of the sample maps in Appendix C thus show three main categories: Block groups with an EJ characteristic that is above the sample threshold, block groups below the sample threshold and zero population blocks. It is important to note that although the block groups are masked by zero population blocks, thus visually creating smaller and more broken up geographic areas, the data is still based on block groups and therefore should be viewed with the block group boundaries visible.
Metropolitan planning organization (MPO) boundary shapefiles were acquired from both the ODOT GIS Unit and/or the MPO’s GIS department directly. These boundaries were used to create a mean value for each of the EJ characteristics for all block groups within an MPO boundary. The MPO average values for each category were calculated from the block groups within the MPO boundary. Since MPO boundaries do not follow the boundaries of block groups, the MPO boundary averages reflect all block groups that are partially or completely contained by a given MPO boundary.
2.6 GIS & COMPUTER TECHNOLOGY
ESRI ArcMap 8.3 was used for GIS mapping and editing purposes in this EJ mapping project. ESRI ArcCatalog was used for creating and editing metadata. This project was performed on an Intel Pentium III computer with an 800 MHz processor and 512 megabytes of RAM. The operating system used was Microsoft Windows NT 4.0.
6
3.0 OUTCOMES
The final product of this EJ mapping project is a set of three GIS database files:
One contains the census block groups with the EJ characteristic database. The database contains all of required and additional the EJ categories discussed earlier, each with the census data values and the percent population. The required categories include minority and low-income populations, and the additional categories include elderly, linguistically isolated, and transit dependent populations. For reference frame comparison, each block group record includes the state and county averages, and if applicable, the MPO average. The database also includes the state feature identification numbers, as well as the tract and block group id numbers. The respective county and MPO names are listed in text fields for each record.
The second file provides the same information and database format on the census tract level. The only exceptions are 1) the tract level shapefile includes persons with a “go-outside-the-home” disability; this data is not available at the block group level; and 2) this shapefile does not include MPO averages, since these figures are derived from combining block groups to approximate MPO boundaries.
The third file includes census blocks with zero population. This file can be used to mask the EJ characteristic layers to show only populated areas where these characteristics may exist.
Sample shapefiles produced in this project include three separate files, each showing a primary EJ characteristic relative to the sample threshold, as follows. These files are at the census block group level:
• percent minority population relative to the state average plus 20% ; • percent below the poverty level relative to the state average; and • percent below two times the poverty level relative to the state average.
Sample maps were also produced for this EJ mapping project. See Appendix C. These maps include the following:
• maps of the three primary EJ characteristics with a sample threshold for a sample project area;
• maps of the three primary EJ characteristics with the same sample thresholds at a statewide level; and
• maps of the additional EJ characteristics using sample grouping categories at a statewide level.
7

All of the EJ characteristic maps draw upon the same database information from the census block group database file mentioned above, except for the go-outside-the-home disability map, which draws from the census tract database. All sample maps have the zero population census blocks filtered out. Map features include state highways, county boundaries, county seats and MPO boundaries. The sample project area maps include census block group boundaries.
8
4.0 LESSONS LEARNED
During the process of this EJ mapping project, several situations came up that are worth some discussion.
4.1 COMPARABILITY OF POVERTY DESIGNATIONS
When comparing sample maps of below the poverty level and below two times the poverty level, it is possible to characterize a census block group as being below the poverty level, but not below two times the poverty level. This situation can occur in a block group when the percentage of persons in households below the poverty level exceeds the threshold (i.e., state, county or MPO average percent), but the percentage of persons in households below two times the poverty level does not exceed the corresponding average percent in the reference area (state, county or MPO).
For example, a block group could be characterized as below the poverty level at 12 percent, since it exceeds the state average of 11.6 percent. At the same time, that block group would not qualify as below two times the poverty level at 22 percent, since it is below the state average of 29.6 percent. This situation emphasizes the fact that the poverty level characteristic is not a subset of the two times the poverty level characteristic. Each characteristic has its own definition benchmark and separate threshold of percent population.
4.2 USE OF REFERENCE MEASURES
When analyzing EJ data, using different reference frames can lead to different interpretations. For example, using a localized reference frame as a threshold in an area of high minority population may lead to a block group not being classified as a potential EJ community, but when compared to a larger reference frame (such as the state average) the same block group may be identified as a potential EJ community. The National Guidance recommends using the state average as one reference frame, but the county and MPO averages have been included in this project to provide for a more localized comparison with surrounding areas.
4.3 USE OF CENSUS DEFINITIONS
When using the 2000 Census data it is important to keep in mind the implications of the definitions used. People who live in group quarters (such as prisons and nursing homes), college dormitories, military barracks and those in living situations without conventional housing all have a poverty status that can not be determined. Student populations also raise another issue
9
related to poverty status. Many students receive financial aid to cover living expenses. While some students’ reported incomes may be below the poverty threshold, these students may or may not be experiencing the same impacts of poverty that non-students do. Large populations of students in college towns may cause a particular block group to be classified as below the poverty level or below two times the poverty level even though not all students are living in poverty.
With regard to racial characteristics, there are some ethnic groups that are not classified under the census race categories, but may be considered to be EJ communities. For example, Slavic communities are not represented in the census race data. This ethnic group speaks many different languages and greatly varies in culture. Oregon has pockets of concentrated Slavic communities that may be subjected to disproportionately high and adverse effects of transportation projects. While this group is covered under the linguistically isolated census characteristic, they are not classified as a minority community per se. The 1964 Civil Rights Act states that no person in the U.S. should be discriminated against on the grounds of “national origin”, but the Executive Order 12898 only protects minority (and low income) populations. The federal definition of “minority” can be found in Section 2.3.
10
5.0 USE OF THE GIS LAYERS BY ODOT
The Federal Highway Administration’s policy on addressing environmental justice issues speaks to identifying and avoiding “discrimination and disproportionately high and adverse effects on minority populations and low-income populations” by a) evaluating the effects of its activities; b) finding ways to mitigate these effects; and c) providing public involvement activities and soliciting input from affected populations during the planning and development of alternatives (FHWA 1998). The GIS layers showing EJ characteristics of census tracts and block groups can help ODOT fulfill its obligations to carry out this policy.
The applicability of census data for conducting EJ assessments tends to vary depending on the type of project or program being undertaken. A recent NCHRP report on methods for EJ assessment speaks to the role of census data among a variety of methods available:
Many of the methods are quantitative and use census data, survey data, and GIS. Other methods are more qualitative and rely heavily on local knowledge and the public participation process.
Which method is best to use depends on various factors including the probable magnitude of a particular impact, data availability and cost, and the capabilities and experience of the person performing the analysis. The most important factor is whether or not the method is appropriate for the type of transportation system change being evaluated. For example, some effects of transportation system projects are distributed geographically, whereas other effects are distributed among system users based on their demographic characteristics. The best methods and data for identifying the demographic characteristics of affected populations may differ from case to case.
One purpose of any protected population assessment is to accurately represent the demographic characteristics of the affected populations. Any assessment should include input from members of the public and individuals with comparatively high levels of knowledge of the local area. Many methods rely directly upon these sources of information. For other methods, such as those that rely on census data, local knowledge and public input can be used to validate source data and study results. (Forkenbrock and Sheeley 2004).
Thus, the mapping of census characteristics is just one among many tools that ODOT staff may use in assessing a particular area of impact. Several units of ODOT have expressed interest in incorporating this source of EJ information into their work processes. On the planning side, the mapping of EJ characteristics can be a useful addition to Transportation System Plans, Interchange Plans, Corridor Plans and Conditions Reports. As one tool for the identification of characteristics of potential EJ communities, these maps can guide planners in targeting their efforts to involve low-income and minority populations in transportation planning processes.
11
ODOT’s Geo-Environmental Section plays a leadership role in identifying and addressing EJ issues for transportation improvement projects, both in the scoping of projects in the Statewide Transportation Improvement Program (STIP), and in the Environmental Baseline Reports for the project areas. The mapping of EJ characteristics can complement the onsite work of the regional environmental coordinators and the environmental project managers.
The GIS layers for EJ characteristics will reside in the ODOT GIS Unit, allowing staff skilled in the use of ArcView to access these layers along with any other features they wish to map, such as jurisdiction boundaries, highways, place names, etc. The GIS Unit has also expressed an interest in adding EJ characteristics to the variety of layers available through the ODOT “TransGIS” intranet site, which is a GIS tool designed for users of every skill level, presenting data in an interactive map format and offering multi-level views of Oregon's transportation system.
The capability of mapping EJ characteristics has also generated interest among ODOT and FHWA division staff in pursuing training for ODOT, consultants and MPOs on the basics of environmental justice, the use of census data and other methods to identify EJ communities, and how to address disproportionately adverse impacts of transportation improvement projects. Such training will help ODOT to further strengthen its capabilities to serve the transportation needs of Oregon’s citizens.
12
6.0 REFERENCES
Cambridge Systematics. Technical Methods to Support Analysis of Environmental Justice Issues. National Cooperative Highway Research Program. Project 8-36 (11). Transportation Research Board. Washington DC. April 2002.
Environmental Protection Agency. National Guidance for Conducting Environmental Justice Analyses. Peer Review Version. Office of Environmental Justice, U.S. Environmental Protection Agency, October 1, 1998.
Federal Highway Administration. FHWA Actions to Address Environmental Justice in Minority Populations and Low-Income Populations, DOT Order 6640.23. Federal Highway Administration, U.S. Department of Transportation. 1998.
Federal Register, Vol. 59, No. 32. Presidential Documents. President of the United States. Federal Actions to Address Environmental Justice in Minority Populations and Low-Income Populations. Executive Order 12898. February 11, 1994.
Forkenbrock, David J. and Jason Sheeley. Effective Methods for Environmental Justice Assessment. Report 532. National Cooperative Highway Research Program. Project 8-41. Transportation Research Board. Washington DC. 2004.
Salem-Keizer Area Transportation Study. Transportation Disadvantaged Populations in the SKATS Region: A Geographic Profile (2000). Mid-Willamette Valley Council of Governments. Salem, OR. 2002.
U.S. Code. Civil Rights Act of 1964. Title VI - Nondiscrimination In Federally Assisted Programs. Document Number: PL 88-352. 42 USC 2000(d)-2000(d)(1). July 2, 1964.
