ghana: debt sustainability analysis; imf country report no ... · pdf fileghana staff report...
TRANSCRIPT
GHANA STAFF REPORT FOR THE 2013 ARTICLE IV CONSULTATION― DEBT SUSTAINABILITY ANALYSIS—UPDATE
Approved By Michael Atingi-Ego and Mark Joseph Flanagan (IMF) and Jeff Lewis and Marcelo Giugale (IDA)
Prepared by the International Monetary Fund and the World Bank1
The analysis suggests that Ghana’s risk of debt distress has risen, but remains moderate.
Driven by expansionary fiscal policy in 2012, several of Ghana’s public domestic and
external debt indicators have deteriorated, but external debt burden indicators are
projected to remain well below their respective indicative thresholds, provided fiscal
consolidation is realized as planned and continues beyond the medium term. Total public
debt is projected to stabilize at approximately 52 percent of GDP in the long run, with
debt service absorbing more than 40 percent of government revenue. A more front-
loaded adjustment would be needed to set the debt ratio on a declining trend.
1 Prepared in collaboration with Ghanaian authorities. The previous DSA was prepared in November 2011 (IMF Country Report No. 12/36).
May 29, 2013

GHANA
2 INTERNATIONAL MONETARY FUND
2012 2013 2013-18 2019-31
Real growth
DSA-2011 8.5 7.4 5.6 5.5
DSA-2013 7.9 7.9 6.3 5.3
Level of nominal GDP
DSA-2011 43,396 46,994 57,363 119,840
DSA-2013 40,435 45,643 58,768 126,135
Inflation (GDP deflator)
DSA-2011 11.9 7.6 7.6 5.8
DSA-2013 13.3 13.7 10.7 6.9
Real interest rate (foreign debt)
DSA-2011 1.3 1.8 2.3 4.3
DSA-2013 1.1 1.6 1.6 3.5
Real interest rate (domestic debt)
DSA-2011 -1.2 4.8 3.0 3.2
DSA-2013 0.5 -1.1 1.8 4.2
Current account balance
DSA-2011 -6.0 -3.8 -4.5 -5.1
DSA-2013 -12.2 -11.9 -9.0 -6.4
Primary fiscal balance
DSA-2011 0.7 1.4 0.8 -0.2
DSA-2013 -7.9 -6.5 -3.5 -0.5
(in percent of GDP)
(percent)
Table 1. Key Macroeconomic Assumptions
(annual percentage change)
(in millions U.S. dollar)
(annual percentage change)
(percent)
(percent)
KEY ASSUMPTIONS UNDER THE BASELINE SCENARIO
1. Macroeconomic assumptions are broadly in line with those in the November 2011 DSA, with deviations mainly related to the projection of oil production (Box 1 and Tables 1–2). Revisions reflect: (i) updated information on proven reserves in the Jubilee field and recently assessed new fields; (ii) associated FDI inflows, particularly in 2016–2018; and (iii) a slightly higher share of non-concessional borrowing, consistent with Ghana’s rising wealth and income status. By assuming a back-loaded production start for the newly assessed fields, and no production from future discoveries, the growth projections are conservative.
2. The projected debt dynamics are, however, contingent on successful fiscal consolidation. Consistent with the authorities’ plans, the baseline scenario assumes a reduction of the fiscal deficit (financing basis) to 6 percent of GDP in 2015. The long-run projections assume further gradual adjustment, consistent with the assumptions in the 2011 DSA.
2012 2013 2014 2015 2016 2017 2018
Disbursements
Multilateral 491 671 550 550 499 479 460
Bilateral 100 487 347 387 424 339 339
Commercial 735 750 1079 1279 1550 2607 2272
of which CDB 193 750 1029 1029 0 0 0
Total 1326 1908 1976 2216 2473 3426 3072
Table 2. Official Borrowing Assumptions (in millions U.S. dollars)

GHANA
INTERNATIONAL MONETARY FUND 3
Box 1. Baseline Macroeconomic Assumptions
Real GDP-growth: After the acceleration of real GDP growth in 2011 to 15 percent, driven by oil production and a considerable expansion of the non-oil economy, Ghana experienced another year of high real GDP growth of almost 8 percent in 2012. Increased oil production is projected to keep the growth rate at this level in 2013. In the medium-term, growth is projected to moderate until production from new oil fields boosts output in 2018. In the long-run, real growth is assumed to stabilize at 5-6 percent, with new oil discoveries implying significant upside potential.
Inflation: CPI inflation increased in late 2012, and survey-based expectations point to a further rise to above 10 percent in 2013. Supported by an improvement in the policy mix, inflation is expected to decline in the medium run, with the GDP deflator stabilizing at 7-8 percent in 2018–2033.
Government balances: After widening to 7.9 percent of GDP in 2012, the primary deficit is projected to improve to 2.2 percent of GDP by 2015, and to gradually fall to less than 1 percent of GDP in the long run.
Current account balance: Notwithstanding strong export growth of 15 percent, the current account deficit widened to 12.2 percent of GDP in 2012, as a result of sharply rising imports. Owing to weaker terms of trade, the current account deficit is expected to remain close to 12 percent in 2013 and above 8 percent of GDP until 2017, driven by strong capital imports. Beginning in 2018, the deficit it is projected to gradually decline to approximately 4 percent of GDP in 2033, broadly in line with its optimal level according to Fund staff’s external balance assessment.
Financing flows: Ghana continued to attract significant FDI of above 8 percent of GDP in 2012, the main part of which was related to the oil sector. Driven by the discovery of new fields, FDI is projected to stay close to 7 percent of GDP until 2018, and then to gradually decline to 4 percent of GDP by 2033. Consistent with Ghana’s improving income status and wealth, inflows from grants are projected to decline to less than ½ percent of GDP in the medium to long term. Borrowing is projected to become increasingly non-concessional with above 90 percent of loans. The Eurobond, which the authorities are considering, is not included in this DSA, but could help smooth rollover needs and actually reduce total debt service cost by replacing more expensive borrowing from the less liquid domestic market.

GHANA
4 INTERNATIONAL MONETARY FUND
2018 2023 2031
PV of debt-to-GDP ratio
DSA-2011 27.4 29.8 32.6
DSA-2013 26.1 29.5 24.8
Threshold 50.0 50.0 50.0
PV of debt-to-exports ratio
DSA-2011 72.1 79.4 83.0
DSA-2013 82.7 96.7 80.4
Threshold 200.0 200.0 200.0
PV of debt-to-revenue ratio
DSA-2011 140.4 162.3 182.0
DSA-2013 120.7 138.3 115.4
Threshold 300.0 300.0 300.0
Debt service-to-exports ratio
DSA-2011 6.3 10.5 13.1
DSA-2013 6.4 12.8 14.2
Threshold 25.0 25.0 25.0
Debt service-to-revenue ratio
DSA-2011 12.2 21.5 28.8
DSA-2013 9.4 18.4 20.4
Threshold 22.0 22.0 22.0
Table 3. Indicators of External Debt Vulnerabilities (Baseline)
EXTERNAL AND PUBLIC DEBT SUSTAINABILITY
A. External Debt Sustainability Analysis
Baseline scenario
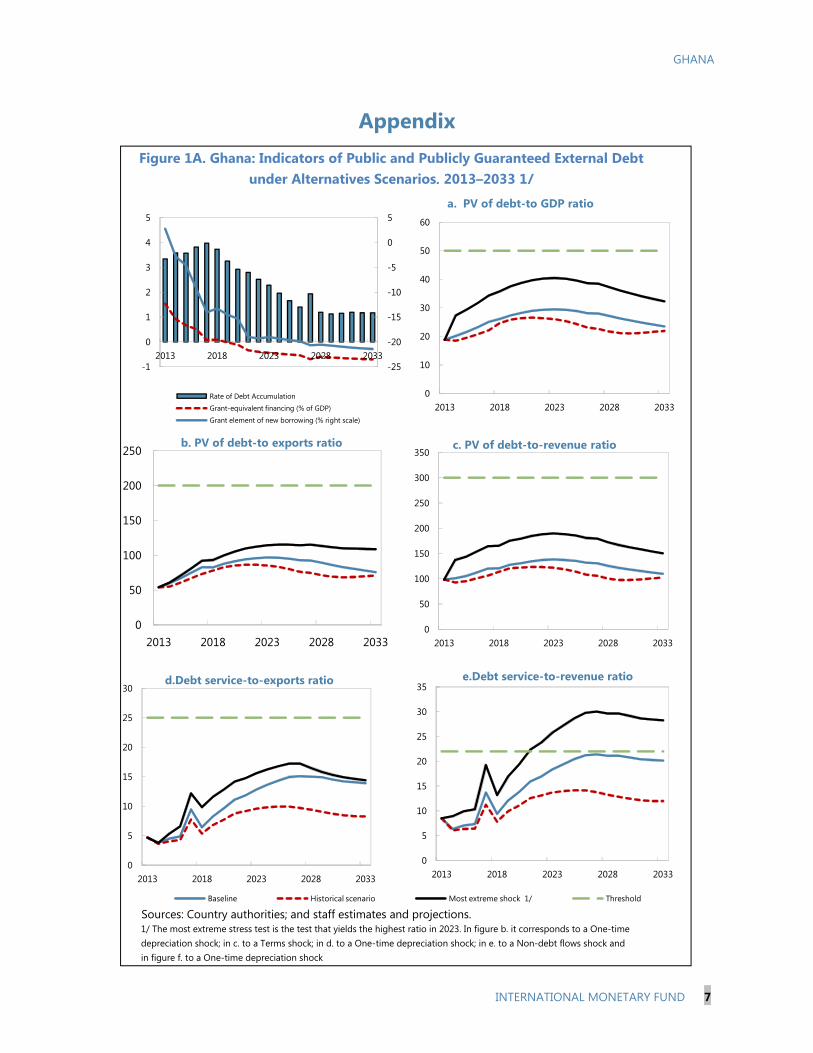
3. Ghana’s external debt indicators are all projected to remain below the relevant indicative thresholds. The projected level and composition of external debt is broadly in line with the November 2011 DSA, with a deterioration of export-based indicators caused by a downward revision in the terms of trade, but an improvement in the revenue indicators, reflecting further improvements in revenue administration and tax collection. All indicators remain below their respective thresholds in the baseline scenario (Table 3 and Figure 1A and Table 3A).
Standard stress tests
4. Standard stress tests confirm a moderate risk of debt distress (Figure 1A and Table 3A). Though pushed up, all three stock indicators as well as the debt service-to-export ratio remain under their respective thresholds even under the standardized stress tests. However, the debt service to-revenue-ratio—which is already close to its threshold level in the baseline scenario—increases to 26–30 under the most extreme shock which constitutes a one-time 30 percent depreciation relative to the baseline in 2014. While having a more moderate impact, a decrease of non-debt creating flows to their historical averages minus one standard deviation would also result in a breach of the debt service-to-revenue threshold.

GHANA
INTERNATIONAL MONETARY FUND 5
0
10
20
30
40
50
60
70
80
2013 2015 2017 2019 2021 2023 2025 2027 2029 2031 2033
Baseline 1/
Passive scenario: No further adjustment 2/
Active scenario: Front-loaded adjustment 3/
1/ Incorporates budget provisions for 2013-15, and gradual further adjustment in primary balance. 2/ Incorporates budget provisions for 2013-15, and no further adjustment in primary balance.3/ Incorporates additional adjustment of 3 percent of GDP by 2015, and unchanged primary balance thereafter.
Figure 1: Present Value of Debt-to-GDP Ratio under Different Adjustment Assumptions
2018 2023 2031
PV of debt-to-GDP ratio
DSA-2011 35.4 38.0 41.8
DSA-2013 53.4 56.1 52.9
PV of debt-to-revenue ratio
DSA-2011 175.0 202.9 231.5
DSA-2013 239.7 258.4 244.5
Debt service to revenue ratio
DSA-2011 32.8 44.7 53.3
DSA-2013 29.1 37.6 40.0
Table 4. Indicators of Public Debt Vulnerabilities (Baseline)
B. Public Debt Sustainability Analysis
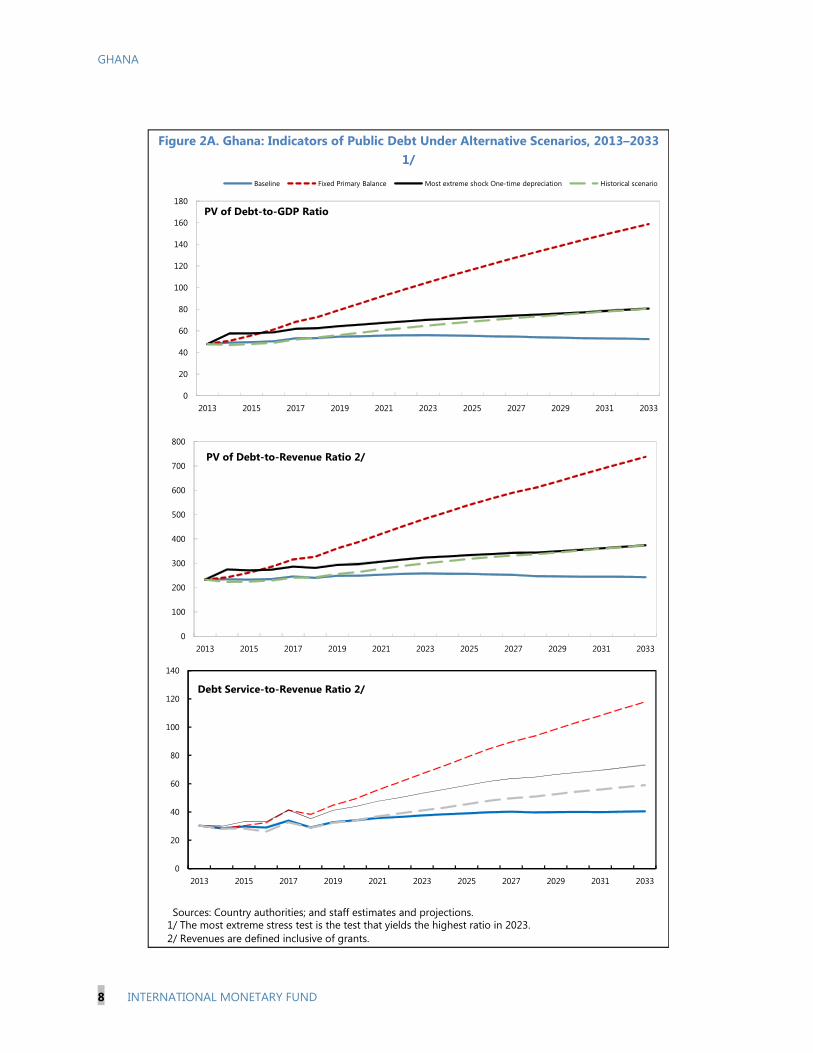
5. Additional risks arise from the sharp increase in domestic debt, as indicated by the total public debt dynamics (Table 4 and Figure 2A). Both considered stock indicators of public debt have deteriorated significantly compared with the November 2011 assessment, with domestic currency debt now exceeding external debt. On the basis of the authorities’ plans to decrease the fiscal deficit by 6 percentage points of GDP by 2015, and assuming further gradual consolidation in the medium to long term, Ghana’s present value of total public debt would stay at around 52 percent of GDP in the long run, leaving the country vulnerable to shocks. This is 10 percent of GDP higher than in the previous DSA, of which about 2 percent is attributable to the decrease in the discount rate from 4 to 3 percent. Debt service is projected to be lower compared to the previous assessments, mainly reflecting less conservative assumptions on the maturity profile of domestic borrowing, consistent with the authorities’ intentions.2 However, even assuming longer maturities for domestic debt and an improvement of revenues in percent of GDP in response to ongoing administrative reforms, public debt service would still absorb 40 percent of government revenue. Standard stress tests confirm the case for additional consolidation in the medium to long term to keep public debt sustainable and provide buffers against plausible shocks (Table 4A).
6. Customized scenarios imply that additional consolidation of 3 percent of GDP by 2015 would set public debt dynamics on a much more benign path (Figure 1). Two additional scenarios were compared with the baseline scenario: The “passive scenario” assumes no further adjustment beyond that programmed for 2015, implying a steadily increasing debt-to-GDP ratio. Alternatively, a more front-loaded “active scenario”, with additional savings of 3 percent of GDP by 2015—through, for instance, a far reaching removal of tax exemptions and a rationalization of the wage bill—would be needed to set the debt ratio on a more benign trend, providing growing fiscal space in the long run.
2 The World Bank is providing technical assistance to strengthen the capacity of the debt office and deepen the domestic debt market.

GHANA
6 INTERNATIONAL MONETARY FUND
CONCLUSIONS
7. While Ghana’s public debt situation has worsened since the last DSA, risks of distress remain moderate. Deteriorations in the debt indicators relative to exports are mainly driven by a weaker external outlook, while fiscal slippages in 2012 have set total public debt on a less favorable path. Revenue-based indicators have overall improved compared to the last DSA, but the debt service-to-revenue ratio still presents the most pronounced risk.
8. Robust growth, a realization of the planned fiscal consolidation, and further adjustment in the long run are essential to achieving the projected debt paths. The baseline scenario assumes the authorities’ envisaged consolidation of 6 percent of GDP by 2015 followed by gradual further consolidation in the long run. These measures will help stabilize the public debt ratio at a still elevated level of about 52 percent of GDP. More ambitious upfront adjustment could set the debt ratio on a much more favorable path.
9. The authorities broadly agree with the analysis, but consider the projections to be on the conservative side. In particular, they expect larger growth dividends from infrastructure investments in the context of a more rapid development of the oil and gas sector and overall higher potential GDP growth. A more optimistic growth projection would result in stronger debt indicators.
GHANA
INTERNATIONAL MONETARY FUND 7
Sources: Country authorities; and staff estimates and projections.
Figure 1A. Ghana: Indicators of Public and Publicly Guaranteed External Debt under Alternatives Scenarios, 2013–2033 1/
1/ The most extreme stress test is the test that yields the highest ratio in 2023. In figure b. it corresponds to a One-time depreciation shock; in c. to a Terms shock; in d. to a One-time depreciation shock; in e. to a Non-debt flows shock and in figure f. to a One-time depreciation shock
0
5
10
15
20
25
30
35
2013 2018 2023 2028 2033
Baseline Historical scenario Most extreme shock 1/ Threshold
e.Debt service-to-revenue ratio
-25
-20
-15
-10
-5
0
5
-1
0
1
2
3
4
5
2013 2018 2023 2028 2033
Rate of Debt Accumulation
Grant-equivalent financing (% of GDP)
Grant element of new borrowing (% right scale)
0
10
20
30
40
50
60
2013 2018 2023 2028 2033
0
50
100
150
200
250
2013 2018 2023 2028 2033
b. PV of debt-to exports ratio
0
50
100
150
200
250
300
350
2013 2018 2023 2028 2033
c. PV of debt-to-revenue ratio
0
5
10
15
20
25
30
2013 2018 2023 2028 2033
d.Debt service-to-exports ratio
a. PV of debt-to GDP ratio
Appendix
GHANA
8 INTERNATIONAL MONETARY FUND
Sources: Country authorities; and staff estimates and projections.1/ The most extreme stress test is the test that yields the highest ratio in 2023. 2/ Revenues are defined inclusive of grants.
Figure 2A. Ghana: Indicators of Public Debt Under Alternative Scenarios, 2013–2033 1/
0
100
200
300
400
500
600
700
800
2013 2015 2017 2019 2021 2023 2025 2027 2029 2031 2033
PV of Debt-to-Revenue Ratio 2/
0
20
40
60
80
100
120
140
160
180
2013 2015 2017 2019 2021 2023 2025 2027 2029 2031 2033
Baseline Fixed Primary Balance Most extreme shock One-time depreciation Historical scenario
PV of Debt-to-GDP Ratio
0
20
40
60
80
100
120
140
2013 2015 2017 2019 2021 2023 2025 2027 2029 2031 2033
Debt Service-to-Revenue Ratio 2/
Historical 6/ Standard 6/
Average Deviation 2013-2018 2019-20332010 2011 2012 2013 2014 2015 2016 2017 2018 Average 2023 2033 Average
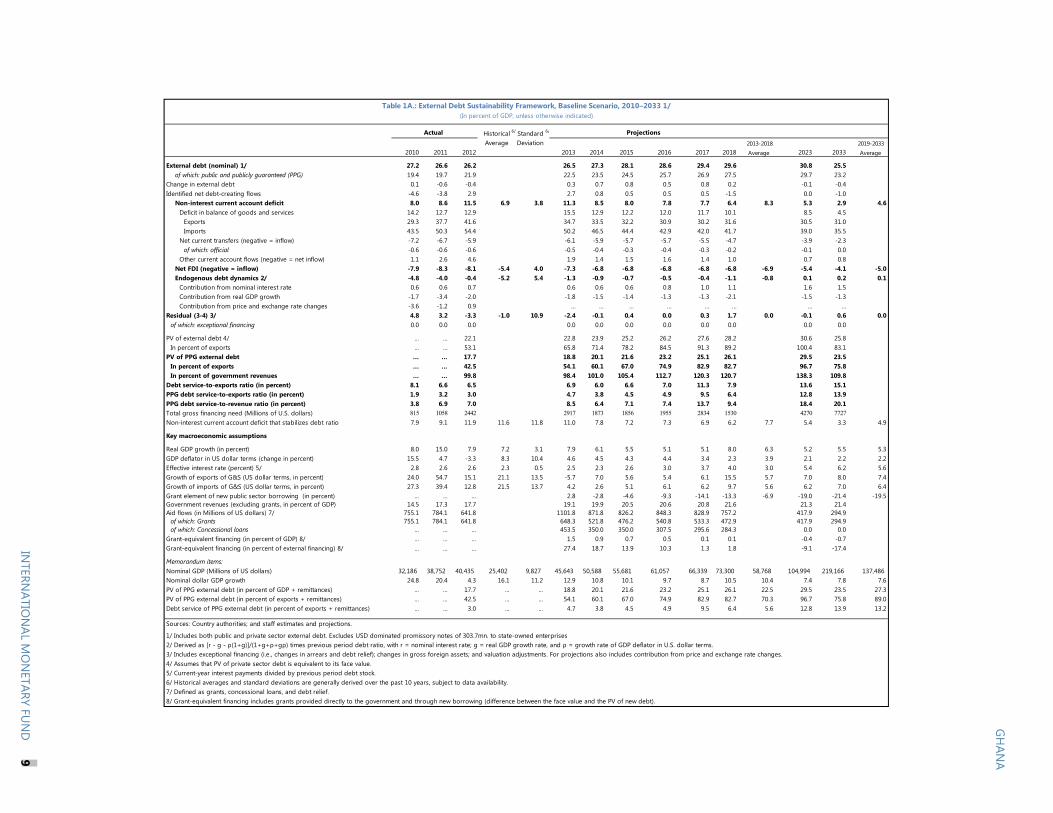
External debt (nominal) 1/ 27.2 26.6 26.2 26.5 27.3 28.1 28.6 29.4 29.6 30.8 25.5of which: public and publicly guaranteed (PPG) 19.4 19.7 21.9 22.5 23.5 24.5 25.7 26.9 27.5 29.7 23.2
Change in external debt 0.1 -0.6 -0.4 0.3 0.7 0.8 0.5 0.8 0.2 -0.1 -0.4Identified net debt-creating flows -4.6 -3.8 2.9 2.7 0.8 0.5 0.5 0.5 -1.5 0.0 -1.0
Non-interest current account deficit 8.0 8.6 11.5 6.9 3.8 11.3 8.5 8.0 7.8 7.7 6.4 8.3 5.3 2.9 4.6Deficit in balance of goods and services 14.2 12.7 12.9 15.5 12.9 12.2 12.0 11.7 10.1 8.5 4.5
Exports 29.3 37.7 41.6 34.7 33.5 32.2 30.9 30.2 31.6 30.5 31.0Imports 43.5 50.3 54.4 50.2 46.5 44.4 42.9 42.0 41.7 39.0 35.5
Net current transfers (negative = inflow) -7.2 -6.7 -5.9 -6.1 -5.9 -5.7 -5.7 -5.5 -4.7 -3.9 -2.3of which: official -0.6 -0.6 -0.6 -0.5 -0.4 -0.3 -0.4 -0.3 -0.2 -0.1 0.0
Other current account flows (negative = net inflow) 1.1 2.6 4.6 1.9 1.4 1.5 1.6 1.4 1.0 0.7 0.8Net FDI (negative = inflow) -7.9 -8.3 -8.1 -5.4 4.0 -7.3 -6.8 -6.8 -6.8 -6.8 -6.8 -6.9 -5.4 -4.1 -5.0Endogenous debt dynamics 2/ -4.8 -4.0 -0.4 -5.2 5.4 -1.3 -0.9 -0.7 -0.5 -0.4 -1.1 -0.8 0.1 0.2 0.1
Contribution from nominal interest rate 0.6 0.6 0.7 0.6 0.6 0.6 0.8 1.0 1.1 1.6 1.5Contribution from real GDP growth -1.7 -3.4 -2.0 -1.8 -1.5 -1.4 -1.3 -1.3 -2.1 -1.5 -1.3Contribution from price and exchange rate changes -3.6 -1.2 0.9 … … … … … … … …
Residual (3-4) 3/ 4.8 3.2 -3.3 -1.0 10.9 -2.4 -0.1 0.4 0.0 0.3 1.7 0.0 -0.1 0.6 0.0of which: exceptional financing 0.0 0.0 0.0 0.0 0.0 0.0 0.0 0.0 0.0 0.0 0.0
PV of external debt 4/ ... ... 22.1 22.8 23.9 25.2 26.2 27.6 28.2 30.6 25.8In percent of exports ... ... 53.1 65.8 71.4 78.2 84.5 91.3 89.2 100.4 83.1
PV of PPG external debt ... ... 17.7 18.8 20.1 21.6 23.2 25.1 26.1 29.5 23.5In percent of exports ... ... 42.5 54.1 60.1 67.0 74.9 82.9 82.7 96.7 75.8In percent of government revenues ... ... 99.8 98.4 101.0 105.4 112.7 120.3 120.7 138.3 109.8
Debt service-to-exports ratio (in percent) 8.1 6.6 6.5 6.9 6.0 6.6 7.0 11.3 7.9 13.6 15.1PPG debt service-to-exports ratio (in percent) 1.9 3.2 3.0 4.7 3.8 4.5 4.9 9.5 6.4 12.8 13.9PPG debt service-to-revenue ratio (in percent) 3.8 6.9 7.0 8.5 6.4 7.1 7.4 13.7 9.4 18.4 20.1Total gross financing need (Millions of U.S. dollars) 815 1058 2442 2917 1873 1856 1955 2834 1530 4270 7727Non-interest current account deficit that stabilizes debt ratio 7.9 9.1 11.9 11.6 11.8 11.0 7.8 7.2 7.3 6.9 6.2 7.7 5.4 3.3 4.9
Key macroeconomic assumptions
Real GDP growth (in percent) 8.0 15.0 7.9 7.2 3.1 7.9 6.1 5.5 5.1 5.1 8.0 6.3 5.2 5.5 5.3GDP deflator in US dollar terms (change in percent) 15.5 4.7 -3.3 8.3 10.4 4.6 4.5 4.3 4.4 3.4 2.3 3.9 2.1 2.2 2.2Effective interest rate (percent) 5/ 2.8 2.6 2.6 2.3 0.5 2.5 2.3 2.6 3.0 3.7 4.0 3.0 5.4 6.2 5.6Growth of exports of G&S (US dollar terms, in percent) 24.0 54.7 15.1 21.1 13.5 -5.7 7.0 5.6 5.4 6.1 15.5 5.7 7.0 8.0 7.4Growth of imports of G&S (US dollar terms, in percent) 27.3 39.4 12.8 21.5 13.7 4.2 2.6 5.1 6.1 6.2 9.7 5.6 6.2 7.0 6.4Grant element of new public sector borrowing (in percent) ... ... ... 2.8 -2.8 -4.6 -9.3 -14.1 -13.3 -6.9 -19.0 -21.4 -19.5Government revenues (excluding grants, in percent of GDP) 14.5 17.3 17.7 19.1 19.9 20.5 20.6 20.8 21.6 21.3 21.4Aid flows (in Millions of US dollars) 7/ 755.1 784.1 641.8 1101.8 871.8 826.2 848.3 828.9 757.2 417.9 294.9
of which: Grants 755.1 784.1 641.8 648.3 521.8 476.2 540.8 533.3 472.9 417.9 294.9of which: Concessional loans ... ... ... 453.5 350.0 350.0 307.5 295.6 284.3 0.0 0.0
Grant-equivalent financing (in percent of GDP) 8/ ... ... ... 1.5 0.9 0.7 0.5 0.1 0.1 -0.4 -0.7Grant-equivalent financing (in percent of external financing) 8/ ... ... ... 27.4 18.7 13.9 10.3 1.3 1.8 -9.1 -17.4
Memorandum items:Nominal GDP (Millions of US dollars) 32,186 38,752 40,435 25,402 9,827 45,643 50,588 55,681 61,057 66,339 73,300 58,768 104,994 219,166 137,486 Nominal dollar GDP growth 24.8 20.4 4.3 16.1 11.2 12.9 10.8 10.1 9.7 8.7 10.5 10.4 7.4 7.8 7.6PV of PPG external debt (in percent of GDP + remittances) ... ... 17.7 ... ... 18.8 20.1 21.6 23.2 25.1 26.1 22.5 29.5 23.5 27.3PV of PPG external debt (in percent of exports + remittances) ... ... 42.5 ... ... 54.1 60.1 67.0 74.9 82.9 82.7 70.3 96.7 75.8 89.0Debt service of PPG external debt (in percent of exports + remittances) ... ... 3.0 ... ... 4.7 3.8 4.5 4.9 9.5 6.4 5.6 12.8 13.9 13.2
Sources: Country authorities; and staff estimates and projections.
1/ Includes both public and private sector external debt. Excludes USD dominated promissory notes of 303.7mn. to state-owned enterprises2/ Derived as [r - g - ρ(1+g)]/(1+g+ρ+gρ) times previous period debt ratio, with r = nominal interest rate; g = real GDP growth rate, and ρ = growth rate of GDP deflator in U.S. dollar terms. 3/ Includes exceptional financing (i.e., changes in arrears and debt relief); changes in gross foreign assets; and valuation adjustments. For projections also includes contribution from price and exchange rate changes.4/ Assumes that PV of private sector debt is equivalent to its face value.5/ Current-year interest payments divided by previous period debt stock. 6/ Historical averages and standard deviations are generally derived over the past 10 years, subject to data availability. 7/ Defined as grants, concessional loans, and debt relief.8/ Grant-equivalent financing includes grants provided directly to the government and through new borrowing (difference between the face value and the PV of new debt).
Actual
Table 1A.: External Debt Sustainability Framework, Baseline Scenario, 2010–2033 1/(In percent of GDP, unless otherwise indicated)
Projections
INTERN
ATION
AL MO
NETARY FU
ND
2
GH
ANA
INTERN
ATION
ALM
ON
ETARYFU
ND
9

Estimate
2010 2011 2012 Average 5/ Standard D5/ 2013 2014 2015 2016 2017 20182013-18 Average 2023 2033
2019-33 Average
Public sector debt 1/ 45.7 42.5 50.2 51.4 52.5 52.5 52.9 54.9 54.8 56.3 52.1of which: foreign-currency denominated 19.4 19.7 21.9 22.5 23.5 24.5 25.7 26.9 27.5 29.7 23.2
Public Sector debt, excluding arrears 37.4 39.5 47.2 50.3 52.5 52.5 52.9 54.9 54.8 56.3 52.1
Change in public sector debt 9.6 -3.1 7.7 1.3 1.0 0.0 0.4 2.1 -0.1 0.0 -0.4
Identified debt-creating flows 2.4 -3.9 5.5 2.2 1.5 -0.3 0.1 0.7 -0.3 -0.1 -0.4
Primary deficit 4.8 1.3 7.9 3.4 2.6 6.5 5.1 2.3 2.3 2.3 2.2 3.5 0.7 0.3 0.5
Revenue and grants 16.8 19.3 19.3 20.5 21.0 21.3 21.4 21.6 22.3 21.7 21.6
of which: grants 2.3 2.0 1.6 1.4 1.0 0.9 0.9 0.8 0.6 0.4 0.1
Primary (noninterest) expenditure 21.6 20.6 27.2 27.0 26.1 23.6 23.8 23.9 24.5 22.4 21.9
Automatic debt dynamics -3.1 -6.1 -2.2 -4.2 -3.5 -2.6 -2.1 -1.6 -2.5 -0.7 -0.7Contribution from interest rate/growth differential -1.1 -6.2 -2.8 -3.7 -2.7 -1.9 -1.5 -1.2 -2.5 -0.7 -0.7of which: contribution from average real interest rate 1.5 -0.2 0.3 0.0 0.3 0.8 1.0 1.4 1.6 2.0 2.0of which: contribution from real GDP growth -2.7 -6.0 -3.1 -3.7 -3.0 -2.7 -2.5 -2.5 -4.1 -2.8 -2.7Contribution from real exchange rate depreciation -2.0 0.1 0.6 -0.6 -0.8 -0.7 -0.6 -0.4 -0.1 ... ...Other identified debt-creating flows 0.7 0.8 -0.2 -0.1 -0.1 -0.1 -0.1 -0.1 -0.1 0.0 0.0Privatization receipts (negative) 1.0 1.0 0.0 0.0 0.0 0.0 0.0 0.0 0.0 0.0 0.0Recognition of implicit or contingent liabilities 0.0 0.0 0.0 0.0 0.0 0.0 0.0 0.0 0.0 0.0 0.0Debt relief (HIPC and other) -0.3 -0.2 -0.2 -0.1 -0.1 -0.1 -0.1 -0.1 -0.1 0.0 0.0Other (specify, e.g. bank recapitalization) 0.0 0.0 0.0 0.0 0.0 0.0 0.0 0.0 0.0 0.0 0.0Residual, including asset changes 7.2 0.8 2.2 -0.9 -0.5 0.3 0.3 1.4 0.2 0.1 0.0
Other Sustainability IndicatorsPV of public sector debt ... ... 46.0 47.7 49.1 49.5 50.4 53.1 53.4 56.1 52.4of which: foreign-currency denominated ... ... 17.7 18.8 20.1 21.6 23.2 25.1 26.1 29.5 23.5of which: external ... ... 17.7 18.8 20.1 21.6 23.2 25.1 26.1 29.5 23.5PV of contingent liabilities (not included in public sector debt) ... ... ... ... ... ... ... ... ... ... ...Gross financing need 2/ 12.1 11.3 17.8 18.5 19.6 17.3 17.0 18.0 17.2 17.1 17.9PV of public sector debt-to-revenue and grants ratio (in percent) … … 238.6 232.7 234.3 232.4 235.0 245.5 239.7 258.4 243.1PV of public sector debt-to-revenue ratio (in percent) … … 259.9 250.0 246.4 242.1 245.1 254.9 246.8 263.2 244.6of which: external 3/ … … 99.8 98.4 101.0 105.4 112.7 120.3 120.7 138.3 109.8Debt service-to-revenue and grants ratio (in percent) 4/ 23.7 25.4 27.0 30.3 28.5 29.7 29.0 33.9 29.1 37.6 40.5Debt service-to-revenue ratio (in percent) 4/ 27.6 28.4 29.5 32.6 30.0 31.0 30.3 35.2 29.9 38.3 40.7Primary deficit that stabilizes the debt-to-GDP ratio -4.8 4.5 0.2 5.3 4.1 2.3 1.9 0.2 2.3 0.6 0.7
Key macroeconomic and fiscal assumptionsReal GDP growth (in percent) 8.0 15.0 7.9 7.2 3.1 7.9 6.1 5.5 5.1 5.1 8.0 6.3 5.2 5.5 5.3Average nominal interest rate on forex debt (in percent) 0.0 3.6 2.9 0.7 1.4 3.0 2.7 3.0 3.4 4.1 4.3 3.4 5.6 6.8 5.9Average real interest rate on domestic debt (in percent) 1.7 -1.9 0.5 -1.0 3.8 -1.1 0.1 1.9 2.5 3.2 4.1 1.8 4.4 3.7 4.1Real exchange rate depreciation (in percent, + indicates depreciation) -10.2 0.6 3.0 -5.1 7.8 -2.8 -3.6 -2.9 -2.7 -1.5 -0.2 -2.3 0.1 0.0 0.0Inflation rate (GDP deflator, in percent) 16.5 13.0 13.3 17.2 5.2 13.7 12.8 11.1 10.3 8.8 7.4 10.7 6.8 6.9 6.9Growth of real primary spending (deflated by GDP deflator, in percent) 15.2 9.9 42.3 15.1 13.5 7.3 2.4 -4.4 5.7 5.8 10.5 4.5 4.5 4.3 4.5Grant element of new external borrowing (in percent) ... ... ... … … 2.8 -2.8 -4.6 -9.3 -14.1 -13.3 -6.9 -19.0 -21.4 -19.5
Sources: Country authorities; and staff estimates and projections.1/ Excluding arrears to state-owned enterprises.2/ Gross financing need is defined as the primary deficit plus debt service plus the stock of short-term debt at the end of the last period. 3/ Revenues excluding grants.4/ Debt service is defined as the sum of interest and amortization of medium and long-term debt.5/ Historical averages and standard deviations are generally derived over the past 10 years, subject to data availability.
Table 2A. Ghana: Public Sector Debt Sustainability Framework, Baseline Scenario, 2010–2033(In percent of GDP, unless otherwise indicated)
Actual Projections
GH
ANA
10IN
TERNATIO
NAL
MO
NETARY
FUN
D

GHANA
INTERNATIONAL MONETARY FUND 11
2013 2014 2015 2016 2017 2018 2023 2033
Baseline 19 20 22 23 25 26 29 24
A. Alternative Scenarios
A1. Key variables at their historical averages in 2013-2033 1/ 19 18 20 21 22 25 26 22A2. New public sector loans on less favorable terms in 2013-2033 2 19 20 23 25 28 29 35 34
B. Bound Tests
B1. Real GDP growth at historical average minus one standard deviation in 2014-2015 19 20 22 23 25 26 30 24B2. Export value growth at historical average minus one standard deviation in 2014-2015 3/ 19 19 20 22 23 25 28 23B3. US dollar GDP deflator at historical average minus one standard deviation in 2014-2015 19 21 24 26 28 29 33 26B4. Net non-debt creating flows at historical average minus one standard deviation in 2014-2015 4/ 19 25 32 33 34 34 33 24B5. Combination of B1-B4 using one-half standard deviation shocks 19 19 17 19 21 23 28 23B6. One-time 30 percent nominal depreciation relative to the baseline in 2014 5/ 19 27 29 32 34 36 40 32
Baseline 54 60 67 75 83 83 97 76
A. Alternative Scenarios
A1. Key variables at their historical averages in 2013-2033 1/ 54 55 61 67 73 78 85 71A2. New public sector loans on less favorable terms in 2013-2033 2 54 61 71 81 92 93 114 109
B. Bound Tests
B1. Real GDP growth at historical average minus one standard deviation in 2014-2015 54 58 65 73 81 81 95 74B2. Export value growth at historical average minus one standard deviation in 2014-2015 3/ 54 57 60 68 76 76 91 72B3. US dollar GDP deflator at historical average minus one standard deviation in 2014-2015 54 58 65 73 81 81 95 74B4. Net non-debt creating flows at historical average minus one standard deviation in 2014-2015 4/ 54 75 98 106 112 107 109 76B5. Combination of B1-B4 using one-half standard deviation shocks 54 53 45 52 59 60 76 63B6. One-time 30 percent nominal depreciation relative to the baseline in 2014 5/ 54 58 65 73 81 81 95 74
Baseline 98 101 105 113 120 121 138 110
A. Alternative Scenarios
A1. Key variables at their historical averages in 2013-2033 1/ 98 93 95 101 106 114 122 102A2. New public sector loans on less favorable terms in 2013-2033 2 98 102 111 122 134 136 164 157
B. Bound Tests
B1. Real GDP growth at historical average minus one standard deviation in 2014-2015 98 100 106 113 121 122 140 111B2. Export value growth at historical average minus one standard deviation in 2014-2015 3/ 98 97 97 105 112 114 133 107B3. US dollar GDP deflator at historical average minus one standard deviation in 2014-2015 98 104 116 125 133 134 154 122B4. Net non-debt creating flows at historical average minus one standard deviation in 2014-2015 4/ 98 126 155 160 163 157 156 110B5. Combination of B1-B4 using one-half standard deviation shocks 98 97 83 92 101 104 130 109B6. One-time 30 percent nominal depreciation relative to the baseline in 2014 5/ 98 137 144 154 165 165 190 151
Table 3A. Ghana: Sensitivity Analysis for Key Indicators of Public and Publicly Guaranteed External Debt, 2013–2033(In percent)
PV of debt-to GDP ratio
Projections
PV of debt-to-exports ratio
PV of debt-to-revenue ratio

GHANA
12 INTERNATIONAL MONETARY FUND
2013 2014 2015 2016 2017 2018 2023 2033
Baseline 5 4 4 5 9 6 13 14
A. Alternative Scenarios
A1. Key variables at their historical averages in 2013-2033 1/ 5 4 4 4 8 5 10 8A2. New public sector loans on less favorable terms in 2013-2033 2/ 5 4 4 4 9 5 14 22
B. Bound Tests
B1. Real GDP growth at historical average minus one standard deviation in 2014-2015 5 4 4 5 9 6 13 14B2. Export value growth at historical average minus one standard deviation in 2014-2015 3/ 5 4 4 5 9 6 12 14B3. US dollar GDP deflator at historical average minus one standard deviation in 2014-2015 5 4 4 5 9 6 13 14B4. Net non-debt creating flows at historical average minus one standard deviation in 2014-2015 4/ 5 4 5 7 12 10 16 14B5. Combination of B1-B4 using one-half standard deviation shocks 5 4 4 4 8 4 10 12B6. One-time 30 percent nominal depreciation relative to the baseline in 2014 5/ 5 4 4 5 9 6 13 14
Baseline 9 6 7 7 14 9 18 20
A. Alternative Scenarios
A1. Key variables at their historical averages in 2013-2033 1/ 9 6 6 6 11 8 14 12A2. New public sector loans on less favorable terms in 2013-2033 2/ 9 6 6 7 13 8 20 32
B. Bound Tests
B1. Real GDP growth at historical average minus one standard deviation in 2014-2015 9 6 7 8 14 10 19 21B2. Export value growth at historical average minus one standard deviation in 2014-2015 3/ 9 6 7 7 13 9 18 20B3. US dollar GDP deflator at historical average minus one standard deviation in 2014-2015 9 7 8 8 16 11 21 23B4. Net non-debt creating flows at historical average minus one standard deviation in 2014-2015 4/ 9 6 8 10 18 14 22 21B5. Combination of B1-B4 using one-half standard deviation shocks 9 6 7 6 13 8 17 20B6. One-time 30 percent nominal depreciation relative to the baseline in 2014 5/ 9 9 10 10 19 13 26 28
Memorandum item:Grant element assumed on residual financing (i.e., financing required above baseline) 6/ -25 -25 -25 -25 -25 -25 -25 -25
Sources: Country authorities; and staff estimates and projections.
an offsetting adjustment in import levels ).
4/ Includes officia l and private transfers and FDI.
5/ Depreciation is defined as percentage decl ine in dol la r/local currency rate, such that i t never exceeds 100 percent.
6/ Appl ies to a l l s tress scenarios except for A2 (less favorable financing) in which the terms on a l l new financing are as speci fied in footnote 2.
3/ Exports va lues are assumed to remain permanently a t the lower level , but the current account as a share of GDP is assumed to return to i ts basel ine level after the shock (impl ici tly assuming
Debt service-to-revenue ratio
1/ Variables include real GDP growth, growth of GDP deflator (in U.S. dol lar terms), non-interest current account in percent of GDP, and non-debt creating flows.
2/ Assumes that the interest rate on new borrowing i s by 2 percentage points higher than in the basel ine., whi le grace and maturi ty periods are the same as in the basel ine.
Projections
Debt service-to-exports ratio
Table 3A. Ghana: Sensitivity Analysis for Key Indicators of Public and Publicly Guaranteed External Debt, 2013-2033 (continued)
(In percent)
GHANA
INTERNATIONAL MONETARY FUND 13
2013 2014 2015 2016 2017 2018 2023 2033
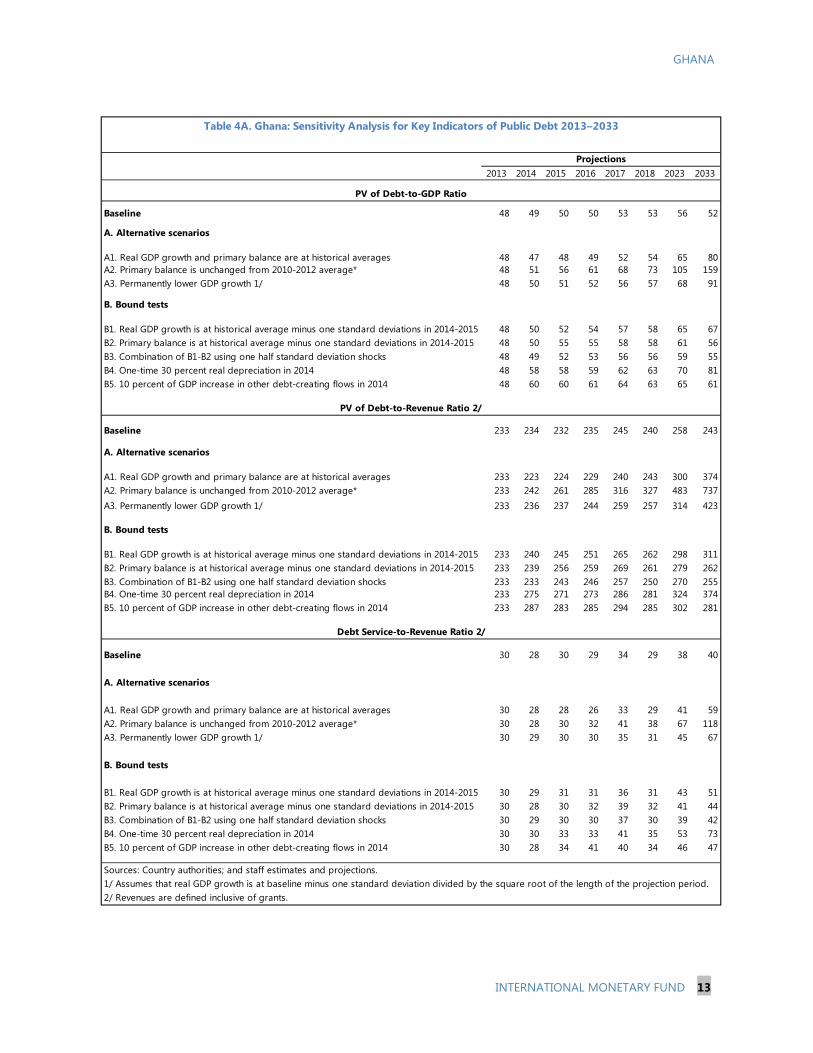
Baseline 48 49 50 50 53 53 56 52
A. Alternative scenarios
A1. Real GDP growth and primary balance are at historical averages 48 47 48 49 52 54 65 80A2. Primary balance is unchanged from 2010-2012 average* 48 51 56 61 68 73 105 159A3. Permanently lower GDP growth 1/ 48 50 51 52 56 57 68 91
B. Bound tests
B1. Real GDP growth is at historical average minus one standard deviations in 2014-2015 48 50 52 54 57 58 65 67B2. Primary balance is at historical average minus one standard deviations in 2014-2015 48 50 55 55 58 58 61 56B3. Combination of B1-B2 using one half standard deviation shocks 48 49 52 53 56 56 59 55B4. One-time 30 percent real depreciation in 2014 48 58 58 59 62 63 70 81B5. 10 percent of GDP increase in other debt-creating flows in 2014 48 60 60 61 64 63 65 61
Baseline 233 234 232 235 245 240 258 243
A. Alternative scenarios
A1. Real GDP growth and primary balance are at historical averages 233 223 224 229 240 243 300 374A2. Primary balance is unchanged from 2010-2012 average* 233 242 261 285 316 327 483 737A3. Permanently lower GDP growth 1/ 233 236 237 244 259 257 314 423
B. Bound tests
B1. Real GDP growth is at historical average minus one standard deviations in 2014-2015 233 240 245 251 265 262 298 311B2. Primary balance is at historical average minus one standard deviations in 2014-2015 233 239 256 259 269 261 279 262B3. Combination of B1-B2 using one half standard deviation shocks 233 233 243 246 257 250 270 255B4. One-time 30 percent real depreciation in 2014 233 275 271 273 286 281 324 374B5. 10 percent of GDP increase in other debt-creating flows in 2014 233 287 283 285 294 285 302 281
Baseline 30 28 30 29 34 29 38 40
A. Alternative scenarios
A1. Real GDP growth and primary balance are at historical averages 30 28 28 26 33 29 41 59A2. Primary balance is unchanged from 2010-2012 average* 30 28 30 32 41 38 67 118A3. Permanently lower GDP growth 1/ 30 29 30 30 35 31 45 67
B. Bound tests
B1. Real GDP growth is at historical average minus one standard deviations in 2014-2015 30 29 31 31 36 31 43 51B2. Primary balance is at historical average minus one standard deviations in 2014-2015 30 28 30 32 39 32 41 44B3. Combination of B1-B2 using one half standard deviation shocks 30 29 30 30 37 30 39 42B4. One-time 30 percent real depreciation in 2014 30 30 33 33 41 35 53 73B5. 10 percent of GDP increase in other debt-creating flows in 2014 30 28 34 41 40 34 46 47
Sources: Country authorities; and staff estimates and projections.1/ Assumes that real GDP growth is at baseline minus one standard deviation divided by the square root of the length of the projection period.2/ Revenues are defined inclusive of grants.
Table 4A. Ghana: Sensitivity Analysis for Key Indicators of Public Debt 2013–2033
PV of Debt-to-GDP Ratio
Projections
PV of Debt-to-Revenue Ratio 2/
Debt Service-to-Revenue Ratio 2/