geology and ground- water resources of fond du … and ground water resources of fond du lac county,...
TRANSCRIPT
Geology and Ground- Water Resources of Fond du Lac County, Wisconsin
GEOLOGICAL SURVEY WATER-SUPPLY PAPER 1604
Prepared in cooperation with the Geo logical and Natural History Survey, University of Wisconsin, and the city of Fond du Lac

Geology and Ground Water Resources of Fond du Lac County, WisconsinBy THOMAS G. NEWPORT
GEOLOGICAL SURVEY WATER-SUPPLY PAPER 1604
Special reference is given to the area of the city of Fond du Lac. Prepared in cooperation with the Geological and Natural History Survey, University of Wisconsin, and the city of Fond du Lac
UNITED STATES GOVERNMENT PRINTING OFFICE, WASHINGTON : 1962

UNITED STATES DEPARTMENT OF THE INTERIOR
STEWART L. UDALL, Secretary
GEOLOGICAL SURVEY
Thomas B. Nolan, Director
The U.S. Geological Survey Library catalog card for this publication appears onpage 52.
For sale by the Superintendent of Documents, U.S. Government Printing Office Washington 25, D.C.

CONTENTS
PageAbstract. _______________________-----_________--_________________ 1Introduction ______________________________________________________ 2
Purpose and scope of investigation.______________________________ 2Description of the area_____________________________________ 2
Location and population.___________________________________ 2Economic development_____________________________________ 3Topography and drainage.._________________________________ 3Climate __________________________________________________ 4
Previous investigations. _ ________________________________ 4Numbering system. ____________________________________________ 4Acknowledgments _____________________________________________ 6
Geologic formations and their water-bearing properties,________________ 6Precambrian rocks_____________________________________________ 11Cambrian system. _____________________________________________ 12
Dresbach group ___________________________________________ 13Eau Claire sandstone.__________________________________ 13Galesville sandstone__________ __________________________ 13
Franconia sandstone _______________________________________ 14Trempealeau formation..--_________________________________ 14
Ordovician system.____________________________________________ 14Prairie du Chien group,____________________________________ 15St. Peter sandstone ________________________________________ 15Platteville formation and Galena dolomite.___________________ 16Maquoketa shale __________________________________________ 17Neda formation ___________________________________________ 17
Silurian system._______________________________________________ 18Niagara dolomite__________________________________________ 18
Quaternary system. ____________________________________________ 19Ground water.____________________________________________________ 20
Source and occurrence. _________________________________________ 20Artesian conditions ________________________________________ 21Water-table conditions _____________________________________ 22
Recharge of ground water ______________________________________ 22Discharge of ground water_________________________________ 23Movement of ground water_____________________________________ 24Water levels and their significance-______________________________ 25Aquifer tests. _ ________________________________________________ 30
Sandstones of Cambrian and Ordovician ages at Fond du Lac___ 33Analysis of data_______________________________________ 33Application of coefficients to past records-________________ 35Application of coefficients to future conditions.____________ 37
Niagara dolomite._ ________________________________________ 38Specific capacity of wells_______________________________________ 41Utilization of water____________________________________________ 44
Domestic and stock supplies ________________________________ 44Public supplies- ---_-___-__-__-_________________-_-__---_-_ 45Industrial supplies.________________________________________ 46
Chemical character of water ____________________________________ 47
in

IV CONTENTS
Page Conclusions and recommendations___________________________________ 48References_______________________________________________________ 50
ILLUSTRATIONS
[Plates are in pocket]
PLATE 1. Map of Fond du Lac County, Wis., showing location of wells, test holes, and springs.
2. Map showing bedrock geology.3. Stratigraphic sections from Fairwater to Campbelhport, Waupun
to Pipe, and Ripon to Mount Calvary.4. Map showing piezometric surface in area west of Niagara escarpment.5. Map showing piezometric surface in area east of Niagara escarpment.
Page FIGURE 1. Average monthly precipitation at Eldorado, Fond du Lac,
and Ripon___________________________________________ 42. Annual precipitation at Eldorado, Fond du Lac, and Ripon__ 53. Contact of Platteville formation and St. Peter sandstone____ 164. Outcrop of Maquoketa shale_-_----_--_-_-----_----______ 185. A small reef structure in the Niagara dolomite___________ 196. Fluctuations of water levels in four wells, and monthly pre
cipitation and cumulative departure from average monthly precipitation. ________________________________________ 27
7. Hydrograph of well FL 8--____-______-____._____________ 288. Hydrograph of well FL 9_______.______________________ 289. Hydrograph of well FL 24_______________________________ 29
10. Hydrograph of well FL 31__________.___________ 3011. Hydrograph of well FL 32___________________________ 3112. Hydrograph of well FL 59___-____-____________________ 3113. Hydrograph of well FL 20-_____.__________________ 3214. Hydrograph of well FL 21________________________ 3215. Hydrograph of well FL 19___--.__________________ 3216. Map of the Fond du Lac area showing location of wells for
aquifer tests---_------__----__________-______________ 3417. Pumpage from deep wells______________________________ 3618. Theoretical drawdown in an infinite aquifer__._____________ 3719. Map of Niagara dolomite test area_ ______________________ 3920. Map of Niagara dolomite test area showing extent of marshes
in 1910-_____________________________ 4221. Map of Niagara dolomite test area showing extent of marshes
in 1955____________-___-___________________ 42
TABLES
TABLE 1. Sample logs of selected wells and test holes in Fonc1 du LacCounty, Wis___________________________________ 8
2. Summary of coefficients of transmissibility and storage of sandstones of Cambrian and Ordovician ages computed from aquifer tests at Fond du Lac___________________________ 35
3. Specific capacity of wells in Fond du Lac County___________ 444. Municipal pumpage of ground water in Fond du Lac County,
1957___________________________.____________________ 45

GEOLOGY AND GROUND-WATER RESOURCES OF FOND DU LAG COUNTY, WISCONSIN
By THOMAS G. NEWPORT
ABSTRACT
The principal water-bearing rocks underlying Fond du Lac County, Wis., are sandstones of Cambrian and Ordovician age and dolomite of Silurian age. Other aquifers include dolomite of Ordovician age and sand and gravel of Quaternary age. Crystalline rocks of Precambrian age, which underlie all the water-bearing formations, form a practically impermeable basement complex and yield little or no water to wells.
Ground water is the source of all public and most private and industrial water supplies in the county. The municipalities and industries obtain water chiefly from wells that penetrate the sandstones of Cambrian and Ordovician age. The Platteville formation and Galena dolomite of Ordovician age and the Niagara dolomite of Silurian age supply water to most domestic and stock wells and to a few industrial wells. Several buried valleys in the bedrock surface contain water-bearing deposits of sand and gravel.
The source of the ground water in Fond du Lac County is local precipitation. Recharge to the water-bearing beds occurs in most of the county but is greatest where the bedrock formations are near the surface. Ground water is discharged by seeps and springs, by evaporation and transpiration, and by wells.
Ground-water levels in wells fluctuate in response to recharge and to natural discharge and pumping. In areas not affected by pumping, water levels generally decline through the summer months because of natural discharge and lack of recharge, recover slightly in the fall after the first killing frost, decline during the winter, and recover in the spring when recharge is greatest. In areas of heavy pumping, the water levels are lowest in late summer and highest in late winter. Water levels in wells in the Fond du Lac area were about 5 to 50 feet above the land surface in 1885, but they had declined to as low as 185 feet below the land surface by 1957.
Coefficients of transmissibility and storage of the sandstones of Cambrian and Ordovician age were determined by making controlled aquifer tests at Fond du Lac. The coefficients were verified by comparing computed water-level declines with actual declines. The computed values were within about 30 percent of the actual values, a reasonable agreement for coefficients of this type.
Probable declines of water levels by 1966 were computed, using the same coefficients of transmissibility and storage. If the distribution of well? and the rate of pumping remain the same in 1957-66 as they were in 1956, the water levels will decline about 5 feet more by 1966. If, however, the distribution of pumped wells remains the same but the pumping by the city of Fond du Lac increases at a uniform rate from the 3 ingd (million gallons per day) pumped in 1956 to 5 mgd in 1966, the water levels in 1966 will be at least 60 feet below

2 GEOLOGY, WATER RESOURCES, FOND DU LAC CCTJNTY, WIS.
those of 1956. Dispersal of wells to the northwest toward the recharge area would reduce the water-level declines.
The results of pumping tests of test holes tapping the Niagara dolomite indicate that wells producing at least 200 gpm (gallons per minute) could be developed east of the Niagara escarpment.
The ground water in Fond du Lac County is, in general, a hard calcium and magnesium bicarbonate water, which contains excessive iron in some areas.
INTRODUCTION
Water levels in deep artesian wells in the Fond du Lac area, Wis consin, have been declining Gradually for many years. The continuing decline caused concern among ground-water users in the area, and it became apparent that a comprehensive investigation of the ground- water resources of Fond du Lac County would be essential to the orderly planning of future water supplies.
In 1946 the U.S. Geological Survey, in cooperation with the Wis consin Geological and Natural History Survey, University of Wis consin, began a program of ground-water studies in Wisconsin. The investigation of the geology and ground-water resources of Fond du Lac County, begun in September 1953 and completed in February 1959, was a part of this statewide program. The city of Fond du Lac contributed funds to the Wisconsin Geological and Natural History Survey for cooperation between that agency and the U.S. Geological Survey to defray part of the cost of the investigation.
PURPOSE AND SCOPE OF INVESTIGATION
The purpose of this investigation was to determine the thickness, character, and a real extent of the water-bearing beds underlying Fond du Lac County with special reference to the Fond du Lac area; to determine the capacity of the beds to absorb, store, transmit, and dis charge water; and to determine the chemical character of the ground water. A detailed study was made of the geology and ground-water resources of the sandstones of Cambrian and Ordovician age and the Niagara dolomite of Silurian age in the vicinity of Fond du Lac. and reconnaissance studies were made of all the water-bearing beds throughout the county.
The investigation was planned cooperatively with George F. Han- son. State Geologist. It was conducted under the immediate supervi sion of W. J. Drescher. district engineer, and C. L. R. Holt, Jr.. district geologist, who succeeded Mr. Drescher in 1957.
DESCRIPTION OF THE AREA
LOCATION AND POPULATION
Fond du Lac Count}7 is in east-central Wisconsin at the southern end of Lake Winnebago. It is bounded on the north by Winnebago

INTRODUCTION 3
and Calumet Cotmties, on the east by Calumet and Sheboygan Counties, on the south by Washington and Dodge Counties, ?nd on the west by Green Lake County. The distance across the county is 36 miles from east to west and 18 to 27 miles from north to south. The county has an area of approximately 760 square miles.
In 1950, the population of Fond du Lac County was 67,829, of which 29,936 (44 percent) resided in the city of Fond du Lac.
ECONOMIC DEVELOPMENT
The economy of the county is chiefly agricultural. Dairying is of major importance and sweet corn, peas, oats, and barley are grown extensively. There are several canning factories and many small milk-processing and cheese plants in the county. Repair shops for two railroads are located at North Fond du Lac. In 1958, ther*1 were approximately 15 industrial plants in the city of Fond du Lac.
TOPOGRAPHY AND DRAINAGE
The most pronounced topographic feature in the county is a west- facing escarpment of Niagara dolomite (pi. 2). It extends from south of Pipe to Eden, thence south west ward to Oakfield and south to the Dodge County line. The top of the escarpment ranges from about 50 to 150 feet above the general level of the area to the west.
The area east of the escarpment is higher and more rolling than the area to the west. The so-called Kettle Moraine area in the southeastern part of the country is rolling to hilly. To the north, the surface is gently rolling and is characterized by numerous hills, or drumlins, and by a few relatively flat areas.
A large flat plain, 3 to 8 miles wide, lies immediately west of the escarpment and extends southward from Lake Winnebago to a few miles north of the Dodge County line. West of this plain the surface is gently rolling.
Most of the streams that drain the county originate within its boundaries. The area east of the escarpment is drained by the Mani- towoc, Sheboygan, and Milwaukee Rivers and their tributaries into Lake Michigan. The flat plain in the central part of the county is drained by the East Branch of the Fond du Lac River and De Neveu Creek and their tributaries into Lake Winnebago. The West Branch of the Fond du Lac River and Anderson Creek drain the north-central part of the county, also into Lake Y^inne- bago. The extreme northwestern part of the county is drained by Silver Creek and the west-central part by Grand River. Both streams flow into the Fox River in Winnebago County and thence into Lake Winebago. The headwaters of the Rock River drain the southwestern and south-central parts of the county southward to the Mississippi River.
4 GEOLOGY, WATER RESOURCES, FOND DU LAC COUNTY, WIS.
CLIMATE
The climate of Fond du Lac County is characterized by mild sum mers and cold winters. The average annual temperature recorded at Fond du Lac is 46.6°F. Tem perature extremes range from a high of 106°F, recorded in 1916, to a low of 41 °F, recorded in Jan uary 1951.
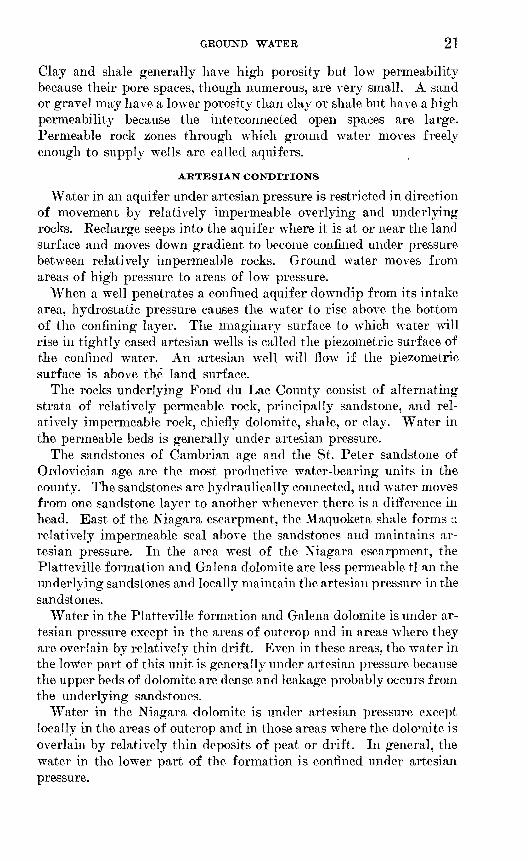
The average monthly precipita tion at Eldorado, Fond du Lac, and Eipon are shown in figure 1; the annual precipitation at these sta tions for the periods of record are shown in figure 2. About 50 per cent of the precipitation falls from May to August during the princi pal growing season.
PREVIOUS INVESTIGATIONS
The general features of the geol ogy and the occurrence of ground water in Fond du Lac County are described in reports by Chamberlin (1877), Weidman and Schultz (1915), and Alden (1918). In 1950 Spicer made an electrical- resistivity survey to determine the depths to the Precambrian base ment complex in the Eipon-Fond du Lac area, and in 1954 Woollard and Hanson made a seismic investi gation to determine the thickness of the glacial deposits in the Camp- bellsport area.
NUMBERING SYSTEM
The wells, test holes, and springs are numbered in the order that they were visited during the field investi gation. The letters that precede the numbers designate the counties as follows: FL, Fond du Lac; Dg,Dodge; GL, Green Lake; Wi, FIGURE 1. Average monthly precipita-Winnebago. Because of space lim- tion at Eldorado, Ford du Lac, and.... °, . Ripon, in Fond du Lac County, Wis. ItatlOnS, the prefixes are Omitted From records of U.S. leather Bureau.

INTRODUCTION
AVERAGE 28.55 INCHES
ELDORADO
AVERAGE 29.53 INCHES
FOND DU LAC
AVERAGE 28.40 INCHES
RIPON
FIGUEE 2. Annual precipitation at Eldorado, Fond du Lac, and Ripon, in Fond du Lac County, Wis. From records of U.S. Weather Bureau.
604855 O 61-

6 GEOLOGY, WATER RESOURCES, FOND DU LAC COUNTY, WIS.
from several of the illustrations. The location of the wells, test holes, and springs is shown on plate 1.
ACKNOWLEDGMENTS
The writer wishes to thank the many persons who have con tributed information and assistance during the field investigation and preparation of this report. Acknowledgment is made to the mu nicipal employees, particularly the former superintendent, Mr. E. J. Braun, and the present superintendent, Mr. H. D. Elmer, of the Fond du Lac Water Department, for supplying data on water levels, pumpage, and locations of wells; to well drillers, well owners, and consulting engineers for furnishing well logs, records of water levels, pumpage, and other data; and to the Wisconsin State Laboratory of Hygiene for making chemical analyses of the water samples collected during this investigation. Thanks are also expressed to Mr. G. F. Hanson, State Geologist, for his review of this report; to Mr. F. T. Thwaites, retired professor of geology at the LTniversity of Wiscon sin, to Mr. J. B. Steuerwald, State Geological and Xatural History Survey, for preparing the sample logs of wells and supplying geologic data; and to Mr. O. J. Muegge, State Sanitary Engineer, for supply ing well records from the files of the State Board of Health.
GEOLOGIC FORMATIONS AND THEIR WATER-BEARINGPROPERTIES
The map showing the bedrock geology of Fond du Lac County (pi. 2) was modified from the "Geologic Map of Wisconsin 7 ' (Bean, 1949) using sample logs (logs compiled by Wisconsin Geological and Natural History Survey from examination of well samples) of wells and test holes and field observations.
The rocks underlying Fond du Lac County range in age from Pre- cambrian to Quaternary and are of sedimentary, metamorphic, and igneous origin. A generalized description of the rock units and their water-bearing characteristics is given below. The sample logs of wells FL 22, FL 31, FL 33, FL 50, FL 59, FL 125. and test hole FL 300 are given in table 1. The bedrock formations dip gently to the east and southeast (pi. 3).

GEOLOGIC FORMATIONS, THEIR WATER-BEARING PROPERTIES
£sS
fc,
Is
.5 Bs
j - >>-^ C3
B \*~
^ ̂ S ^~
£^ tCtn
! olo ma
"3 >'
! c
' J.

8 GEOLOGY, WATER RESOURCES, FOND DU LAC COUNTY, WIS.
TABLE 1. Sample logs of selected wells and test holes in Fond du Lac County, Wis.
Thickness (feet)
Depth (feet)
PL 22, NW^NW 1̂ sec. 36, T. 15 N., R. 14 E. Surface altitude, 990 feet.
Quaternary system:Pleistocene deposits:
Clay, gray, some boulders. ________________________ 15Ordovician system:
Galena dolomite and Platteville formation:Dolomite, gray___________________________________ 185Dolomite, gray, sandy__.-_-----___--______________ 15
Prairie du Chien group:Dolomite, gray___________________________________ 65Dolomite, gray, cherty.___________________________ 10Dolomite, gray___________________________________ 45Shale, green, very dolomitic-_--_-_-_-______________ 5
Cambrian system:Trempealeau formation:
Shale, red, dolomitic-_____________________________ 5Siltstone, pink, sandy, dolpmitic____________ ________ 45Siltstone, dark-red, dolomitic, glauconitic-__-____.___ 25
Franconia sandstone:Sandstone, pink, fine-grained, slightly silty___________ 155
Galesville sandstone:Sandstone, gray, silty, fine- to medium-grained___--__ 210 Siltstone, pink, sandy._---_____-_-__-_____________ 20Sandstone, pink, fine- to medium-grained. ___________ 25Conglomerate, quartzite pebbles.___________________ 20Siltstone, pink; some shale, red____-_--_____________ 10
Precambrian:Quartzite, pink.__.____-_____-.__-__-____-_-____._ 28
PL 31, NW%SE% sec. 10, T. 15 N., R. 17 E. Surface altitude 754 feet
Quaternary system:Pleistocene deposits:
Clay, red, dolomitic____-__________________________ 35Clay, gray, dolomitic___-_-___--_--_-._-______---__ 70
Ordovician system:Galena dolomite and Platteville formation:
Dolomite, gray,__________________________________ 185Sandstone, gray, dolomitic, fine- to medium-grained- __ 10
St. Peter sandstone:Sandstone, gray to pink, fine- to medium-grained.____ 130Shale, red.________.___._______.__..__.____._... 40
Cambrian system:Trempealeau formation:
Sandstone, gray to pink___________________________ 20Dolomite, gray.____-____-_-_--_--___-_______----_ 5
Franconia sandstone:Sandstone, gray, dolomitic, very fine-grained.________ 25Siltstone, pink, doloniitic__-_----_-----_----_-_-__- 45Sandstone, gray, dolomitic.________-_-__-__.__-_-_- 10
Galesville sandstone:Sandstone, gray, very fine- to fine-grained. ___-_-____ 165
Precambrian:Quartzite, gray____._-__.______-_----____--__-_-_- 5

GEOLOGIC FORMATIONS, THEIR WATER-BEARING PROPERTIES 9
TABLE 1. Sample logs of selected wells and test holes in Fond du Lac County,Wis. Continued
Thickness (feet)
Depth(feet)
FL 33, SW^NW 1! sec. 15, T. 15 N., R. 17 E. Surface altitude, 760 feet.
Ordovician system: Galena dolomite and Platteville formation:
Dolomite, gray _ _ _ _Sandstone, gray, dolomitic, medium- to coarse-grained.
Sandstone, gray, dolomitic, very fine-grained.St. Peter sandstone:
Sandstone, gray to white, fine- to medium-grained ____
Shale, red___ ________ ___
Prairie du Chien group:
Precambrian:
65
175 5
10 15
75 5
10 10
40 5
10
65
240 245 255 270
345 350 360 370
410 415
425
FL 50, SE%NW% sec. 22, T. 16 N., R. 14 E. Surface altitude, 929 feet.
No samples. _______ _______________ _ --_-___ _ _ - __Ordovician system:
Galena dolomite and Platteville formation:
St. Peter sandstone:
Prairie du Chien group: Dolomite, gray.-.-. ._- -_--________
Cambrian system: Trempealeau formation:
Sandstone, pink, dolomitic, fine- to medium-grained __
Franconia sandstone: Sandstone, pink, dolomitic, glauconitic, fine-grained _
Sandstone, gray, dolomitic, fine- to medium-grained. __
Galesville sandstone: Sandstone, gray, fine- to medium-grained __ __ ___ _
25
40
45 5
20 1075
20 40
30 5
65 15 25
75
25
65
110 115
135 145 220
240 280
310 315 380 395 420
495

10 GEOLOGY, WATER RESOURCES, FOND DU LAC COUNTY, WIS.
TABLE 1. Sample logs of selected wells and, test holes in Fond du Lac County,Wis. Continued
Thickness Depth (feet) (feet)
FL 59, NE^4SE% sec. 11, T. 15 N., R. 17 B. Surface altitude, 757 feet.
Quaternary system:Pleistocene deposits:
Clay, red, dolomitic___---___-__-__--______________ 15Clay, gray, dolomitic, boulder______________________ 90
Ordovician system:Galena dolomite and Platteville formation:
Dolomite, gray___________-_______________________ 225Sandstone, gray, dolomitic, fine- to coarse-grained. ___ 15
St. Peter sandstone:Sandstone, gray, fine- to medium-grained.___________ 110Shale, red, dolomitic ______________________________ 50
Cambrian system:Trempealeau formation:
Siltstone, gray to pink, dolomitic_ __________________ 35Franconia sandstone:
Sandstone, pink, dolomitic, very fine to fine grained-__ 55 Sandstone, gray, dolomitic, fine- to medium-grained--_ 25
Galesville sandstone:Sandstone, gray, fine- to medium-grained___-________ 190Sandstone, red, fine to very coarse grained___________ 15
Precambrian:Quartzite, pink_______________________________________ 10
FL 125, NE%NE% sec. 13, T. 13 N., R. 18 E. Surface altitude, 1038 feet
INo samples____._____--_____-_--_-__---_-_____----_______ 20Silurian system:
Niagara dolomite:Dolomite, gray___________________________________ 312
Ordovician system:Neda formation:
Shale, hematitic, oolitic, dolomitic, hard.____________ 3Shale, dark-reddish-brown, hematitic, slightly dolo-
mitic_____--_-_--------__----_---___--_--______ 15Maquoketa shale:
Shale, gray, dolomitic-____________________________ 30Dolomite, gray.__________________________________ 10Shale, gray, dolomitic-__-__--_---______-__________ 50Dolomite, gray___________________________________ 20Shale, gray, dolomitic-____________________________ 20Dolomite, gray___________________________________ 5Shale, gray, dolomitic-____________________________ 133
Galena dolomite and Platteville formation:Dolomite, gray_______-___-___-__-______--_____-__ 217Sandstone, gray, dolomitic, fine- to coarse-grained-___ 20
St. Peter sandstone:Sandstone, gray, fine-grained____--_--____-____-_-__ 10Siltstone, gray, very dolomitic____________________ 5Sandstone, gray, fine- to medium-grained------------ 80

GEOLOGIC FORMATIONS, THEIR WATER-BEARING PROPERTIES
TABLE 1. Sample logs of selected wells and test holes in Fond du Lac County,Wis. Continued
Thickness (feet)
Depth(feet)
FL 125, NEi4NEi/i sec. 13, T. 13 N., R. 18 E. Surface altitude, 1038 feet Continued
Cambrian system:Trempealeau formation:
Dolomite, gray___________________________________ 55 1, 005Franconia sandstone:
Siltstone, greenish-gray, very dolomitic______________ 10 1,015Sandstone, gray, dolomitic, fine- to coarse-grained_ ___ 25 1, 040Siltstone, gray, very dolomitic______________________ 10 1,050Sandstone, gray, very dolomitic, fine-grained_________ 20 1, 070Sandstone, white, medium- to coarse-grained,________ 5 1, 075Sandstone, gray, dolomitic, very fine to medium
grained______'________--_---_--_________________ 25 1,100Galesville sandstone:
Sandstone, white, fine- to medium-grained___________ 75 1, 175Eau Claire sandstone:
Sandstone, gray, very dolomitic-___________________ 40 1,215Shale, gray, dolomitic _____________________________ 10 1, 225Sandstone, fine- to medium-grained _________________ 75 1, 300
Test hole FL 300, NW^SW 1/! sec. 11, T. 15 N., R. 18 E. Surface altitude, 994 feet.
Quaternary system:Pleistocene deposits:
Clay, dark-gray __________________________________ 10 10Gravel, light-gray, sandy_ _________________________ 5 15
Silurian system:Niagara dolomite:
Dolomite, light-gray____--_--_----_-_-_--_______-_ 30 45Dolomite, light-gray; some chert____________________ 50 95Dolomite, light-gray______________________________ 10 105Dolomite, light-gray; some chert____________________ 30 135Dolomite, light-gray, cherty______________._________ 40 175Dolomite, light-gray_ _____________________________ 15 190
Ordovician system: Maquoketa shale:
Shale, light-gray, dolomitic__ ______________________ 5 195Dolomite, light-gray, pyritic_______________________ 5 200Shale, light-gray, dolomitic-_______________________ 10 210
PRECAMBRIAN ROCKS
Crystalline rocks of Precambrian age such as quartzite, granite, schist, and gneiss, which are estimated to be several thousand feet thick, underlie with a major unconformity the sedimentaiy rocks of Cambrian, Ordovician, Silurian, and Quaternary ages. One of the units of crystalline rock, the Utley metarhyolite, is exposed in Green Lake County approximately 1.5 miles southwest of Fairwater, but none are exposed in Fond du Lac County.
Although the surface of the crystalline rocks has a regional slope of about 20 to 30 feet per mile toward the east and south, the surface in Fond du Lac County is uneven, with slopes ranging from a few feet

12 GEOLOGY, WATER RESOURCES, FOND DU LAC COUNTY, WIS.
to several hundred feet per mile. This surface has a relief of at least 1,100 feet in Fond du Lac County (pi. 3, section C-C'}.
In the southwestern part of the city of Fond du Lac quartzite was found in wells FL 30, FL 33, FL 34, and FL 35 at depths of 400^40 feet or about 315-360 feet above mean sea level. The sample log of well FL 33 is given in table 1. Less than a mile northeast of these wells, quartzite was found in well FL 31 at a depth of 740 feet or at approximately 10 feet above mean sea level (table 1). The city's wells north and northeast of well FL 31 tapped quartzite at elevations below mean sea level. Quartzite was found at a depth of 555 feet or 200-225 feet above mean sea level in test holes FL 37, and FL 38, 1 mile north and 1% miles east of well FL 30 respectively. Based on the limited data from wells, it is believed that the structural high in the crystalline rocks near the southern part of the city of Fond du Lac (pi. 3, section B-B') is steep-sided to the north.
Another structural high in the crystalline rocks is centered approxi mately 10 miles west of Fond du Lac and 2 miles south of Rosendale. Quartzite was found in well FL 212 at a depth of 65 feet or 870 feet above mean sea level, and at a depth of 102-140 feet or about 800-835 feet above mean sea level in wells FL 74, FL 210, and FL 211. Well FL 55 in Rosendale tapped quartzite at a depth of 420 feet or approxi mately 500 feet above mean sea level.
During the spring of 1957, 21 electrical-resistivity profiles were made in the area between well FL 212 and Fond du Lac by H. C. Spicer and G. J. Edwards, of the U.S. Geological Survey, to determine the depth to the surface of the crystalline rock. The analysis of the resistivity data by Spicer (1950), and an analysis made independently by Woollard (Woollard and Hanson, 1954), suggested an eastward- trending structural high in the surface of the crystalline rocks south of Rosendale. The results of the resistivity studies were inconclusive, however, and test drilling will be necessary to determine accurately the configuration of the crystalline-rock surface.
The rocks of Precambrian age do not yield water and form a prac tically impermeable basement complex below the sedimentary rocks.
CAMBRIAN SYSTEM
Sandstones of Cambrian age unconformably overlie the crystal line rocks of Precambrian age, and are in turn overlain by younger formations. The sandstones filled in the depressions and covered most of the high areas on the Precambrian surface. The rocks of Cambrian age penetrated by wells in Fond du Lac County are, in ascending order, the Eau Claire sandstone, the Galesville sandstone, the Franconia sandstone, and the Trempealeau formation. The Galesville sandstone, Eau Clarie sandstone, and Mount Gimon sand stone are formations of Dresbach group. The name Dresbach has

GEOLOGIC FORMATIONS, THEIR WATER-BEARING PROPERTIES 13
long had formational status in U.S. Geological Survey nomenclature as the Dresbach sandstone, and it- is here redesignated a group. Trowbridge and Atwater (193i) proposed the name Galesville mem ber for beds then called Dresbach sandstone by the U.S. Geological Survey; the name Galesville is here assigned formational status as the Galesville sandstone. Although the Eau Claire sandstone was found in only one well and the Mount Simon sandstone has been ab sent in wells in Fond du Lac County, they are known to be present to the south and to the east.
The thickness of the rocks of Cambrian age, which range? from 0 to 515 feet, differs greatly throughout the county because of the ir regular upper surface of the Precambrian rocks. The rocks of Cambrian age are thin or absent in the areas where mounds or ridges occur in the crystalline rocks (FL 33 and FL 300, table 1, g-nd pi. 3, sections B-B' and C-C'.
DRESBACH GROUP
EAU CLAIRE SANDSTONE
The Eau Claire sandstone is a fine- to medium-grained dolomitic sandstone that is wTell consolidated and does not cave into uncased wells. It is generally light gray, but may be white to moderate pink.
The Eau Claire sandstone was identified only in well FL 125 at Campbellsport, where the top of the formation was 1,175 feet below the land surface (pi. 3, section A-A'). The well was drilled through 125 feet of the Eau Claire but did not penetrate it completely (table 1).
GALESVILLE SANDSTONE
The Galesville sandstone consists mostly of fine- to medium-grained sandstone. It it chiefly light gray but includes a few zones that are pale pink. Some of the beds are well cemented with silica or dolomite and are difficult to drill. A few thin beds of siltstone, generally less than 5 feet thick, are present. Detailed descriptions of Galesville sandsone are given in logs of wells FL 22, FL 31, FL 50, FL 59, and FL125 (table 1).
The Galesville sandstone underlies all of Fond du Lac County, ex cept in those areas underlain by structural highs in the Precambrian rocks, where it was not deposited. The sandstone was completely penetrated by wells at Fairwater, Brandon, Fond du Lac, Rosendale, Campbellsport, and Waupun. The greatest thickness penetrated was 285 feet in well FL 22 at Brandon (table 1 and pi. 3, section A-A'}.
The Galesville sandstone is believed to be the most productive water-bearing formation in the Fond du Lac area. Its permeability is variable, especially in a vertical direction, because of changes in the sorting of the sand and the presence of layers of dolomite and siltstone.
604855 0^61 3

14 GEOLOGY, WATER RESOURCES, FOND DU LAC COUNTS, WIS.
FRANCONIA SANDSTONE
The Franconia, sandstone is a fine- to medium-grained sandstone that is silty and dolomitic. Thin beds of siltstone and dolomite, gen erally less than 10 feet thick, occur within the formation. T1 N °, color of the Franconia is predominantly light gray, but white, moderate pink, and moderate red also occur. The sandstone is cemented by dolomite but is not difficult to drill. Detailed descriptions of Franconia sand stone are given in logs of wells FL 22, FL 31, FL 50, FL 59, and FL 125 (table 1).
The known thickness of the Franconia sandstone ranges from 0, in areas underlain by structural highs in the Precambrian rocks, to 185 feet, in well FL 15 at Ripon; however, the entire thickness of the forma tion was not penetrated in well FL 15. Where the Franconia sand stone is not present, it was not deposited or was removed by erosion before deposition of the Trempealeau formation.
The Franconia sandstone is believed to rank next to the Galesville sandstone in importance as a source of water to wells in the Fond du Lac area. The permeability of the sandstone is variable, especially in a vertical direction, because of changes in the sorting of the sand and the presence of thin beds of dolomite and siltstone.
TREMPEALEAU FORMATION
The Trempealeau formation is the uppermost unit of the Cambrian system in the Fond du Lac area. Although the formation does not crop out in Fond du Lac County, it is covered by only about 20 feet of glacial drift in the valley of Silver Creek about a mile west of Ripon in Green Lake County.
The Trempealeau formation consists of light-gray very fine to medium grained dolomitic sandstone and moderate-pink or moderate- red siltstone. Detailed description of the Trempealeau formation are given in logs of wells FL 22, FL 31, FL 50, FL 59, and FL 125 (table 1). The known thickness of the formation in the county ranges from 0, in well 51 at Ripon, to 105 feet, in well FL 10 at Fond du Lac. The Trempealeau was probably removed by erosion in the vicinity of well FL 51.
The Trempealeau formation probably has a low permeability be cause the unit consists chiefly of very fine grained sandstone inter- bedded with siltstone. It is believed to yield only relatively small quantities of water to wells.
OBDOVICIAN SYSTEM
The rock units of the Ordovician system, in ascending order, are the Prairie du Chien group, St. Peter sandstone, Platteville formation and Galena dolomite, Maquoketa shale, and Neda formation. These formations successively overlie the rocks of Cambrian age and are ex-

GEOLOGIC FORMATIONS, THEIR WATER-BEARING PROPERTIES 15
posed locally, with the exception of the Neda formation, in the county (pi. 2). They are overlain by deposits of Pleistocene age in most of the western part of the county and by the Niagara, dolomite in the eastern part. The rocks of the Prairie du Chien group, the St. Peter sandstone, and the Platteville formation and Galena dolomite are believed to be hydraulically connected with each other and with the underlying rocks of Cambrian age.
PRAIRIE DTJ CHIEN GROUP
The Prairie du Chien group consists of cherty dolomite and thin beds of shale. The dolomite is light gray to white, hard, and dense. It contains nodules of gray to white chert and a few thin beds of sandstone. A few exposures of the Prairie du Chien group occur near Ripon (pi. 2). Detailed descriptions of the Prairie du Chien group are given in logs of well FL 22, FL 33, and FL 50 (table 1).
The rocks of the Prairie du Chien group range greatly in thickness within relatively short distances because their upper surface is very irregular. In several areas, the rocks of this group were completely removed prior to the deposition of the St. Peter sandstone. For example, the Prairie du Chien group was absent in well FL 51 at Ripon, but in well FL 18, 1% miles southeast of FL 51, it was 160 feet thick. In Fond du Lac County the Prairie du Chien is thickest (240 feet) in well FL 16, about 2 miles southwest of Campbellsport.
The rocks of the Prairie du Chien group have a low perir eability but yield small quantities of water to wells from openings along fractures and bedding planes.
ST. PETER SANDSTONE
The St. Peter sandstone consists of fine- to medium-graired con solidated sandstone that is dolomitic in some places. It is chief y white to light gray, and contains small lenses of reddish slightly dolomitic shale near the base of the formation. Although the sandstone does not generally cave into uncased wells, drillers report that where shale is penetrated in the St. Peter sandstone it must be cased off to prevent caving. The upper part of the St. Peter sandstone is exposed in several road cuts near Ripon (pi. 2). Detailed descriptiors of the St. Peter sandstone are given in logs of wells FL 31, FL 33, FL 50 FL 59, and FL 125 (table 1).
The St. Peter sandstone was deposited on the eroded surface of the rocks of the Prairie du Chien group and thus has an irregulr.r lower surface. The upper surface, however, is relatively even. Where the Prairie du Chien group is uncommonly thick, the St. Peter sandstone generally is thin or is missing. Similarly, where the rocks of the Prairie du Chien group are thin or missing the St. Peter sandstone is thick. In those areas where the St. Peter is missing, the Platteville formation rests directly upon the rocks of the Prairie du Chien group,

16 GEOLOGY, WATER RESOURCES, FOND DU LAC COUNTY, WIS.
and where the Prairie du Chien is missing the St. Peter sandrtone is in contact with the rocks of Cambrian age. In Fond du Lac County the maximum thickness of the St. Peter sandstone penetrated in the sub surface was 260 feet in test hole FL 52 at Ripon.
Most of the wells in Fond du Lac County that obtain water from the St. Peter sandstone also obtain port of their supply from over lying and underlying formations. Well FL 135 at Ripon is open opposite the Platteville formation and Galena dolomite as well as the St. Peter sandstone, but it is believed to obtain most of its water supply from the sandstone. This well was reported pumped at 200 gpm for 24 hours with a drawdown in water level of 31 feet, indicating a specific capacity of 6.4 gpm per foot of drawdown.
PLATTEVILLE FORMATION AND GALENA DOLOMITE
The Platteville formation and Galena dolomite have not been dif ferentiated in the subsurface in the Fond du Lac area, and are con sidered as a unit in this report.
The Platteville formation and Galena dolomite consist of light-gray to medium-bluish-gray dolomite. The beds in the Galena dolomite are thicker than in the Platteville. The contact between the Platte ville formation and the underlying St. Peter sandstone is exposed in a road cut near Ripon in the NEVi sec, 19, T. 16 N., R. 14 E. (fig. 3). Detailed descriptions of the Platteville formation and Galena dolo mite are given in logs of wells FL 22, FL 31, FL 33, FL 50, FL 59, andFL 125 (table 1).
FIGURE 3. Contact of Platteville formation and St. Peter sandstone in road cut near Ripon in NE& sec. 19, T. 16 N., R. 14 E.

GEOLOGIC FORMATIONS, THEIR WATER-BEARING PROPERTIES 17
The Platteville formation and Galena dolomite underlie Fond du Lac County except in a small area in the northwestern corner of the county near Ripon and in the valley of Grand River near Fairwater, where they have been removed by erosion. The unit is thickest (265 feet) in well FL 310 at Campbellsport. The most common thickness is about 200 feet.
Ground water in the dolomite occurs in solutionally enlarged open ings along fractures and bedding planes. Drillers report that domestic and stock wells completed in the dolomite generally yield from about 2 to 15 gpm. However, most of these wells do not pene trate the full thickness of this unit. Well FL 41 at Fonc1 du Lac was reported pumped at a rate of 40 gpm for 10 hours and had a drawdown in water level of 31 feet, indicating a specific capacity of 1.3 gpm per foot of drawdown.
MAQUOKETA SHALE
The Maquoketa shale is a medium-bluish-gray soft dolomitic shale interstratified with thin beds of light-gray and medium-gray dolomite. It must be cased off in wells to prevent caving.
The formation is absent in the western part of the county, is con cealed by glacial drift and slumped fragments of Niagara dolomite in a narrow belt (y2 to 3 miles wide) along the western edge of the Niagara escarpment, and underlies the Niagara dolomite east of the escarpment. The shale is well exposed in a quarry of the Oakfield Brick Co. near Oakfield (fig. 4). Detailed descriptions of the Maquoketa shale are given in logs of wells FL 125 and FL 300 ,(table 1).
FIGURE 4. Outcrop of Maquoketa shale in a quarry near Oakfield, Vis.

18 GEOLOGY, WATER RESOURCES, FOND DU LAC COUNTY, WIS.
The Maquoketa shale yields very small quantities of water to wells in some parts of Wisconsin. Kecords are not available, however, of any well in Fond du Lac County that obtains water from this forma tion. Along the Niagara escarpment, many seeps and spr; ngs issue from the Niagara dolomite at or near the contact between the dolomite and the Maquoketa shale. The shale underlies and forms a relatively impermeable base for the water-bearing Niagara dolomite. The greatest thickness of Maquoketa shale penetrated was 365 fe^.t in well FL 130 at Mount Calvary (pi. 3, section C-C'}.
NEDA FORMATION
The Neda formation is composed of lenticular beds of oolitic, dolo- mitic, hematitic, red shale. It was penetrated by wells only at Camp- bellsport in the southeastern part of Fond du Lac County, where it had a maximum thickness of 18 feet (well FL 125, table 1) but it is not exposed in the county. This formation is not important as an aquifer in Fond du Lac County because it is limited in areal extent, is thin, and probably has a low permeability.
SILURIAN SYSTEM
NIAGARA DOLOMITE
The Niagara dolomite of Silurian age unconformably overlies the Maquoketa shale and dips gently eastward. It is medium gray to white and contains some coral reefs. Detailed descriptions of the Niagara dolomite are given in logs of wells FL 125 and FL 300 (table 1). The beds are generally massive and are intersected by joints. Although fracturing is greatest in the upper part of the dolomite, drillers and well owners have reported large openings throughout the entire thickness of the formation. The distribution of the frac turing is variable and a regional pattern is not discernible.
The Niagara dolomite is present in the eastern part of t\ n, county, east of the Niagara escarpment (pi. 2). It crops out along the escarpment and at a few places to the east (pi. 2), but in most of the area is covered by a varied thickness of Pleistocene deposits. The Niagara dolomite is best exposed south of Fond du Lac in quarries of the Fond du Lac Stone Co. and the Marblehead Lime Co. A small reef structure in the dolomite is exposed in the quarry of the Fond du Lac Stone Co. in the SEi^NWi/i sec. 10, T. 14 N., K. 17 E. (fig. 5).
In general, the Niagara dolomite is thinnest along the Niagara escarpment and is thickest along the eastern boundary of the county. The known thickness of the dolomite ranges from 1 foot in well FL 178 near Peebles to 324 feet in well FL 130 at Mount Calvary (pi. 3, section C-C' ).
Ground water in the Niagara dolomite occurs in openings along fractures and bedding planes, many of which have been enlarged by the solvent action of circulating ground water. The yield-* of wells

GEOLOGIC FORMATIONS, THEIR WATER-BEARING PROPERTIED 19
FIGURE 5. A small reef structure in the Niagara dolomite in the quarry of the Fond du Lac Stone Co. in the SE%NW% sec. 10, T. 14 N., R. 17 E.
tapping the dolomite generally range from about 5 to more than 400 gpm. The large yields are obtained from wells that intersect zones of relatively high permeability.
The water in the dolomite may occur under either water-table or artesian conditions. Most of the flowing artesian wells are more than 100 feet in depth. Water from test hole FL 302, 7 miles east of Fond du Lac, drilled to a depth of 210 feet, flowed 142 gpm and had a pres sure head of more than 19 feet above land surface. The total pressure could not be measured because part of the pressure was dissipated when some of the water flowed outside the casing and upward through the glacial drift. In June 1956 this well was pumped at a rate of 400 gpm and had a specific capacity of about 6 gpm per foot of drawdown.
QUATERNARY SYSTEM
Unconsolidated deposits of Quaternary age overlie the consolidated rocks in most of Fond du Lac County. These deposits, largely of glacial origin and of Pleistocene age, consist of stratified clay, sand, and gravel, and unstratified till, which is an unsorted mixture of glacial sediments. All sediments deposited by or from glacial ice or in water derived from the melting of the ice are termed "drift." Drift of the Gary and Valders substages of the Wisconsin stage of glaciation form prominent topographic features. These features have been mapped and are described in detail by Alden (1918).
The Pleistocene deposits are thickest in preglacial valleys which carried melt water from ice sheets. It is believed these deposits may

20 GEOLOGY, WATER RESOURCES, FOND DU LAC COUNTY, WIS.
be as much as 300 feet thick in eastern Fond du Lac County. The Pleistocene deposits are reported at least 222 feet thick (their entire thickness was not penetrated) in well FL 190, northeast of Calvary, in the northeastern part of the county. The thickness of sand and gravel in well FL 190 was reported to be 140 feet.
The stratified and well-sorted sediments are very permeable and, where sufficiently thick and adequately recharged, may supply large quantities of water to wells. The water-bearing beds of sand and gravel in eastern Fond du Lac County are saturated to levels near the land surface and are readily recharged. Large supplies of water might be developed locally by penetrating and adequately developing the full thickness of these deposits.
Deposits of clay, silt, sand, and gravel of Recent age underlie flood plains in the valleys of the larger streams. Recent deposits of clay, peat, and silt occur in some of the valleys between the hills of till. The Recent sediments in the county have a maximum thickness of about 10 feet, and because they are thin and limited in areal extent yield only small amounts of water to wells.
GROUND WATER
SOURCE AND OCCURRENCE
The source of all ground water in Fond du Lac County is precipita tion in the form of rain and snow. A part of the precipitation flows into streams and lakes as direct runoff, a part returns to the atmos phere through evaporation and transpiration, and a part seeps down ward through the soil and rocks to the zone of saturation to become ground water. The top of the zone of saturation is called the water table, and its position is show^n by the level at which water stands in nonartesian wells. All openings in the zone of saturation are filled with water, and it is water in the zone of saturation that can be obtained by wells and that flows from springs.
Ground water occupies pores, fractures, and bedding-plane open ings in the rocks. The size, shape, and distribution of the openings in the rocks vary considerably from place to place, and they control the storage and movement of water. The amount of water that can be stored in a rock depends on the porosity of the rock. The porosity of a rock is its property of containing interstices or open spaces and is the ratio, expressed as a percentage, of the open space in a rock to its total volume.
The permeability of a rock is a measure of its capacity to transmit water under a hydraulic gradient. Permeability may be expressed as a coefficient that denotes the rate in gallons per day at which water will move thrqugh a cross section of the rock (1 foot squr-re, ipider a hydraulic gradient of 1 foot per foot loss in head of 1 foot for each foot of travel of the water, whatever the direction of movement).
GROUND WATER 21
Clay and shale generally have high porosity but low permeability because their pore spaces, though numerous, are very small. A sand or gravel may have a lower porosity than clay or shale but have a high permeability because the interconnected open spaces are large. Permeable rock zones through which ground water moves freely enough to supply wells are called aquifers.
ARTESIAN CONDITIONS
Water in an aquifer under artesian pressure is restricted in direction of movement by relatively impermeable overlying and underlying rocks. Recharge seeps into the aquifer where it is at or near the land surface and moves down gradient to become confined under pressure between relatively impermeable rocks. Ground water moves from areas of high pressure to areas of low pressure.
When a well penetrates a confined aquifer downdip from its intake area, hydrostatic pressure causes the water to rise above the bottom of the confining layer. The imaginary surface to which water will rise in tightly cased artesian wells is called the piezometric surface of the confined water. An artesian wTell will flow if the piezometric surface is above the land surface.
The rocks underlying Fond du Lac County consist of alternating strata of relatively permeable rock, principally sandstone, and rel atively impermeable rock, chiefly dolomite, shale, or clay. Water in the permeable beds is generally under artesian pressure.
The sandstones of Cambrian age and the St. Peter sandstone of Ordovician age are the most productive water-bearing units in the county. The sandstones are hyclraulically connected, and water moves from one sandstone layer to another whenever there is a difference in head. East of the Niagara escarpment, the Maquoketa shale forms a relatively impermeable seal above the sandstones and maintains ar tesian pressure. In the area west of the Niagara escarpment, the Platteville formation and Galena dolomite are less permeable trail the underlying sandstones and locally maintain the artesian pressure in the sandstones.
Water in the Platteville formation and Galena dolomite is under ar tesian pressure except in the areas of outcrop and in areas where they are overlain by relatively thin drift. Even in these areas, the water in the low^r part of this unit is generally under artesian pressure because the upper beds of dolomite are dense and leakage probably occurs from the underlying sandstones.
Water in the Niagara dolomite is under artesian pressure except locally in the areas of outcrop and in those areas where the dolomite is overlain by relatively thin deposits of peat or drift. In general, the water in the lower part of the formation is confined under artesian pressure.

22 GEOLOGY, WATER RESOURCES, FOND DU LAC COUNTY, WIS.
Artesian conditions occur locally in the Pleistocene deposits where sand and gravel deposits are confined between silt and clr.y.
WATER-TABLE CONDITIONS
The water table is the upper surface of the zone of saturation except where that surface is formed by a bed of relatively impermeable material which confines the water under artesian pressure. Uncon- fined water in the zone of saturation moves slowly through the rocks in a direction determined by the slope of the water table. The water table is not a level or stationary surface; variations from place to place and time to time in its shape and altitude occur as a result of such factors as variation in the permeability and structure of the rocks, variations in the rate of withdrawal of water from wells and by springs, and variations in precipitation which affect the rate of recharge.
Water in the rocks of the Prairie du Chien group, the St. Peter sandstone, the Platteville formation and Galena dolomite, and the Niagara dolomite is under water-table conditions in areas where these formations crop out or where they are covered by only a thin mantle of Quaternary deposits. Water in the deposits of Quaternary age also is under water-table conditions.
RECHARGE OF GROUND WATER
The ground-water reservoirs in Fond du Lac County are recharged chiefly by the direct downward percolation of precipitation through the unsaturated zone to the water table. A small amount of recharge water also may be infiltrated from streams and depression ponds. Upon reaching the zone of saturation the water becomes a part of the ground-water reservoir and moves down the slope of the water table or the piezometric surface.
Recharge to the bedrock formations occurs in most of the county but is greatest in areas where these units are near the surface. The sandstones of Cambrian and Ordovician ages that supply v^ater to the Fond du Lac city wells are recharged over an area of about 250 square miles. This recharge area extends westward from the Niagara escarp ment to the ground-water divides (pi. 4) in the western and south western parts of the county. Water enters the sandstones of Cam brian and Ordovician ages through the overlying consolidated rocks and glacial drift and moves down the slope of the hydraulic gradient principally toward the city of Fond du Lac.
If as much as 10 percent, or about 3 inches, of the annual precipita tion (probably a conservative estimate) reaches the water table in the 250-square-mile recharge area, the recharge would be abcut 36 mgd. In 1956, withdrawals in the vicinity of the city of Fond du Lac were about 3 mgd.

GROUND WATER 23
The configuration of the piezometric surface (pi. 4) indicates that the sandstones of Cambrian and Ordovician ages are not being re charged in substantial amount from Lake Winnebago. The clay and marl bottom of the lake restricts water from moving downward and re charging the underlying formations. The surface of Lake Winnebago is approximately 100 feet above the piezometric surface.
The Niagara dolomite is recharged in most of the area east of the Niagara escarpment. Water enters the dolomite where it crops out or through overlying deposits of Pleistocene age. A grounc1 -water divide lies east of the Niagara escarpment (pi. 5).
DISCHARGE OF GROUND WATER
Ground water may be discharged naturally by flow through seeps and springs and by evaporation and transpiration, and artificially by wells.
The springs in Fond clu Lac County are gravity springs; that is, water does not issue under artesian pressure but is caused by the water table intersecting the land surface. The water of a gravity spring percolates from permeable material or flows from an opening in a rock formation, under the action of gravity, as a surface stream flows down its channel (Meinzer, 1923b, p. 51). The gravity springs in Fond du Lac County are divided into (a) depression springs, where water flows to the surface from permeable material simply Hcause the surface intersects the water table and (b) contact springs, where water flows to the surface from permeable material overlying less permeable or impermeable material that retards or prevents down ward percolation of the groud water and thus deflects it to the surface.
Many small contact springs and seeps occur along the Niagara escarpment in the eastern and southern parts of the county. The water issues from the Niagara dolomite near the contact of thQ, dolo mite with the underlying Maquoketa shale. A few depression springs occur along Rock River and Silver Creek and their tributaries in the western part of the county, and along the margins of water-table lakes in the eastern part. The depression springs along Rock River and Silver Creek issue chiefly from the Platteville formation and Galena dolomite; those along the margins of the water-taKh lakes issue from sand and gravel deposits of Pleistocene age. Although most springs in the county flow less than 1 gpm, a few
discharge as much as 60 gpm. A few springs have been improved and the water is used for domestic or stock supply. The water from most of the springs, however, is lost by transpiration, evaporation, and infiltration into the ground downslope from the springs.
In Fond du Lac County, the discharge of ground water by evaporation and transpiration is greatest in areas where the water table is shallow, such as marshes and undrained depression ponds.

24 GEOLOGY, WATER RESOURCES, FOND DU LAC COUFTY, WIS.
Ground water from wells is used for nearly all domestic, stock, public supply, and industrial supplies in Fond du Lac County. The combined ground-water withdrawals from all wells in the county is estimated to have averaged about 10 ingd in 1957.
MOVEMENT OF GROUND WATER
The movement of ground water is controlled by discharge, re charge, topography, and the structure and permeability of the rocks, and is altered artificially by local pumping and by discharge to or recharge from manmade reservoirs. The direction of movement of ground water in Fond du Lac County is shown by the piezometric maps (pis. 4 and 5). These maps, constructed from water-level measurements made in wells, show, by contour lines, the configuration of the piezometric surface. Water flows down the slope of the hydraulic gradient from points of higher altitude to points of lower altitude, roughly at right angles to the contour lines.
The piezometric map in the area west of the Niagara escarpment (pi. 4) does not represent the piezometric surface of any one geologic unit as it was compiled from water-level measurements made in wells tapping the rocks of Cambrian age, the Prairie du Chier group, the St. Peter sandstone, the Platteville formation and Galera dolomite, or a combination of these units. The rock units, however, are believed to be hydraulically connected and can be considered a single aquifer.
Movement of the ground water is dominantly eastward toward Fond du Lac from two ground-water divides in the western and south western parts of the country (pi. 4). One of these divides trends southwestward across the western part of the county. T7est of this divide movement of ground water is principally westward toward Eipon and Fairwater. A second ground-water divide trends east ward from near Fairwater to Lagoda and thence southward to the Fond du Lac County-Dodge County boundary. In this area move ment of ground water is generally southward toward Waupun. The two ground-water divides roughly parallel topographic divides.
A deep cone of depression, caused by pumping large quantities of water for municipal and industrial use, underlies the city of Fond du Lac (pi. 4). In the area affected by the Fond du Lac pumping, the general eastward direction of movement of water is interrupted and water moves toward the center of the cone of depression from all sides.
The map showing the piezometric surface in the area east of the Niagara escarpment (pi. 5) is based chiefly on water-level measure ments in shallow wells that penetrate only the upper part of the dolomite. A ground-water divide approximately parallels the Niagara escarpment and is 1 to 5 miles to the east. Its location varies season ally and with long-term changes in recharge and discharge. East

GROUND WATER 25
of the ground-water divide, movement of ground water is dominantly eastward. West of the divide, ground water moves towards the Niagara escarpment where it is discharged as spring flow or seepage.
The movement of ground water from one water-bearing bed to another is governed largely by the difference in pressure head of the water in the beds and by the permeability of the intervening material. The movement probably is large in areas where two permeable beds are in direct contact, such as in the western part of Fond du Lac County where the Galena and Platteville unit lie directly upon the St. Peter sandstone and the head in the, Galena and Platteville is appreciably higher than in the St. Peter. Move ment from one permeable bed to another in places where they are separated by a confining layer of low permeability probably is small, but, nevertheless, the ground water does move through a confining layer, albeit slowly, if there is a difference in pressure head of the water in the two aquifers.
The continuous movement of water between the various reck units in Fond du Lac County does not represent net addition to or deple tion of the total ground-water supply. However, the piezometric maps (pis. 4 and 5) show that ground w^ater moves out of th°, county to the east, south, and west.
WATER LEVELS AND THEIR, SIGNIFICANCE
An essential part of a study of the ground-water resource? of any area is the collection of data on water levels over as long a period as possible. The purpose of collecting information on water levels is to determine short-term changes and long-range trends in ground-water levels in wells, and to relate this information to changes in storage in the ground-water reservoirs. Detailed records of water levels in a few wells in the Fond du Lac area have been collected since 1948. Kecords in less detail are available for a longer period.
The water table and the piezometric surfaces of artesian aquifers in Fond du Lac County are not stationary, but rise or decline depend ing upon the amount of recharge to or discharge from the ground- water reservoirs. When recharge exceeds discharge water levels in wells rise, and when discharge exceeds recharge water levels decline. Because recharge is greater during some seasons of the year than during other seasons, water levels are said to fluctuate. In r,reas not affected by pumping, water levels generally rise in the spring, owing to thawing of the frost which permits recharge from melting snow and rainfall; gradually decline during the growing season when the natural discharge exceeds the recharge; often rise in the fall after vegetation has been killed by the frost; and decline during the winter when frost in the soil prevents recharge. In areas affected by pump ing, the decline in water levels may be accentuated during periods of
26 GEOLOGY, WATER RESOURCES, FOND DU LAC COUNTY, WIS.
above-normal temperature when the demand for water is great. Such periods commonly correspond to periods of reduced recharge.
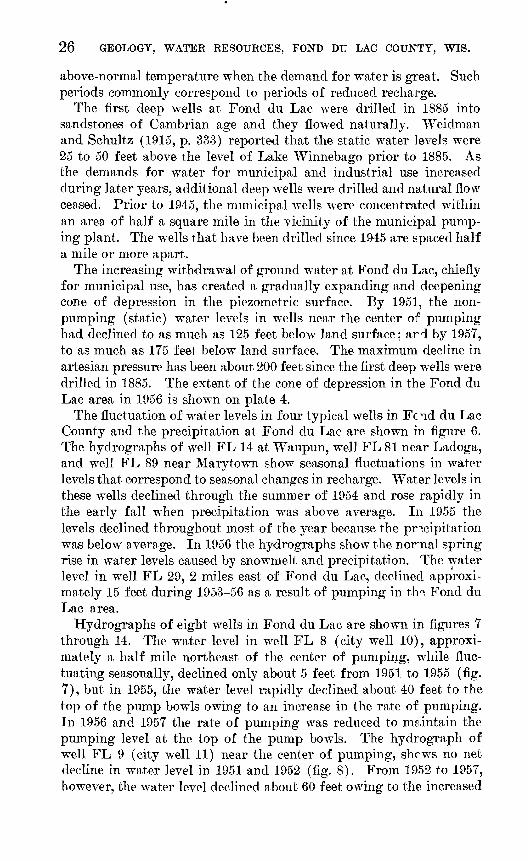
The first deep wells at Fond du Lac were drilled in 1885 into sandstones of Cambrian age and they flowed naturally. Weidman and Schultz (1915, p. 333) reported that the static water levels were 25 to 50 feet above the level of Lake Winnebago prior to 1885. As the demands for water for municipal and industrial use increased during later years, additional deep wells were drilled and natural flow ceased. Prior to 1945, the municipal wells were concentrated within an area of half a square mile in the vicinity of the municipal pump ing plant. The wells that have been drilled since 1945 are spaced half a mile or more apart.
The increasing withdrawal of ground water at Fond du Lac, chiefly for municipal use, has created a gradually expanding and deepening cone of depression in the piezometric surface. By 1951, the non- pumping (static) water levels in wells near the center of pumping had declined to as much as 125 feet below land surface; ard by 1957, to as much as 175 feet below land surface. The maximum decline in artesian pressure has been about 200 feet since the first deep wells were drilled in 1885. The extent of the cone of depression in the Fond du Lac area in 1956 is shown on plate 4.
The fluctuation of water levels in four typical wells in Fend du Lac County and the precipitation at Fond du Lac are shown in figure 6. The hydrographs of well FL 14 at Waupun, well FL 81 near Ladoga, and well FL 89 near Marytown show seasonal fluctuations in water levels that correspond to seasonal changes in recharge. Water levels in these wells declined through the summer of 1954 and rose rapidly in the early fall when precipitation was above average. In 1955 the levels declined throughout most of the year because the precipitation was below average. In 1956 the hydrographs show the normal spring rise in water levels caused by snowmelt and precipitation. The water level in well FL 29, 2 miles east of Fond du Lac, declined approxi mately 15 feet during 1953-56 as a result of pumping in th?. Fond du Lac area.
Hydrographs of eight wells in Fond du Lac are shown in figures 7 through 14. The water level in well FL 8 (city well 10), approxi mately a half mile northeast of the center of pumping, while fluc tuating seasonally, declined only about 5 feet from 1951 to 1955 (fig. 7), but in 1955, the water level rapidly declined about 40 feet to the top of the pump bowls owing to an increase in the rate of pumping. In 1956 and 1957 the rate of pumping was reduced to maintain the pumping level at the top of the pump bowls. The hydrograph of well FL 9 (city well 11) near the center of pumping, shews no net decline in water level in 1951 and 1952 (fig. 8). From 1952 to 1957, however, the water level declined about 60 feet owing to the increased

GROUND WATER 27
20
30
40
Well FL 14 Sandstones of Cambrian age
1953 1954 1955 1956
FIGURE 6. Fluctuations of water levels in four wells in Fond du Lac County, Tis., and monthly precipitation and cumulative departure from average monthly precipitation at Fond du Lac.

DE
PT
H
TO
WA
TER
, IN
FE
ET
BE
LOW
LA
ND
S
UR
FAC
ED
EP
TH
TO
WA
TER
, IN
FE
ET
BE
LOW
LA
ND
S
UR
FAC
Eto oo
GROUND WATER 29
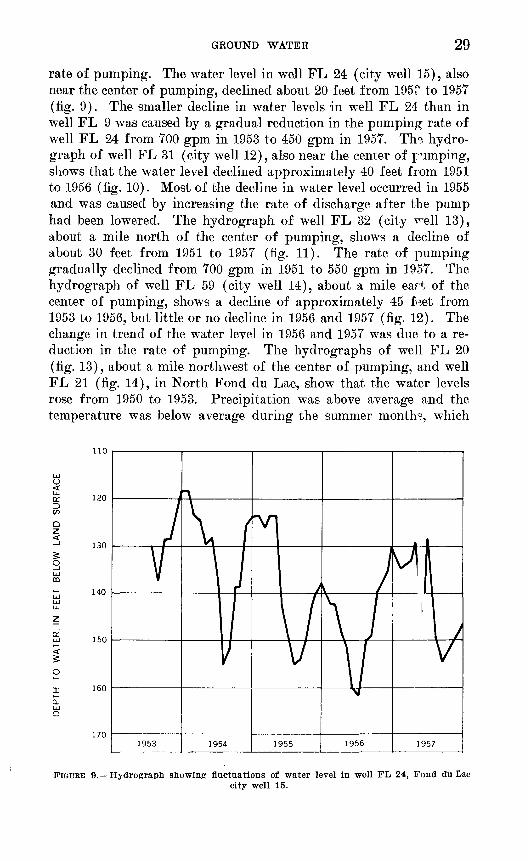
rate of pumping. The water level in well FL 24 (city well 15), also near the center of pumping, declined about 20 feet from 195" to 1957 (fig. 9). The smaller decline in water levels in well FL 24 than in well FL 9 was caused by a gradual reduction in the pumping rate of well FL 24 from 700 gpm in 1953 to 450 gpm in 1957. The hydro- graph of well FL 31 (city well 12), also near the center of pimping, shows that the water level declined approximately 40 feet from 1951 to 1956 (fig. 10). Most of the decline in water level occurred in 1955 and was caused by increasing the rate of discharge after the pump had been lowered. The hydrograph of well FL 32 (city T^ell 13), about a mile north of the center of pumping, shows a decline of about 30 feet from 1951 to 1957 (fig. 11). The rate of pumping gradually declined from 700 gpm in 1951 to 550 gpm in 1957. The hydrograph of well FL 59 (city well 14), about a mile eart of the center of pumping, shows a decline of approximately 45 feet from 1953 to 1956, but little or no decline in 1956 and 1957 (fig. 12). The change in trend of the water level in 1956 and 1957 was due to a re duction in the rate of pumping. The hydrographs of well FL 20 (fig. 13), about a mile northwest of the center of pumping, and well FL 21 (fig. 14), in North Fond du Lac, show that the water levels rose from 1950 to 1953. Precipitation was above average and the temperature was below average during the summer months, which
no
120
130
140
150
160
170
FIGURE 9. Hydrograph showing fluctuations of water level in well FL 24, Fond du Laccity well 15.

30 GEOLOGY, WATER RESOURCES, FOND DU LAC COUNTY, WIS.
resulted in a decrease in pumping of water for cooling purposes and for sprinkling. From 1953 to 1956, water levels gradually declined in response to an increase in pumping. Water levels rose in the latter part of 1956 and fluctuated only slightly in 1957, owing to a slight reduction in pumping.
100
110
120
130
140
150
160
170
180
190
FIGURE 10. Hydrograph showing fluctuations of water level in well FL 31, Fond du Laccity well 12.
The hydrograph of well FL 19 (fig. 15), 13 miles northeast of Fond du Lac, shows a steady 13-foot decline in water level from 1948 through 1957.
AQUIFER TESTS
Aquifer tests of the sandstones of Cambrian and Ordovician ages were made in May 1954 at Fond du Lac and in May 195£ at Ripon. Aquifer tests of the Niagara dolomite were made in 1956 in an area east of Fond du Lac. The purpose of the tests was to determine the hydraulic characteristics the coefficients of transmissibility and stor age of the aquifers. The coefficients in turn are used in predicting the rate and the amount of lowering of water levels to b?, expected at various rates of pumping.

DE
PT
H
TO
W
AT
ER
, IN
FE
ET
BE
LOW
LA
ND
S
UR
FA
CE
DE
PT
H
TO
WA
TE
R,
IN
FEE
T B
ELO
W
LAN
D
SU
RF
AC
E
0.2

DE
PT
H
TO
W
AT
ER
, IN
FE
ET
BE
LOW
LA
ND
S
UR
FA
CE
DE
PTH
TO
W
ATE
R,
IN
FEET
B
ELO
W
LAN
D
SU
RFA
CE
DE
PT
H
TO
W
AT
ER
, IN
FE
ET
BE
LOW
LA
ND
S
UR
FA
CE
CO to

GROUND WATER 33
The coefficient of transmissibility is expressed as the rate of flow of water, at the prevailing water temperature, in gallons per day, through a vertical strip of the aquifer 1 foot wide and extending the full saturated height of the aquifer, under a hydraulic gradient of 100 percent ( 1 foot per foot) . The coefficient of storage of an aq uif er is defined as the volume of water it releases from or takes into storage per unit surface area of the aquifer per unit change in the component of head normal to that surface.
Each test consisted of starting or stopping the pump in a well and measuring the amount and rate of change in water level in the pumped well and in each of several observation wells. The discharge from the pumped well was measured by recording meters in the discharge line or by the change in volume of water in storage reservoirs. Meas urements of depth to water were made with a steel tape or by s,n air line and pressure gage except in wells FL 10 and FL 12, which were equipped with recording gages.
SANDSTONES OP CAMBRIAN AND ORDOVICIAN AGES AT POND DTT L«AC
ANALYSES OF DATA
The aquifer tests were analyzed by the nonequilibrium formula, first developed by Theis (1935). The nonequilibrium formula is
114.6Q TJ7/ N
where W(u)= =-0.5772- loge
, 1.87r2 S and u=
s drawdown, in feet, at any point of observation in the .vicinityof a well discharging at a constant rate;
Q=discharge, in gallons per minute;T= coefficient of transmissibility, gallons per day per foot; r distance, in feet, from discharging well to the point of ob
servation;S= coefficient of storage, expressed as a decimal fraction; / = time in days since pumping started.
The nonequilibrium formula assumes that the aquifer is infinite in areal extent, that it is homogenous and isotropic (transmits water in all directions with equal facility), that its coefficients of trans missibility and storage are constant, that it is confined between im permeable beds, that the discharging well penetrates the entire thickness of the aquifer, and that the discharged water is released from storage instantaneously with decline in head. None of these con-

34 GEOLOGY, WATER RESOURCES, FOND DU LAC COrNTY, WIS.
ditions is fully met in nature, and considerable judgment is necessary to decide the extent to which it can be assumed that they apply in any particular area.
A summary of the values of the coefficients of transmissibility and storage determined from the aquifer tests at Fond du Lac is given in table 2. The coefficients of transmissibility and storage averaged 25,000 gpd per foot and 0.0002, respectively. The locations of the wells used for the aquifer tests are shown in figure 16.
Well number used in report.32
Pumped wellO 12
Observation well
A
Hypothetical well
FIGURE 16. Map of the Fond du Lac area showing location of wells for aquifer tests.

GROUND WATER 35
TABLE 2. Summary of coefficients of transmissibility and storage of sandstones of Cambrian and Ordovician ages computed from aquifer tests at Fond du Lac
Well
FL 3_._- ---------------------FL 8_ ---------------------FL 9_ ---------------------FL 10_._. __---------_--_---.-FL 12.... ---__-.-__..._..----FL 24.. .._----..._--.--...__.FL 31. --.-------__----._----_FL 32... ...-.--....._-_--._..FL 59. --------------------
Average ____ ____
Coefficient of transmissibility
Number of tests
2 52 1 28 4 4 2
Average
24, 400 27, 200 36, 800 6,600
26, 000 31, 800 54, 600 16, 800 5,400
25, 000
Coefficient of storage
Number of tests
2
1 2 4 2 1
Average
0 0001
66620001 0002 00035 0001
0 0002
APPLICATION OF COEFFICIENTS TO FAST RECORDS
It is desirable to verify the values of the coefficients of transmis sibility and storage computed from short-term aquifer tests by ap plying the coefficients to an analysis of available long-term records of pumpage and water levels.
The decline in water level in well FL 31 from 1885, when large ground-water withdrawals began in the area, to the end of 19£6 was computed by applying the nonequilibrium formula to the pumpage data shown in figure 17. For example: The average rate of pumping for 1885 to 1914 was 0.75 mgd. This rate was used to calculate the first increment of decline from 1885 through 1956, a period of 72 years. A rate of 0.9 mgd (the increase in the average rate from 0.75 to 1.65 mgd) was used to compute the second increment of decline f rom 1914 to 1956. Six increments of pumping were used to compute the total decline. The sum of the computed increments of decline, less the effect of recharge, should be equal to the actual decline in water levelr since 1885.
The effective recharge area is the area in which water enters the rocks of Cambrian and Ordovician ages from the surface or from overlying rocks and from which the water moves eastward in the direc tion of the hydraulic gradient toward the Fond du Lac area. The ground-water divides (pi. 4) delineate the western extent of the re charge area. They are approximately parallel to the contours on the piezometric surface west of the area of withdrawal. In the western part of the recharge area, little or no fluctuation of water levelr takes place except that typical of water-table wells.
The effects of recharge were computed using the method of images (Ferris, 1948). That is, the effect of recharge on the drawdown

36 GEOLOGY, WATER RESOURCES, FOND DU LAC COUNTY, WIS.
FIGURE 17. Pumpage from deep wells in the Fond du Lac area, 1885-1956. Municipal ipumpage for Fond du Lac was metered from July 1912 through December 1956 ; all other pumpage was estimated.
produced by a pumping well is the same as though the aquifer were infinite and a like recharging well or source were located on a line perpendicular to and an equal distance on the opposite side of the recharge boundary. The same increments of pumping applied to compute the declines were used in determining the effects of recharge. The hypothetical net computed decline in water level in well FL 31 for 1885 through 1925 was 64 feet and for 1885 through 1956 was 91 feet. The altitude of the water level at the site of well FL 31 was 762 feet in 1885; it was 695 feet in October 1925 and 630 feet in December 1956. Thus, the actual decline in water level in well FL 31 was 67 feet from 1885 to 1925 and 132 feet from 1885 to 1956. The actual decline in water level at well FL 31 was larger than the computed decline by about 5 percent from 1885 to 1925 and about 80 percent from 1885 to 1956.
The difference in the actual and computed declines for the two periods of withdrawals are reasonable, considering the deficiencies in hydrologic and geologic data. It is believed that the average co efficients determined for the Fond du Lac area are approximately cor rect and may be applied with reasonable accuracy to estimate short- period changes in water levels that will result from any given condition of pumping.

GROUND WATER 37
The thinning of the sandstone over the structural high in the crystalline rocks in the southern part of the Fond du Lac area (pi. 3, section B-B') would result in a decrease in the transmissibility of the sandstone in that area. Although this decrease in transmissibility was not considered in computing the decline in w^ater level, it may account for part of the difference in the computed and actual decline.
The aquifer tests indicated a lower transmissibility of the sandstones in the vicinity of wells FL 10 and FL 59 (table 2). Sample logs of these wells indicate that the sandstones are finer grained than the sandstones to the west. During the deposition of the sandstones, the crystalline-rock "highs" may have created barriers to the movement of water and resulted in the deposition of finer grained sand end silt locally. In the area north and east of these barriers test drilling is needed to determine the extent of the local change in character of the sandstone.
APPLICATION OF COEFFICIENTS TO FUTURE CONDITIONS
The lowering in water levels that will occur at distances of 100 to 20,000 feet from a well pumped continuously at 1 mgd for 1 month, 6 months, 1 year, 5 years, 10 years, and 20 years are shown in figure 18. The graph is based on the average coefficients of transmissibility and storage determined for the Fond du Lac area and on the assumption that the aquifer is infinite and all the pumped water is withdrawn from storage (no recharge). Estimates of the decline in water level at any well can be made by adding together the drawdown effects
24 6 8 10 12 14 16
DISTANCE, r, IN THOUSANDS OF FEET FROM PUMPED WELL
18 20
FIGURE 18. Theoretical drawdown in an infinite aquifer, based on coefficients of trans missibility and storage determined for sandstones of Cambrian and Ordovicirn ages at Fond du Lac, Wis.

38 GEOLOGY, WATER RESOURCES, FOND DU LAC COUNTY, WIS.
caused by surrounding pumped wells. These estimates will be larger than the probable actual decline in water level, as the effects of re charge were not considered in preparing figure 18.
In order to estimate future declines in water levels in the Fond du Lac area, it is necessary to estimate future ground-water withdrawals. It is estimated the municipal pumpage by Fond du Lac will increase at a nearly uniform rate from the 3 mgd pumped in 1956 to about 5 mgd in 1966, and that the distribution and amount of the withdrawals for other uses will remain about the same as in 1956 (fig. 17).
If the distribution and amount of pumpage in the area in 1957-66 should remain the same as in 1956, the w^ater level in well FL 31 could be expected to decline about 5 feet more by 1966. If, however, the distribution of pumped wells remains the same but the pumping by Fond du Lac increases at a uniform rate to 5 mgd in 1966, the decline in water level in well FL 31 should be about 60 feet below the level of 1956. Static levels in other wells in the area would decline a like or lesser amount, according to the nearness of the wells to the center of the cone of depression. Pumping levels should decline by approximately the same amount as the static levels if the present rates of pumping from individual wells are maintained.
In order to show the advantage of adequate spacing of wells, it is assumed that the present rate of pumping from existing wells will continue and that the increased withdrawals will be supplied by hypothetical wells at points A, 13, and C as shown on figure 16. These hypothetical wells were arbitrarily located for purposes of illustration only; if wells were to be drilled near these sites geologic, economic, and other factors should be considered. Assuming that hypothetical wells A, B, and C were pumped at 4GO gpm each, the combined rate of pumping would be about 2 mgd. If the wells were put into use at 214-year intervals, adding well A in July 1959, well B in January 1961, and well C in July 1963, the water level in well FL 31 by 1966 would be about 30 feet below the 1956 level, instead of the 60 feet that would occur if the additional water had been pumped from the existing wells. The static levels in wells A, B, and C would have declined about 65 feet by 1966. By that year the pump ing of the three hypothetical wells would have caused a decline of about 35 feet below the level of 1956 in the North Fond du Lac municipal wells.
NIAGARA DOLOMITE
In 1956 the city of Fond du Lac drilled three test holes to determine if sufficient water were available from the Niagara dolomite for a supplemental water supply. Test holes FL 300, FL 302, and FL 303 were drilled approximately 3 miles east of the Niagara escarpment (fig. 19) and 5i/£ miles east of Fond du Lac.
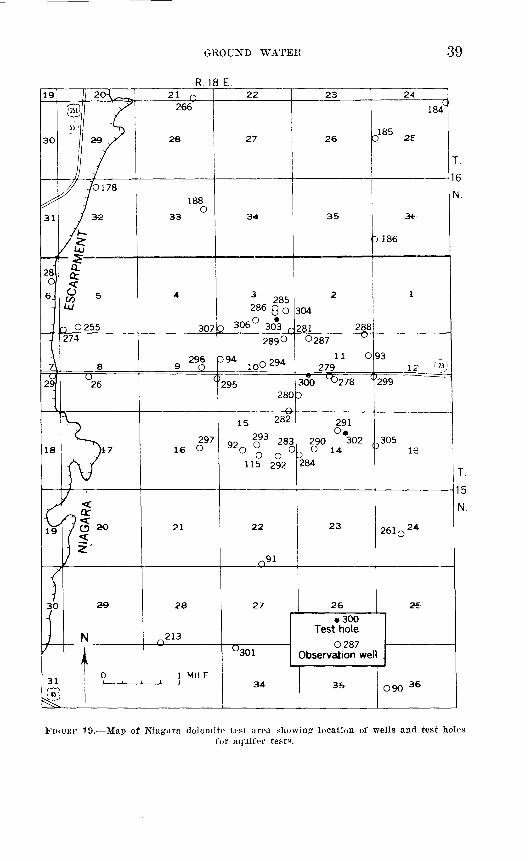
GROUND WATER
R.18 E.
39
19 21 _Q_ 22 23 24
30
266 184
26 27 26
0255
33
1880
34 35
286285
307 306 ° 30*3
3
186
304
r281 288274 289° °287
2969 0
D94 29411 O 93
279
26 295 300 299280 D
18
15 282
29716 0
293 0 920 ° O
0 o o115 292
291 O,
290 302O 14
284
19 21 22 23
29 28
213
27 26
301
300 Test hole
O287 Observation well
1 MILE34 35 O90 36
FIGURF 19. Map of Niagara dolomite test area showing location of wells and test holesfor aquifer tests.

40 GEOLOGY, WATER RESOURCES, FOND DU LAC COUNTY, WIS.
Test hole FL 300 was pumped on April 24-26, 1956, for 2 hours at 50 gpm, 2 hours at 100 gpm, 2 hours at 150 gpm, and about 39 hours at 200 gpm. The water level declined 47.5 feet during the period of pumping. The water level in well FL 299, 4,600 feet east of well FL 300, declined 4.5 feet; the water level in well FL 280, 1,600 feet southwest, declined 1.5 feet; and the water level in well FL 283, 5,200 feet southwest, declined 0.1 foot. Measurable declines did not occur in wells FL 281 (3,000 feet northwest of well FL 300), FL 290 (5,000 feet south), FL 292 (5,800 feet southwest), and FL 293 (6,000 feet southwest). The well in which the largest decline was measured is east of the test hole, which direction corresponds to the local orienta tion of major joints in the Niagara dolomite.
Test hole FL 302, 4,600 feet southeast of test hole FL 300, was completed in May 1956 at a depth of 210 feet. At this depth an open ing was found and water began to flow at a rate of 150 gpm. The test hole was pumped for successive 2-hour intervals at rates of 200, 275, and 350 gpm. The pumping rate was then increased to 400 gpm and the test continued for 24 hours more. By the end of the period of pumping the water level had declined to 39 feet below land surface, about 65 feet below the estimated static water level. The water level in well FL 283, 3,800 feet west of test hole FL 302, declined 42 feet; the water level in well FL 284, 3,500 feet west, declined 31 feet; and the water level in well FL 293, 6,100 feet west, declined 8 feet. After pumping stopped, the water level in test hole FL 302 recovered to 19 feet above the land surface, and water began to flow from cracks in the ground at a distance of several feet from the well. To prevent possible caving around the well, the valve was opened to allow the water to flow.
Test hole FL 303, 4,300 feet northwest of test hole FL 300, was drilled in July 1956. The water level in this test hole declined 32 feet during 24 hours of pumping at 100 gpm. The water level de clined about 1 foot in test hole FL 300, 4,300 feet southeast of test hole FL 303, and in well FL 304, 950 feet northeast of FL 303.
Ground water of economic importance in the Niagara dolomite is confined to solution ally enlarged openings along fractures and bedding planes. Wells that fail to intersect such openings yield only small amounts of water.
The pumping of test holes FL 300 and FL 302 showed the con trolling effect that the local east-west orientation of joints has on the movement of ground water. Water levels in wells east ard west of the test holes were affected more than were the water levels in wells to the north and south.
The results of the pumping tests on the test holes in th°, Niagara dolomite indicate that wells producing at least 200 gpm could be

GROUND WATER 41
developed in the area east of the Niagara escarpment. Because of the variability of the joints and fractures in the dolomite, te?t holes should be drilled through the full thickness of the Niagara prior to any large-scale development.
The Niagara dolomite in the test area is recharged by local pre cipitation. Recharge takes place most readily where the dolomite is near the land surface.
The extent of marshes in the area in 1910 is shown in figure 20. Subsequently the area was drained by ditches, and the extent of the marshes in 1955 is shown in figure 21. The draining is reported to have lowered the water table 5 to 15 feet and has decreased the poten tial amount of water available to recharge the dolomite.
Additional work is needed to determine the recharge to and dis charge from the Niagara dolomite.
SPECIFIC CAPACITY OF WELLS
The relation between the discharge and the resultant drawdown in water level in a pumped well is known as the specific capacity and is generally expressed in gallons per minute per foot of drawdown. For example, if a well is pumped at a rate of 1,000 gpm and the water level is thereby lowered 200 feet, the specific capacity of the well is 5 gpm per foot of drawdown. In a like manner, if the specific capacity of a well is 5 gpm per foot of drawdown, there is an implica tion that, within certain limits, the discharge of the well will be increased 5 gpm for every foot of increased drawdown.
The specific capacity of a well depends both on the coefficients of transmissibility and storage and on the construction and develop ment of the well. Specific capacities computed for the wells pumped during the aquifer tests at Fond du Lac and Ripon and in the Niagara dolomite and reported by well owners or well drillers for wells in other areas of the county are presented in table 3.

42 GEOLOGY, WATER RESOURCES, FOND DU LAC COUNTY, WIS.
R.18 E.
FIGURE 20. Map of Niagara dolomite test area showing extent of marshes in 1910.

GROUXD WATER
R.18 E.
43
FIGI-EK 21 Map of Niagara dolomite test area showing1 extent of marshes in 3955.

44 GEOLOGY, WATER RESOURCES, FOND DU LAC COUNTY, WIS.
TABLE 3. Specific capacity of wells in Fond, du Lac County, Wis.
'Geologic source of water: Cu, sandstones of Cambrian age; Ogp, Galena dolomite and Plat*<:ville formation; Osp, St. Peter sandstone; Sn, Niagara dolomite]
Well
12345
*67
*8*922
*242830
*31323440414243
*4849
*50*51
54555658
*59*117
135*300*302*303308309310
Geologic source of water
Osp, Cu- ----__---_----_-
Osp, Cu---- - -------Osp, Cu--_ - _ - -Osp, Cu-. _ ___Osp, Cu-------_-------_-Osp, Cu__ ___ Osp, Cu- Osp, Cu-- _ ._Cu Osp, Cu- ----------------
Osp - --
Osp, Cu- ----------------Osp____-. -------------Cu Ogp Osp-__- --------------- --Cu ---------Osp -- _Osp_-______--- --__--__--Cu - _ Osp, Cu- ----------------Cu - _______ Osp, Cu. ---_____--_ --__-Cu -- Cu __Osp, Cu_- -_ _.Osp-_--- ----------------Osp- - Sn. .-.----___-_-..-...-.Sn____ _ - __ __Sn._. .-___---__._..__. -Osp____-_-----_-___-__--Osp. --_----__-_______-..Osp-____----__--_-_____-
Drawdown (feet)
137234186872319262417383
12444923941311689623564
10216
1229120
1437431486532
590
191
Discharge (gpm)
3632799453637743005944729222675161004115086251659040
100500550300340635430
1,28023547338534020020040010060
300325
Specific capacity (gpm per foot)
284
00
20114
195
157713
127421669956
2710
324
356463
1239
*Data from aquifer test.
UTILIZATION OF WATER
Of the wells and springs inventoried, 169 supplied water for domestic and stock use, 78 for public use, and 34 for industrial use. The inventory included most of the industrial and public-supply wells, selected domestic and stock wells, and a few of the springs. The combined average daily pumpage from all wells in Fond du Lac County in 1957 is estimated at 10 million gallons.
DOMESTIC AND STOCK SUPPLIES
Most of the domestic and stock wrells listed are 6 inches or less in diameter, and they range in depth from 6 to 702 feet. T" XQ, domestic
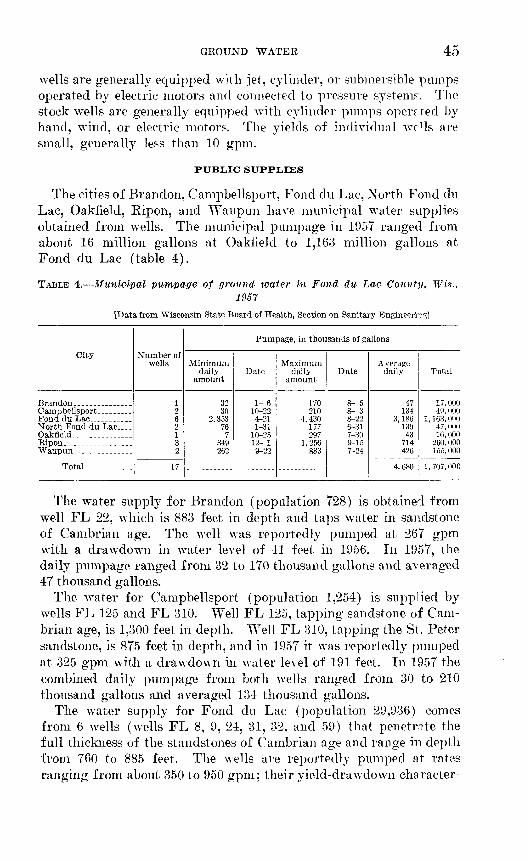
GROUND WATER 45
wells are generally equipped with jet, cylinder, or submersible pumps operated by electric motors and connected to pressure system?. The stock wells are generally equipped with cylinder pumps operated by hand, wind, or electric motors. The yields of individual we 1 Is are small, generally less than 10 gpm.
PUBLIC SUPPLIES
The cities of Brandon, Campbellsport, Fond du Lac, North Fond du Lac, Oakfield, Ripon, and Waupun have municipal water supplies obtained from wells. The municipal pumpage in 1957 ranged from about. 16 million gallons at Oakfield to 1,163 million gallons at Fond du Lac (table 4).
TABLE 4. Municipal pumpaffe of ground water in Fond du Lac County, Wis.,1957
[Data from Wisconsin State Board of Health, Section on Sanitary Engineerncc]
City
North Fond du Lac.,.. Oakfleld
Total... .-_--.._.
Number of wells
12 6 2 1 3 2
17
Pumpage, in thousands of gallons
Minimum daily
amount
32 30
2,353 76
7 349 262
Date
1- 6 10-22 4-21 1-31
10-25 12- 1 9-22
Maximum daily
amount
170 210
4,430 177 297
1,256 883
Date
8- 5 8- 3 8-22 6-31 7-30 9 157-24
Average daily
47 134
3, 186 130
43 714 426
4,680
Total
17,000 49, 000
1,163,000 47. 000 16, 000
260, 000 155,000
1,707,000
The water supply for Brandon (population 728) is obtained from well FL 22, which is 883 feet in depth and taps water in sandstone of Cambrian age. The well was reportedly pumped at 267 gpm with a drawdown in water level of 41 feet in 1956. In 1957, the daily pumpage ranged from 32 to 170 thousand gallons and averaged 47 thousand gallons.
The water for Campbellsport (population 1,254) is supplied by wells FL 125 and FL 310. Well FL 125, tapping sandstone of Cam brian age, is 1,300 feet in depth. Well FL 310, tapping the St. Peter sandstone, is 875 feet in depth, and in 1957 it was reportedly pumped at 325 gpm with a drawdown in wrater level of 191 feet. In 1957 the combined daily pumpage from both wrells ranged from 30 to 210 thousand gallons and averaged 134 thousand gallons.
The water supply for Fond du Lac (population 29,936) comes from 6 wells (wells FL 8, 9, 24, 31, 32, and 59) that penetrate the full thickness of the standstones of Cambrian age and range in depth from 760 to 885 feet. The wells are reportedly pumped at rates ranging from about 350 to 950 gpm; their yield-drawdown character-

46 GEOLOGY, WATER RESOURCES, FOND DU LAC COUNTY, WIS.
istics are given in table 3. In 1957 the total pumpage ranged from about 2.4 to 4.4 mgd and averaged 3.2 mgd.
The water for North Fond du Lac (population 2,291) is supplied by wells FL 43 and FL 309. Well FL 43, tapping sandstone of Cambrian age, is 655 feet in depth and is reportedly pumped at 500 gpm. Well FL 309, 367 feet deep, obtains water from the St. Peter sandstone and in 1956 was reportedly pumped rt 300 gpm with a drawdown in water level of 89.5 feet. In 1957 the daily pumpage ranged from 76 to 177 thousand gallons and averaged 130 thousand gallons.
The water supply for Oakfield (population 697) comes from well FL 47, which is 439 feet deep and obtains water from the St. Peter sandstone. The daily pumpage in 1957'ranged from 7 to 297 thousand gallons and averaged 43 thousand gallons.
Ripon (population 5,619) is supplied water by wells FL 15, FL 48, and FL 51. The wells range in depth from 185 to 490 feet and obtain water from sandstones of Cambrian and Ordovician ages. During an aquifer test in 1955, well FL 48 was pumped at 550 gpri and had a drawdown in water level of 62 feet, and well FL 51 was pumped at 635 gpm and had a drawdown of 102 feet. In 1957 the daily pumpage ranged from 349 to 1,256 thousand gallons and averaged 714 thousand gallons.
Waupun (population 1,998) is supplied by wells FL 14 and FL 23, 965 and 755 feet deep, which obtain water from the sandstones of Cambrian age. Well FL 14 was reported to yield 680 gpm. The daily pumpag-e in 1957 ranged from 262 to 883 thousand gallons and averaged 426 thousand gallons.
There are 39 schools in the rural areas of Fond du Lac County, all of which obtain their water supply from wells. Two of the wells draw from deposits of Pleistocene a<re, 8 from the Niagara dolomite, 23 from the Galena dolomite and Platteville formation, and 6 from the St. Peter sandstone. The yields of individual wells are small, as only small amounts of water are required,
INDUSTRIAL, SUPPLIES
The water used for industrial purposes in Fond du Lac County is ground water from public water supplies or from privately owned industrial wells. The largest industrial use of water is in the proc essing of dairy products and the processing and canning of food. There are 8 large and 18 small milk-processing plants and 6 canning plants in the county. It is estimated that the industrial use of ground water in Fond du Lac County in 1957 averaged about 3 mgd.

GROUND WATER 47
CHEMICAL CHARACTER OF WATER
Chemical analyses were made of samples of ground \vater from 52 selected wells and test holes and 2 springs in Fond du Lac County. The location of the wells, test holes and springs sampled is shown on plate 1. The analyses show the dissolved mineral content of the water but not the bacterial or sanitary quality.
As rain falls through the atmosphere it dissolves small amounts of gases and mineral matter. Upon reaching the ground it begins to dissolve minerals from the soil and rocks through which it moves. The amount and kind of dissolved mineral matter contained in ground water differ greatly from place to place as a result of many factors: such as, the type of organic material in the soil, the kind and amount of soluble mineral matter present in the rocks through and over which the water moves, the length of time the water is in contact with soil or rocks, and the temperature and pressure of the water. Some rocks contain readily soluble salts, and water in contact with th?m will become highly mineralized. Other rocks consist of relatively insolu ble minerals, and water in contact with them tend to dissclve only small amounts of mineral matter. Calcium, present in nearly all ground water, is dissolved from limestone, gypsum, dolomite, and other rocks containing calcium. Other constituents commonly found in ground water include sodium, potassium, magnesium, iron, manga nese, bicarbonate, sulfate, chloride, fluoride, nitrate, and silica.
The chemical character of water may restrict its use for munici pal, industrial, and domestic supply, or for irrigation. The stand ards of water quality for a particular purpose are not easily defined; however, the chemical character of water for municipal supplies is commonly judged by standards promulgated by the U.S. Public Health Service (1946) for water used by common carriers in interstate com merce. According to these standards, iron and manganese together should not exceed 0.3 ppm (part per million) ; magnesium, 125 ppm; chloride, 250 ppm; and sulfate, 250 ppm. Dissolved solids prefer ably should not exceed 500 ppm; although if water of such quality is not available, a dissolved solids content of as much as 1,000 ppm may be permitted. The average individual, however, can become adjusted to drinking water considerable higher in content of most of the constituents listed than the values specified in these standards.
Hardness is of primary importance and is generally recognized in water by its soap consuming properties or by deposits of insoluble salts formed when the water is heated or evaporated. Calcium and magnesium cause most of the hardness of natural waters. Other constituents also cause hardness, but they are generally present in such small quantities in most natural waters as to have little effect on hardness. Specific limits cannot be set for hardness, but wrater

48 GEOLOGY, WATER RESOURCES, FOND DU LAC COUNTY, WIS.
having a hardness of less than 60 ppm is generally considered soft. Water having a hardness of 61 to 120 ppm is rated as rioderately hard, but is usable for most purposes. Water whose hardness is 121 to 200 ppm is considered hard and softening is necessary for industries using soap. Water having a hardness of more than 200 ppm is considered very hard and generally requires softening before being satisfactory for most uses.
The hardness of the 54 samples of water collected in Fond du Lac County ranged from 55 to 598 ppm and averaged about 330 ppm. The water from most of the wells sampled is very hard; only 5 samples had a hardness of less than 200 ppm.
Iron is derived from practically all rocks and soils and is a com mon constituent in most natural waters. When iron or manganese is present in water in excess of 0.3 ppm, it will stain fabrics, utensils, and fixtures. If sufficient iron or manganese is present to give a disagreeable taste to water and to cause staining it can be removed by aeration and nitration. The iron content of the 54 samples of water ranged from 0 to 4.4 ppm and averaged about 1 ppm. Ten of the samples contained no iron, 7 contained 0.1 ppm of iron, 2 contained 0.2 ppm, 6 contained 0.3 ppm, 10 contained 0.4 to 1.0 ppm, and 19 contained more than 1.0 ppm.
Fluoride in drinking water in excess of 1.5 ppm may cause mottled enamel on children's teeth if the water is used during the period of calcification of the teeth that is. roughly during the first 6 to 8 years of life (Dean and others, 1942). The fluoride content of the 54 samples of water collected in Fond du Lac County ranged from less than 0.1 to 1.4 ppm and averaged 0.3 ppm.
The ground water in Fond du Lac County is very hard and in some areas it contains excessive iron, but otherwise it is satisfactory for most uses. The dissolved solids content of the 54 samples of water collected ranged from 256 to 1,060 ppm and averaged 455 ppm.
CONCLUSIONS AND RECOMMENDATIONS
Much of Fond du Lac County is underlain by thick sandstone beds of Cambrian and Ordovician ages. These supply most of the water now withdrawn by industrial and public-supply wells. The water in the sandstones is under artesian pressure, although the pressure head has declined in the vicinity of the city of Fond du Lac. Con solidated rocks of the Prairie du Chien group, the St. Peter sandstone, the Platteville formation and Galena dolomite, and the Niagara dolomite and unconsolidatecl deposits of Pleistocene age supply adequate water to most domestic and farm wells.
Recharge occurs throughout most of the county but is greatest in areas where the bedrock formations are near the surface. Essen tially all recharge is derived from local precipitation. It is estimated

CONCLUSIONS AND RECOMMENDATIONS 49
that the sandstones of Cambrian and Ordovician ages from which water is pumped by the city of Fond du Lac are recharged over an area of about 250 square miles.
If the distribution of wells and the rate of pumping, about 3.8 mgd, in the Fond du Lac area remain the same as they were in 1956, the water-level decline from 1956 to 1966 will be about 5 feet. If, however, the distribution of pumped wells remains the same but the amount of municipal pumpage by Fond du Lac increases at a uni form rate from 3 mgd in 1956 to 5 mgd in 1966, the water levels in 1966 will be at least 60 feet below the levels of 1956. Dispersal of wells so as to enlarge the area of withdrawal would lessen interfer ence between wells and thereby reduce the decline of water levels in wells near the center of the cone of depression. Dispersal of wells to the northwest, toward the recharge area, would be more effective in reducing water-level decline than dispersal in any other direction. The thinning of the sandstone over the structural high in the crystal line rocks in the southern part, of Fond du Lac makes locating of wells to the south and southwest less practical. Test holes should be drilled to determine the thickness of the aquifer and the availability of ground water in any specific locality where large-capacity wells are desired.
The results of pumping tests of wells in the Niagara dolomite indicate that wells producing at least 200 gpm could be developed in the area east of the Niagara escarpment. Because of the variability of water-bearing openings in the dolomite, test holes should be drilled prior to any large-scale development. Additional studies are needed to determine the quantity of water that may be available f ̂ om the Niagara dolomite. The springs and streams issuing from the Niag ara escarpment should be studied with regard to amount of flow, quality, source, and temperature.
It is recommended that water-level measurements in wells tapping sandstones of Cambrian and Ordovician ages and the Niagara dolo mite in Fond du Lac County be continued. These measurements are necessary to determine water-level trends and the declines of water level that will result from additional development. Data or pump- age should continue to be collected and correlated with changes in water levels.
The results of studies to January 1957 lead to the general conclu sion that ample ground water is available to meet foreseeable future needs in Fond du Lac County, provided that pumped wells are dis persed sufficiently that excessive local declines in water level can be avoided. Whether such dispersal is economically feasible in compari son with other means for obtaining water to meet future increased needs is an economic question that is beyond the scope of this investigation.

50 GEOLOGY, WATER RESOURCES, FOND DU LAC COUNTY, WIS.
REFERENCES
Alden, W. C., 1918, The Quaternary geology of southeastern Wisconsin: U.S.Geol. Survey Prof. Paper 106, 356 p.
Bean, E. F., 1949, Geologic map of Wisconsin: Wisconsin Geol. and Nat. HistorySurvey.
Birge, E. A., and Juday, Chancey, 1914, The inland lakes of Wisconsin: Wis consin Geol. and Nat. History Survey Bull. 27, p. 96-98.
Chamberlin, T. C., 1877, Geology of eastern Wisconsin, in Geology of Wisconsin:Wisconsin Geol. and Nat. History Survey, v. 2, pt. 2, p. 93 405.
Darton, N. H., 1905, Preliminary list of deep borings in the United States:U.S. Geol. Survey Water-Supply Paper 149, 175 p.
Dean, H. T., Arnold, F. A., Elvove, Elias. Jolmston, D. C., and Short, E. M., 1942,Domestic water and dental caries: U.S. Public Health Repts., v. 57, no. 32,p. 1176-1177.
Drescher, W. J., 1956, Ground water in Wisconsin: Wisconsin Geol. SurveyInf. Circ. 3, 36 p.
Ferris, J. G., 1948, Ground-water hydraulics as a geophysical aic1 : MichiganDept. Conserv., Geol. Survey Div. Tech. Kept. 1, 12 p.
Kirchoffer, W. G., 1905, The sources of water supply in Wisconsin: WisconsinUniv. Bull. 106, Eng. Ser., v. 3, no. 2, p. 163-249.
Martin, Lawrence, 1932. The physical geography of Wisconsin: Wisconsin Geol.and Nat. History Survey Bull. 36. 446 p.
Meinzer, O. E., 1923a. The occurrence of ground water in the United States,with a discussion of principles: U.S. Geol. Survey Water-Supply Paper 489,321 p.
1923b, Outline of ground-water hydrology, with definitions: U.S. Geol. Survey Water-Supply Paper 494, 71 p.
ed., 1942, Hydrology, pt. 9 of Physics of the earth; New York, McGraw-Hill Book Co., Inc., p. 385-477.
Spicer, H. C., 1950, Investigation of bedrock depths by electrical-resistivity meth ods in the Rlpon-Fond du Lac area, Wisconsin: U.S. Geol. Survey Circ.69, 37 p.
Theis, C. V., 1935, The relation between the lowering of the piezometric surfaceand the rate and duration of discharge of a well using ground-waterstorage : Am. Geophys. Union Trans. p. 519-524.
Thwaites, F. T., 1923, The Paleozoic rocks found in deep wells in Wisconsinand northern Illinois : Jour. Geology, v. 31, p. 529-555.
1940, Buried pre-Cambrian of Wisconsin: Wisconsin Acad. Sci., Arts,and Letters Trans., v. 32, p. 233-242.
Trowbridge, A. C. and Atwater, G. I., 1934, Stratigraphic problems in the upperMississippi valley : Geol. Soc. America Bull. v. 45, p. 21-80.
United States Public Health Service, 1946, Drinking water standards: PublicHealth Repts., v. 61, no. 11, p. 371-384, Repr. 2697.
Weidman, Samuel, and Schultz, A. R., 1915, The underground and surfacewater supplies of Wisconsin: Wisconsin Geol. and Nat. History SurveyBull. 35, p. 330-343.
Whitson, A. R., and others, 1914, Soil survey of Fond du Lac Courty, Wiscon sin : Wisconsin Geol. and Nat. History Survey Bull. 37, Soil Ser. no. 7, 85 p.
Wisconsin State Board of Health, Bureau of Sanitary Engineering, 1935, Publicwater supplies of Wisconsin : Madison, Wis., 31 p.

REFERENCES 51
Wisconsin State Department of Agriculture, 1952, Fond du Lac County agricul ture : County Agr. Statistics Ser.. 62 p.
Woollard, G. P., and Hanson, G. F., 1954, Geophysical methods applied to geologic problems in Wisconsin: Wisconsin Geol. Survey Bull. 78, !?ci. Ser. no. 15, p. 68-78.

52 REFERENCES
Newport, Thomas Gwynn, 1922-Geology and ground-water resources of Fond du Lac
County, Wisconsin. Washington, U.S. Govt. Print. Off., 1962.
iv, 51 p. illus., maps (part col., part in pocket) diagrs., tables. 25 cm. (U.S. Geological Survey. Water-supply paper 1604)
Prepared in cooperation with the Geological and Natural History Survey, University of Wisconsin, and the city of Fond c'u Lac.
Bibliography: p. 50-51.
1.Geology Wisconsin Fond du Lac Co. 2.Water, Underground Wisconsin Fond du Lac Co. 3.Water-supply Wisconsin Fond du Lac Co. I.Wisconsin. Geological and Natural History Survey. II.Title : Fond du Lac County, Wisconsin.
(Series)
U.S. GOVERNMENT PRINTING OFFICE: 1962 O 604855

UNITED STATES DEPARTMENT OF THE INTERIOR GEOLOGICAL SURVEY
WATER-SUPPLY PAPER 1604 PLATE 1
ALUMET_COUNTY~
O169 0 140
Rosendale Center /'"" " >
'
', St Cloud JMount I. Calvary
77 ' North ^ Fond du Lac/ /
West Rosendale,
Peebles O 188
4£^ >&
0249 6?0\ ̂ 207 ^
L227 L323 226IS ^^ N^
£)254 -
O" O222
1^r , /i-r N -Ledar / /s /Oak ..^29Center (O;
DODGE COUNT
Caraphellsport tEXPLANATION
MauthLake
* 279Cb278 299Dg Dodge County
Wi Winnebago County
GL Green Lake County
- ^'^,1 "" --XA250
I
^-"x
WISCONSIN
-V. ___v* Fond du Lac
1 CountyX
(
"~ X
V̂7 / 44
^ /
iINSET OF WELLS
50 100 MILES
O194 St Killianf""\ _ __ __^J~~ R. 18 E. WASHINGTON COUNTY R. 19 E.
INTERIOR GEOLOGICAL SURVEY, WASHINGTON, D. C. 1O461
Base compiled from maps of the State Highway Commission of Wisconsin and field notes
MAP OF FOND DU LAC COUNTY, WISCONSIN, SHOWING LOCATION OF WELLS, TEST HOLES, AND SPRINGS5 MILES
J
DATUM IS MEAN SEA LEVEL

UNITED STATES DEPARTMENT OF THE INTERIOR GEOLOGICAL SURVEY
WATER-SUPPLY PAPER 1604 PLATE 2
WINNEBAGO COUNTY
R. 16 E
EXPLANATION
ContactDashed where inferred
WASHINGTON COUNTY R.19 E.
INTERIOR GEOLOGICAL SURVEY. WASHINGTON. D. C. 1O461
Base compiled from maps of the State Highway Commission of Wisconsin and field notes
Modified from Geologic Map of Wisconsin, E. F. Bean (1949)
MAP OF FOND DU LAC COUNTY, WISCONSIN, SHOWING BEDROCK GEOLOGY
5 MILES
DATUM IS MEAN SEA LEVEL

UNITED STATES DEPARTMENT OF THE INTERIOR GEOLOGICAL SURVEY
WATER-SUPPLY PAPER 1604PLATE 3 A'
FEET
1200
1000
800
600
400
200
SEA LEVEL
200
400
FAIRWATER CAMBELLSPORT
INDEX MAP SHOWING LOCATION OF WELLS IN SECTIONX-A'
SECT ION A-A'
FEET
1200
1000
800'
600
400
200
SEA LEVEL
200
I 400
B
FEET
1000
800
600
400
200
SEA LEVEL
200
400
o-Co .m «£ > co ix
^ o WAUPUN o CE
City of Fond du Lac
15O
Precambrian crystallinerocks
/
\
'/\
XT
\1 v-
1 V-\\
-
^- :
\\
St. Peter sandstone
Prairie
SECTIONS -B'
PIPE
Galena dolomite and Platteville formation
du Chien group
Trempealeau formation
Franconia sandstone
Galesville sandstone
221 .^' 271 Fond du Lac County
Dg 53 B
INDEX MAP SHOWING LOCATION OF WELLS IN SECTION B-B'
B'
FEET
1000
800
600
400
200
SEA LEVEL
200
400
MOUNT CALVARY
C
FEET
1000
800
600
400
200
SEA LEVEL
200
400 '
RIPON
15 \._ 55 s,212 76" rr\\;'7"<r~'
37
5 10 MILES
Fond du Lac County
City of Fond du Lac
INDEX MAP SHOWING LOCATION OF WELLS IN SECTION C-C'
\
" X^
" \^" ^\
" \ *^'
" \
\
\
\
St sarSt. Peter sandstone
ID i Pleistocene deposits
SECTION C-C'
^^
f'cv
FEET
1000
800
600
400
200
SEA LEVEL
200
400
STRATIGRAPHIC SECTIONS FROM FAIRWATER TO CAMPBELLSPORT, WAUPUN TO PIPE, AND RIPON TO MOUNT CALVARY, WISCONSIN
1 0 5 MILES I ... I I I I I I
604855 O -6Z (In Pocket)

UNITED STATES DEPARTMENT OF THE INTERIOR GEOLOGICAL SURVEY
WATER-SUPPLY PAPER 1604 PLATE 4
CALUMET COUNTY
Caiunretvifle
;GL 19
840.
ALTITUDE 747 FEET
Wi 40 WINNEBAGO COUNTY O s<94
Rush Lalce/
X
773 I/"AVandyne '
losendaleCenter ('
233_ c 05- 135
Mount Calvary
Armstrong O>-> IO
Kettle MoraineLake
O17-
872Wan pun ;
DODGE COUNTY
EXPLANATION Pr°spect,A Forest
Campbellsport221 Q 873
WellGL
Green Lake CountyContour drawn on the piezometric surface in August 1956. Dashed where inferred. Con tour interval 20 feet
Man the \ Lake
256 ^935
SpringUpper figure /s well or spring
number; lower figure /s altitude of piezometric surface, in feet
Wi Winnebago County
Niagara escarpment
Ground-water divide
St Killian
R. 18 F WASHINGTON COUNTY R.19 E.
INTERIOR GEOLOGICAL SURVEY. WASHINGTON, D C. 1O461
Base compiled from maps of the State Highway Commission of Wisconsin and field notes
MAP OF FOND DU LAC COUNTY, WISCONSIN, SHOWING PIEZOMETRIC SURFACE OF WATER IN THE CAMBRIANAND ORDOVICIAN ROCKS IN THE AREA WEST OF THE NIAGARA ESCARPMENT
5 MILESJ
DATUM IS MEAN SEA LEVEL

UNITED STATES DEPARTMENT OF THE INTERIOR GEOLOGICAL SURVEY
WATER-SUPPLY PAPER 1604 PLATE 5
CALUMET COUNTY
WINNEBAGO COUNTY
RosendakCenter' /"'
,, North Fond du La
West Rosendaie, \
Taycheedah315-T o V 910+
FONO DU LAC
Dotyville 298Q
149 Armstrong1032 6) r^^ ic
Lake ( 3/\\l028
Kettle Moraine. South
014- rt iQ Byron 1
DODGE COUNTY
EXPLANATION
Campbellsport_
129 i/ 02 7' -270
O/O32
Contour drawn on thepiezometric surface inAugust 1956. Contour
interval 20 feet
Mauthe\ Lake
^Spring
Upper figure /s well or spring number; lower figure /s altitude of piezometric surface, in feet
Niagara escarpment
...251o975/'
.Ground-water divide
WASHINGTON COUNTY R.19 E.
INTERIOR GEOLOGICAL SURVEY, WASHINGTON. D. C. 1O461
Base compiled from maps of the State Highway Commission of Wisconsin and field notes
MAP OF FOND DU LAC COUNTY, WISCONSIN, SHOWING PIEZOMETRIC SURFACE OF WATER IN THE NIAGARA DOLOMITE IN THE AREA EAST OF THE NIAGARA ESCARPMENT
i oI . , , i i____ i
5 MILES J
DATUM IS MEAN SEA LEVEL