generated by plan4learning.com 1 of 32 october 11, 2021 9
TRANSCRIPT

Fort Worth Independent School District
005 P.L Dunbar High School
2021-2022 Campus Improvement PlanAccountability Rating: Not Rated: Declared State of Disaster
005 P.L Dunbar High SchoolGenerated by Plan4Learning.com 1 of 32
Campus #220905005October 11, 2021 9:55 AM
Mission StatementFORT WORTH ISD
Preparing ALL students for success in college, career, and community leadership
PAUL LAURENCE DUNBAR HIGH SCHOOL
To build an inclusive school community focused on a collaborative culture with engaging curriculum to support student success
VisionTo instill "Wildcat Pride" while creating independent thinkers who are socially and academically ready for the future.
Value StatementCollaborative Action
Systems - Accountability - Support
Culture and Climate
Sense of community - School spirit - Safe learning environment
Curriculum
Literacy - Instruction - Technology
005 P.L Dunbar High SchoolGenerated by Plan4Learning.com 2 of 32
Campus #220905005October 11, 2021 9:55 AM

Table of Contents
Comprehensive Needs Assessment 4Demographics 4Student Learning 4School Processes & Programs 6Perceptions 7
Priority Problem Statements 9Comprehensive Needs Assessment Data Documentation 10Goals 13
Goal 1: Early Literacy Increase the percentage of 3rd grade students who score at meets grade level or above on STAAR Reading from 34% to 47% by August 2024. 14Goal 2: Early Math Increase the percentage of 3rd grade students who score at meets grade level or above on STAAR Mathematics from 34% to 45% by August 2024. 17Goal 3: CCMR Increase the percentage of students graduating with a CCMR indicator from 43% to 48% by June 2024. 19Goal 4: Learning Environment (based on the BOE constraints) Ensure all students have access to a safe, supportive and culturally responsive learning environment. 23
Plan Notes 28Site-Based Decision Making Committee 29Campus Funding Summary 30
005 P.L Dunbar High SchoolGenerated by Plan4Learning.com 3 of 32
Campus #220905005October 11, 2021 9:55 AM

Comprehensive Needs AssessmentDemographics
Demographics Summary
Paul Laurence Dunbar High School is a Title I campus serving 900 students in grades 9-12. The campus student demographics are: African American66.1%, Hispanic 30.4%, White 1.3%, American Indian 0.3%, and Two or more races 1.8%. Males comprise 50.6% of the student population and females49.4%. According to the school report card Dunbar High School has a 26.3% mobility rate.
Paul Laurence Dunbar High School students are: 87.9% Economically Disadvantaged, 16.6% English Language Learners , 11.8% Special Education
Paul Laurence Dunbar High School staff is comprised of 102.6 professionals. This includes 4% school administrators, 67.6% full-time teachers, 25.1%professional support, 1 librarian, 1 school interventionist and 4 counselors.
Demographics Strengths
Paul Laurence Dunbar High School has strong community partnership with the likes of Bell Flight, Witherite Law Group, Texas Christian University,Texas Wesleyan University, and Tarrant County College.
For the 2017-2018 school year the daily average attendance was 90.8%.
For the 2018-2019 school year the daily average attendance was 91.5%.
For the 2019-2020 school year the daily average attendance was 92.6%
Due to COVID-19 restrictions and most students attending school virtually the daily average attendance has fallen to 88.6%
Problem Statements Identifying Demographics Needs
Problem Statement 1 (Prioritized): On the 2020-21 panoramic teacher survey, only 50% of teachers indicated they can help the most difficult students learn. Root Cause:Teachers have not recently received professional development on providing interventions to support students with challenging characteristics.
005 P.L Dunbar High SchoolGenerated by Plan4Learning.com 4 of 32
Campus #220905005October 11, 2021 9:55 AM
Student Learning
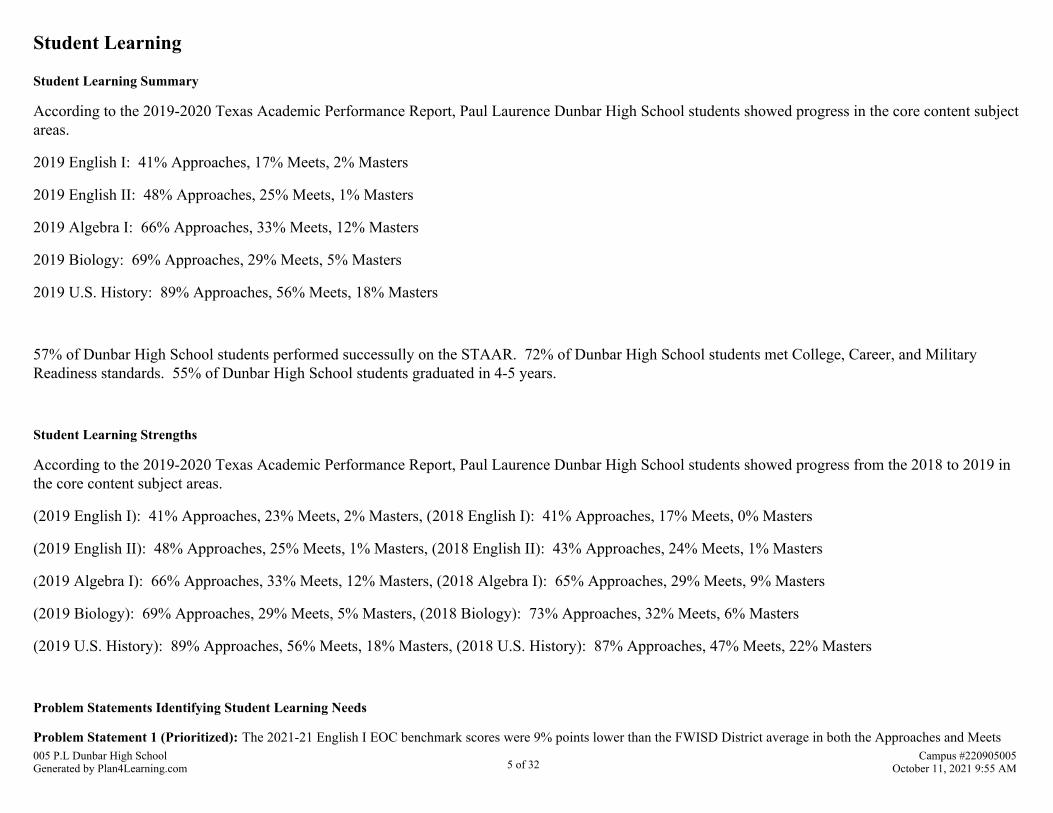
Student Learning Summary
According to the 2019-2020 Texas Academic Performance Report, Paul Laurence Dunbar High School students showed progress in the core content subjectareas.
2019 English I: 41% Approaches, 17% Meets, 2% Masters
2019 English II: 48% Approaches, 25% Meets, 1% Masters
2019 Algebra I: 66% Approaches, 33% Meets, 12% Masters
2019 Biology: 69% Approaches, 29% Meets, 5% Masters
2019 U.S. History: 89% Approaches, 56% Meets, 18% Masters
57% of Dunbar High School students performed successully on the STAAR. 72% of Dunbar High School students met College, Career, and MilitaryReadiness standards. 55% of Dunbar High School students graduated in 4-5 years.
Student Learning Strengths
According to the 2019-2020 Texas Academic Performance Report, Paul Laurence Dunbar High School students showed progress from the 2018 to 2019 inthe core content subject areas.
(2019 English I): 41% Approaches, 23% Meets, 2% Masters, (2018 English I): 41% Approaches, 17% Meets, 0% Masters
(2019 English II): 48% Approaches, 25% Meets, 1% Masters, (2018 English II): 43% Approaches, 24% Meets, 1% Masters
(2019 Algebra I): 66% Approaches, 33% Meets, 12% Masters, (2018 Algebra I): 65% Approaches, 29% Meets, 9% Masters
(2019 Biology): 69% Approaches, 29% Meets, 5% Masters, (2018 Biology): 73% Approaches, 32% Meets, 6% Masters
(2019 U.S. History): 89% Approaches, 56% Meets, 18% Masters, (2018 U.S. History): 87% Approaches, 47% Meets, 22% Masters
Problem Statements Identifying Student Learning Needs
Problem Statement 1 (Prioritized): The 2021-21 English I EOC benchmark scores were 9% points lower than the FWISD District average in both the Approaches and Meets005 P.L Dunbar High SchoolGenerated by Plan4Learning.com 5 of 32
Campus #220905005October 11, 2021 9:55 AM

category. Root Cause: Teachers need to be equipped with additional interventions to support students who are not reading and writing on grade-level.
005 P.L Dunbar High SchoolGenerated by Plan4Learning.com 6 of 32
Campus #220905005October 11, 2021 9:55 AM
School Processes & Programs
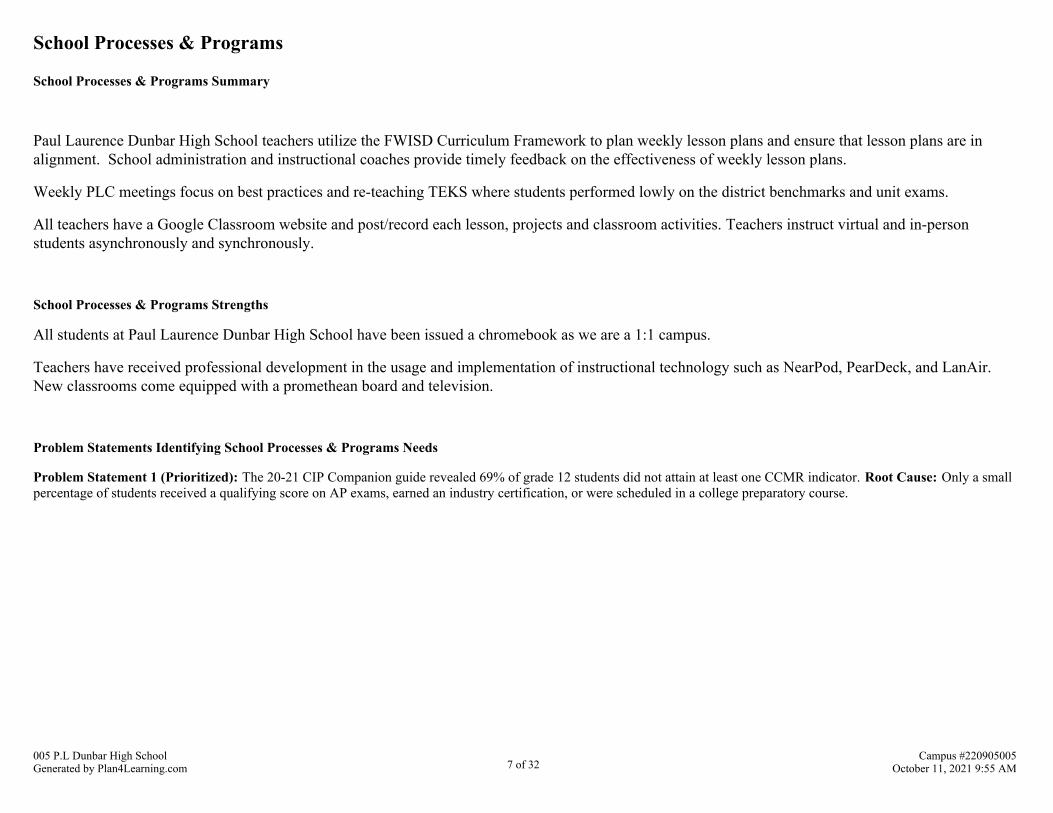
School Processes & Programs Summary
Paul Laurence Dunbar High School teachers utilize the FWISD Curriculum Framework to plan weekly lesson plans and ensure that lesson plans are inalignment. School administration and instructional coaches provide timely feedback on the effectiveness of weekly lesson plans.
Weekly PLC meetings focus on best practices and re-teaching TEKS where students performed lowly on the district benchmarks and unit exams.
All teachers have a Google Classroom website and post/record each lesson, projects and classroom activities. Teachers instruct virtual and in-personstudents asynchronously and synchronously.
School Processes & Programs Strengths
All students at Paul Laurence Dunbar High School have been issued a chromebook as we are a 1:1 campus.
Teachers have received professional development in the usage and implementation of instructional technology such as NearPod, PearDeck, and LanAir. New classrooms come equipped with a promethean board and television.
Problem Statements Identifying School Processes & Programs Needs
Problem Statement 1 (Prioritized): The 20-21 CIP Companion guide revealed 69% of grade 12 students did not attain at least one CCMR indicator. Root Cause: Only a smallpercentage of students received a qualifying score on AP exams, earned an industry certification, or were scheduled in a college preparatory course.
005 P.L Dunbar High SchoolGenerated by Plan4Learning.com 7 of 32
Campus #220905005October 11, 2021 9:55 AM
Perceptions
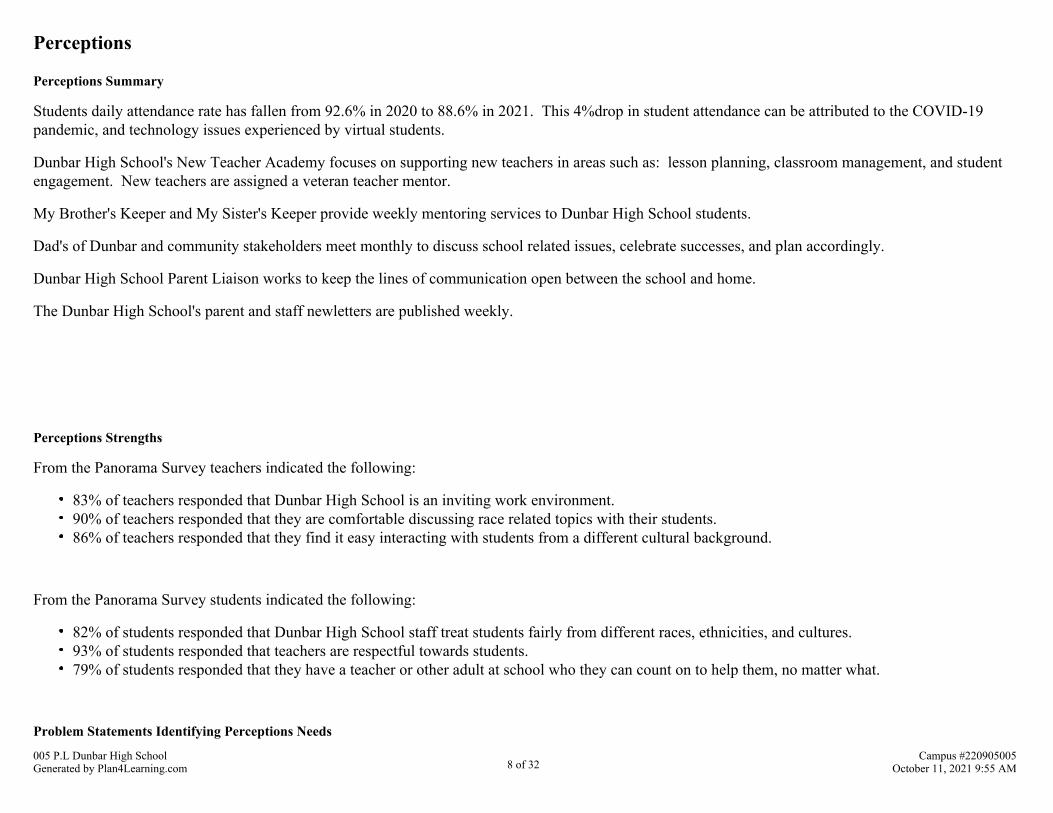
Perceptions Summary
Students daily attendance rate has fallen from 92.6% in 2020 to 88.6% in 2021. This 4%drop in student attendance can be attributed to the COVID-19pandemic, and technology issues experienced by virtual students.
Dunbar High School's New Teacher Academy focuses on supporting new teachers in areas such as: lesson planning, classroom management, and studentengagement. New teachers are assigned a veteran teacher mentor.
My Brother's Keeper and My Sister's Keeper provide weekly mentoring services to Dunbar High School students.
Dad's of Dunbar and community stakeholders meet monthly to discuss school related issues, celebrate successes, and plan accordingly.
Dunbar High School Parent Liaison works to keep the lines of communication open between the school and home.
The Dunbar High School's parent and staff newletters are published weekly.
Perceptions Strengths
From the Panorama Survey teachers indicated the following:
83% of teachers responded that Dunbar High School is an inviting work environment.90% of teachers responded that they are comfortable discussing race related topics with their students.86% of teachers responded that they find it easy interacting with students from a different cultural background.
From the Panorama Survey students indicated the following:
82% of students responded that Dunbar High School staff treat students fairly from different races, ethnicities, and cultures.93% of students responded that teachers are respectful towards students.79% of students responded that they have a teacher or other adult at school who they can count on to help them, no matter what.
Problem Statements Identifying Perceptions Needs
005 P.L Dunbar High SchoolGenerated by Plan4Learning.com 8 of 32
Campus #220905005October 11, 2021 9:55 AM
Problem Statement 1 (Prioritized): According to the 2020-21 Panorama Student SEL survey, 575 students responded that they 'mattered a little bit' or 'not at all' under thecategory, Sense of Belonging. Root Cause: Due to the pandemic, there is a lack of connectivity between students to student, student to campus staff, and reduced opportunitiesfor social-emotional learning.
005 P.L Dunbar High SchoolGenerated by Plan4Learning.com 9 of 32
Campus #220905005October 11, 2021 9:55 AM
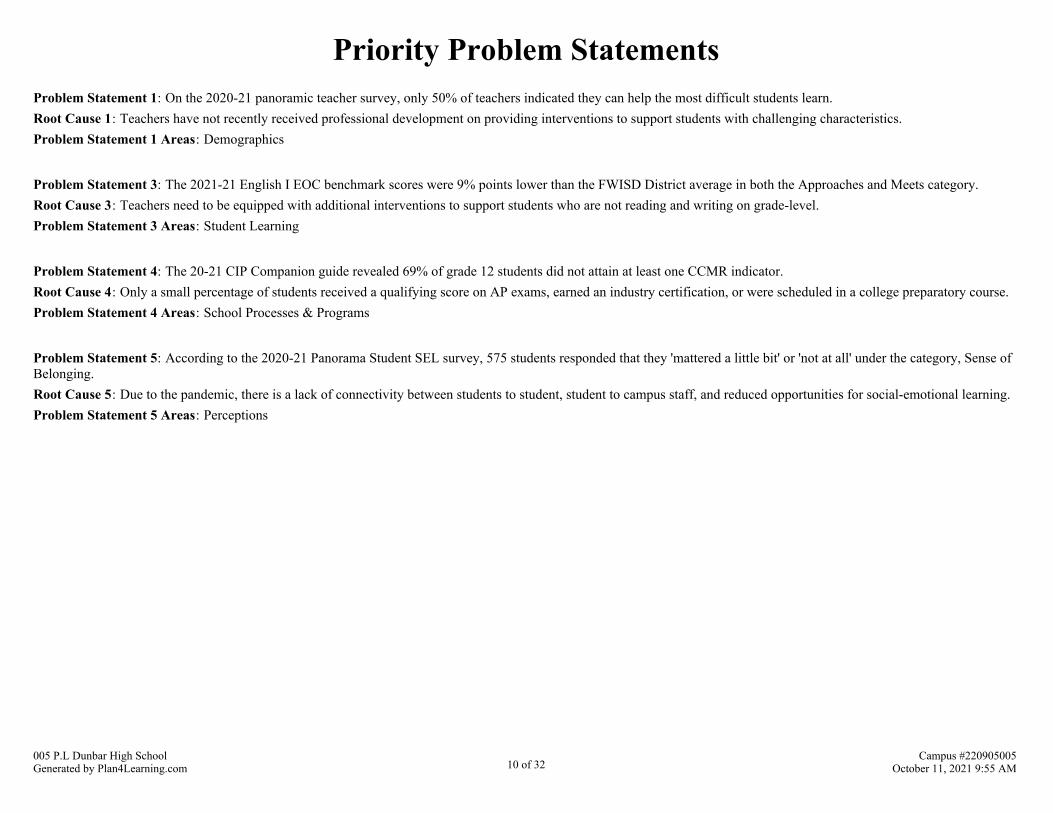
Priority Problem StatementsProblem Statement 1: On the 2020-21 panoramic teacher survey, only 50% of teachers indicated they can help the most difficult students learn.Root Cause 1: Teachers have not recently received professional development on providing interventions to support students with challenging characteristics.Problem Statement 1 Areas: Demographics
Problem Statement 3: The 2021-21 English I EOC benchmark scores were 9% points lower than the FWISD District average in both the Approaches and Meets category.Root Cause 3: Teachers need to be equipped with additional interventions to support students who are not reading and writing on grade-level.Problem Statement 3 Areas: Student Learning
Problem Statement 4: The 20-21 CIP Companion guide revealed 69% of grade 12 students did not attain at least one CCMR indicator.Root Cause 4: Only a small percentage of students received a qualifying score on AP exams, earned an industry certification, or were scheduled in a college preparatory course.Problem Statement 4 Areas: School Processes & Programs
Problem Statement 5: According to the 2020-21 Panorama Student SEL survey, 575 students responded that they 'mattered a little bit' or 'not at all' under the category, Sense ofBelonging.Root Cause 5: Due to the pandemic, there is a lack of connectivity between students to student, student to campus staff, and reduced opportunities for social-emotional learning.Problem Statement 5 Areas: Perceptions
005 P.L Dunbar High SchoolGenerated by Plan4Learning.com 10 of 32
Campus #220905005October 11, 2021 9:55 AM
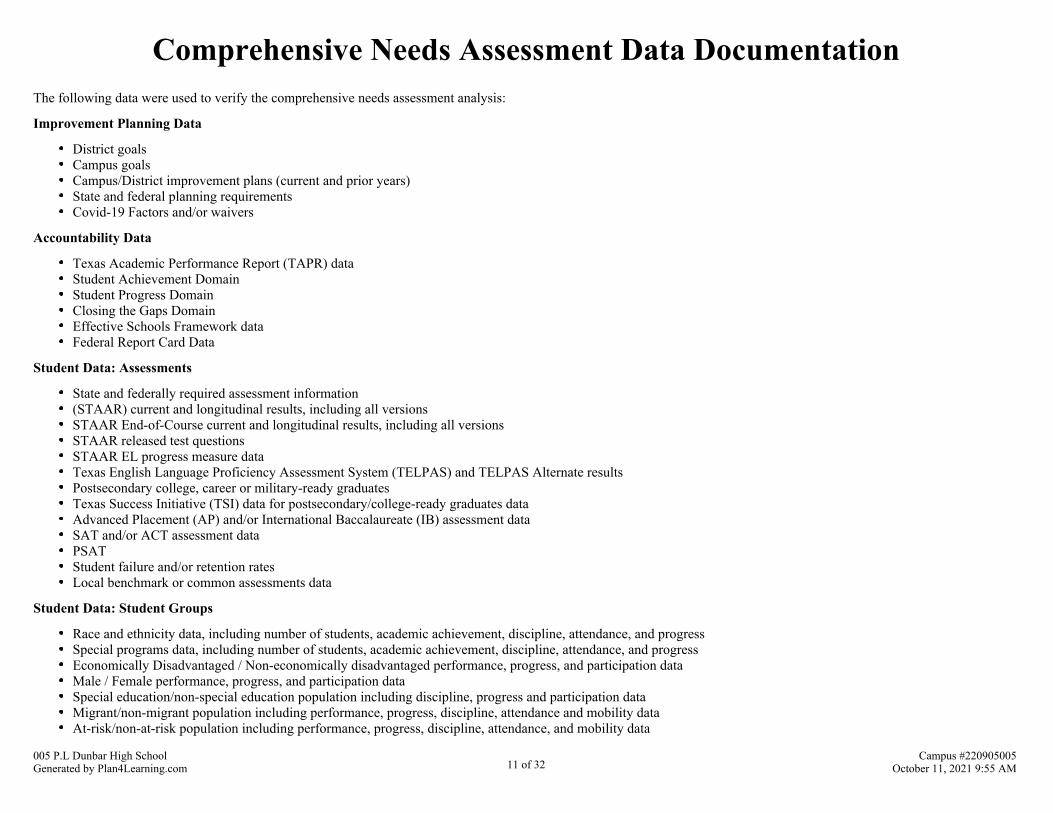
Comprehensive Needs Assessment Data DocumentationThe following data were used to verify the comprehensive needs assessment analysis:
Improvement Planning Data
District goalsCampus goalsCampus/District improvement plans (current and prior years)State and federal planning requirementsCovid-19 Factors and/or waivers
Accountability Data
Texas Academic Performance Report (TAPR) dataStudent Achievement DomainStudent Progress DomainClosing the Gaps DomainEffective Schools Framework dataFederal Report Card Data
Student Data: Assessments
State and federally required assessment information(STAAR) current and longitudinal results, including all versionsSTAAR End-of-Course current and longitudinal results, including all versionsSTAAR released test questionsSTAAR EL progress measure dataTexas English Language Proficiency Assessment System (TELPAS) and TELPAS Alternate resultsPostsecondary college, career or military-ready graduatesTexas Success Initiative (TSI) data for postsecondary/college-ready graduates dataAdvanced Placement (AP) and/or International Baccalaureate (IB) assessment dataSAT and/or ACT assessment dataPSATStudent failure and/or retention ratesLocal benchmark or common assessments data
Student Data: Student Groups
Race and ethnicity data, including number of students, academic achievement, discipline, attendance, and progressSpecial programs data, including number of students, academic achievement, discipline, attendance, and progressEconomically Disadvantaged / Non-economically disadvantaged performance, progress, and participation dataMale / Female performance, progress, and participation dataSpecial education/non-special education population including discipline, progress and participation dataMigrant/non-migrant population including performance, progress, discipline, attendance and mobility dataAt-risk/non-at-risk population including performance, progress, discipline, attendance, and mobility data
005 P.L Dunbar High SchoolGenerated by Plan4Learning.com 11 of 32
Campus #220905005October 11, 2021 9:55 AM

EL/non-EL or LEP data, including academic achievement, progress, support and accommodation needs, race, ethnicity, gender, etc.Career and Technical Education (CTE) data, including coherent sequence coursework, program growth and student achievement by race, ethnicity, gender, etc.Section 504 dataHomeless dataGifted and talented dataDyslexia DataResponse to Intervention (RtI) student achievement dataDual-credit and/or college prep course completion dataPregnancy and related services data
Student Data: Behavior and Other Indicators
Completion rates and/or graduation rates dataAnnual dropout rate dataAttendance dataMobility rate, including longitudinal dataDiscipline recordsStudent surveys and/or other feedbackClass size averages by grade and subjectSchool safety dataEnrollment trends
Employee Data
Professional learning communities (PLC) dataStaff surveys and/or other feedbackTeacher/Student RatioState certified and high quality staff dataCampus leadership dataCampus department and/or faculty meeting discussions and dataProfessional development needs assessment dataEvaluation(s) of professional development implementation and impactEquity dataTTESS dataT-PESS data
Parent/Community Data
Parent surveys and/or other feedbackParent engagement rateCommunity surveys and/or other feedback
Support Systems and Other Data
Organizational structure dataProcesses and procedures for teaching and learning, including program implementationCommunications dataCapacity and resources data
005 P.L Dunbar High SchoolGenerated by Plan4Learning.com 12 of 32
Campus #220905005October 11, 2021 9:55 AM

Budgets/entitlements and expenditures dataStudy of best practicesAction research results
005 P.L Dunbar High SchoolGenerated by Plan4Learning.com 13 of 32
Campus #220905005October 11, 2021 9:55 AM
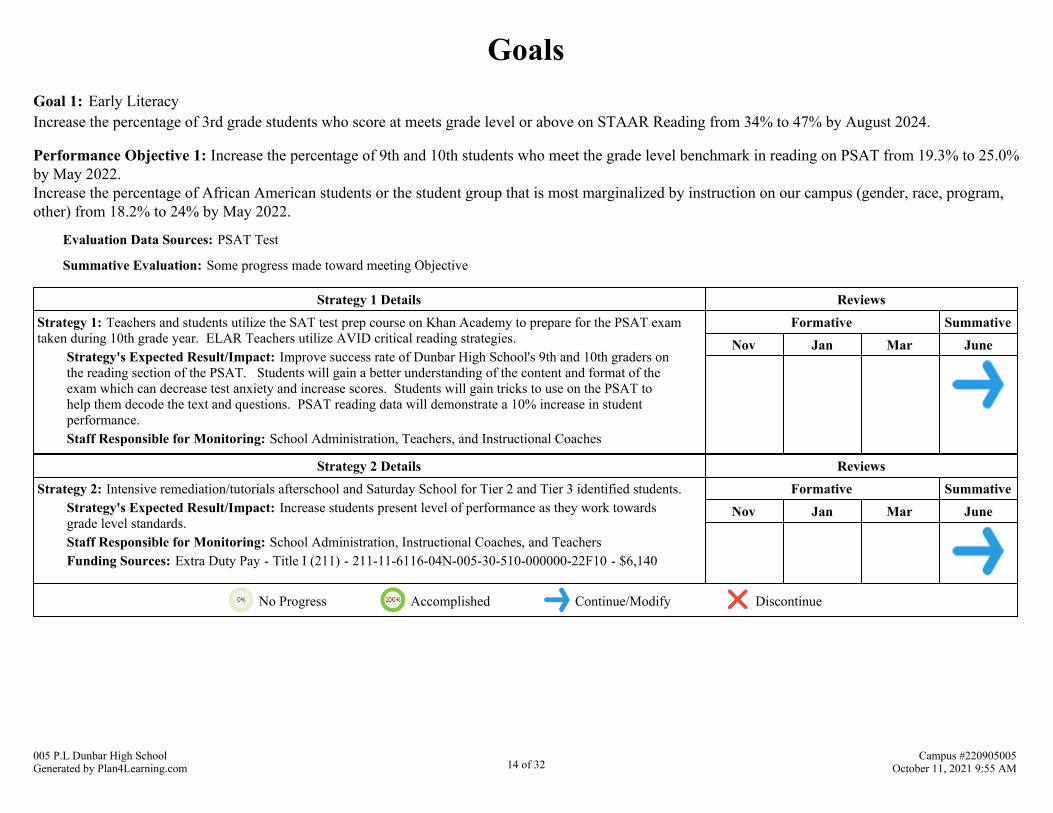
GoalsGoal 1: Early LiteracyIncrease the percentage of 3rd grade students who score at meets grade level or above on STAAR Reading from 34% to 47% by August 2024.
Performance Objective 1: Increase the percentage of 9th and 10th students who meet the grade level benchmark in reading on PSAT from 19.3% to 25.0%by May 2022. Increase the percentage of African American students or the student group that is most marginalized by instruction on our campus (gender, race, program,other) from 18.2% to 24% by May 2022.
Evaluation Data Sources: PSAT Test
Summative Evaluation: Some progress made toward meeting Objective
Strategy 1 Details ReviewsStrategy 1: Teachers and students utilize the SAT test prep course on Khan Academy to prepare for the PSAT examtaken during 10th grade year. ELAR Teachers utilize AVID critical reading strategies.
Strategy's Expected Result/Impact: Improve success rate of Dunbar High School's 9th and 10th graders onthe reading section of the PSAT. Students will gain a better understanding of the content and format of theexam which can decrease test anxiety and increase scores. Students will gain tricks to use on the PSAT tohelp them decode the text and questions. PSAT reading data will demonstrate a 10% increase in studentperformance.Staff Responsible for Monitoring: School Administration, Teachers, and Instructional Coaches
Formative SummativeNov Jan Mar June
Strategy 2 Details ReviewsStrategy 2: Intensive remediation/tutorials afterschool and Saturday School for Tier 2 and Tier 3 identified students.
Strategy's Expected Result/Impact: Increase students present level of performance as they work towardsgrade level standards.Staff Responsible for Monitoring: School Administration, Instructional Coaches, and TeachersFunding Sources: Extra Duty Pay - Title I (211) - 211-11-6116-04N-005-30-510-000000-22F10 - $6,140
Formative SummativeNov Jan Mar June
No Progress Accomplished Continue/Modify Discontinue
005 P.L Dunbar High SchoolGenerated by Plan4Learning.com 14 of 32
Campus #220905005October 11, 2021 9:55 AM
Goal 1: Early LiteracyIncrease the percentage of 3rd grade students who score at meets grade level or above on STAAR Reading from 34% to 47% by August 2024.
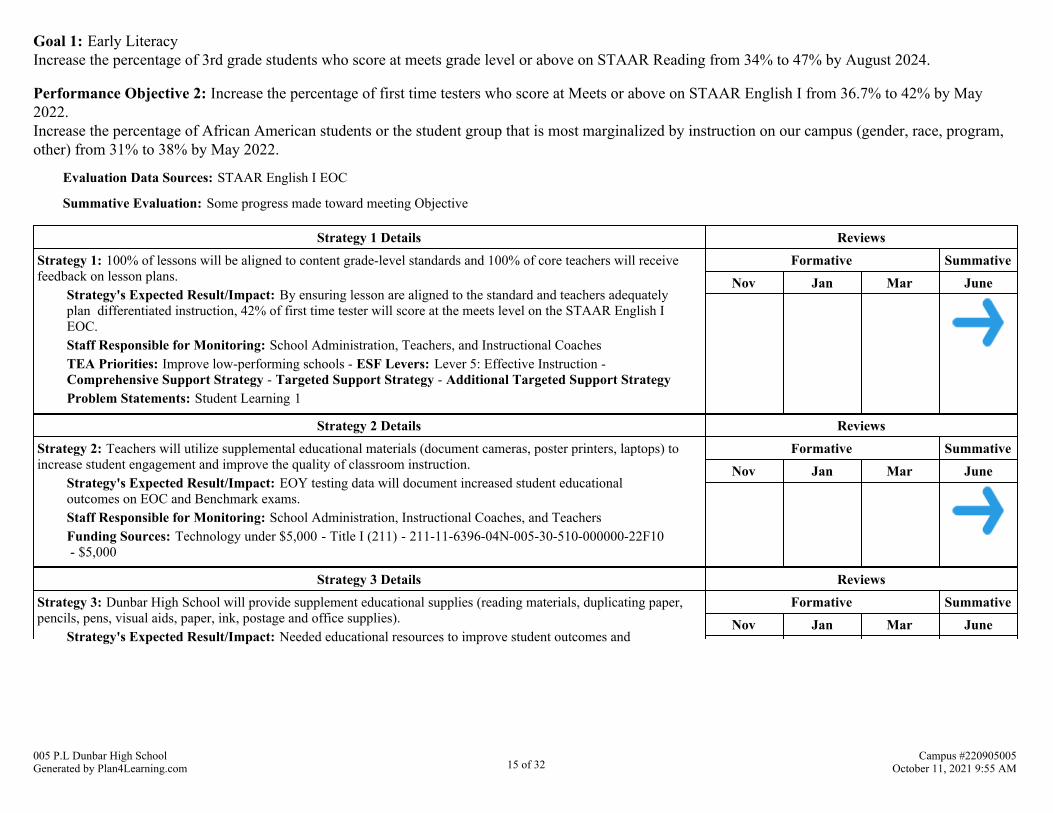
Performance Objective 2: Increase the percentage of first time testers who score at Meets or above on STAAR English I from 36.7% to 42% by May2022. Increase the percentage of African American students or the student group that is most marginalized by instruction on our campus (gender, race, program,other) from 31% to 38% by May 2022.
Evaluation Data Sources: STAAR English I EOC
Summative Evaluation: Some progress made toward meeting Objective
Strategy 1 Details ReviewsStrategy 1: 100% of lessons will be aligned to content grade-level standards and 100% of core teachers will receivefeedback on lesson plans.
Strategy's Expected Result/Impact: By ensuring lesson are aligned to the standard and teachers adequatelyplan differentiated instruction, 42% of first time tester will score at the meets level on the STAAR English IEOC.Staff Responsible for Monitoring: School Administration, Teachers, and Instructional CoachesTEA Priorities: Improve low-performing schools - ESF Levers: Lever 5: Effective Instruction - Comprehensive Support Strategy - Targeted Support Strategy - Additional Targeted Support StrategyProblem Statements: Student Learning 1
Formative SummativeNov Jan Mar June
Strategy 2 Details ReviewsStrategy 2: Teachers will utilize supplemental educational materials (document cameras, poster printers, laptops) toincrease student engagement and improve the quality of classroom instruction.
Strategy's Expected Result/Impact: EOY testing data will document increased student educationaloutcomes on EOC and Benchmark exams.Staff Responsible for Monitoring: School Administration, Instructional Coaches, and TeachersFunding Sources: Technology under $5,000 - Title I (211) - 211-11-6396-04N-005-30-510-000000-22F10 - $5,000
Formative SummativeNov Jan Mar June
Strategy 3 Details ReviewsStrategy 3: Dunbar High School will provide supplement educational supplies (reading materials, duplicating paper,pencils, pens, visual aids, paper, ink, postage and office supplies).
Strategy's Expected Result/Impact: Needed educational resources to improve student outcomes and
Formative SummativeNov Jan Mar June
005 P.L Dunbar High SchoolGenerated by Plan4Learning.com 15 of 32
Campus #220905005October 11, 2021 9:55 AM
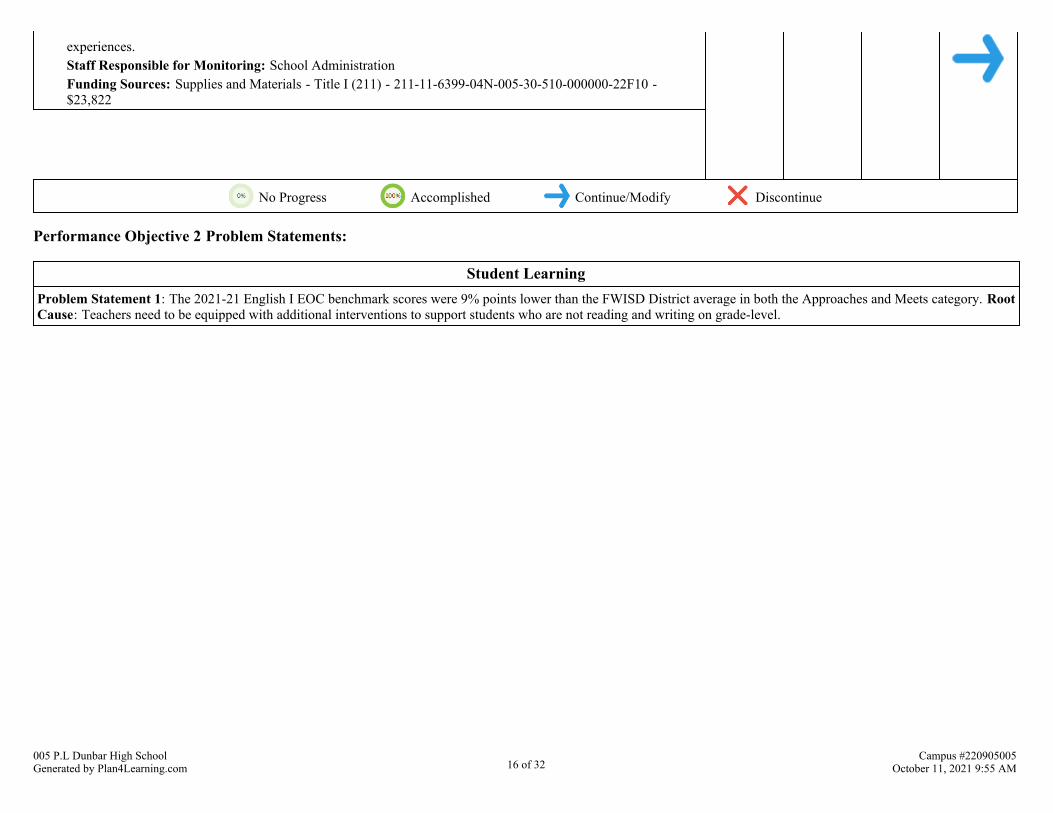
experiences.Staff Responsible for Monitoring: School AdministrationFunding Sources: Supplies and Materials - Title I (211) - 211-11-6399-04N-005-30-510-000000-22F10 - $23,822
No Progress Accomplished Continue/Modify Discontinue
Performance Objective 2 Problem Statements:
Student LearningProblem Statement 1: The 2021-21 English I EOC benchmark scores were 9% points lower than the FWISD District average in both the Approaches and Meets category. RootCause: Teachers need to be equipped with additional interventions to support students who are not reading and writing on grade-level.
005 P.L Dunbar High SchoolGenerated by Plan4Learning.com 16 of 32
Campus #220905005October 11, 2021 9:55 AM

Goal 1: Early LiteracyIncrease the percentage of 3rd grade students who score at meets grade level or above on STAAR Reading from 34% to 47% by August 2024.
Performance Objective 3: Increase the percentage of first time testers who score at Meets or above on STAAR English II from 36.7% to 50% by May2022. Increase the percentage of ELL students on our campus (gender, race, program, other) from 10% to 15% by May 2022.
Evaluation Data Sources: STAAR English II EOC
Summative Evaluation: Some progress made toward meeting Objective
Strategy 1 Details ReviewsStrategy 1: 100% of lessons will be aligned to content grade-level standards and 100% of core teachers will receivefeedback on lesson plans.
Strategy's Expected Result/Impact: By ensuring lesson are aligned to the standard and teachers adequatelyplan differentiated instruction, 50% of first time tester will score at the meets level on the STAAR English IIEOC.Staff Responsible for Monitoring: School Administration, Teachers, and Instructional Coaches
Formative SummativeNov Jan Mar June
Strategy 2 Details ReviewsStrategy 2: Dunbar High School will recruit, hire, and train teachers who hold certification in English and Math toserve as tutors.
Strategy's Expected Result/Impact: Tutors will provide intensive remediation for at-risk students and thosewho performed unscuccessfully on the EOC.Staff Responsible for Monitoring: School Administration, and Instructional CoachesFunding Sources: Tutors - SCE (199 PIC 24) - 199-13-6117-001-005-24-243-000000- - $10,186
Formative SummativeNov Jan Mar June
No Progress Accomplished Continue/Modify Discontinue
005 P.L Dunbar High SchoolGenerated by Plan4Learning.com 17 of 32
Campus #220905005October 11, 2021 9:55 AM
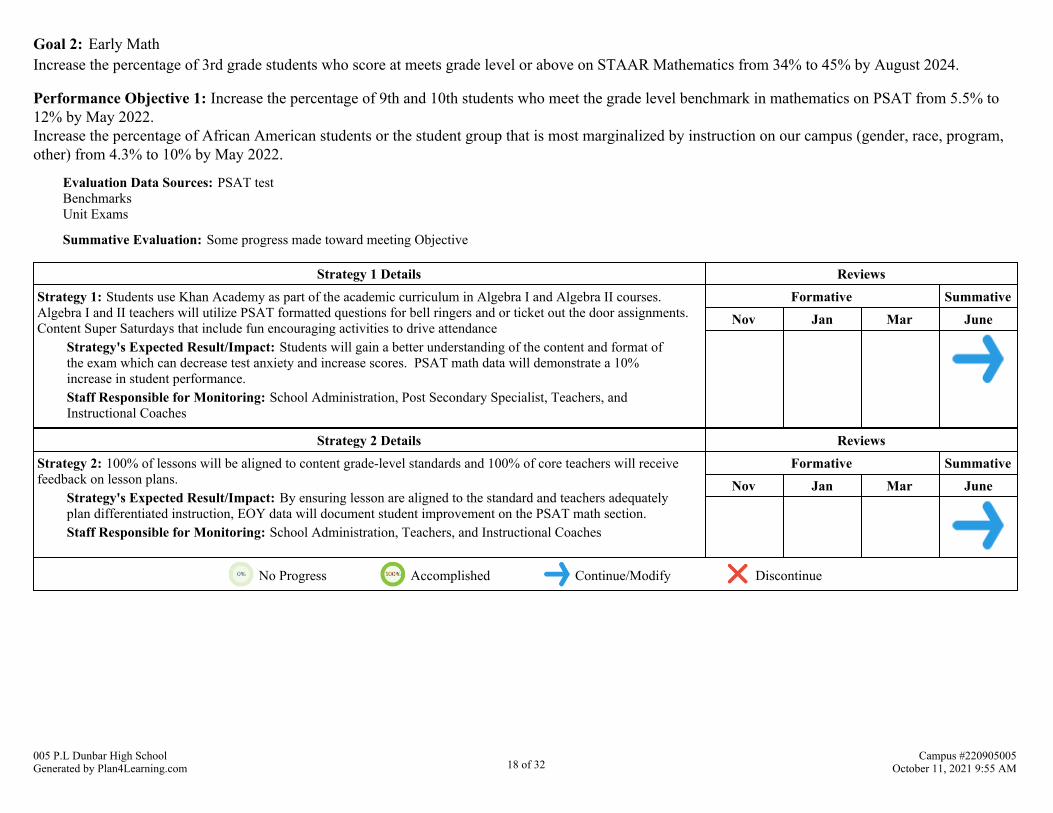
Goal 2: Early MathIncrease the percentage of 3rd grade students who score at meets grade level or above on STAAR Mathematics from 34% to 45% by August 2024.
Performance Objective 1: Increase the percentage of 9th and 10th students who meet the grade level benchmark in mathematics on PSAT from 5.5% to12% by May 2022. Increase the percentage of African American students or the student group that is most marginalized by instruction on our campus (gender, race, program,other) from 4.3% to 10% by May 2022.
Evaluation Data Sources: PSAT testBenchmarksUnit Exams
Summative Evaluation: Some progress made toward meeting Objective
Strategy 1 Details ReviewsStrategy 1: Students use Khan Academy as part of the academic curriculum in Algebra I and Algebra II courses. Algebra I and II teachers will utilize PSAT formatted questions for bell ringers and or ticket out the door assignments.Content Super Saturdays that include fun encouraging activities to drive attendance
Strategy's Expected Result/Impact: Students will gain a better understanding of the content and format ofthe exam which can decrease test anxiety and increase scores. PSAT math data will demonstrate a 10%increase in student performance.Staff Responsible for Monitoring: School Administration, Post Secondary Specialist, Teachers, andInstructional Coaches
Formative SummativeNov Jan Mar June
Strategy 2 Details ReviewsStrategy 2: 100% of lessons will be aligned to content grade-level standards and 100% of core teachers will receivefeedback on lesson plans.
Strategy's Expected Result/Impact: By ensuring lesson are aligned to the standard and teachers adequatelyplan differentiated instruction, EOY data will document student improvement on the PSAT math section.Staff Responsible for Monitoring: School Administration, Teachers, and Instructional Coaches
Formative SummativeNov Jan Mar June
No Progress Accomplished Continue/Modify Discontinue
005 P.L Dunbar High SchoolGenerated by Plan4Learning.com 18 of 32
Campus #220905005October 11, 2021 9:55 AM

Goal 2: Early MathIncrease the percentage of 3rd grade students who score at meets grade level or above on STAAR Mathematics from 34% to 45% by August 2024.
Performance Objective 2: Increase the percentage of first time testers who score at Meets or above on STAAR Algebra I from 44.2% to 48% by May2022. And the percentage of African American students or group that is most marginalized by instruction on our campus (gender, race, program, other)from 33.3% to 37% by May 2022.
Evaluation Data Sources: STAAR Algebra I EOC
Summative Evaluation: Some progress made toward meeting Objective
Strategy 1 Details ReviewsStrategy 1: 85% of lessons and student work observed are aligned to the appropriate level of rigor of standard. (DG1-3and PO)
Strategy's Expected Result/Impact: Increase the percentage of first time testers who score at Meets orabove on STAAR Algebra I from 44.2% to 48% by May 2022.Staff Responsible for Monitoring: School Administration, Teachers, and Instructional Coaches
Formative SummativeNov Jan Mar June
Strategy 2 Details ReviewsStrategy 2: Utilize Title I Funds to allocate position for Data Analyst
Strategy's Expected Result/Impact: Utilize staff personnel to provide professional development and assistteachers with analyzing and interpreting data to make data-driven decisions to increase student achievementand growth.Staff Responsible for Monitoring: School Administration, Data AnalystFunding Sources: Data Analyst - Title I (211) - 211-13-6119-04N-005-30-510-000000-22F10 - $79,611
Formative SummativeNov Jan Mar June
No Progress Accomplished Continue/Modify Discontinue
005 P.L Dunbar High SchoolGenerated by Plan4Learning.com 19 of 32
Campus #220905005October 11, 2021 9:55 AM

Goal 3: CCMRIncrease the percentage of students graduating with a CCMR indicator from 43% to 48% by June 2024.
Performance Objective 1: Increase the percentage of Grade 12 students attaining at least one CCMR indicator from 30.7% to 37% by May 2022. Increase the percentage of African American students or the student group that is most marginalized by instruction on our campus (gender, race, program,other) from 25.3% to 32% by May 2022.
Evaluation Data Sources: TSI ExamsAP ExamsCTE Exams
Summative Evaluation: Some progress made toward meeting Objective
Strategy 1 Details ReviewsStrategy 1: Teachers utilize the Texas College Bridge courses with the Level 4 Math and English courses. Studentsstart taking the TSI exam after they have completed the Algebra II course.
Strategy's Expected Result/Impact: Students will be able to acquire essential college readiness in Math andELAR. Completion of the course will qualify as TSI/CCMR met in both subjects. Exposure to the test whilethe information is fresh on their mind can produce better performance and results on the exam. Grade 12 students CCMR indicator will increase by 7%.Staff Responsible for Monitoring: School Administration, Post Secondary Specialist, Teachers, and Instructional CoachesFunding Sources: Title I Teacher - Title I (211) - 211-11-6119-04N-005-30-510-000000-22F10 - $58,000
Formative SummativeNov Jan Mar June
Strategy 2 Details ReviewsStrategy 2: 100% of lessons will be aligned to content grade-level standards and 100% of core teachers will receivefeedback on lesson plans.
Strategy's Expected Result/Impact: By ensuring lesson are aligned to the standard and teachers adequatelyplan differentiated instruction, EOY data will document an increase in Grade 12 students earning at least oneCCMR indicator.Staff Responsible for Monitoring: School Administration, Teachers, and Instructional Coaches
Formative SummativeNov Jan Mar June
No Progress Accomplished Continue/Modify Discontinue
005 P.L Dunbar High SchoolGenerated by Plan4Learning.com 20 of 32
Campus #220905005October 11, 2021 9:55 AM

Goal 3: CCMRIncrease the percentage of students graduating with a CCMR indicator from 43% to 48% by June 2024.
Performance Objective 2: Increase the percentage of Grade 9 students "On Track" from 6.9% to 11% by May 2022. AIncrease the percentage of African American students or the student group that is most marginalized by instruction on our campus (gender, race, program,other) from 5.7% to 10% by May 2022.
Evaluation Data Sources: Attendance dataAcademic Transcripts
Summative Evaluation: Some progress made toward meeting Objective
Strategy 1 Details ReviewsStrategy 1: The Freshman Success Initiative will monitor student progress and proactively intervene when studentsshow early signs of attendance, behavior, or academic problems. Provide intensive, individualized support to studentswho have fallen off track and face significant challenges to success. Engage students by offering programs that connectschoolwork with college and career success and that improve students' capacity to manage challenges in and out ofschool.
Strategy's Expected Result/Impact: The percentage of Grade 9 students on track will increase by 5%.Staff Responsible for Monitoring: School Administration, Freshman Success Initiative Team, and Teachers
Formative SummativeNov Jan Mar June
Strategy 2 Details ReviewsStrategy 2: The New Teacher Support Advisor will mentor inexperienced and struggling teachers to increase teacherretention and student engagement in the classroom.
Strategy's Expected Result/Impact: Inexperienced teachers will learn how to implement the following:Effective classroom engagement Classroom management strategiesCurriculum frameworkPositive teacher student relationshipsImprove school to home communications.Staff Responsible for Monitoring: School Administration, New Teacher Support AdvisorFunding Sources: Contracted Professional Development - Title I (211) - 211-13-6299-04N-005-30-510-000000-22F10 - $14,000
Formative SummativeNov Jan Mar June
No Progress Accomplished Continue/Modify Discontinue
005 P.L Dunbar High SchoolGenerated by Plan4Learning.com 21 of 32
Campus #220905005October 11, 2021 9:55 AM

Goal 3: CCMRIncrease the percentage of students graduating with a CCMR indicator from 43% to 48% by June 2024.
Performance Objective 3: Increase the percentage of students who have successfully completed Algebra 1 by the end of 9th grade from 8.9% to 15% byMay 2022. Increase the percentage of African American students or the student group that is most marginalized by instruction on our campus (gender, race, program,other) from 7.3% to 15% by May 2022.
Evaluation Data Sources: Benchmark DataUnit TestAlgebra I EOC
Summative Evaluation: Some progress made toward meeting Objective
Strategy 1 Details ReviewsStrategy 1: Prioritize student's conceptual understanding of Algebra concepts. Make concepts visual to allow studentsto see how an abstract concept translates to a physical scenario. Use hands on activities which encourage students touse their visual methods to solve problems. Display anchor charts and word walls throughout the classroom.
Strategy's Expected Result/Impact: EOY data will demonstrate a 7% increase in student's completion ofthe Algebra I course.Staff Responsible for Monitoring: School Administration, Teachers, Instructional Coaches
Formative SummativeNov Jan Mar June
Strategy 2 Details ReviewsStrategy 2: 100% of lessons will be aligned to content grade-level standards and 100% of core teachers will receivefeedback on lesson plans.
Strategy's Expected Result/Impact: By ensuring lesson are aligned to the standard and teachers adequatelyplan differentiated instruction, EOY data will document an increase in the number of students whosuccessfully complete Algebra I by the end of Grade 9.Staff Responsible for Monitoring: School Administration, Teachers, and Instructional CoachesTEA Priorities: Improve low-performing schools - ESF Levers: Lever 5: Effective Instruction - Comprehensive Support Strategy - Targeted Support Strategy - Additional Targeted Support StrategyProblem Statements: Student Learning 1
Formative SummativeNov Jan Mar June
No Progress Accomplished Continue/Modify Discontinue
Performance Objective 3 Problem Statements:
Student LearningProblem Statement 1: The 2021-21 English I EOC benchmark scores were 9% points lower than the FWISD District average in both the Approaches and Meets category. RootCause: Teachers need to be equipped with additional interventions to support students who are not reading and writing on grade-level.
005 P.L Dunbar High SchoolGenerated by Plan4Learning.com 22 of 32
Campus #220905005October 11, 2021 9:55 AM

Goal 3: CCMRIncrease the percentage of students graduating with a CCMR indicator from 43% to 48% by June 2024.
Performance Objective 4: Increase the percentage of Grade 11 and 12 students who meet SAT or ACT criteria for CCMR from 2.8% to 10% by May2022. Increase the percentage of African American students or the student group that is most marginalized by instruction on our campus (gender, race, program,other) from 1.8% to 10% by May 2022.
Evaluation Data Sources: SAT ExamsACT Exams
Summative Evaluation: Some progress made toward meeting Objective
Strategy 1 Details ReviewsStrategy 1: Students regularly engage with Khan Academy to build the necessary skills for the SAT/ACT exams. Students take a practice exam, before the test, to get familiar with the format and content.
Strategy's Expected Result/Impact: Students will gain a better understanding of the content and format ofthe exam which can decrease test anxiety and increase scores. EOY data will demonstrate an 8% increase instudent's who meet SAT/ACT criteria for CCMR.Staff Responsible for Monitoring: School Administration, and Post Secondary Specialist
Formative SummativeNov Jan Mar June
Strategy 2 Details ReviewsStrategy 2: 100% of lessons will be aligned to content grade-level standards and 100% of core teachers will receivefeedback on lesson plans.
Strategy's Expected Result/Impact: By ensuring lesson are aligned to the standard and teachers adequatelyplan differentiated instruction, EOY data will document an increase in Grade 11 and 12 students successfullymeeting SAT/ACT criteria for CCMR.Staff Responsible for Monitoring: School Administration, Teachers, and Instructional Coaches
Formative SummativeNov Jan Mar June
No Progress Accomplished Continue/Modify Discontinue
005 P.L Dunbar High SchoolGenerated by Plan4Learning.com 23 of 32
Campus #220905005October 11, 2021 9:55 AM
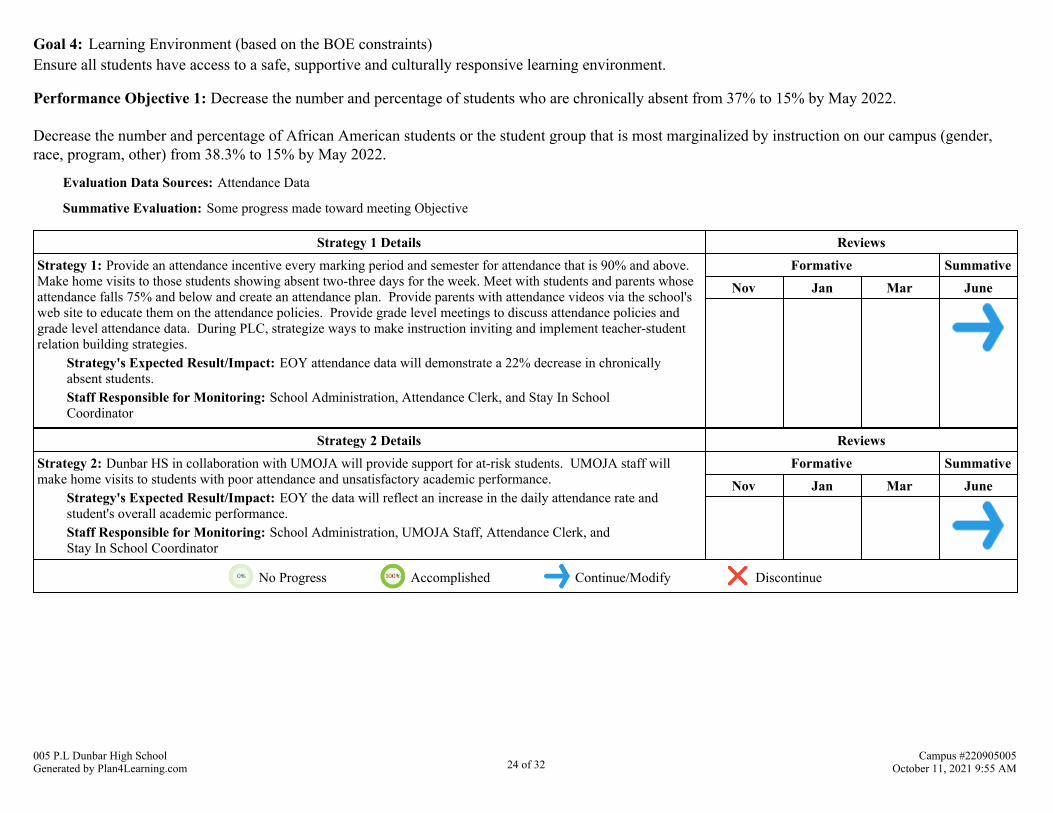
Goal 4: Learning Environment (based on the BOE constraints)Ensure all students have access to a safe, supportive and culturally responsive learning environment.
Performance Objective 1: Decrease the number and percentage of students who are chronically absent from 37% to 15% by May 2022.
Decrease the number and percentage of African American students or the student group that is most marginalized by instruction on our campus (gender,race, program, other) from 38.3% to 15% by May 2022.
Evaluation Data Sources: Attendance Data
Summative Evaluation: Some progress made toward meeting Objective
Strategy 1 Details ReviewsStrategy 1: Provide an attendance incentive every marking period and semester for attendance that is 90% and above. Make home visits to those students showing absent two-three days for the week. Meet with students and parents whoseattendance falls 75% and below and create an attendance plan. Provide parents with attendance videos via the school'sweb site to educate them on the attendance policies. Provide grade level meetings to discuss attendance policies andgrade level attendance data. During PLC, strategize ways to make instruction inviting and implement teacher-studentrelation building strategies.
Strategy's Expected Result/Impact: EOY attendance data will demonstrate a 22% decrease in chronicallyabsent students.Staff Responsible for Monitoring: School Administration, Attendance Clerk, and Stay In SchoolCoordinator
Formative SummativeNov Jan Mar June
Strategy 2 Details ReviewsStrategy 2: Dunbar HS in collaboration with UMOJA will provide support for at-risk students. UMOJA staff willmake home visits to students with poor attendance and unsatisfactory academic performance.
Strategy's Expected Result/Impact: EOY the data will reflect an increase in the daily attendance rate andstudent's overall academic performance.Staff Responsible for Monitoring: School Administration, UMOJA Staff, Attendance Clerk, and Stay In School Coordinator
Formative SummativeNov Jan Mar June
No Progress Accomplished Continue/Modify Discontinue
005 P.L Dunbar High SchoolGenerated by Plan4Learning.com 24 of 32
Campus #220905005October 11, 2021 9:55 AM
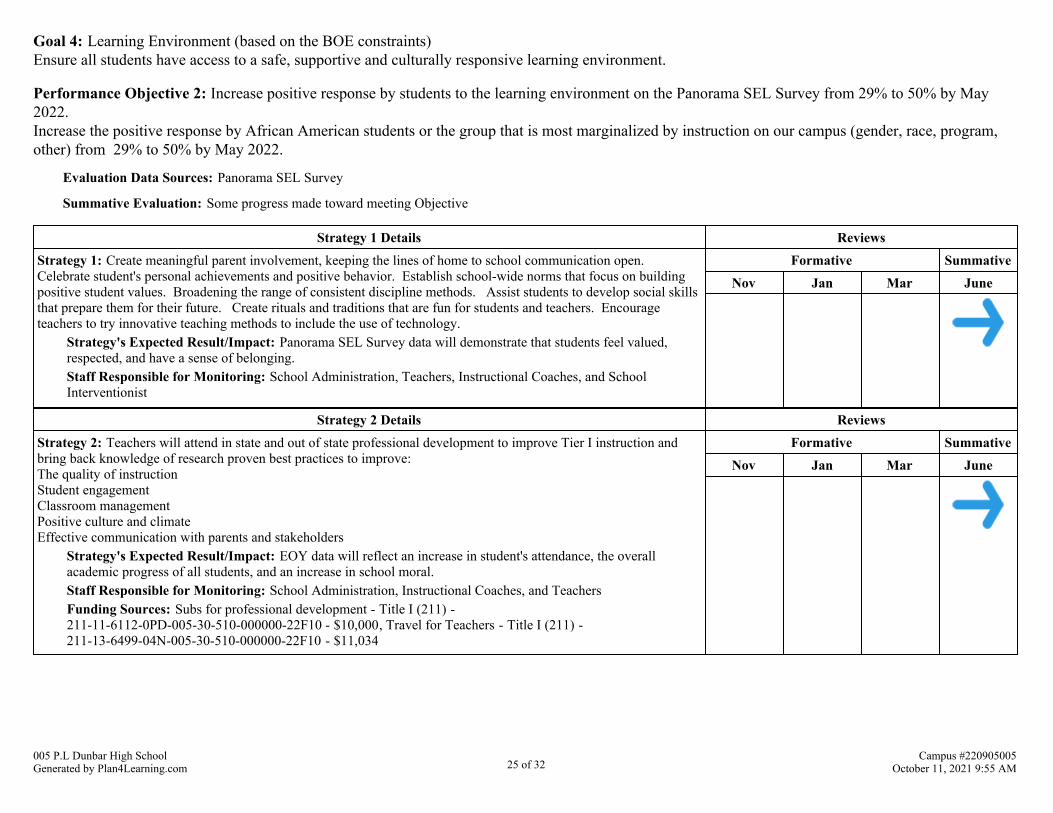
Goal 4: Learning Environment (based on the BOE constraints)Ensure all students have access to a safe, supportive and culturally responsive learning environment.
Performance Objective 2: Increase positive response by students to the learning environment on the Panorama SEL Survey from 29% to 50% by May2022. Increase the positive response by African American students or the group that is most marginalized by instruction on our campus (gender, race, program,other) from 29% to 50% by May 2022.
Evaluation Data Sources: Panorama SEL Survey
Summative Evaluation: Some progress made toward meeting Objective
Strategy 1 Details ReviewsStrategy 1: Create meaningful parent involvement, keeping the lines of home to school communication open. Celebrate student's personal achievements and positive behavior. Establish school-wide norms that focus on buildingpositive student values. Broadening the range of consistent discipline methods. Assist students to develop social skillsthat prepare them for their future. Create rituals and traditions that are fun for students and teachers. Encourageteachers to try innovative teaching methods to include the use of technology.
Strategy's Expected Result/Impact: Panorama SEL Survey data will demonstrate that students feel valued,respected, and have a sense of belonging.Staff Responsible for Monitoring: School Administration, Teachers, Instructional Coaches, and SchoolInterventionist
Formative SummativeNov Jan Mar June
Strategy 2 Details ReviewsStrategy 2: Teachers will attend in state and out of state professional development to improve Tier I instruction andbring back knowledge of research proven best practices to improve:The quality of instructionStudent engagementClassroom managementPositive culture and climateEffective communication with parents and stakeholders
Strategy's Expected Result/Impact: EOY data will reflect an increase in student's attendance, the overallacademic progress of all students, and an increase in school moral.Staff Responsible for Monitoring: School Administration, Instructional Coaches, and TeachersFunding Sources: Subs for professional development - Title I (211) - 211-11-6112-0PD-005-30-510-000000-22F10 - $10,000, Travel for Teachers - Title I (211) - 211-13-6499-04N-005-30-510-000000-22F10 - $11,034
Formative SummativeNov Jan Mar June
005 P.L Dunbar High SchoolGenerated by Plan4Learning.com 25 of 32
Campus #220905005October 11, 2021 9:55 AM

Strategy 3 Details ReviewsStrategy 3: Principals and Assistant Principals will attend in state and out of state professional development to improveTier I instruction and bring back knowledge of research proven best practices to improve:The quality of instructionStudent engagementClassroom managementPositive culture and climateEffective communication with parents and stakeholders
Strategy's Expected Result/Impact: EOY data will reflect an increase in student's attendance, the overallacademic progress of all students, and an increase in school moral.Staff Responsible for Monitoring: School Administration, Instructional Coaches, and TeachersFunding Sources: Travel for School Administration - Title I (211) - 211-23-6499-04N-005-30-510-000000-22F10 - $5,183
Formative SummativeNov Jan Mar June
No Progress Accomplished Continue/Modify Discontinue
005 P.L Dunbar High SchoolGenerated by Plan4Learning.com 26 of 32
Campus #220905005October 11, 2021 9:55 AM
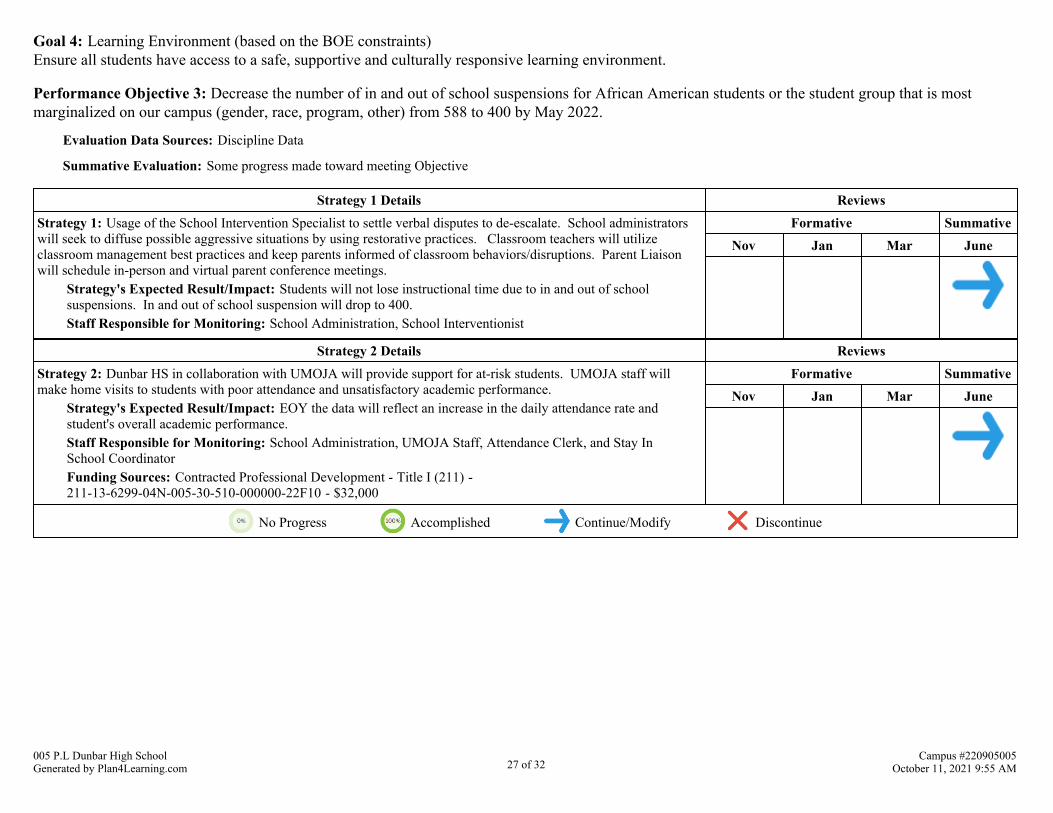
Goal 4: Learning Environment (based on the BOE constraints)Ensure all students have access to a safe, supportive and culturally responsive learning environment.
Performance Objective 3: Decrease the number of in and out of school suspensions for African American students or the student group that is mostmarginalized on our campus (gender, race, program, other) from 588 to 400 by May 2022.
Evaluation Data Sources: Discipline Data
Summative Evaluation: Some progress made toward meeting Objective
Strategy 1 Details ReviewsStrategy 1: Usage of the School Intervention Specialist to settle verbal disputes to de-escalate. School administratorswill seek to diffuse possible aggressive situations by using restorative practices. Classroom teachers will utilizeclassroom management best practices and keep parents informed of classroom behaviors/disruptions. Parent Liaisonwill schedule in-person and virtual parent conference meetings.
Strategy's Expected Result/Impact: Students will not lose instructional time due to in and out of schoolsuspensions. In and out of school suspension will drop to 400.Staff Responsible for Monitoring: School Administration, School Interventionist
Formative SummativeNov Jan Mar June
Strategy 2 Details ReviewsStrategy 2: Dunbar HS in collaboration with UMOJA will provide support for at-risk students. UMOJA staff willmake home visits to students with poor attendance and unsatisfactory academic performance.
Strategy's Expected Result/Impact: EOY the data will reflect an increase in the daily attendance rate andstudent's overall academic performance.Staff Responsible for Monitoring: School Administration, UMOJA Staff, Attendance Clerk, and Stay InSchool CoordinatorFunding Sources: Contracted Professional Development - Title I (211) - 211-13-6299-04N-005-30-510-000000-22F10 - $32,000
Formative SummativeNov Jan Mar June
No Progress Accomplished Continue/Modify Discontinue
005 P.L Dunbar High SchoolGenerated by Plan4Learning.com 27 of 32
Campus #220905005October 11, 2021 9:55 AM

Goal 4: Learning Environment (based on the BOE constraints)Ensure all students have access to a safe, supportive and culturally responsive learning environment.
Performance Objective 4: Increase the positive perception of parents on Engagement on the district's Parent Survey from 72% to 80% by May 2022. Increase the positive perception of parents of African American students or the student group that is most marginalized by instruction on our campus(gender, race, program, other) from 72% to 80% by May 2022.
Evaluation Data Sources: FWISD Parent Survey
Summative Evaluation: Some progress made toward meeting Objective
Strategy 1 Details ReviewsStrategy 1: The Parent Liaison will establish a Parent University that shows parents how to track their student's grades,attendance, and discipline referrals.
Strategy's Expected Result/Impact: Parent's interaction with the school will be positive and increase parentusage of Parent Portal to stay abreast of their student's progress. The number of Dunbar High School parentsenrolled in Parent Portal will increase from 511 to 661.Staff Responsible for Monitoring: School Administration, Parent Liaison, and School InterventionistFunding Sources: Family Engagement Specialist - Title I (211) - 211-61-6129-04L-005-30-510-000000-22F10 - $24,600, Snacks for Parents to promote participation - Title I(211) - 211-61-6499-04L-005-30-510-000000-22F10 - $4,967
Formative SummativeNov Jan Mar June
No Progress Accomplished Continue/Modify Discontinue
005 P.L Dunbar High SchoolGenerated by Plan4Learning.com 28 of 32
Campus #220905005October 11, 2021 9:55 AM

Plan NotesUpdate plan to show last years data and the expected growth for this year. How will you ensure that all students go to tutoring? Ensure strategies are things you can controlthroughout the school day.
005 P.L Dunbar High SchoolGenerated by Plan4Learning.com 29 of 32
Campus #220905005October 11, 2021 9:55 AM

Site-Based Decision Making CommitteeCommittee Role Name PositionNon-classroom Professional ANGELA Batts Freshman Success Coach
Classroom Teacher CANDICE ISAAC TEACHER
Professional Non-Teaching Staff RAMONA CARTER PROFESSIONAL NON-TEACHING STAFF
Community Representative RICHARD OWENS COMMUNITY REPRESENTATIVE
Business Representative 1 Paige Stephens Business Representative
Business Representative 2 Gary Hampton Business Representative
District-level Professional BOBBI LEVINE DISTRICT LEVEL STAFF
Administrator CLAIRE ANDERSON ASSISTANT PRINCIPAL
Professional District-Level Staff Christopher Hall DERC Member
Parent 1 Cheryl Chapeple Combs Parent
Parent 2 Deshauna Robinson Parent
Community Representative 1 AJ Jones Community Representative
Administrator JUSTIN EDWARDS PRINCIPAL
Community Representative 1 Meshawn Henderson Community Representative
Business Representative Latrice Jones Business Representative
005 P.L Dunbar High SchoolGenerated by Plan4Learning.com 30 of 32
Campus #220905005October 11, 2021 9:55 AM
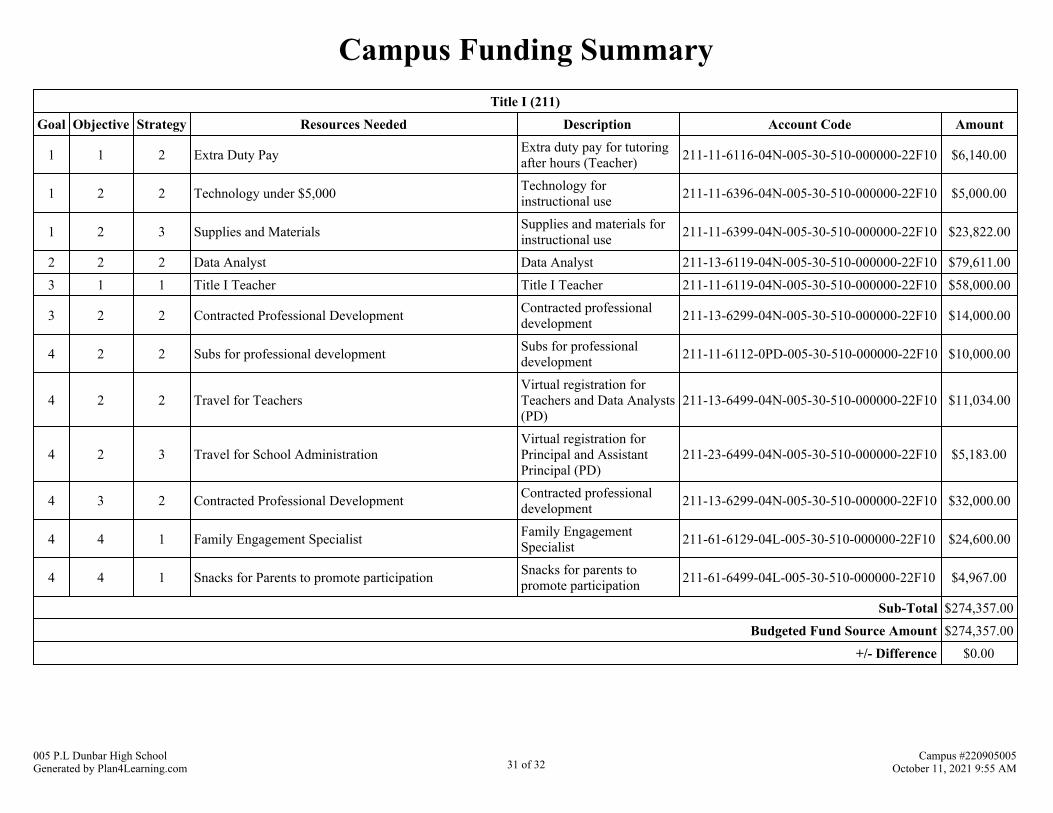
Campus Funding SummaryTitle I (211)
Goal Objective Strategy Resources Needed Description Account Code Amount
1 1 2 Extra Duty Pay Extra duty pay for tutoringafter hours (Teacher) 211-11-6116-04N-005-30-510-000000-22F10 $6,140.00
1 2 2 Technology under $5,000 Technology forinstructional use 211-11-6396-04N-005-30-510-000000-22F10 $5,000.00
1 2 3 Supplies and Materials Supplies and materials forinstructional use 211-11-6399-04N-005-30-510-000000-22F10 $23,822.00
2 2 2 Data Analyst Data Analyst 211-13-6119-04N-005-30-510-000000-22F10 $79,611.00
3 1 1 Title I Teacher Title I Teacher 211-11-6119-04N-005-30-510-000000-22F10 $58,000.00
3 2 2 Contracted Professional Development Contracted professionaldevelopment 211-13-6299-04N-005-30-510-000000-22F10 $14,000.00
4 2 2 Subs for professional development Subs for professionaldevelopment 211-11-6112-0PD-005-30-510-000000-22F10 $10,000.00
4 2 2 Travel for TeachersVirtual registration forTeachers and Data Analysts(PD)
211-13-6499-04N-005-30-510-000000-22F10 $11,034.00
4 2 3 Travel for School AdministrationVirtual registration forPrincipal and AssistantPrincipal (PD)
211-23-6499-04N-005-30-510-000000-22F10 $5,183.00
4 3 2 Contracted Professional Development Contracted professionaldevelopment 211-13-6299-04N-005-30-510-000000-22F10 $32,000.00
4 4 1 Family Engagement Specialist Family EngagementSpecialist 211-61-6129-04L-005-30-510-000000-22F10 $24,600.00
4 4 1 Snacks for Parents to promote participation Snacks for parents topromote participation 211-61-6499-04L-005-30-510-000000-22F10 $4,967.00
Sub-Total $274,357.00
Budgeted Fund Source Amount $274,357.00
+/- Difference $0.00
005 P.L Dunbar High SchoolGenerated by Plan4Learning.com 31 of 32
Campus #220905005October 11, 2021 9:55 AM
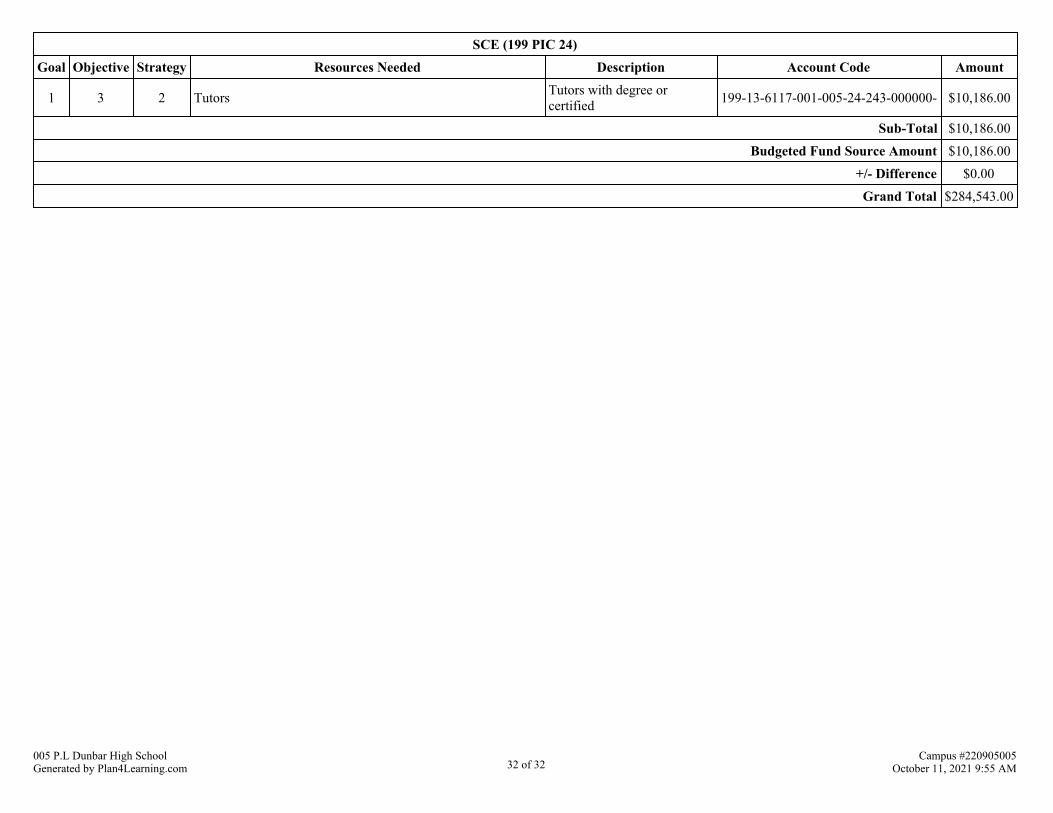
SCE (199 PIC 24)Goal Objective Strategy Resources Needed Description Account Code Amount
1 3 2 Tutors Tutors with degree orcertified 199-13-6117-001-005-24-243-000000- $10,186.00
Sub-Total $10,186.00
Budgeted Fund Source Amount $10,186.00
+/- Difference $0.00
Grand Total $284,543.00
005 P.L Dunbar High SchoolGenerated by Plan4Learning.com 32 of 32
Campus #220905005October 11, 2021 9:55 AM