gaseous emission-control technologies (air-quality technology)
TRANSCRIPT

1
Gaseous Emission-Control Technologies(Air-Quality Technology)(Nazaroff & Alvarez-Cohen, Section 7.C)(Mihelcic & Zimmerman, Section 12.7)
Two different approaches:
- Pollution Prevention at the source – the better alternative
- Treatment of fumes as they are formed – the classical approach
(Nazaroff & Alvarez-Cohen, Table 7.C.2, page 444)

2
In other words: Choose your pollutant!
A three-way catalytic converter performs three simultaneous tasks:1. Oxidation of carbon monoxide (CO) to carbon dioxide
2 CO + O2 → 2 CO2
2. Oxidation of unburned hydrocarbons (HC) to carbon dioxide and waterCxH2y + [(2x+y)/2]O2 → x CO2 + y H2O
3. Reduction of nitrogen oxides to nitrogen and oxygen2NOx → N2 + x O2
www.youtube.com/watch?v=E4tk3IgVVgk

3
Techniques to remove particles from an air stream
(Nazaroff & Alvarez-Cohen, Table 7.C.1, page 443)
Cyclone separators have been used in the United States for about 100 years, and are still one of the most widely used of all industrial gas-cleaning devices. The main reasons for the wide-spread use of cyclones are that they are inexpensive to purchase, they have no moving parts, and they can be constructed to withstand harsh operating conditions.
Cyclone Separators and their Design(Nazaroff & Alvarez-Cohen, pages 445-447 augmented)(Mihelcic & Zimmerman, Section 12.8.1)
A cyclone used in a woodshop(Lebanon, NH)
htt
p:/
/ww
w.jt
syst
em
sin
c.co
m/
Low-pressure drop cycloneat Rochester Asphalt Plant(Victor, NY)

4
Cyclone Design(Adapted from Air Pollution Control by C. D. Cooper & F.C . Alley, 1986)
Typically, a particulate-laden gas enters tangentially near the top of the cyclone, as shown schematically in the left figure. The gas flow is forced into a downward spiral simply because of the cyclone’s shape and the tangential entry.
Another type of cyclone (a vane-axial cyclone –see right figure) employs an axial inlet with fixed turning vanes to achieve a spiraling flow.
Centrifugal force and inertia cause the particles to move outward, collide with the outer wall, and then slide downward to the bottom of the device. Near the bottom of the cyclone, the gas reverses its downward spiral and moves upward in a smaller inner spiral. The cleaned gas exits from the top through a “vortex-finder” tube, and the particles exit from the bottom of the cyclone through a pipe sealed by a spring-loaded flapper valve or rotary valve.
Advantages of cyclones:
Low capital cost (few parts, easy to assemble)Ability to operate at high temperatures (all metal parts)Low maintenance requirements (no moving parts).
Disadvantages of cyclones:
Low collection efficiencies (especially for very small particles)→ cyclones used almost exclusively for particles > 5 m.
High operating costs (power required to overcome large pressure drop).
5
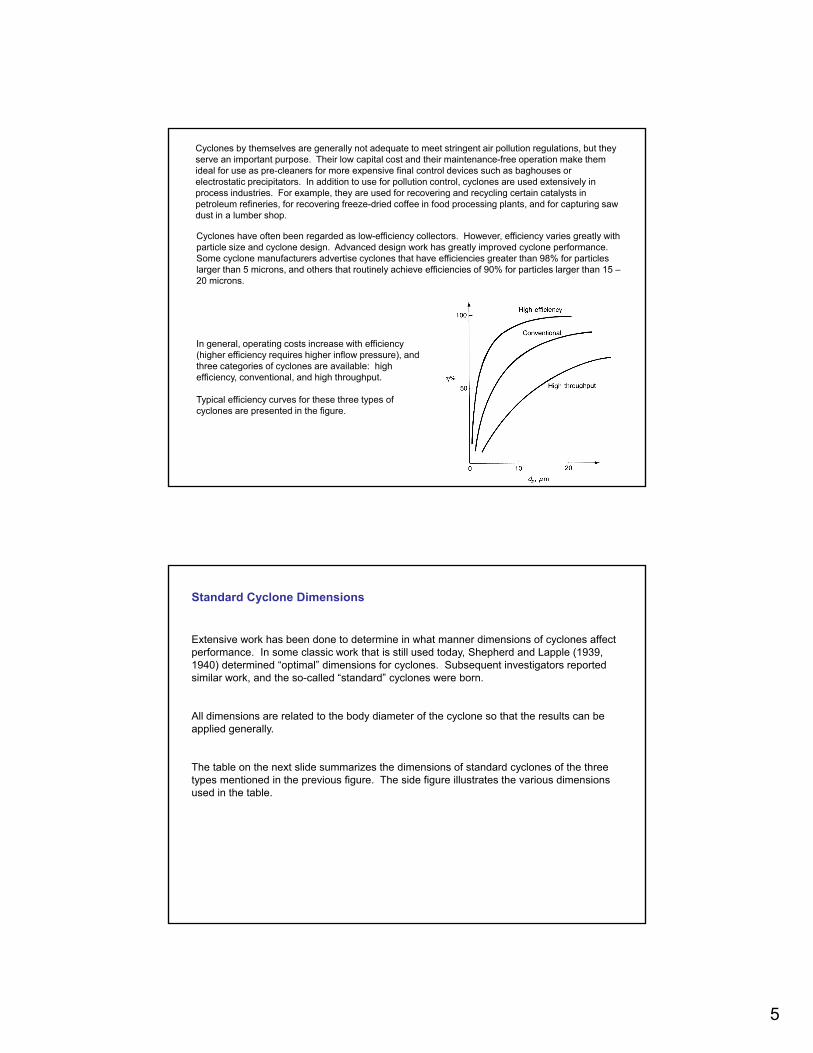
Cyclones by themselves are generally not adequate to meet stringent air pollution regulations, but they serve an important purpose. Their low capital cost and their maintenance-free operation make them ideal for use as pre-cleaners for more expensive final control devices such as baghouses or electrostatic precipitators. In addition to use for pollution control, cyclones are used extensively in process industries. For example, they are used for recovering and recycling certain catalysts in petroleum refineries, for recovering freeze-dried coffee in food processing plants, and for capturing saw dust in a lumber shop.
Cyclones have often been regarded as low-efficiency collectors. However, efficiency varies greatly with particle size and cyclone design. Advanced design work has greatly improved cyclone performance. Some cyclone manufacturers advertise cyclones that have efficiencies greater than 98% for particles larger than 5 microns, and others that routinely achieve efficiencies of 90% for particles larger than 15 –20 microns.
In general, operating costs increase with efficiency (higher efficiency requires higher inflow pressure), and three categories of cyclones are available: high efficiency, conventional, and high throughput.
Typical efficiency curves for these three types of cyclones are presented in the figure.
Standard Cyclone Dimensions
Extensive work has been done to determine in what manner dimensions of cyclones affect performance. In some classic work that is still used today, Shepherd and Lapple (1939, 1940) determined “optimal” dimensions for cyclones. Subsequent investigators reported similar work, and the so-called “standard” cyclones were born.
All dimensions are related to the body diameter of the cyclone so that the results can be applied generally.
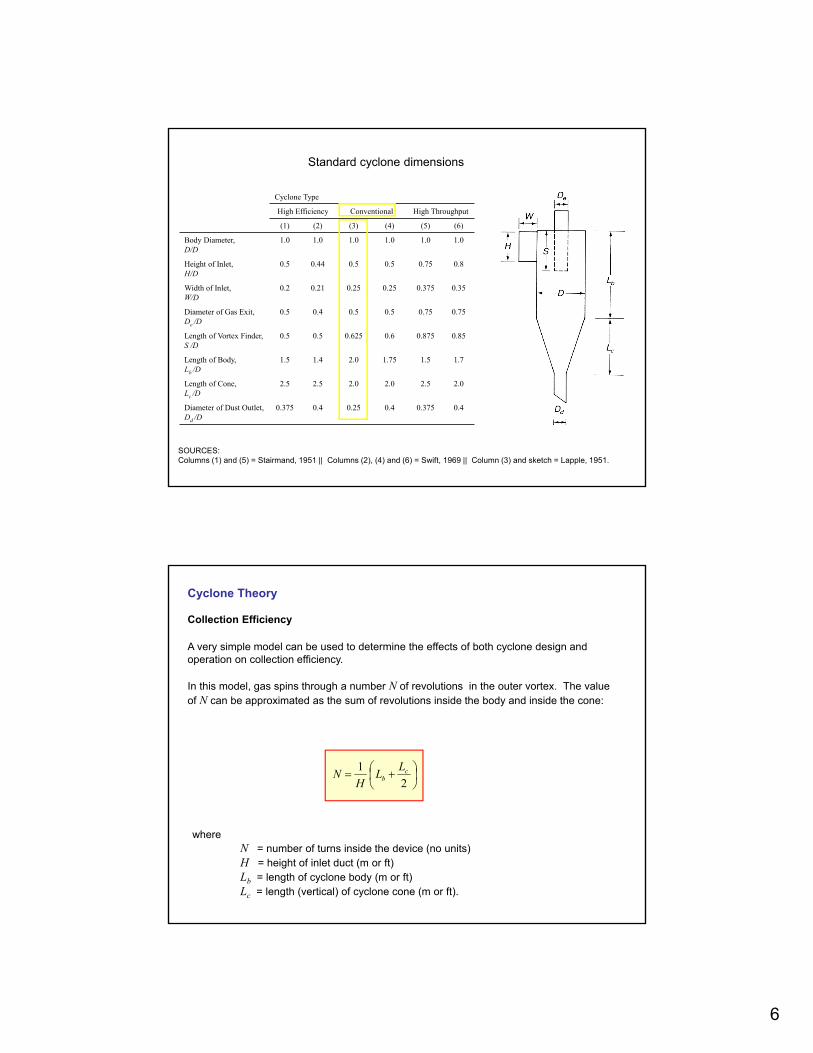
The table on the next slide summarizes the dimensions of standard cyclones of the three types mentioned in the previous figure. The side figure illustrates the various dimensions used in the table.
6
Standard cyclone dimensions
Cyclone Type
High Efficiency Conventional High Throughput
(1) (2) (3) (4) (5) (6)
Body Diameter,D/D
1.0 1.0 1.0 1.0 1.0 1.0
Height of Inlet,H/D
0.5 0.44 0.5 0.5 0.75 0.8
Width of Inlet,W/D
0.2 0.21 0.25 0.25 0.375 0.35
Diameter of Gas Exit,De /D
0.5 0.4 0.5 0.5 0.75 0.75
Length of Vortex Finder,S /D
0.5 0.5 0.625 0.6 0.875 0.85
Length of Body,Lb /D
1.5 1.4 2.0 1.75 1.5 1.7
Length of Cone,Lc /D
2.5 2.5 2.0 2.0 2.5 2.0
Diameter of Dust Outlet,Dd /D
0.375 0.4 0.25 0.4 0.375 0.4
SOURCES:Columns (1) and (5) = Stairmand, 1951 || Columns (2), (4) and (6) = Swift, 1969 || Column (3) and sketch = Lapple, 1951.
Cyclone Theory
Collection Efficiency
A very simple model can be used to determine the effects of both cyclone design and operation on collection efficiency.
In this model, gas spins through a number N of revolutions in the outer vortex. The value of N can be approximated as the sum of revolutions inside the body and inside the cone:
2
1 cb
LL
HN
whereN = number of turns inside the device (no units)H = height of inlet duct (m or ft)Lb = length of cyclone body (m or ft)Lc = length (vertical) of cyclone cone (m or ft).

7
wheret = time spent by gas during spiraling descent (sec)D = cyclone body diameter (m or ft)Vi = gas inlet velocity (m/s or ft/s) = Q/WHQ = volumetric inflow (m3/s or ft3/s)H = height of inlet (m or ft)W = width of inlet (m or ft).
iVNDt /speedlength / path
To be collected, particles must strike the wall within the amount of time that the gas travels in the outer vortex. The gas residence time in the outer vortex is
The maximum radial distance traveled by any particle is the width of the inlet duct W. The centrifugal force quickly accelerates the particle to its terminal velocity in the outward (radial) direction, with the opposing drag force equaling the centrifugal force. The terminal velocity that will just allow a particle initially at distance W away from the wall to be collected in time is
Vt W /t
where Vt = particle drift velocity in the radial direction (m/s or ft/s).
i
QV
WH
The particle drift velocity is a function of particle size.
Assuming Stokes regime flow (drag force = 3πμdpVt) and spherical particles subjected to a centrifugal force mv2/r ,with m = mass of particle in excess of mass of air displaced, v = Vi of inlet flow, and r = D/2, we obtain
D
VdV ipap
t
9
)( 22
whereVt = terminal drift transverse velocity (m/s or ft/s)dp = diameter of the particle (m or ft)p = density of the particle (kg/m3)a = air density (kg/m3) = air viscosity (kg/m.s).

8
Substitution of the 2nd equation into the 3rd eliminates t. Then, setting the two expressions for Vt equal to each other and rearranging to solve for particle diameter, we obtain
2/1
)(
9
apip VN
Wd
It is worth noting that in this expression, dp is the size of the smallest particle that will be collected if it starts at the inside edge of the inlet duct. Thus, in theory, all particles of size dp or larger should be collected with 100% efficiency.
Note that the units must be consistent in all equations.One consistent set is m for dp, R and W; m/s for Vi and Vt; kg/m.s for ;
and kg/m3 for p and a. An equivalent set in English units is ft for dp, R and W; ft/sec for Vi and Vt;
lbm/ft.sec for ; and lbm/ft3 for p and a.
The preceding equation shows that, in theory, the smallest diameter of particles collected with 100% efficiency is directly related to gas viscosity and inlet duct width, and inversely related to the number of effective turns, inlet gas velocity, and density difference between the particles and the gas.
In practice, collection efficiency does, in fact, depend on these parameters. However, the model has a major flaw: It predicts that all particles larger than dp will be collected with 100% efficiency, which is incorrect. This discrepancy is the result of all our approximations.
Lapple (1951) developed a semi-empirical relationship to calculate a “50% cut diameter” dpc, which is the diameter of particles collected with 50% efficiency. The expression is
2/1
)(2
9
apipc VN
Wd
where dpc = diameter of particle collected with 50% efficiency.
Note the similarity between the last two equations. The only difference is a factor 2 in the denominator.

9
Particle collection efficiency versus particle size ratio for standard conventional cyclones
Lapple then developed a general curve for standard conventional cyclones to predict the collection efficiency for any particle size (see side figure).
If the size distribution of particles is known, the overall collection efficiency of a cyclone can be predicted by using the figure.
Theodore and DePaola (1980) then fitted an algebraic equation to the curve, which makes Lapple’s approach more precise and more convenient for application to computers. The efficiency of collection of any size of particle is given by
2/1
1
pjpc
jdd
wherej = collection efficiency of particles in the jth size range (0 < j < 1)dpj = characteristic diameter of the jth particle size range (in m).
100%, all particles collected
O%, no particle collected
50%, 1 particle in 2is collected
dpc
The overall efficiency, called performance, of the cyclone is a weighted average of the collection efficiencies for the various size ranges, namely
M
m jj
where = overall collection efficiency (0 < < 1)mj = mass of particles in the jth size rangeM = total mass of particles.

10
Example of Cyclone Analysis
Given:
Conventional type (standard proportions)D = 1.0 mFlow rate = Q = 150 m3/minParticle density = p = 1600 kg/m3
Particle size distribution as follows:
Particle size % mass in that size range(dp) (m/M)
0-2 m 1.0%2-4 m 9.0%4-6 m 10.0%6-10 m 30.0%10-18 m 30.0%18-30 m 14.0%30-50 m 5.0%50-100 m 1.0%
100%
Question:
What is the collection efficiency?
Solution
62
1
c
b
LL
HN m/s 20=m/min 1200
125.0 2
D
Q
WH
QVi
m 5.79=m1079.5)(6
25.0
2
9
)(2
9 6
apiapi
pc V
D
NV
Wd
Size range(in m)
Average sizedp
(in m)
Collectionefficiency
Mass fraction
m/M
Contributionto performance
x m /M
0 – 2 1 2.9% 0.01 0.029%
2 – 4 3 21.1% 0.09 1.902%
4 – 6 5 42.7% 0.10 4.266%
6 – 10 8 65.6% 0.30 19.673%
10 – 18 14 85.4% 0.30 25.610%
18 – 30 24 94.5% 0.14 13.228%
30 – 50 40 97.9% 0.05 4.897%
50 - 100 75 99.4% 0.01 0.994%
1.00 70.6%

11
Two distinct approaches in cyclone analysis
1. Performance analysis
The cyclone exists – All dimensions and characteristics are known.The engineer calculates its collection efficiency ().
2. Design analysis
The cyclone needs to be chosen for a given task.A target performance () is imposed.
Typically, the engineer knows the amount of air flow (Q), & characteristics of particles (range of dp’s, mass fractions mj /M).
The engineer needs to determine the type of cyclone needed (conventional, high-throughput, …)the required size of the device (diameter D).
Note: Design analysis usually necessitates an iterative approach.(Successive guesses until the required performance is achieved.)