further maths
DESCRIPTION
Further Maths. Chapter 3 Summarising Numerical Data. The Mean : A measure of centre. The mean (often referred to as the average). Mean = sum of values total number of values. The mean - Demo. Calculate the mean of the following numbers 4678911. = 45. = 6. - PowerPoint PPT PresentationTRANSCRIPT
1
Further Maths
Chapter 3
Summarising Numerical Data
2
The Mean : A measure of centre
• The mean (often referred to as the average).• Mean = sum of values
total number of values
3
The mean - Demo
• Calculate the mean of the following numbers4 6 7 8 9 11
= 45 = 6
7.5
4
The mean – Your Turn
• Calculate the mean of the following numbers14 20 25 30 32 133
5
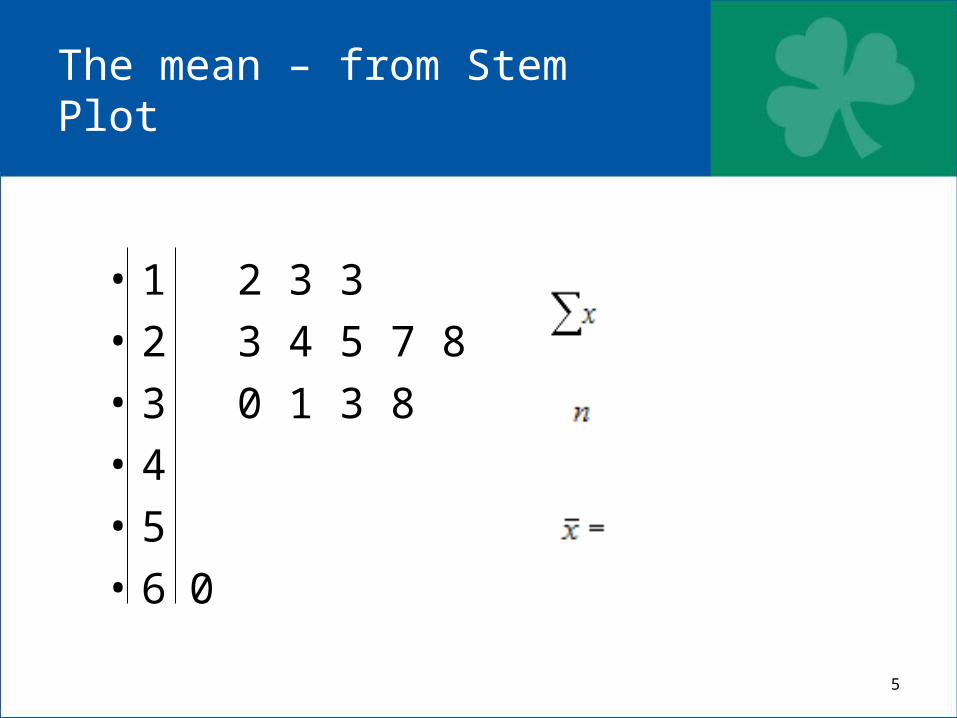
The mean – from Stem Plot
• 1 2 3 3 • 2 3 4 5 7 8 • 3 0 1 3 8 • 4 • 5• 6 0
6
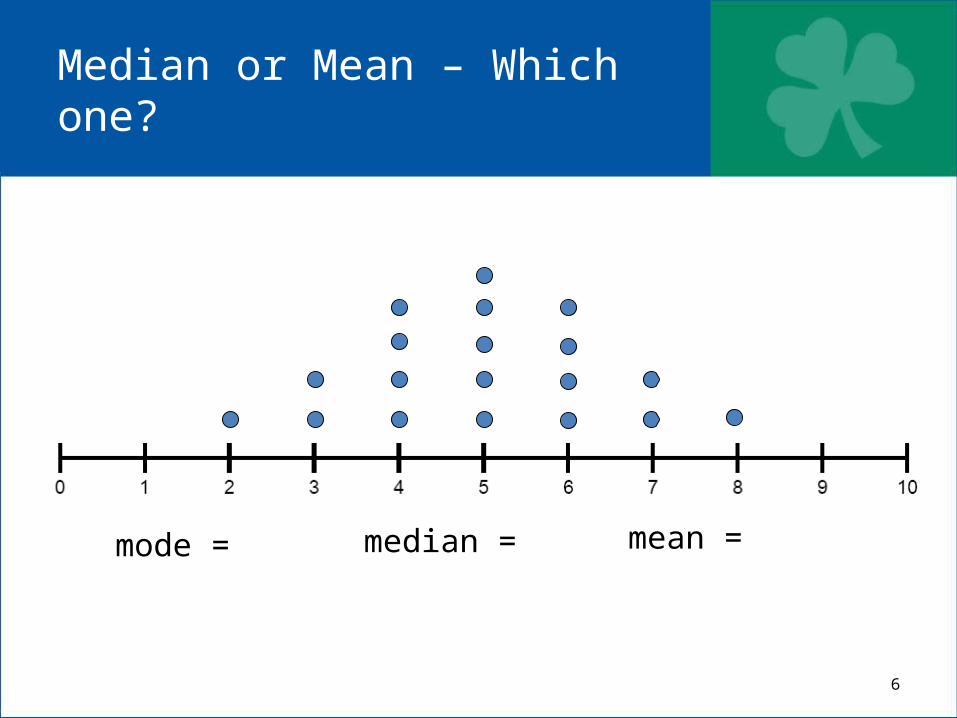
Median or Mean – Which one?
mean = median = mode =
7
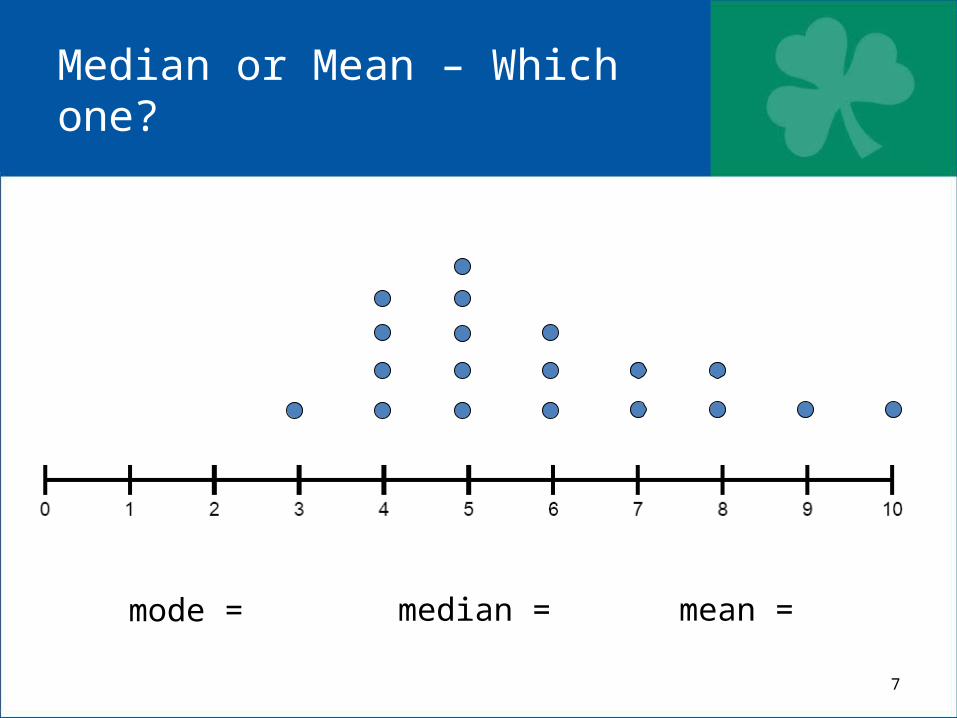
Median or Mean – Which one?
mean = median = mode =
8
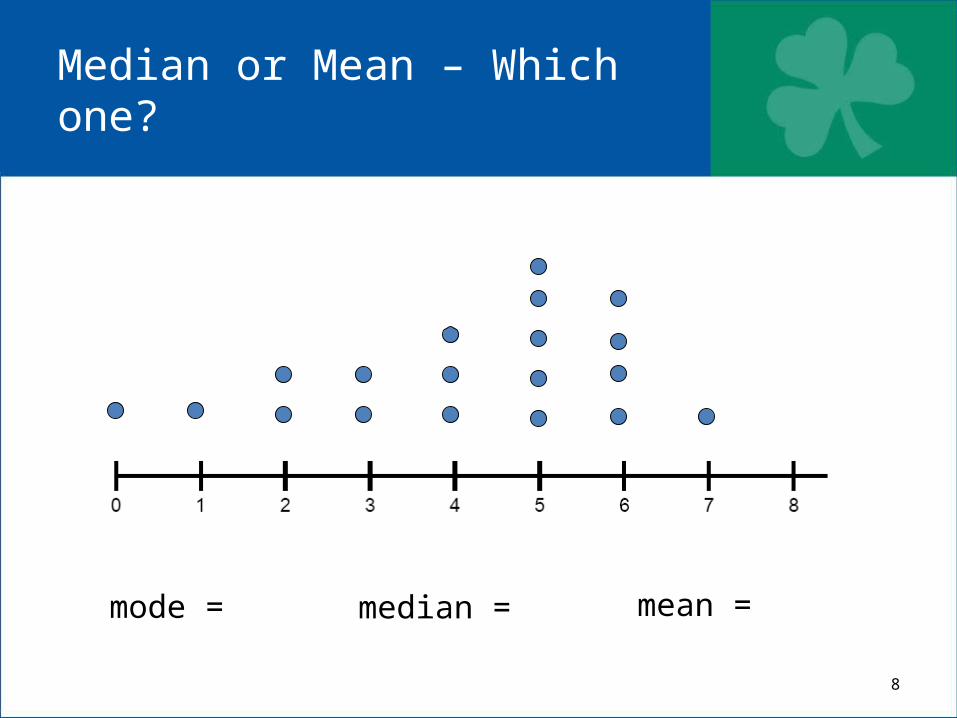
Median or Mean – Which one?
mean = median = mode =
9
Median or Mean – Which one?
• When the data is symmetrical and there are no outliers, either the mean or the median can be used to measure the centre
• When the data is clearly skewed and/or there are outliers, the median should be used to measure the centre.
• Exercise 3A Pages 59-60 Questions 1-8
10
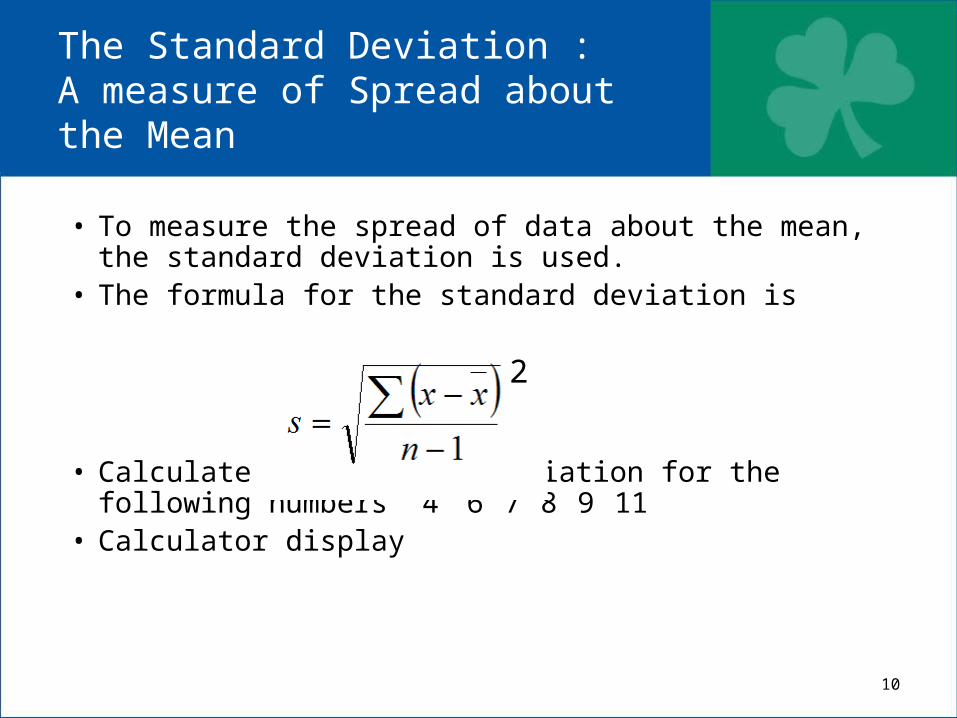
• To measure the spread of data about the mean, the standard deviation is used.
• The formula for the standard deviation is
• Calculate the standard deviation for the following numbers 46 7 8 9 11
• Calculator display
The Standard Deviation : A measure of Spread about the Mean
2
11
Estimating the Standard Deviation
• The standard deviation is approximately equal to the range divided by 4.
• Exercise 3B Pages 63-64 Questions 1 - 7
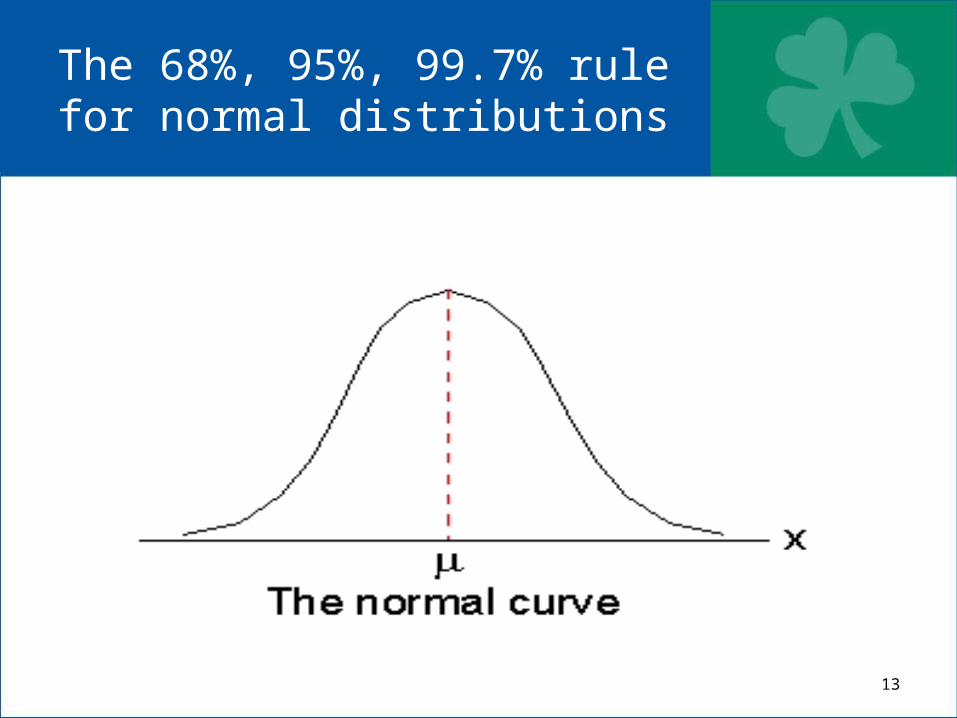
13
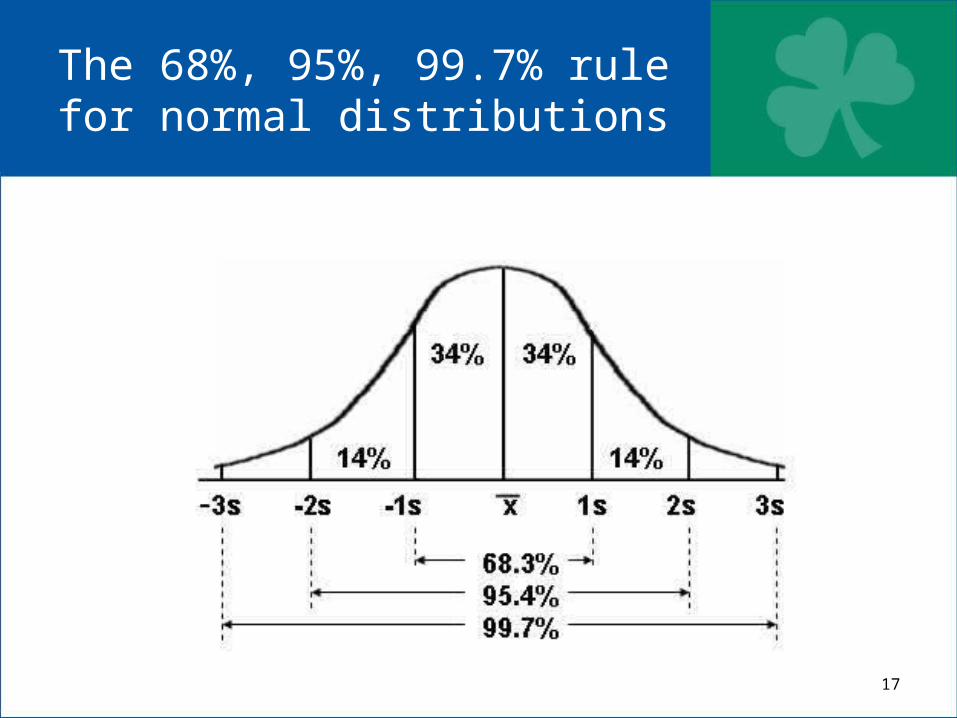
The 68%, 95%, 99.7% rule for normal distributions
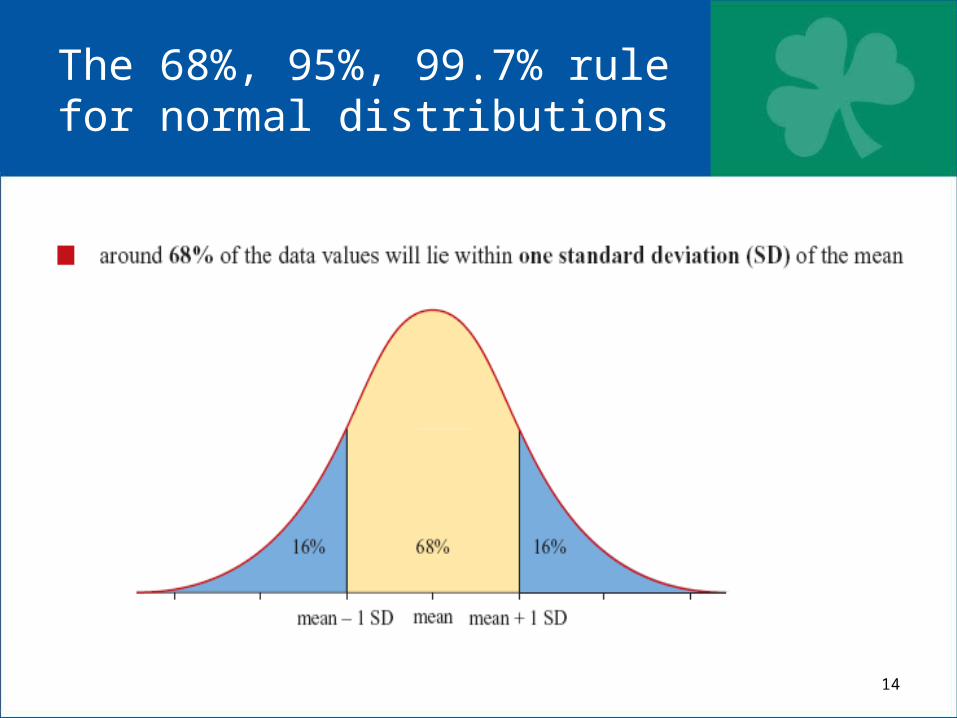
14
The 68%, 95%, 99.7% rule for normal distributions
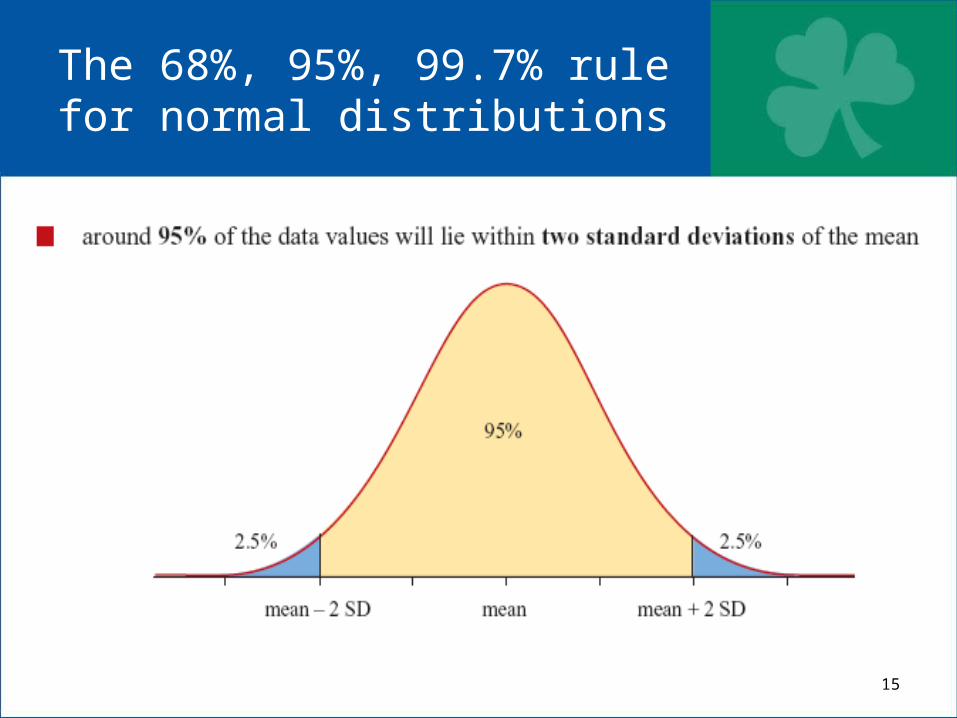
15
The 68%, 95%, 99.7% rule for normal distributions
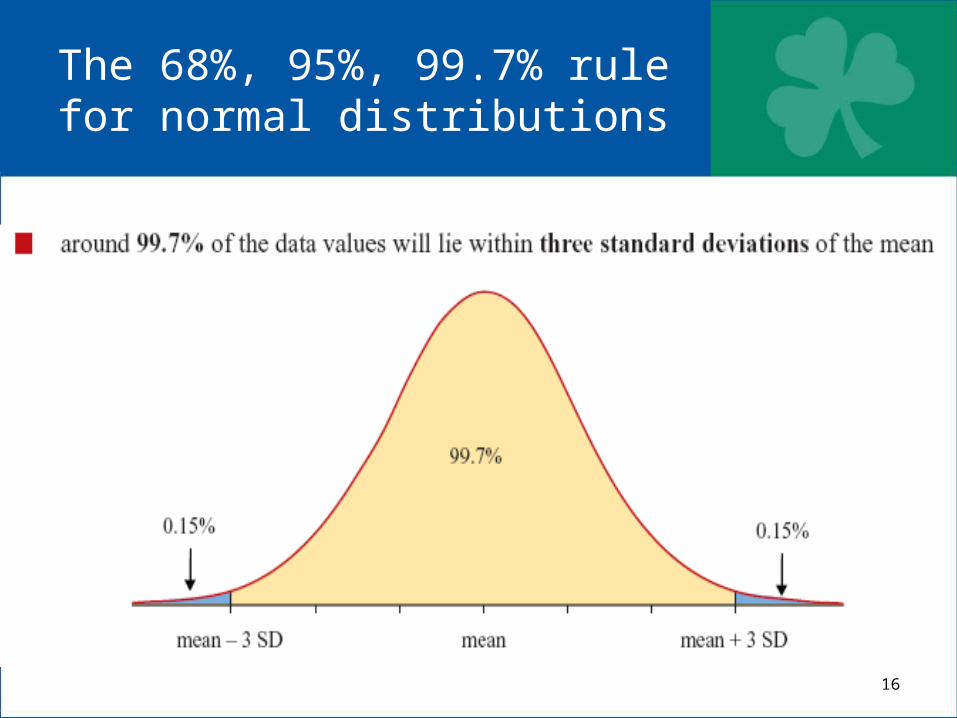
16
The 68%, 95%, 99.7% rule for normal distributions
17
The 68%, 95%, 99.7% rule for normal distributions
18
Example
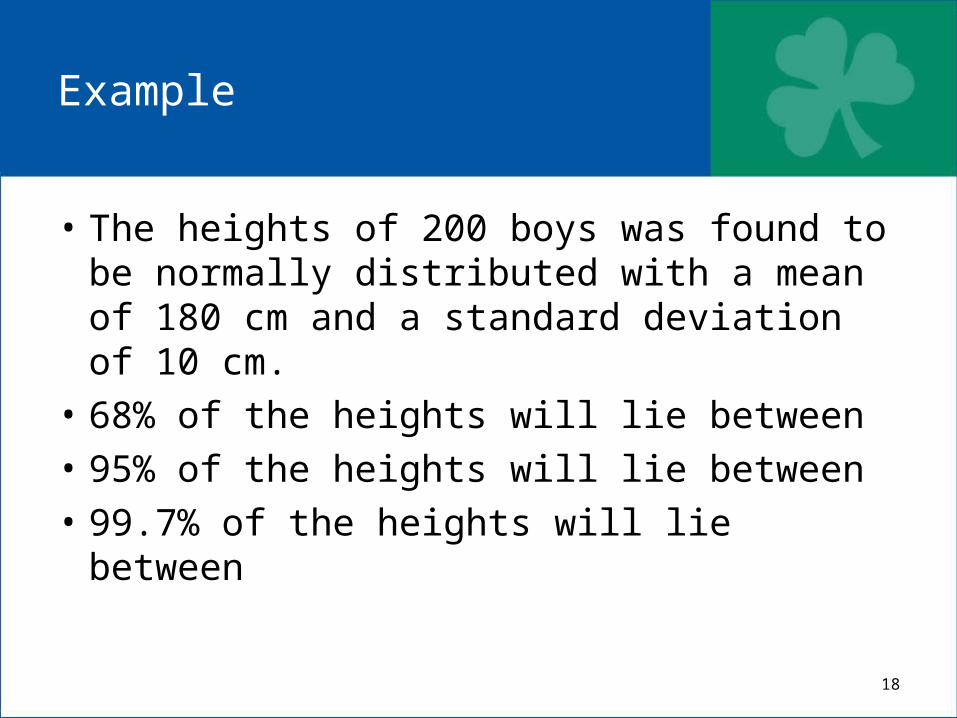
• The heights of 200 boys was found to be normally distributed with a mean of 180 cm and a standard deviation of 10 cm.
• 68% of the heights will lie between• 95% of the heights will lie between• 99.7% of the heights will lie between
19
Example
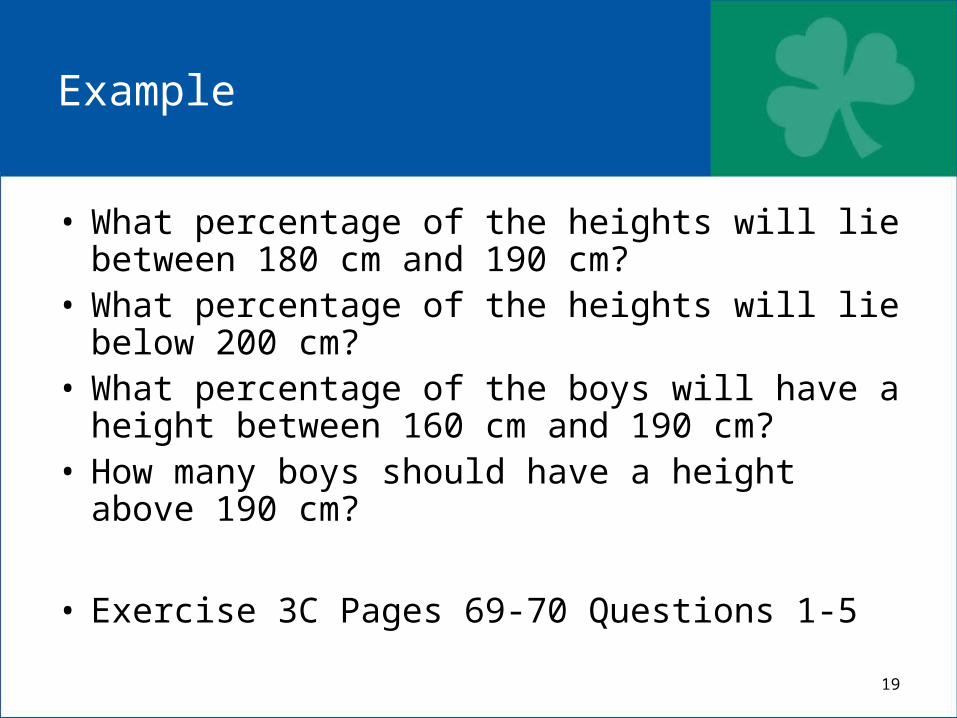
• What percentage of the heights will lie between 180 cm and 190 cm?
• What percentage of the heights will lie below 200 cm?
• What percentage of the boys will have a height between 160 cm and 190 cm?
• How many boys should have a height above 190 cm?
• Exercise 3C Pages 69-70 Questions 1-5
20
Z scores ( standardised scores)
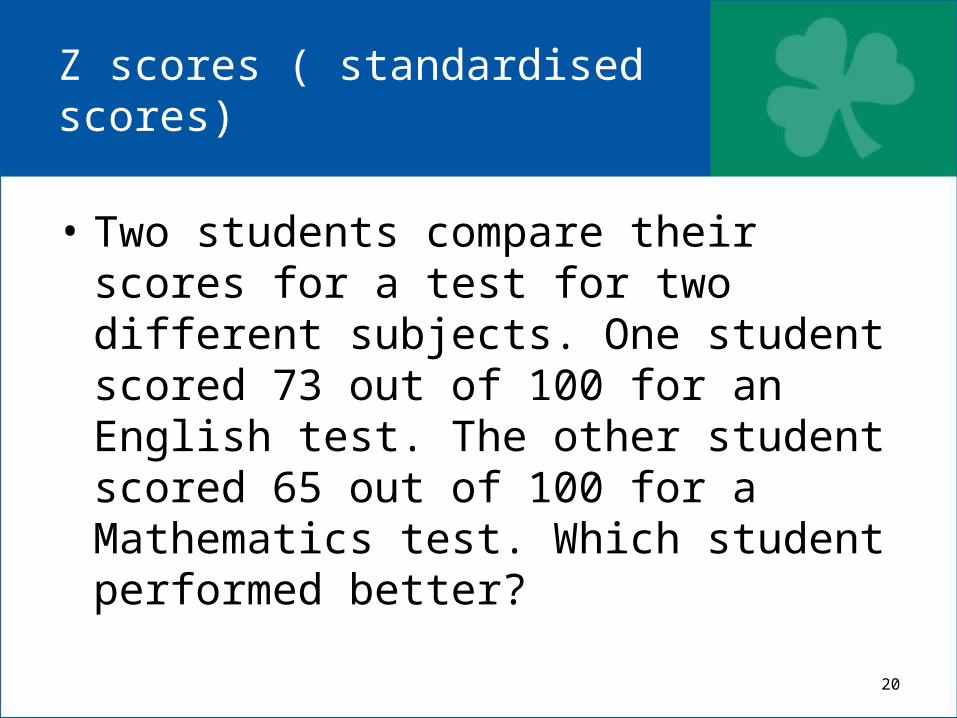
• Two students compare their scores for a test for two different subjects. One student scored 73 out of 100 for an English test. The other student scored 65 out of 100 for a Mathematics test. Which student performed better?
21
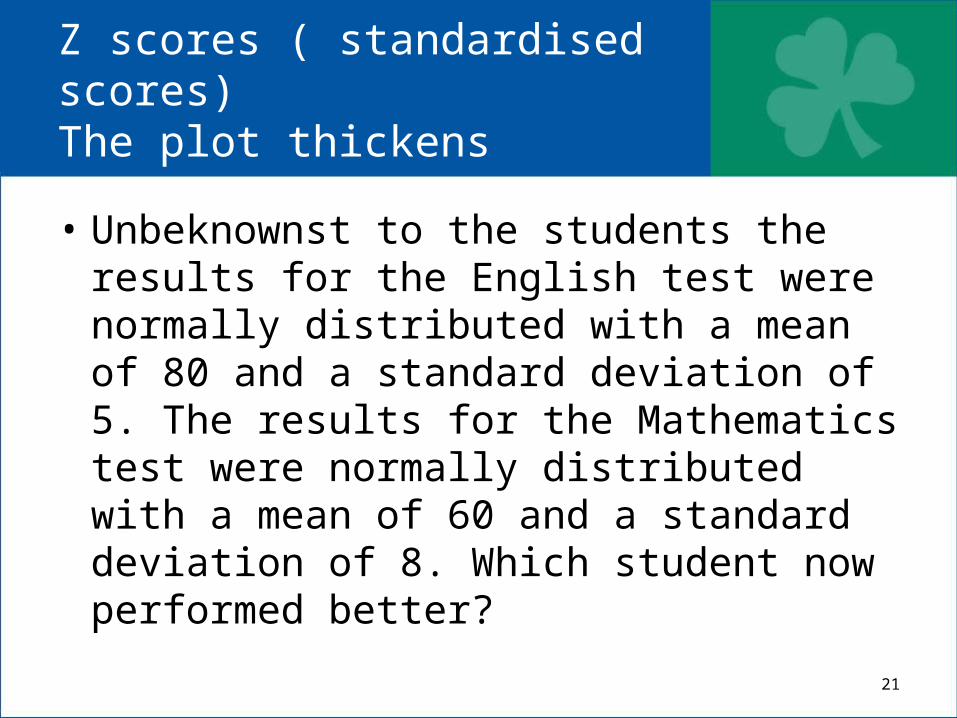
Z scores ( standardised scores)The plot thickens
• Unbeknownst to the students the results for the English test were normally distributed with a mean of 80 and a standard deviation of 5. The results for the Mathematics test were normally distributed with a mean of 60 and a standard deviation of 8. Which student now performed better?
22
Z scores
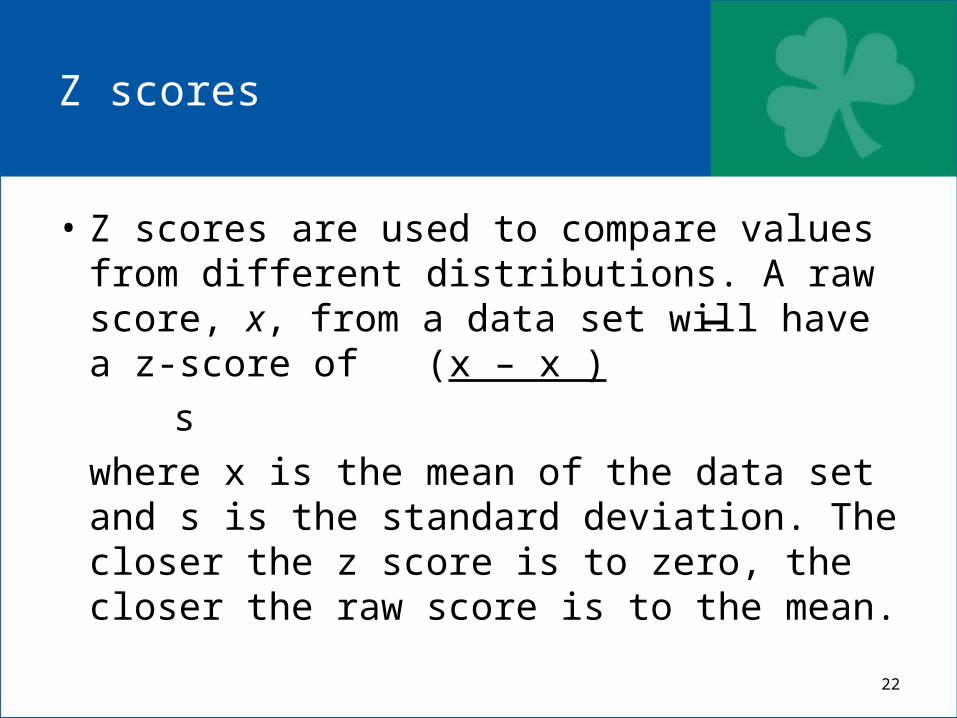
• Z scores are used to compare values from different distributions. A raw score, x, from a data set will have a z-score of (x – x )
swhere x is the mean of the data set and s is the standard deviation. The closer the z score is to zero, the closer the raw score is to the mean.
23
Z scores
24
Z scores
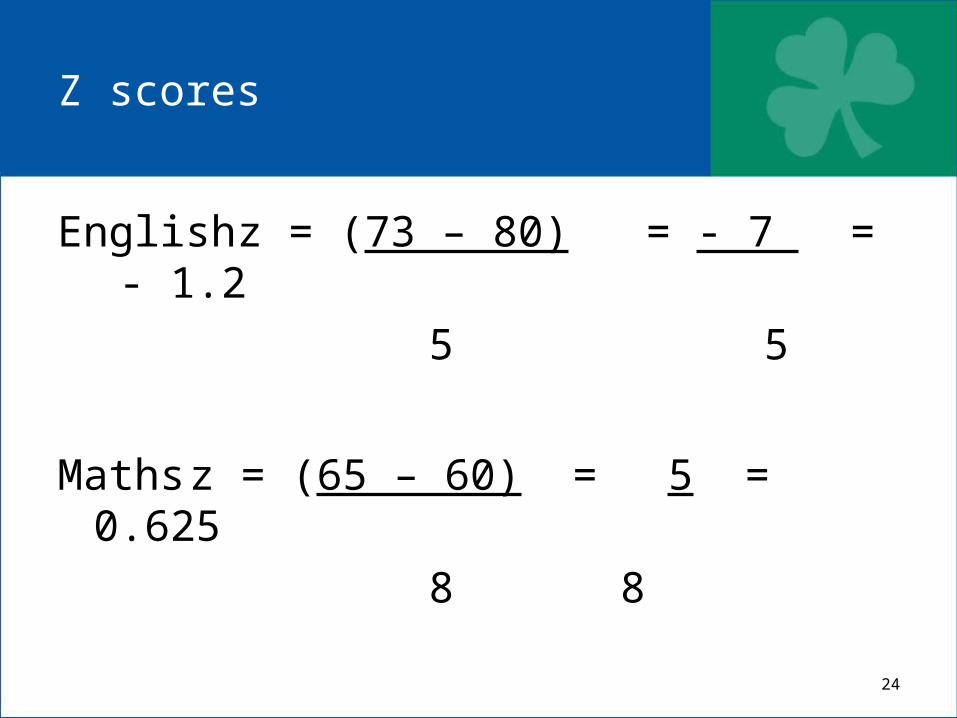
English z = (73 – 80) = - 7 = - 1.2 5 5
Maths z = (65 – 60) = 5 = 0.625 8 8
25
Questions
• Exercise 3D Page 72 Questions 1-2
26
Generating a random sample
• Draw numbers out of a hat• A spinner• Select every 2nd or 3rd person• Use technology
27
Using your calculator to generate a simple random sample
• TI NSpire• Rand(25) will generate numbers from 1 to 25
• Calculator demonstration
28
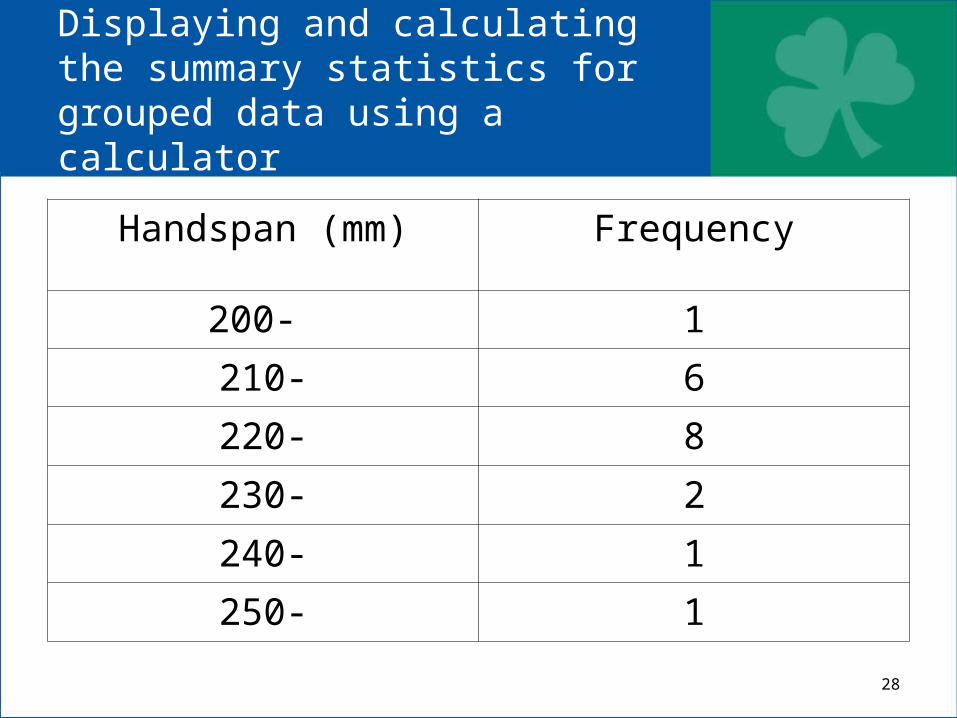
Displaying and calculating the summary statistics for grouped data using a calculator
Handspan (mm) Frequency
200- 1
210- 6
220- 8
230- 2
240- 1
250- 1

29

30