funding k-12 public education in...
TRANSCRIPT

Funding K-12 Public Education in NebraskaPresentation to the Revenue Committee and the Education
Committee of the Nebraska Legislature
Lincoln, Nebraska, August 28, 2015
Andrew Reschovsky, Ph.D.Fellow, Lincoln Institute of Land Policy
Professor Emeritus, University of [email protected]
Presentation Outline
Policy issues
Heavy reliance on the property tax for funding K-12 public education
Rapidly rising property taxes on agricultural property
Policy responses
Funding increases in state aid to education
Responding to the rise in property taxes on agricultural land
2

Policy Issue: Nebraska’s Heavy Reliance on the Property Tax for the Funding of K-12 Education
3
4
-10%
0%
10%
20%
30%
40%
50%
60%1
97
6-7
7
197
7-7
8
197
8-7
9
197
9-8
0
198
0-8
1
198
1-8
2
198
2-8
3
198
3-8
4
198
4-8
5
198
5-8
6
198
6-8
7
198
7-8
8
198
8-8
9
198
9-9
0
199
0-9
1
199
1-9
2
199
2-9
3
199
3-9
4
199
4-9
5
199
5-9
6
199
6-9
7
199
7-9
8
199
8-9
9
199
9-0
0
200
0-0
1
200
1-0
2
200
2-0
3
200
3-0
4
200
4-0
5
200
5-0
6
200
6-0
7
200
7-0
8
200
8-0
9
200
9-1
0
201
0-1
1
201
1-1
2
201
2-1
3
Sh
are o
f G
en
era
l R
ev
en
ue
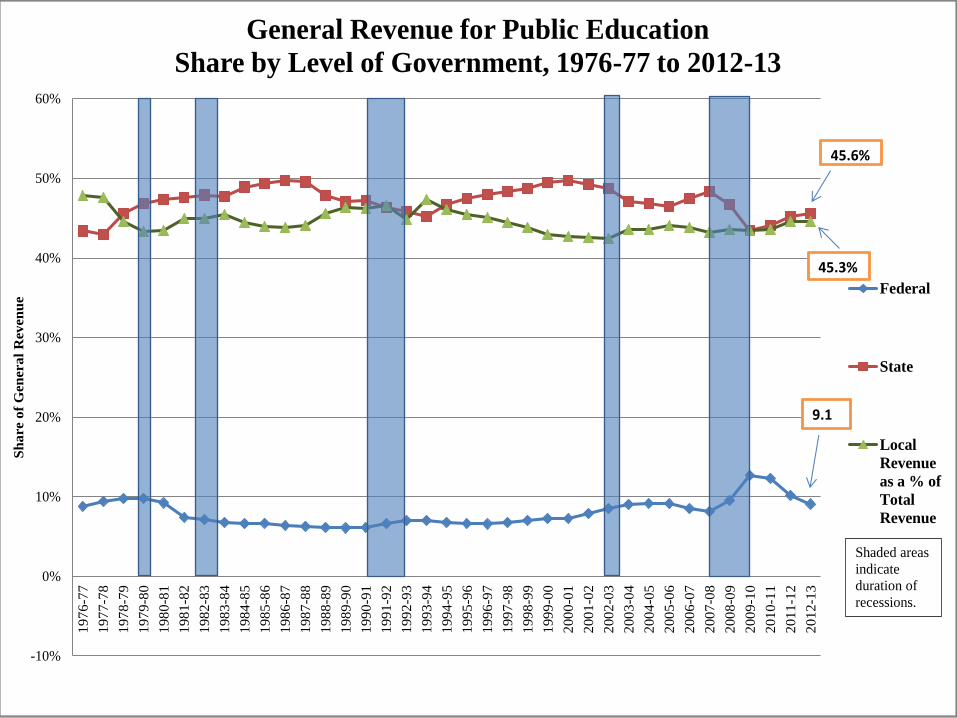
General Revenue for Public Education
Share by Level of Government, 1976-77 to 2012-13
Federal
State
Local
Revenue
as a % of
Total
Revenue
45.3%
9.1
45.6%
Shaded areas
indicate
duration of
recessions.

5Source: National Center for Education Statistics, Public Elementary-Secondary Education Finances, Fiscal Year 2013.

The Role of the Property Tax in Funding Public Education, 2011-12
6
Local Property Tax
as a % of Total
Total Revenue
New Hampshire 95.6% 57.4% 54.9%
Connecticut 97.3% 56.1% 54.6%
Illinois 88.3% 59.6% 52.6%
New Jersey 94.3% 55.1% 52.0%
Rhode Island 97.3% 53.3% 51.9%
Massachusetts 94.1% 54.1% 50.9%
Nebraska 85.2% (14) 59.6% (1) 50.8%
Average state 76.0% 41.7% 32.8%
Tennessee 47.9% 40.7% 19.5%
Idaho 83.3% 23.3% 19.4%
Minnesota 64.0% 28.6% 18.3%
Louisiana 41.9% 39.8% 16.7%
Alabama 46.8% 32.8% 15.3%
New Mexico 80.2% 17.0% 13.7%
Alaska 56.9% 21.0% 11.9%
Source: Calculations using data from the National Center for Education Statistics, National
Public Education Financial Survey Data, 2015. Available at nces.ed.gov/ccd/stfis.asp.
Property Tax
as a % of
Local Revenue
Local Revenue
as a % of
Total Revenue

Sources of Nebraska Education Revenue
7Source: National Center for Education Statistics, National Public Education Financial Survey

8
Nebraska = $1,592, U.S. average = $1,307
Source: U.S. Census Bureau, State and Local Government Finances
9
Nebraska = $1,592, U.S. average = $1,307
Source: U.S. Census Bureau, State and Local Government Finances
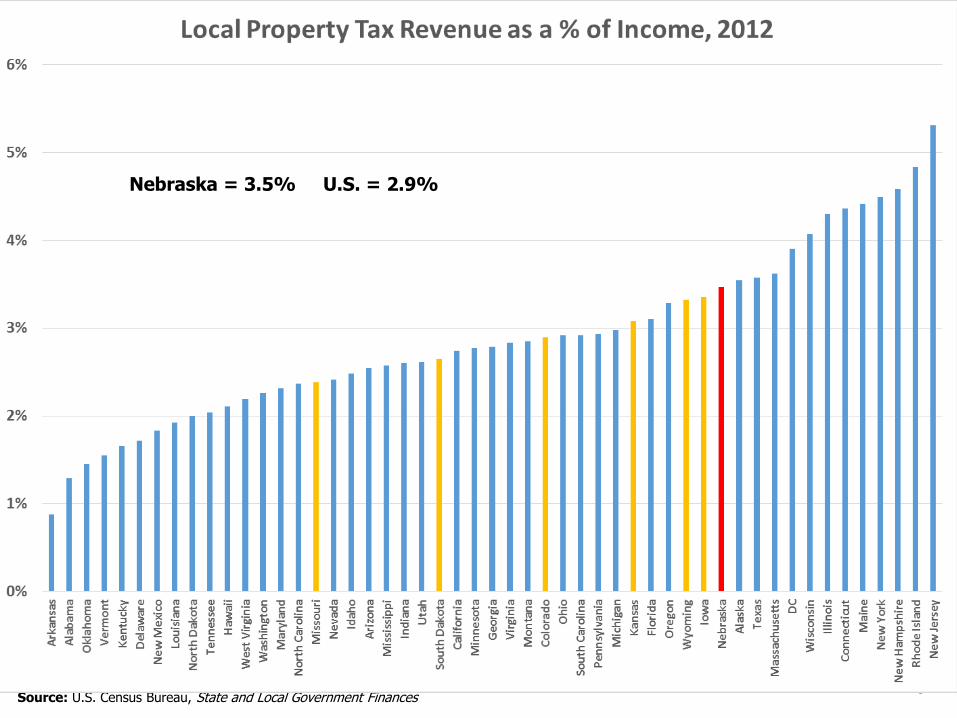
Nebraska = 3.5% U.S. = 2.9%

Property Tax Revenue as a % of Personal Income, 2012
10

11Source: U.S. Census Bureau, American Community Survey, 2008-2012
Average property tax burden: U.S. = 4.3% Nebraska = 4.3%
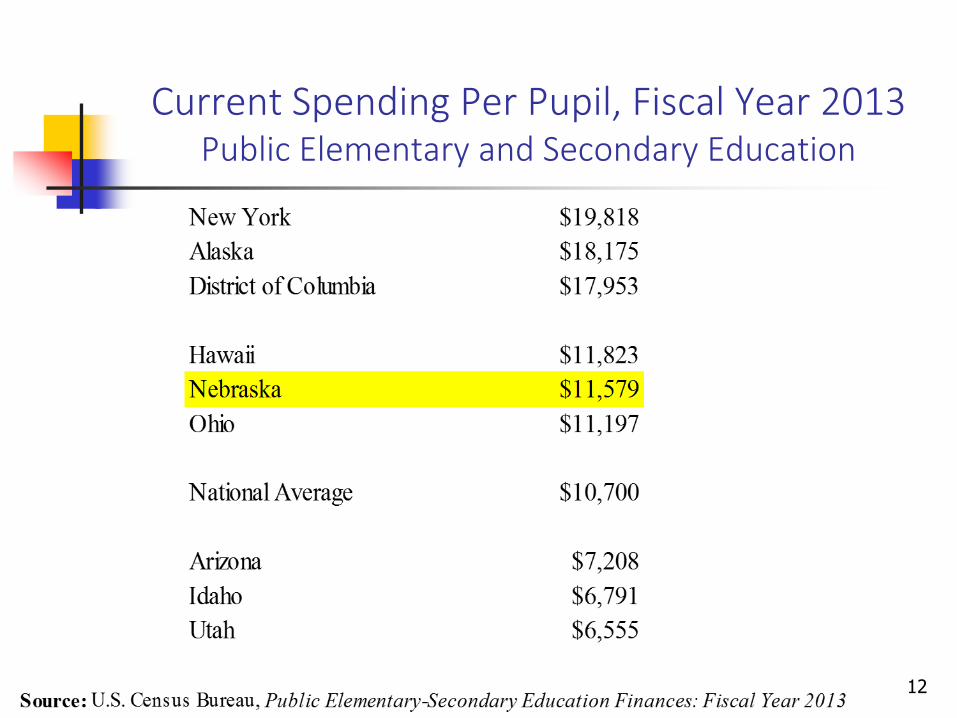
Current Spending Per Pupil, Fiscal Year 2013Public Elementary and Secondary Education
12

Nebraska’s High Quality Public Schools
Public schools are generally considered to be of high quality
Student performance on National Assessment of Education Progress (NAEP) above national averages
13
Nebraska U.S. Average
8th Grade Reading 285 284
8th Grade Mathematics 269 266

Policy Issue: Rapidly Rising Property Taxeson Agricultural Property
14

Growth in Agriculture’s Share of Total Property Values and Total Property Tax Levies, 2004-2014
15
15.0%
20.0%
25.0%
30.0%
35.0%
40.0%
45.0%
2004 2005 2006 2007 2008 2009 2010 2011 2012 2013 2014
Ag Share of Property Value Ag Share of Property Tax Levy

Property Tax Levy by Type of Property2004 and 2014
Agriculture, 32.0%
Residential, 45.3%
Commerical, Industrial & Mineral,
19.8%
Railroad, 1.9%Public Service &
Other, 1.1%
2014
16

Growth in Agriculture Property Tax Levies perFarmer & Rancher Income Tax Return, 2004-2014
17
$20,000
$25,000
$30,000
$35,000
$40,000
$45,000
$50,000
2004 2005 2006 2007 2008 2009 2010 2011 2012 2013 2014
Nominal Dollars 2014 Dollars
Average rate of increase (nominal $) = 7.9%(2014 $) = 5.5%
Rate of increase, 2013-2014 (nominal $) = 13.9%(2014 $) = 12.0%

Average Agriculture Property Tax Levy Rate 2004-2014
181.0%
1.1%
1.2%
1.3%
1.4%
1.5%
1.6%
1.7%
1.8%
2004 2005 2006 2007 2008 2009 2010 2011 2012 2013 2014
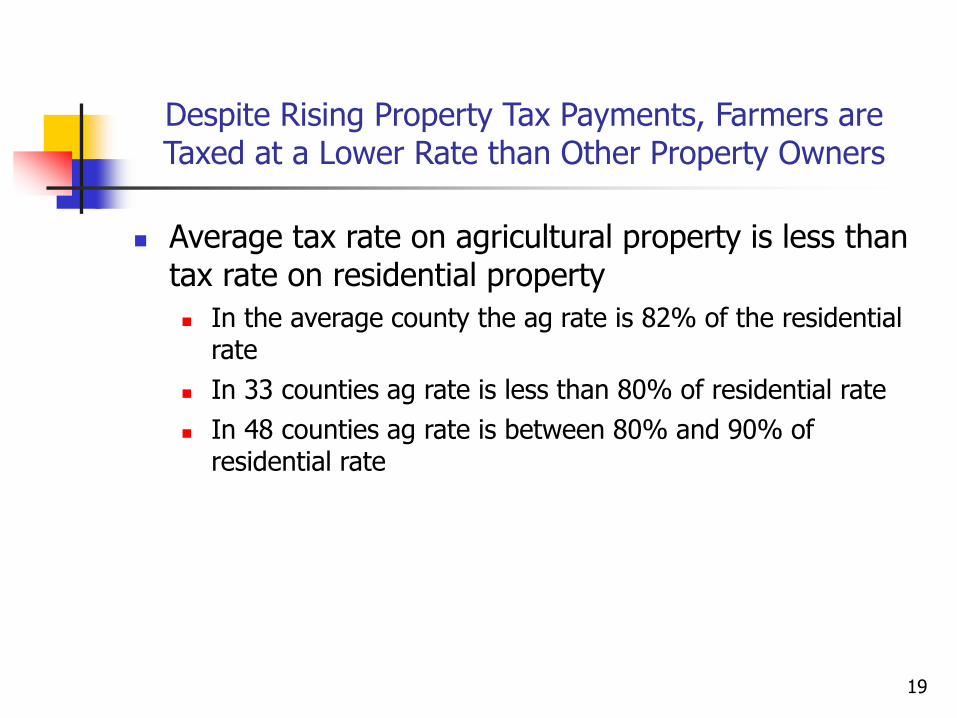
Despite Rising Property Tax Payments, Farmers are Taxed at a Lower Rate than Other Property Owners
Average tax rate on agricultural property is less than tax rate on residential property
In the average county the ag rate is 82% of the residential rate
In 33 counties ag rate is less than 80% of residential rate
In 48 counties ag rate is between 80% and 90% of residential rate
19

Why Are Agricultural Property Tax Levies Rising?
Local officials may find it easier to raise total levies because they can do so while lowering tax rates
Evidence (Anderson and Thompson) shows that over past decade school districts increased their levies by about 8% for every 10% increase in valuation
20

Why Are Agricultural Property Tax Levies Rising?
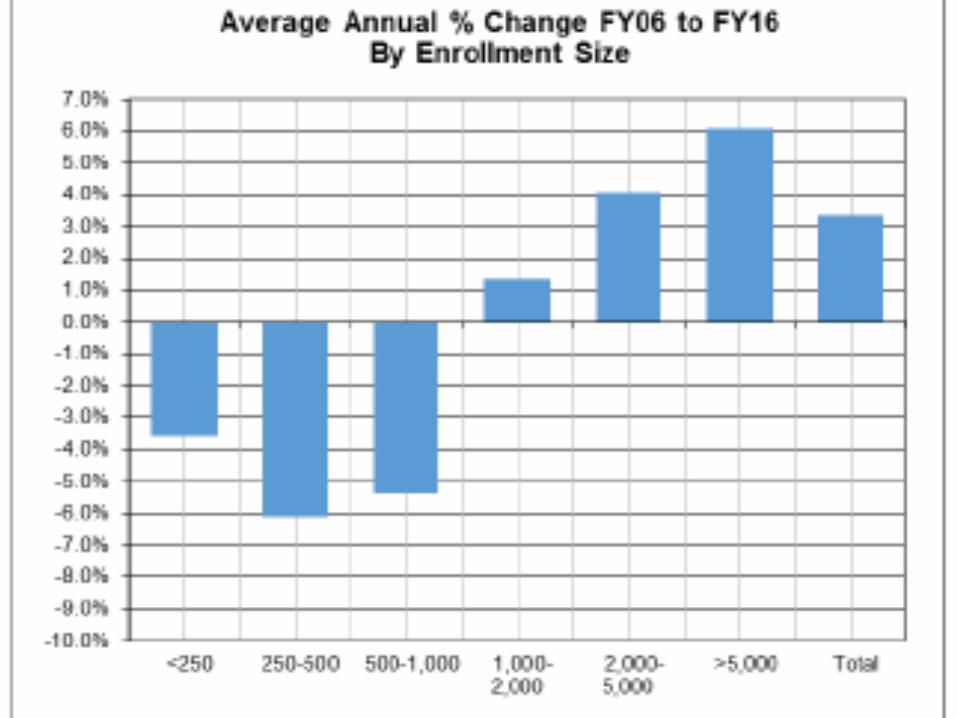
The rising costs of education, especially in small school districts
Spending per student is >50% higher than average in small (<250 students) districts
Average annual growth in per pupil spending 2004 to 2014 was 6.2% in small districts compared to 3.1% in large districts (>5,000 students)
School districts with <1,000 students have experienced declining enrollment in the past 10 years
About a 20% decline in enrollment in the smallest districts
Cutting spending in response to declining enrollment is very difficult
21

Why Are Agricultural Property Tax Levies Rising?
The combination of rising valuations and falling enrollment leads to reductions in equalization aid
Between 2007-08 & 2012-13, 60 districts lost all their equalization aid, and 30 districts lost more than ½ their aid
These districts were almost all rural
Over past decade, largest percentage declines in TEEOSA aid in small school districts (between 250 and 500 students)
In small districts (<1,000 students), state support is less than 25% of total school district revenue
About 55% of total state support comes from TEEOSA aid
22
23

Revenue Options for Funding IncreasedState Aid for K-12 Education
24

25
Tax Analysis Criteria
The efficiency of the tax
How does each tax effect the behavior/actions of individuals and businesses?
Does a tax reduce the competiveness of a state?
Revenue growth and volatility
Will tax revenues grow as the economy grows?
How volatile is revenue over the course of a business cycle?
Transparency and visibility
Tax fairness Two questions:
Who pays the tax? What is the incidence of the tax? (positive) Is the distribution of tax burdens fair? (normative)
Consider horizontal and vertical equity
Administrative feasibility Is the tax simple to administer and to comply with?

No Tax System or Tax PolicyWill Meet All the Criteria
All tax policy decisions require making trade-offs
Tax credits to enhance competitiveness will reduce simplicity
Highly progressive tax systems may hurt tax competiveness
Reduced revenue volatility often leads to a more regressive tax system
A well-balanced tax system can do a reasonably good job in achieving all the criteria
Reason that the Tax Modernization Committee chose “Balance” as the first criteria of a good tax system
26

Characteristics of Nebraska’s Tax System
27

Mix of State and Local Taxes, 2012Nebraska Compared to the United States
28
32.1%
22.1%
3.5%
22.7%
11.6%
1.8%
6.1%
36.4%
22.6%
2.9%
23.2%
7.3%
5.1%
2.5%
0.0%
5.0%
10.0%
15.0%
20.0%
25.0%
30.0%
35.0%
40.0%
Property IndividualIncome
CorporateIncome
General Sales Selective Sales Motor VehicleLicense
Other Taxes
United States Nebraska

29Source: ITEP, Who Pays? A Distributional Analysis of the Tax Systems in all 50 States, 2015.

Annual Percentage Change in Nebraska State and LocalTax Revenue, by Type of Tax, 1992-2012
30
-30%
-20%
-10%
0%
10%
20%
30%
40%
50%
1992 1993 1994 1995 1996 1997 1998 1999 2000 2001 2002 2003 2004 2005 2006 2007 2008 2009 2010 2011 2012
Property Tax Sales Tax Select Sales Tax Individual Income Tax Corporate Income Tax
Increasing Individual Income Taxes to
Fund Additional State Aid to Education
31
Income Tax Policy
Nebraska has a quite good income tax system
Revenue could be increased by raising rates and/or adjusting brackets
Revenue could also be raised by reducing use of exemptions or credits
32

Income Tax Policy Considerations
Taxpayers can deduct state income tax payments on their federal income taxes (the federal offset)
Deductibility reduces the effective marginal tax rate difference between Nebraska and its neighbors
33

Income Tax Policy Considerations
Resist the temptation to use the income tax to achieve non-fiscal goals
Credits are a way to subsidize some activity
It is preferable to provide direct subsidies—they have the same impact on the budget, but they are much easier to curtail when budgets are tight or priorities change
34

Income Tax Policy Considerations
How to tax Social Security and pension income?
There are few economic justifications to treat these sources of income any different from other income
Favorable treatment of retirement income means that young families with children pay more
With the aging of the baby boom generation, the revenue costs of favorable treatment of retirement income will grow rapidly in the coming decades
A broader income tax base will generate more revenue and/or allow lower marginal tax rates
35

Increasing Sales Taxes to
Fund Additional State Aid to Education
36

Sales Tax Policy
An “ideal” sales tax system taxes the final consumption of all goods and services, but exempts all purchases of goods and services by businesses
Taxing business inputs leads to pyramiding
Exemptions of some necessities are justified as a way of protecting the poor by reducing the regressivity of the tax
Note that services now make up 64% of total consumption expenditures
37

Sales Tax Policy
To increase sales tax revenue Nebraska could:
Raise its rate
Abolish some of its existing exemptions
Expand the base to cover more consumer services
38

Sales Tax Policy
An ever increasing share of consumer spending is being done over the internet
In addition to internet sales, “cloud” purchases, such as music streaming, are growing very rapidly and most are escaping sales taxation
Allowing states to tax internet commerce in the absence of nexus will require Congressional action
The Marketplace Fairness Act passed by the Senate or an alternative
39

Increasing Corporate Income Taxes to
Fund Additional State Aid to Education
40

Corporate Income Tax Policy
Reduce or eliminate existing credits and exemptions States often enact credits and exemptions in order to help
specific industries or reward particular activities
The effectiveness of these subsidies/incentives is rarely evaluated
41

Policies to Address Rising Agriculture Property Taxes
42

Value Ag Property at 65% of Use Value
Down from 75%
Won’t reduce taxes in many communities, where ag property is a large % of total value
Elsewhere, will shift tax burden from farmers to non-farmers and other property owners in the same community
When ag values fall, lower ag taxes will place an increased burden on owners of non-ag property
On average, farmers have higher incomes than non-farmers
43

Average Income (Federal AGI) of Nebraska Farmers and Ranchers, 2003 to 2013
44$20,000
$30,000
$40,000
$50,000
$60,000
$70,000
$80,000
$90,000
$100,000
$110,000
$120,000
2003 2004 2005 2006 2007 2008 2009 2010 2011 2012 2013

What About Farmers/Ranchers Who Face Rising Property Taxes, but Have Low Incomes?
Four approaches:
Change property tax policy
Reduce reliance on the property tax by increasing state education aid
Change the school aid formulas in a way that benefits school districts with lots of ag property
Education policies designed to reduce costs in small, rural school districts
45

Two Property Tax Policies that Could Help Farmers (and others) Facing Large Property
Tax Bills Relative to their Incomes
Real problem is one of liquidity
Farmers have an asset (land) that is growing rapidly in value, but their current income is inadequate to pay the property tax
Establish a tax deferral program
Establish a circuit breaker program
46

Tax Deferral Programs
Similar to a reverse equity mortgage
Local government lends taxpayer money to pay a portion of property tax, with loan paid back in future or when property sold
Can be triggered when tax is above a threshold % of income, or when tax increases at a very rapid rate
Could be an “opt out” program
Could be funded by state using bond funds
47

Circuit Breaker Programs
Circuit breakers target property tax relief to those taxpayers who face particularly high property tax burdens (property tax as a % of their income)
48

Property Taxes as a Percentage of IncomeWithout a Circuit Breaker
49

Property Taxes as a Percentage of IncomeWith a 5% Threshold Circuit Breaker
50

Circuit Breaker Programs
Renters are eligible for some programs by assuming that the property tax is equal to a fixed % of rent, e.g. 20% (lower if rent includes utilities)
Often paid as a refundable income tax credit
Many states limit circuit breakers to the elderly
Programs generally have income eligibility limits and maximum benefit levels
51

State-Funded Circuit Breaker Programs, 2009
52

Circuit Breaker Parameters for Selected States, 2012
53
State
All ages or
elderly only
Renters eligible
(yes/no) Income Ceiling
Maximum
Benefit Maximum Value
Iowa Elderly Yes $20,096 S1,000
Massachusetts Elderly Yes $80,000 $1,000 $705,000
New Jersey All
Yes, elderly
only
$75,000 (<65)
$150,000 (>65)
formula
determined $10,000 tax
Wisconsin All Yes $24,680 $1,168
Minnesota All Yes
$100,780 (owners)
$54,620 (renters)
$2,460 (owners)
$1,550 (renters)
Kansas Elderly Yes $32,400 $700 $350,000
Source: Lincoln Institue of Land Policy, Significant Features of the Property Tax

Nebraska’s Property Tax Relief Programs
54

Percentage Reduction in Property Tax from Nebraska Elderly Homestead Exemption
(For below average assessed values in a county withaverage assessed value equal to $100,000)
55
0%
10%
20%
30%
40%
50%
60%
70%
80%
90%
100%
Up to$31,000
$31,001 -$32,700
$32,701 -$34,400
$34,401 -$36,000
$36,001 -$37,700
$37,701 -$39,300
$39,301and above

Percentage Property Tax Savings of Median Homeownerfrom Property Tax Exemption and Credit Programs
(available to all property owners)
56
0.0%
10.0%
20.0%
30.0%
40.0%
50.0%
60.0%
70.0%
IN SC UT LA AR MS ID FL AZ WI AL DC OH MN OK TX ME IL NY NM NE IA GA KS CA
Source: Lincoln Institute of Land Policy, Significant Features of the Property Tax

Median Tax Savings for Homeowners fromNebraska’s Property Tax Credit, 2012
57
$54
$64
$75
$93
$132
$0
$20
$40
$60
$80
$100
$120
$140
Lowest Second Middle Fourth Highest
Me
dia
n T
ax S
avin
gs f
rom
Pro
pe
rty
Tax
Cre
dit
Income Quintiles of Nebraska Homeowners
Below $20,006 $20,007-$36,591 $36,592-$57,020 $57,021-$89,037 Above $89,037
Source: Lincoln Institute of Land Policy, Significant Features of the Property Tax

What About Farmers/Ranchers Who Face Rising Property Taxes, but Have Low Incomes?
Four approaches:
Change property tax policy
Reduce reliance on the property tax by increasing state education aid
Change the school aid formulas in a way that benefits school districts with lots of ag property
Education policies designed to reduce costs in small, rural school districts
58

What About Farmers/Ranchers Who Face Rising Property Taxes, but Have Low Incomes?
Four approaches:
Change property tax policy
Reduce reliance on the property tax by increasing state education aid
Change the school aid formulas in a way that benefits school districts with lots of ag property
Education policies designed to reduce costs in small, rural school districts
59

Increasing State Aid to Small, Rural Districts
Rising property taxes on farm land reflect increases in school costs in rural district and reductions in state aid
State aid formulas could be adjusted to account for higher costs in small school districts
Some states have categorical “sparsity” aid
60

What About Farmers/Ranchers Who Face Rising Property Taxes, but Have Low Incomes?
Four approaches:
Change property tax policy
Reduce reliance on the property tax by increasing state education aid
Change the school aid formulas in a way that benefits school districts with lots of ag property
Education policies designed to reduce costs in small, rural school districts
61

Education Policies to Reduce Costsof Rural Education
Further school consolidations are limited by large distances students would have to travel
New two-way video communication technology can allow for multi-location classrooms
Expanded distance education can reduce per pupil costs
State may want to consider grants for needed capital expenditures to implement new technology
62

In Defense of the Property Tax
63

The Strengths of the Property Tax
Over time, the most stable source of revenue for public schools has been the property tax
During the past 2 recessions, state aid was cut in most states
Between 2009 and 2012, school property tax revenue per pupil rose modestly
Heavily reliance on state funding effectively eliminates local control of public education
Lesson from California was substantial reduction in support for public education
Alternative local sources of education funding are all problematic 64

The Strengths of the Property Tax
The fact that the property tax is highly visible is a political liability, but also a virtue
School board accountability to residents is enhanced when they see clearly the link between what they pay each year and public services received
Other taxes tend to be “hidden”; the result is less transparency and accountability
A well-administered property tax system combined with a well-designed state aid system can deliver both educational excellence and tax relief
65

Thank You.
Questions and Comments?
66