arkansas’ k-12 achievement & nsla funding september 4, 2013 aaea 1
TRANSCRIPT
Arkansas’ K-12 Achievement & NSLA Funding
September 4, 2013
AAEA
1
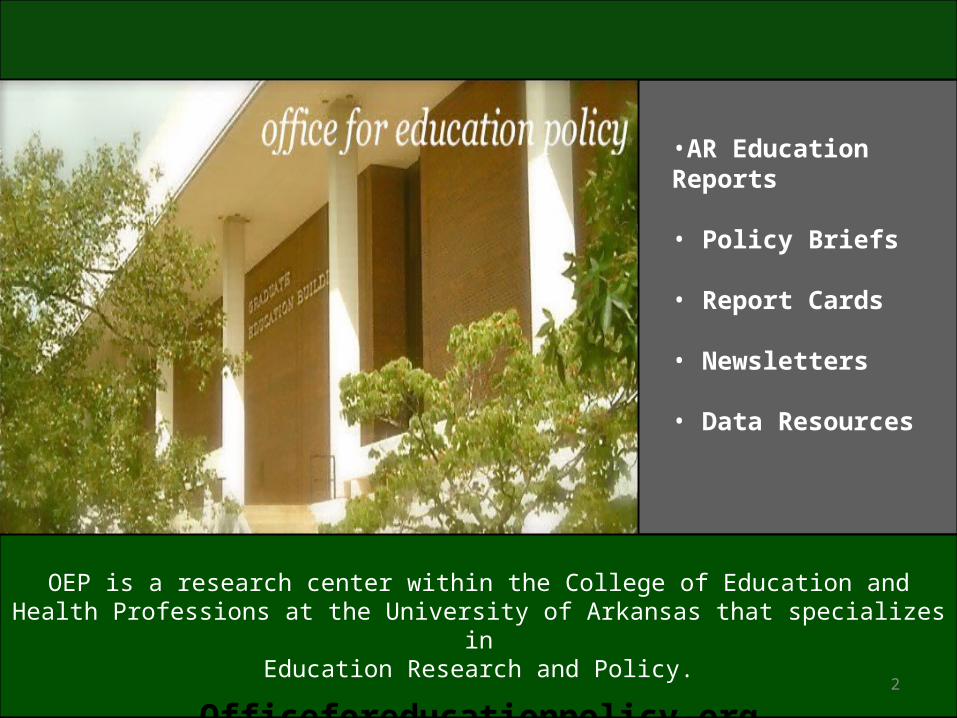
OEP is a research center within the College of Education and Health Professions at the University of Arkansas that specializes in
Education Research and Policy.
Officeforeducationpolicy.org
•AR Education Reports
• Policy Briefs
• Report Cards
• Newsletters
• Data Resources
2
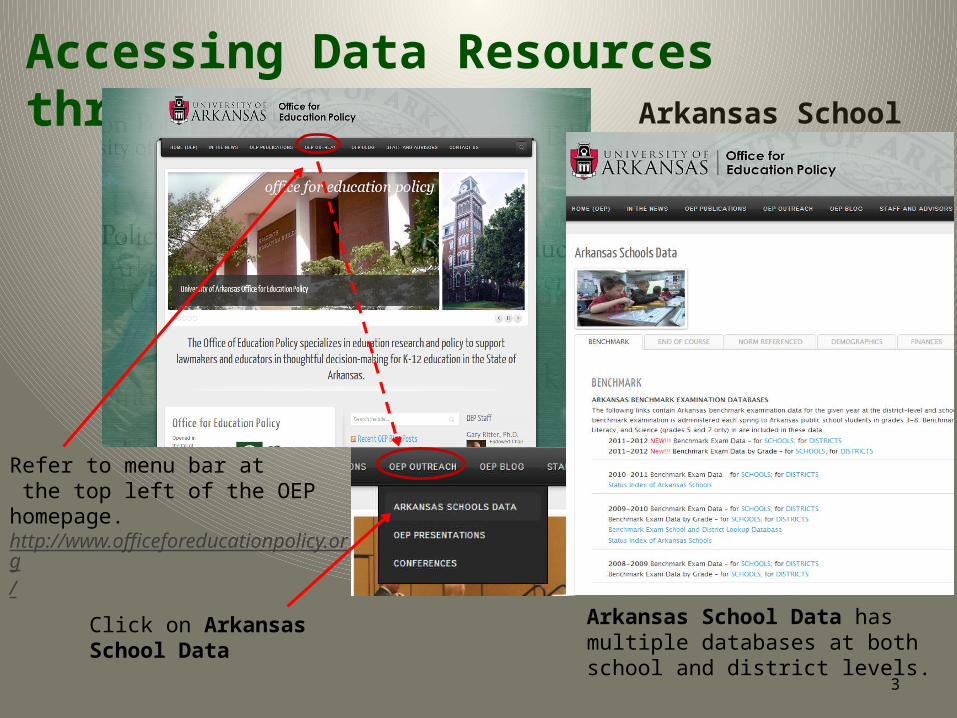
Refer to menu bar at the top left of the OEP homepage. http://www.officeforeducationpolicy.org/
OEP Homepage
Click on Arkansas School Data
Accessing Data Resources through the OEP
Arkansas School Data has multiple databases at both school and district levels.
Arkansas School Data
3
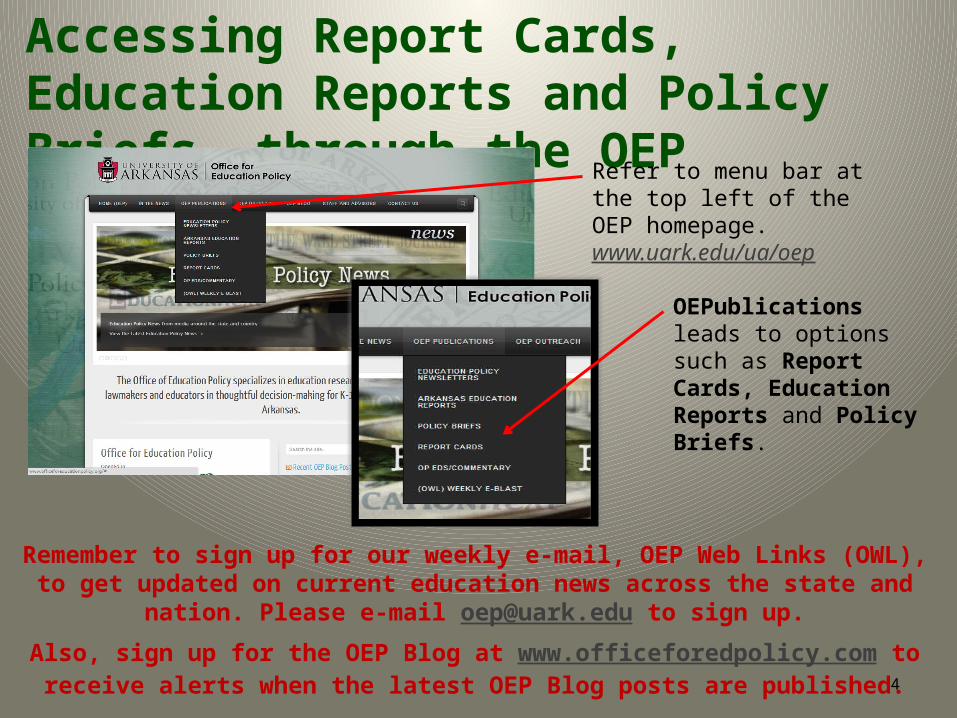
Accessing Report Cards, Education Reports and Policy Briefs through the OEP
Refer to menu bar at the top left of the OEP homepage. www.uark.edu/ua/oep
OEPublications leads to options such as Report Cards, Education Reports and Policy Briefs.
Remember to sign up for our weekly e-mail, OEP Web Links (OWL), to get updated on current education news across the state and nation. Please e-mail [email protected] to sign
up.
Also, sign up for the OEP Blog at www.officeforedpolicy.com to receive alerts when the latest OEP Blog posts are published. 4
OEP Outreach
• We at the OEP believe that teacher quality is important and that all Arkansas classrooms should be lead by a qualified teacher.
• The Arkansas Teacher Corps (ATC) program is a collaborative partnership between the University of Arkansas, school districts, and local community organizations that aims to provide an accelerated path to teaching for the highest-performing and most talented individuals to have a lasting impact on students and communities in Arkansas.
arkansasteachercorps.org5
Outline
1. Overall Achievement: Are we 5th or 49th? - Benchmark- NAEP
2. The NSLA Funding Question- Has NSLA funding produced gains for FRL
students?- How have districts spent NSLA funding?
3. Our Recommendations for NSLA Funding
6
Overall AR Achievement:
How was Arkansas’ performance on the Benchmark and End-of-Course
Exams in 2012-13? Over time?
7
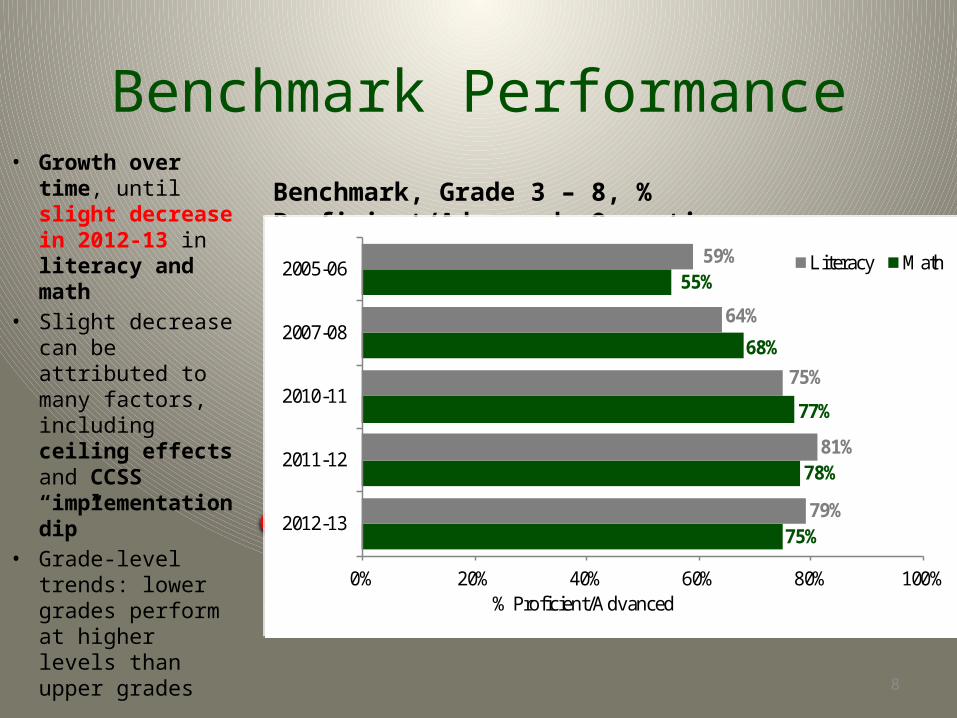
Benchmark Performance• Growth over
time, until slight decrease in 2012-13 in literacy and math
• Slight decrease can be attributed to many factors, including ceiling effects and CCSS “implementation dip”
• Grade-level trends: lower grades perform at higher levels than upper grades
75%
78%
77%
68%
55%
79%
81%
75%
64%
59%
0% 20% 40% 60% 80% 100%
2012-13
2011-12
2010-11
2007-08
2005-06
% Proficient/Advanced
Literacy Math
Benchmark, Grade 3 – 8, % Proficient/Advanced, Over time
8
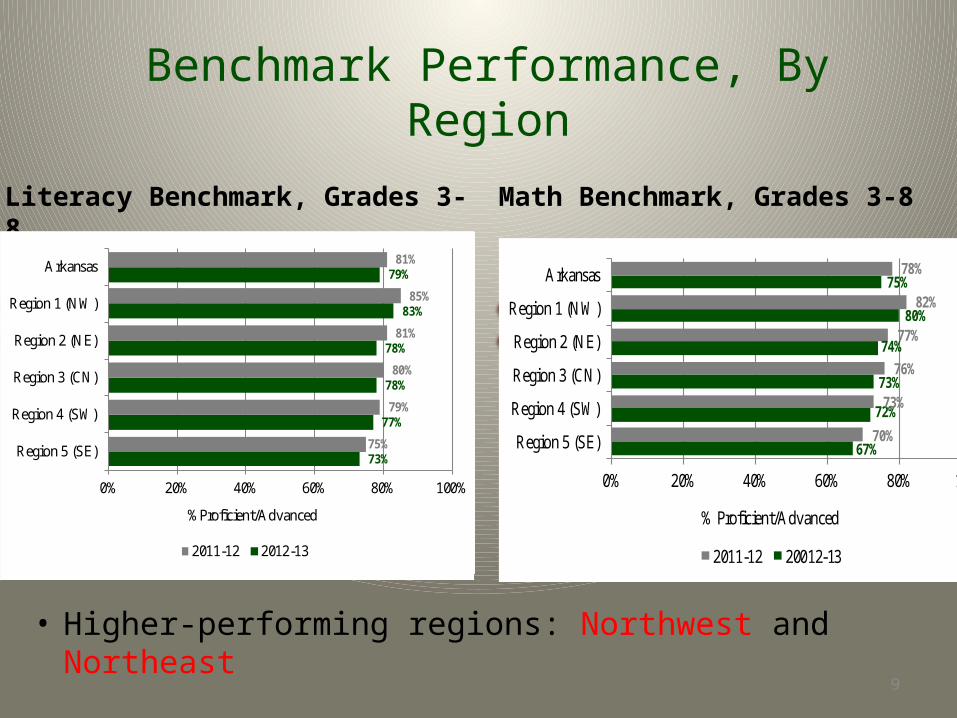
Benchmark Performance, By Region
73%
77%
78%
78%
83%
79%
75%
79%
80%
81%
85%
81%
0% 20% 40% 60% 80% 100%
Region 5 (SE)
Region 4 (SW)
Region 3 (CN)
Region 2 (NE)
Region 1 (NW)
Arkansas
%Proficient/Advanced
2011-12 2012-13
Literacy Benchmark, Grades 3-8
67%
72%
73%
74%
80%
75%
70%
73%
76%
77%
82%
78%
0% 20% 40% 60% 80% 100%
Region 5 (SE)
Region 4 (SW)
Region 3 (CN)
Region 2 (NE)
Region 1 (NW)
Arkansas
% Proficient/Advanced
2011-12 20012-13
Math Benchmark, Grades 3-8
• Higher-performing regions: Northwest and Northeast
9
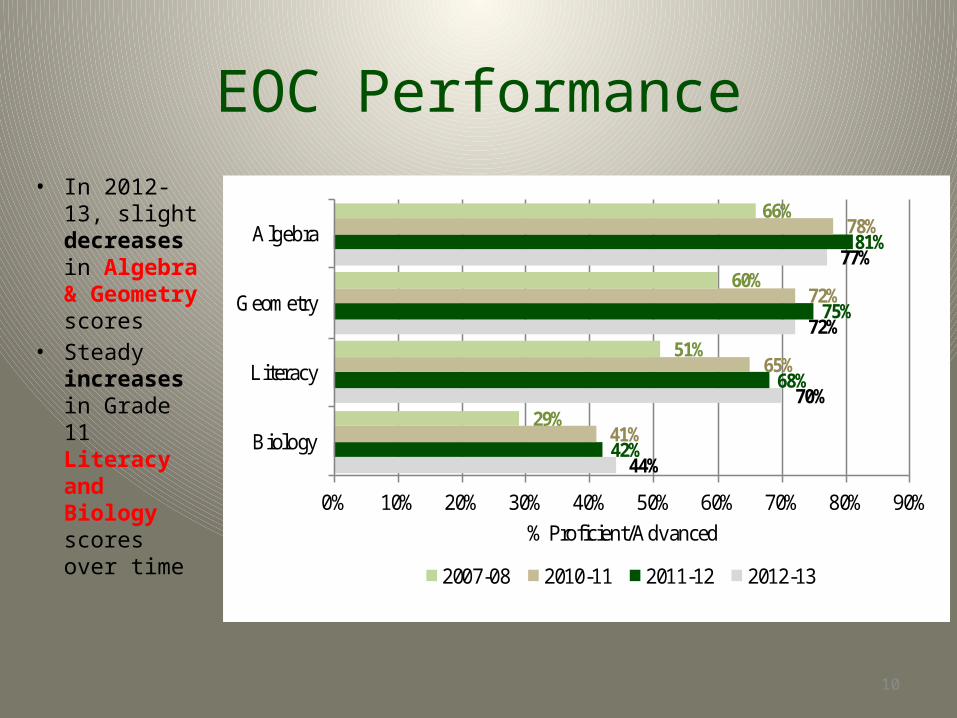
EOC Performance
• In 2012-13, slight decreases in Algebra & Geometry scores
• Steady increases in Grade 11 Literacy and Biology scores over time
44%
70%
72%
77%
42%
68%
75%
81%
41%
65%
72%
78%
29%
51%
60%
66%
0% 10% 20% 30% 40% 50% 60% 70% 80% 90%
Biology
Literacy
Geometry
Algebra
% Proficient/Advanced
2007-08 2010-11 2011-12 2012-13
10
How was Arkansas’ performance on the NAEP in 2011? Over time?
11
NAEP
• National Assessment of Education Progress – Nation’s Report Card
• Administered to random sample of 4th and 8th grade students
• Most recent data from 2011– New 2013 NAEP data to be released this fall
12
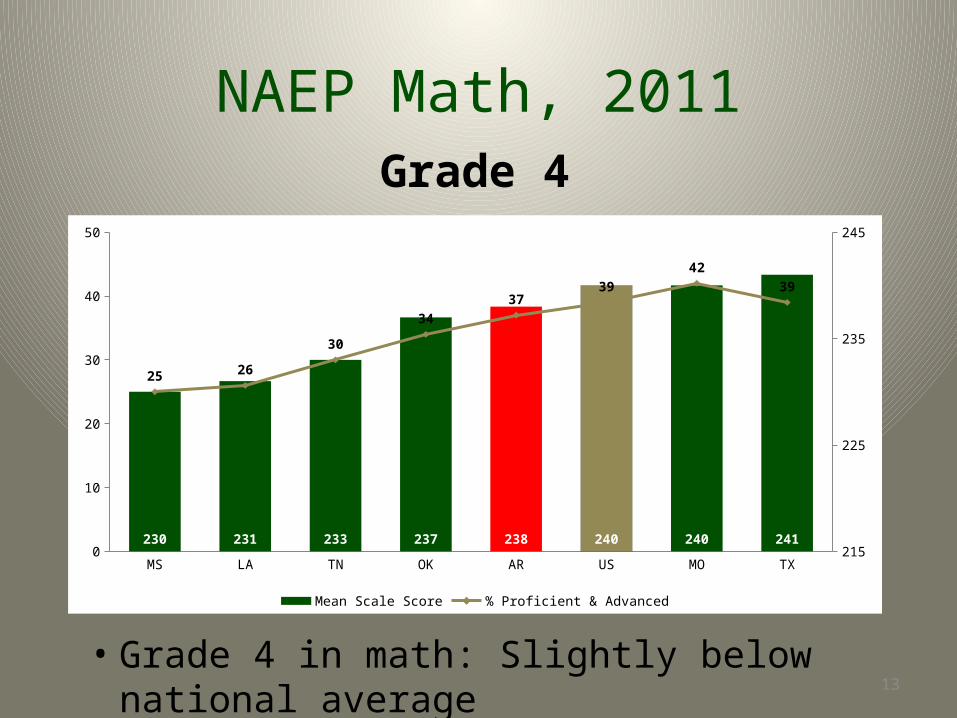
NAEP Math, 2011Grade 4
MS LA TN OK AR US MO TX0
10
20
30
40
50
215
225
235
245
230 231 233 237 238 240 240 241
25 26
30
34
3739
42
39
Mean Scale Score % Proficient & Advanced
• Grade 4 in math: Slightly below national average13
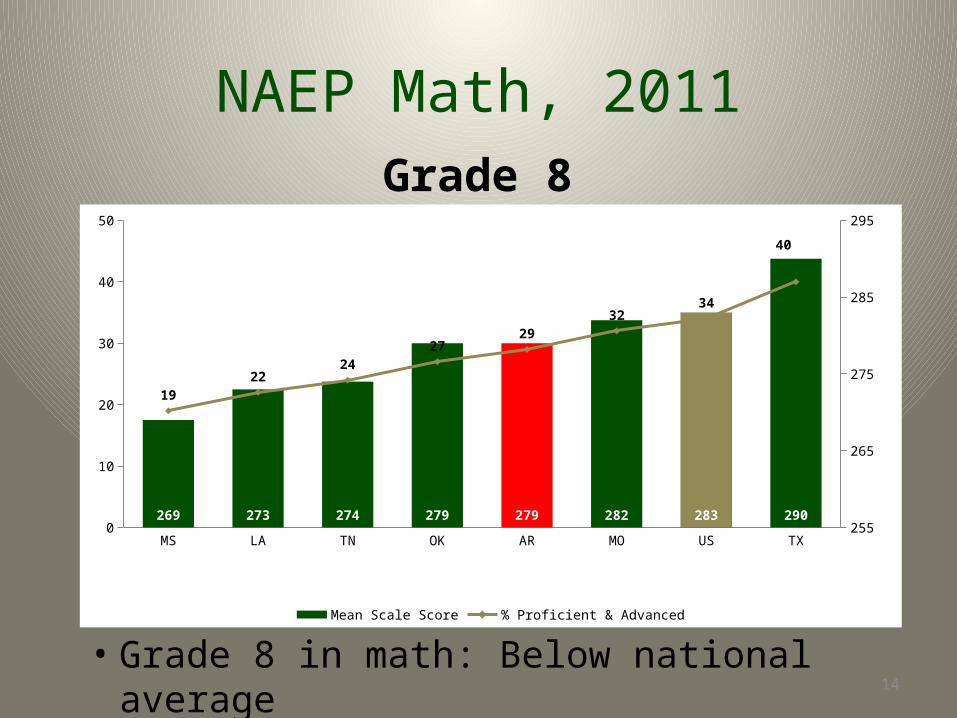
NAEP Math, 2011Grade 8
MS LA TN OK AR MO US TX0
10
20
30
40
50
255
265
275
285
295
269 273 274 279 279 282 283 290
19
2224
2729
3234
40
Mean Scale Score % Proficient & Advanced
• Grade 8 in math: Below national average14
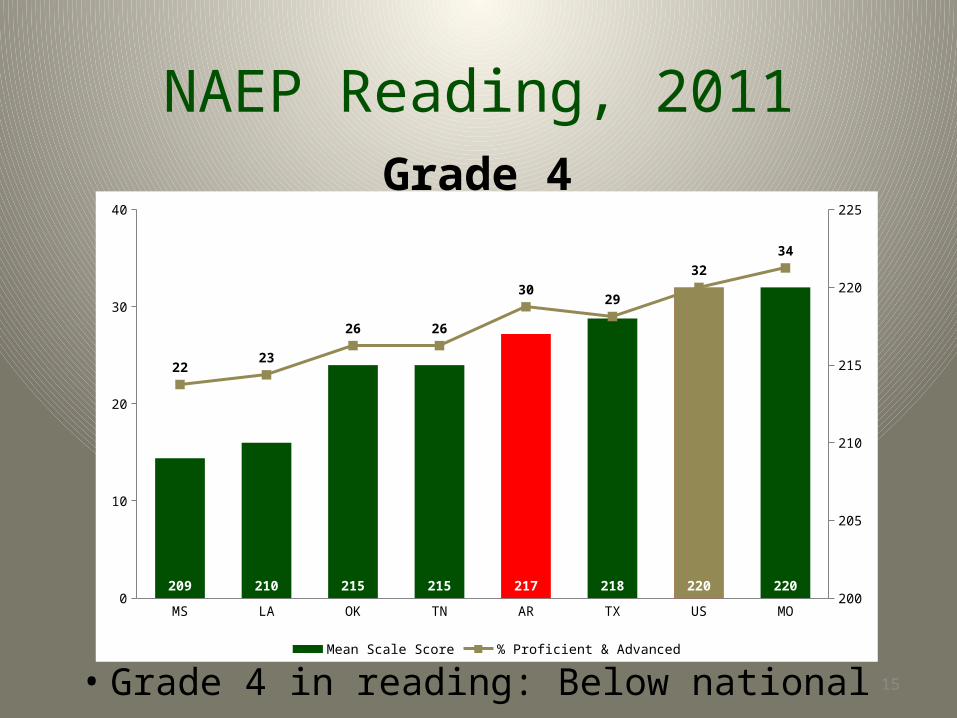
NAEP Reading, 2011Grade 4
MS LA OK TN AR TX US MO0
10
20
30
40
200
205
210
215
220
225
209 210 215 215 217 218 220 220
2223
26 26
3029
32
34
Mean Scale Score % Proficient & Advanced
• Grade 4 in reading: Below national average 15
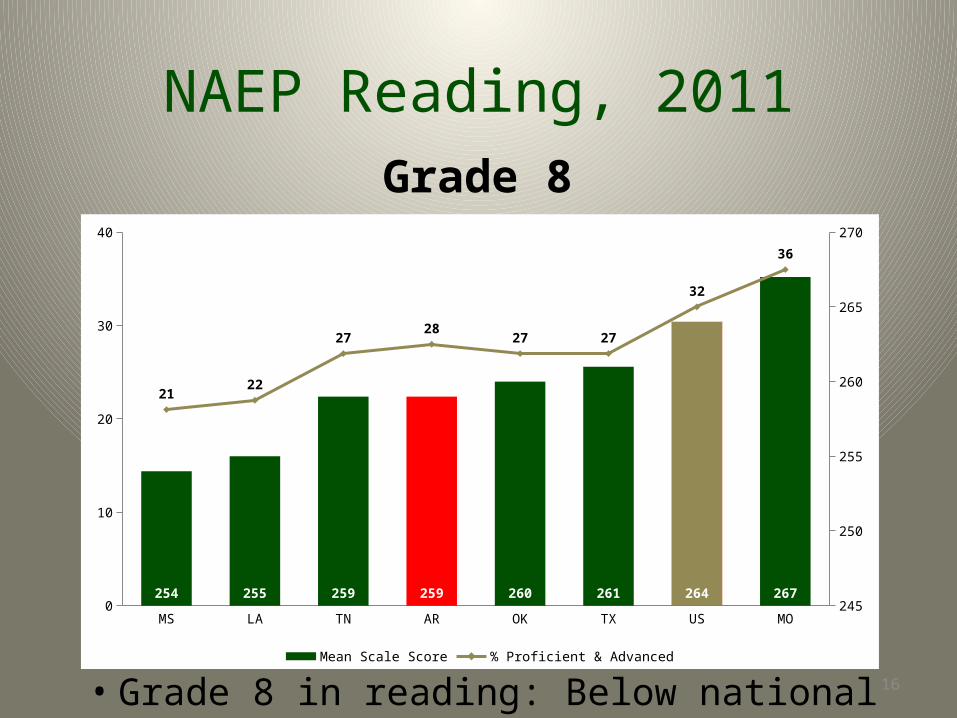
NAEP Reading, 2011Grade 8
MS LA TN AR OK TX US MO0
10
20
30
40
245
250
255
260
265
270
254 255 259 259 260 261 264 267
2122
2728
27 27
32
36
Mean Scale Score % Proficient & Advanced
• Grade 8 in reading: Below national average 16
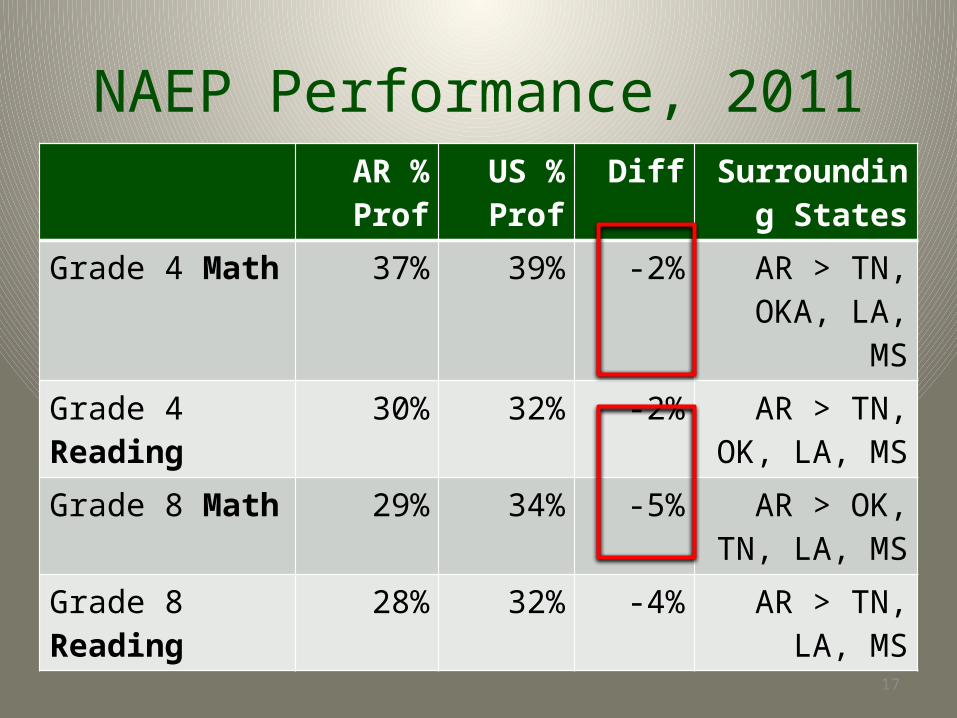
NAEP Performance, 2011AR %
ProfUS %
ProfDiff Surrounding
States
Grade 4 Math 37% 39% -2% AR > TN, OKA, LA, MS
Grade 4 Reading 30% 32% -2% AR > TN, OK, LA, MS
Grade 8 Math 29% 34% -5% AR > OK, TN, LA, MS
Grade 8 Reading 28% 32% -4% AR > TN, LA, MS
17
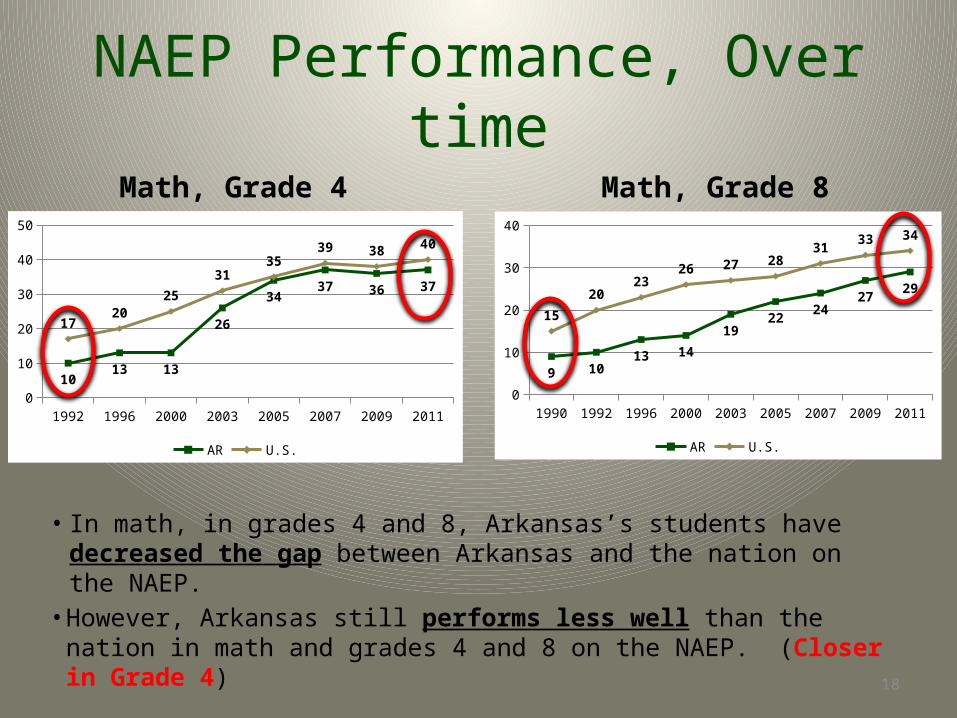
NAEP Performance, Over time
• In math, in grades 4 and 8, Arkansas’s students have decreased the gap between Arkansas and the nation on the NAEP.
• However, Arkansas still performs less well than the nation in math and grades 4 and 8 on the NAEP. (Closer in Grade 4)
1992 1996 2000 2003 2005 2007 2009 20110
10
20
30
40
50
1013 13
26
3437 36 37
1720
25
3135
39 38 40
AR U.S.
Math, Grade 4
1990 1992 1996 2000 2003 2005 2007 2009 20110
10
20
30
40
9 1013 14
1922
2427
29
15
2023
26 27 2831
33 34
AR U.S.
Math, Grade 8
18
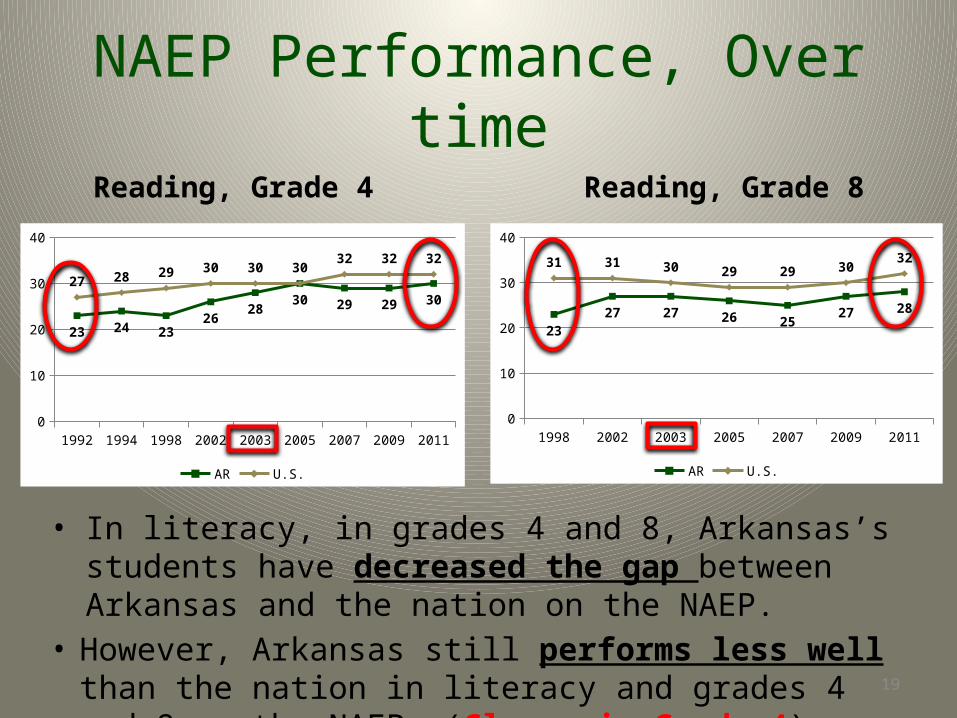
NAEP Performance, Over time
• In literacy, in grades 4 and 8, Arkansas’s students have decreased the gap between Arkansas and the nation on the NAEP.
• However, Arkansas still performs less well than the nation in literacy and grades 4 and 8 on the NAEP. (Closer in Grade 4)
Reading, Grade 4 Reading, Grade 8
1992 1994 1998 2002 2003 2005 2007 2009 20110
10
20
30
40
23 24 2326
2830 29 29 30
27 28 29 30 30 3032 32 32
AR U.S.
1998 2002 2003 2005 2007 2009 20110
10
20
30
40
23
27 27 26 2527 28
31 31 30 29 29 3032
AR U.S.
19
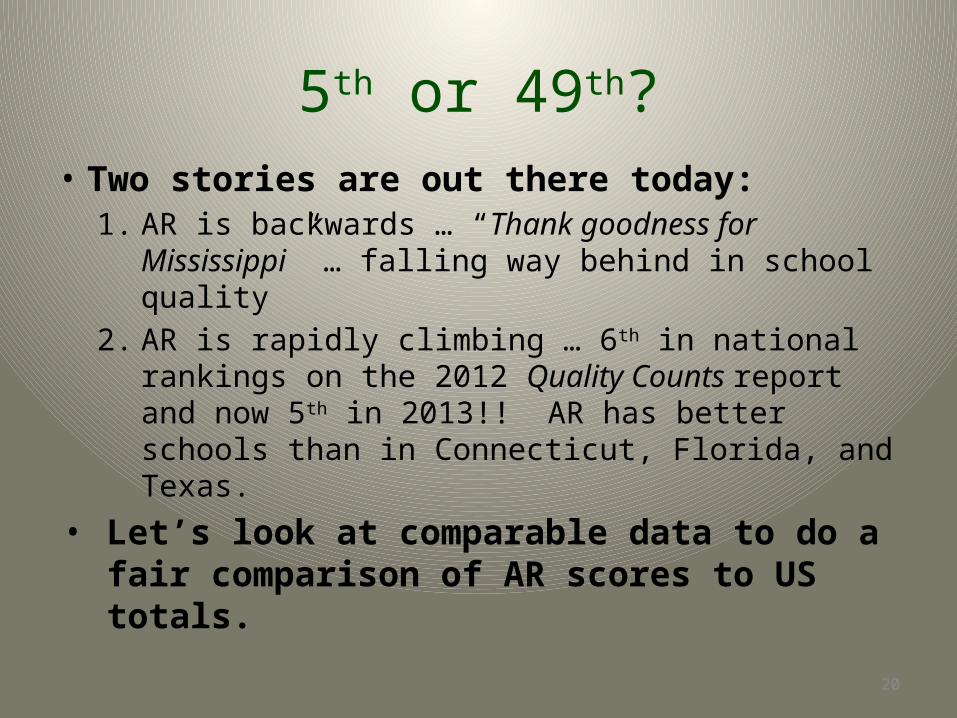
5th or 49th?
• Two stories are out there today:1. AR is backwards … “Thank goodness for
Mississippi” … falling way behind in school quality
2. AR is rapidly climbing … 6th in national rankings on the 2012 Quality Counts report and now 5th in 2013!! AR has better schools than in Connecticut, Florida, and Texas.
• Let’s look at comparable data to do a fair comparison of AR scores to US totals.
20
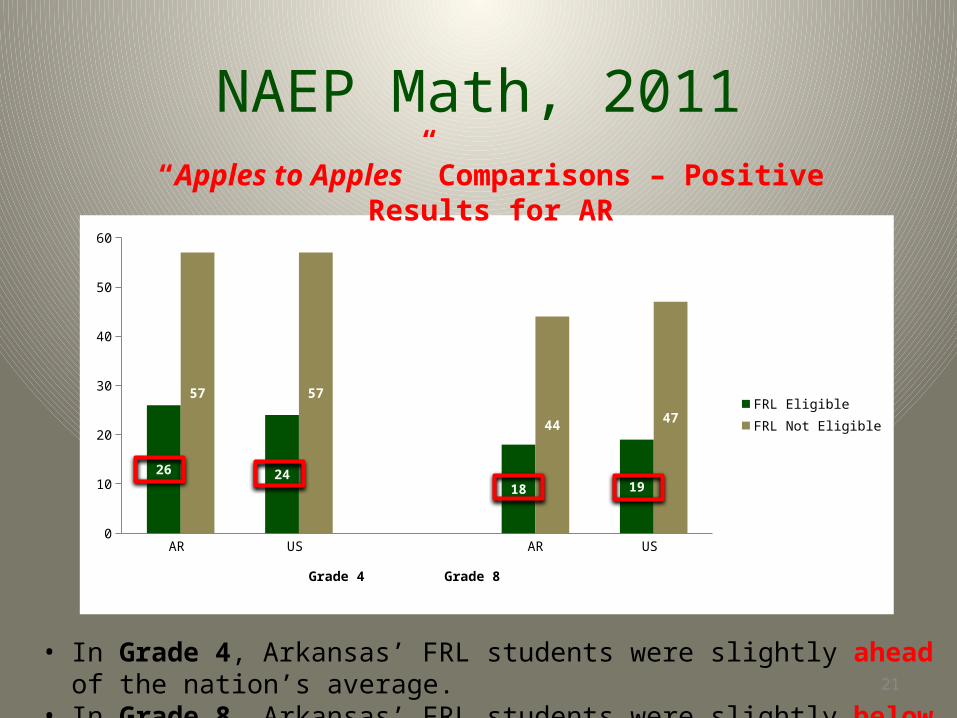
NAEP Math, 2011
AR US AR US 0
10
20
30
40
50
60
26 2418 19
57 57
4447
FRL Eligible
FRL Not Eligible
Grade 4 Grade 8
“Apples to Apples” Comparisons – Positive Results for AR
• In Grade 4, Arkansas’ FRL students were slightly ahead of the nation’s average.• In Grade 8, Arkansas’ FRL students were slightly below the nation’s average.21
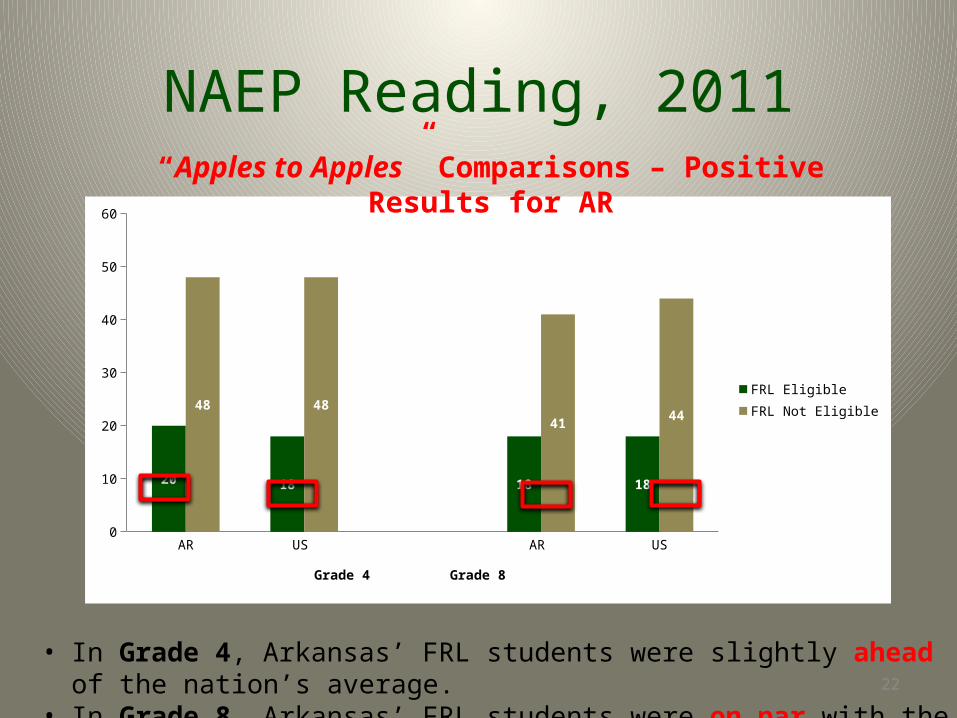
NAEP Reading, 2011
AR US AR US0
10
20
30
40
50
60
20 18 18 18
48 48
4144
FRL Eligible
FRL Not Eligible
Grade 4 Grade 8
“Apples to Apples” Comparisons – Positive Results for AR
• In Grade 4, Arkansas’ FRL students were slightly ahead of the nation’s average.• In Grade 8, Arkansas’ FRL students were on par with the nation’s average. 22
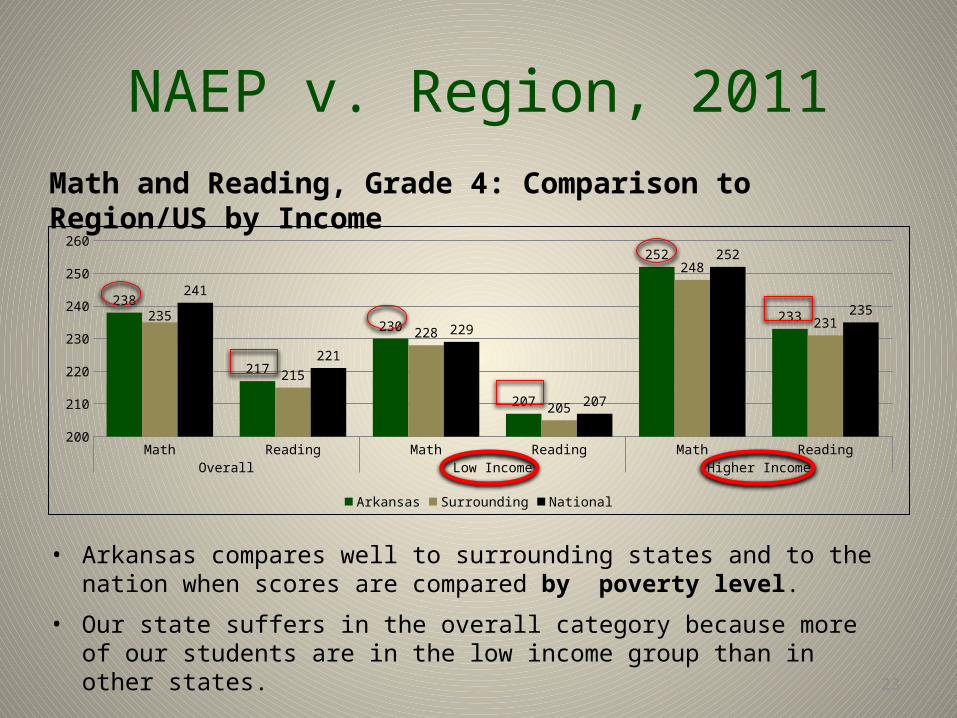
NAEP v. Region, 2011
• Arkansas compares well to surrounding states and to the nation when scores are compared by poverty level.
• Our state suffers in the overall category because more of our students are in the low income group than in other states.
23
Math Reading Math Reading Math ReadingOverall Low Income Higher Income
200
210
220
230
240
250
260
238
217
230
207
252
233235
215
228
205
248
231
241
221
229
207
252
235
Arkansas Surrounding National
Math and Reading, Grade 4: Comparison to Region/US by Income
Careful with these results…
• When comparing performance of FRL students across
states, it is important to keep in mind cost of living.– Income level of for a family of four at ~$30,000 (free lunch
threshold) looks different in Little Rock than in Los Angeles
• Therefore, FRL is an imperfect measure when
examining poverty levels and comparing data across
states.
• This might generate a positive BIAS for AR• E.G. LR FRL = $30K ~= $22K in Seattle; thus comparing a
“wealthier” set of AR kids to WA kids.24
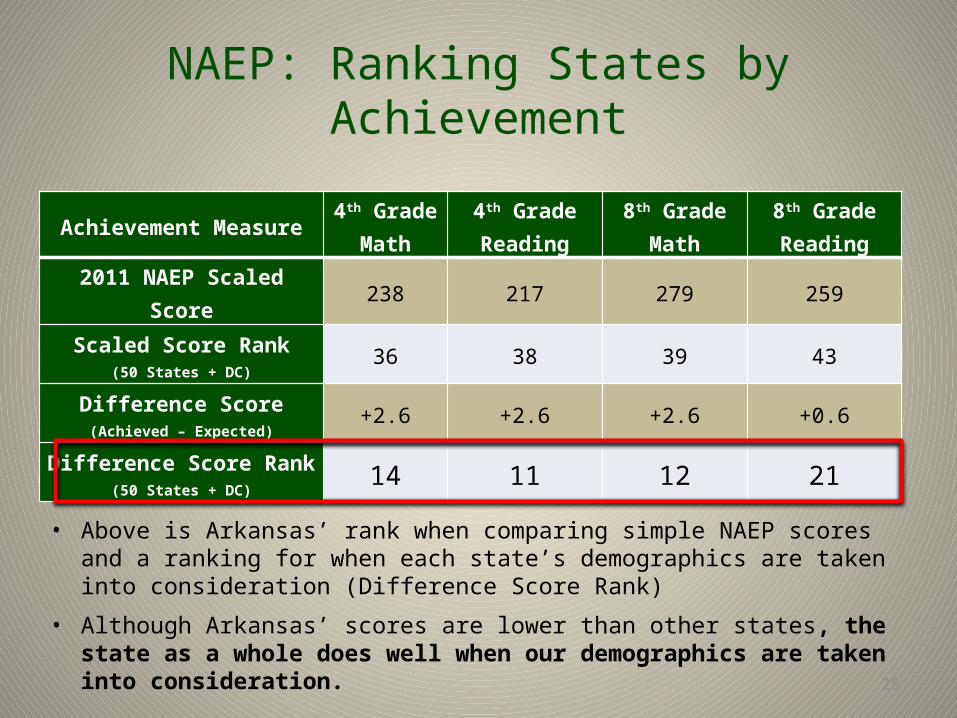
NAEP: Ranking States by Achievement
Achievement Measure4th Grade
Math4th Grade Reading
8th Grade Math
8th Grade Reading
2011 NAEP ScaledScore
238 217 279 259
Scaled Score Rank(50 States + DC)
36 38 39 43
Difference Score(Achieved – Expected)
+2.6 +2.6 +2.6 +0.6
Difference Score Rank(50 States + DC)
14 11 12 21
25
• Above is Arkansas’ rank when comparing simple NAEP scores and a ranking for when each state’s demographics are taken into consideration (Difference Score Rank)
• Although Arkansas’ scores are lower than other states, the state as a whole does well when our demographics are taken into consideration.
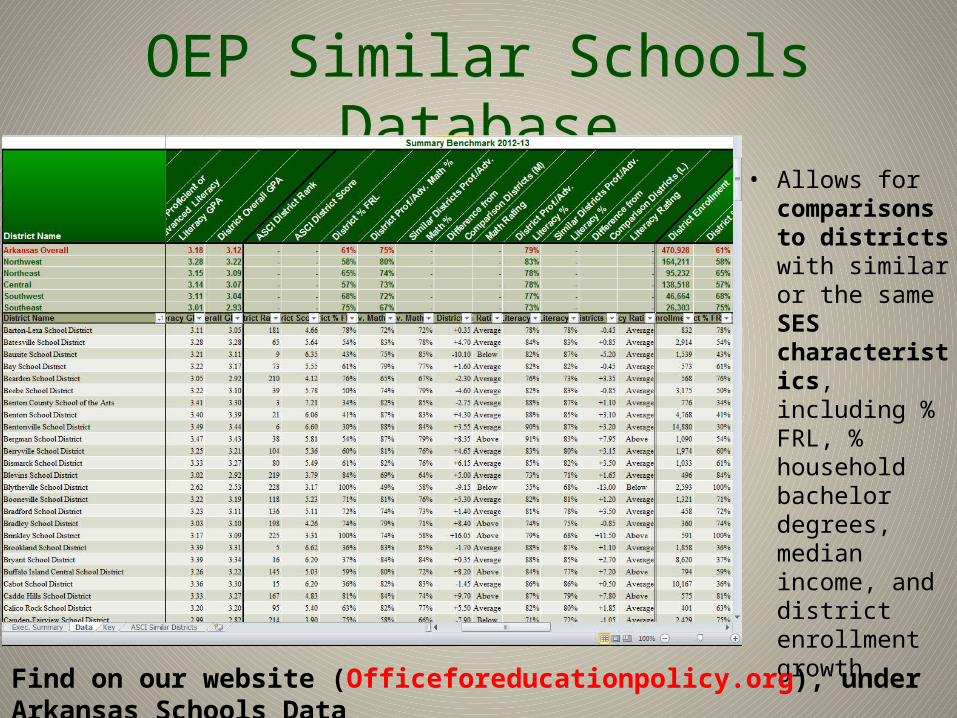
OEP Similar Schools Database
26
• Allows for comparisons to districts with similar or the same SES characteristics, including % FRL, % household bachelor degrees, median income, and district enrollment growth.
Find on our website (Officeforeducationpolicy.org), under Arkansas Schools Data
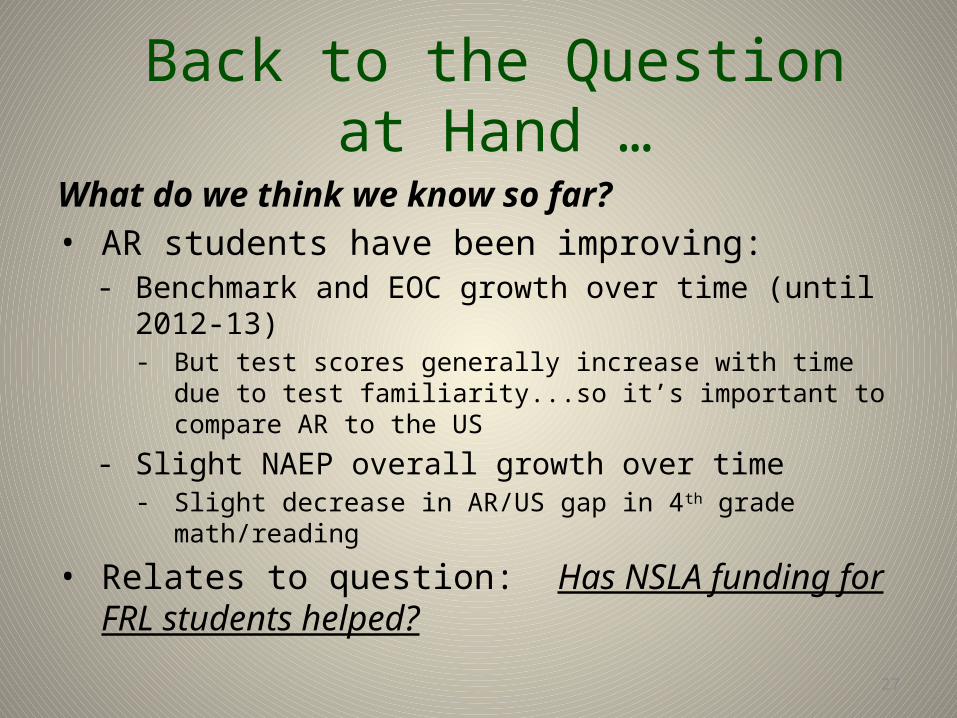
Back to the Question at Hand …
What do we think we know so far?• AR students have been improving:
- Benchmark and EOC growth over time (until 2012-13)- But test scores generally increase with time due to test
familiarity...so it’s important to compare AR to the US
- Slight NAEP overall growth over time- Slight decrease in AR/US gap in 4th grade math/reading
• Relates to question: Has NSLA funding for FRL students helped?
27
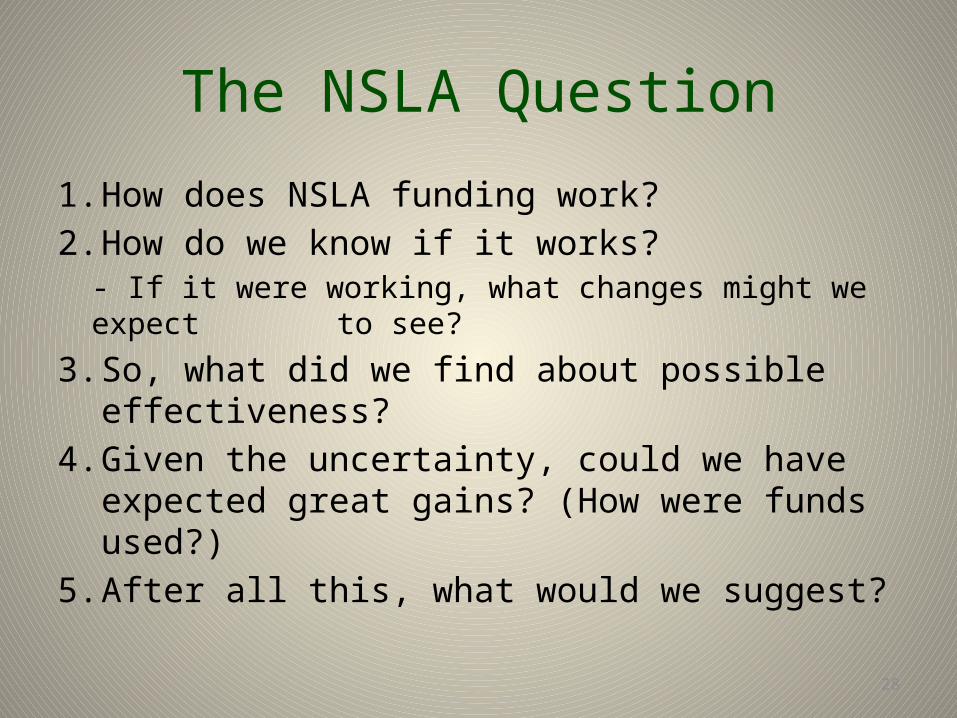
The NSLA Question
1. How does NSLA funding work?
2. How do we know if it works? - If it were working, what changes might we
expect to see?
3. So, what did we find about possible effectiveness?
4. Given the uncertainty, could we have expected great gains? (How were funds used?)
5. After all this, what would we suggest?
28
NSLA: How does it work?
• In the 2013 Quality Counts report, Arkansas received a B+ on equity funding, ranking it as one of the top states in the nation in distributing equity funding to districts.
• Arkansas should be commended for its focus on students in poverty, as the formula does channel more resources toward students in poverty, particularly those in very poor districts.
29
NSLA: How does it work?
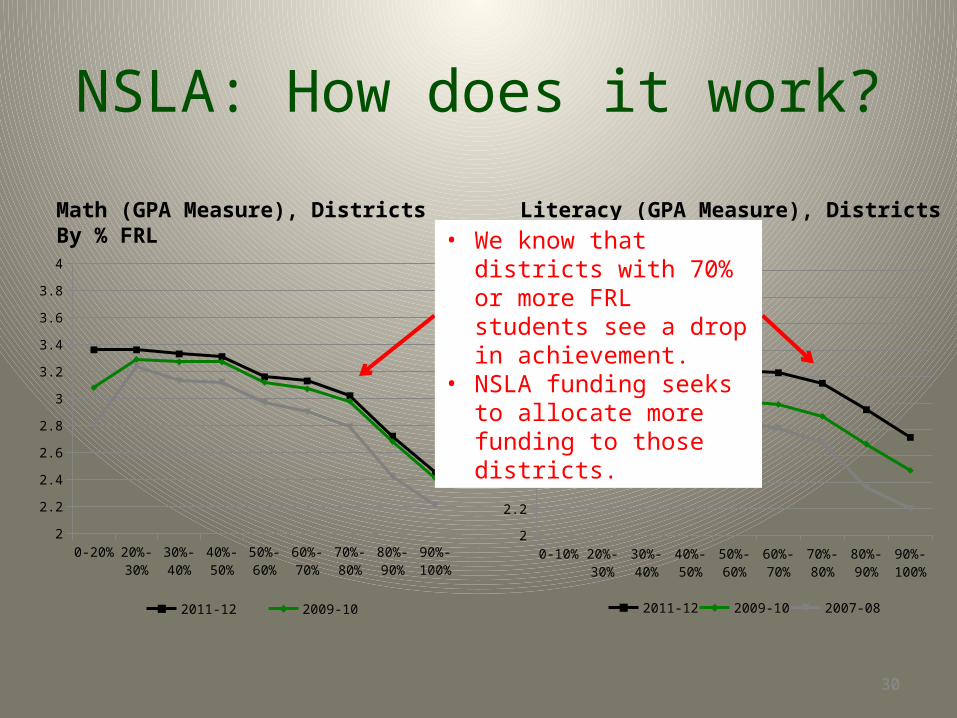
Math (GPA Measure), Districts By % FRL Literacy (GPA Measure), Districts By % FRL
0-20% 20%-30%
30%-40%
40%-50%
50%-60%
60%-70%
70%-80%
80%-90%
90%-100%
2
2.2
2.4
2.6
2.8
3
3.2
3.4
3.6
3.8
4
2011-12 2009-10 2007-08
0-10% 20%-30%
30%-40%
40%-50%
50%-60%
60%-70%
70%-80%
80%-90%
90%-100%
2
2.2
2.4
2.6
2.8
3
3.2
3.4
3.6
3.8
4
2011-12 2009-10 2007-08
• We know that districts with 70% or more FRL students see a drop in achievement.
• NSLA funding seeks to allocate more funding to those districts.
30
NSLA Funding: How does it work?
0% 6% 12% 18% 24% 30% 36% 42% 48% 54% 60% 66% 72% 78% 84% 90% 96% $-
$200
$400
$600
$800
$1,000
$1,200
$1,400
$1,600
$1,800
% FRL of School
$ p
er F
RL
Pu
pil
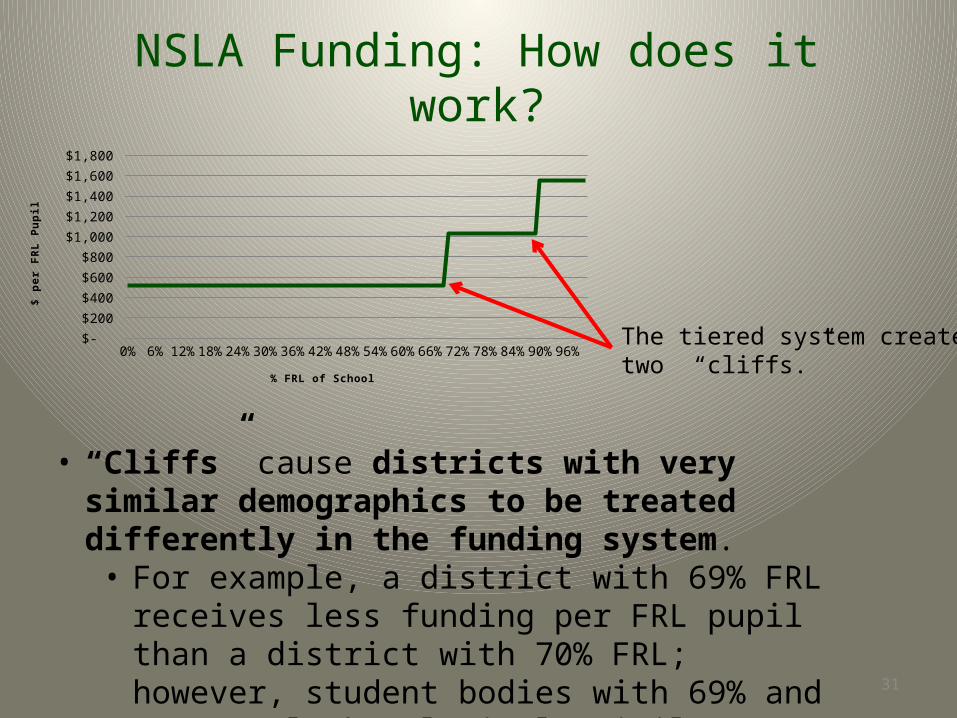
The tiered system creates two “cliffs.”
• “Cliffs” cause districts with very similar demographics to be treated differently in the funding system. • For example, a district with 69% FRL receives less
funding per FRL pupil than a district with 70% FRL; however, student bodies with 69% and 70% FRL look relatively similar.
31
The Big Q – How would we know if NSLA funding worked?
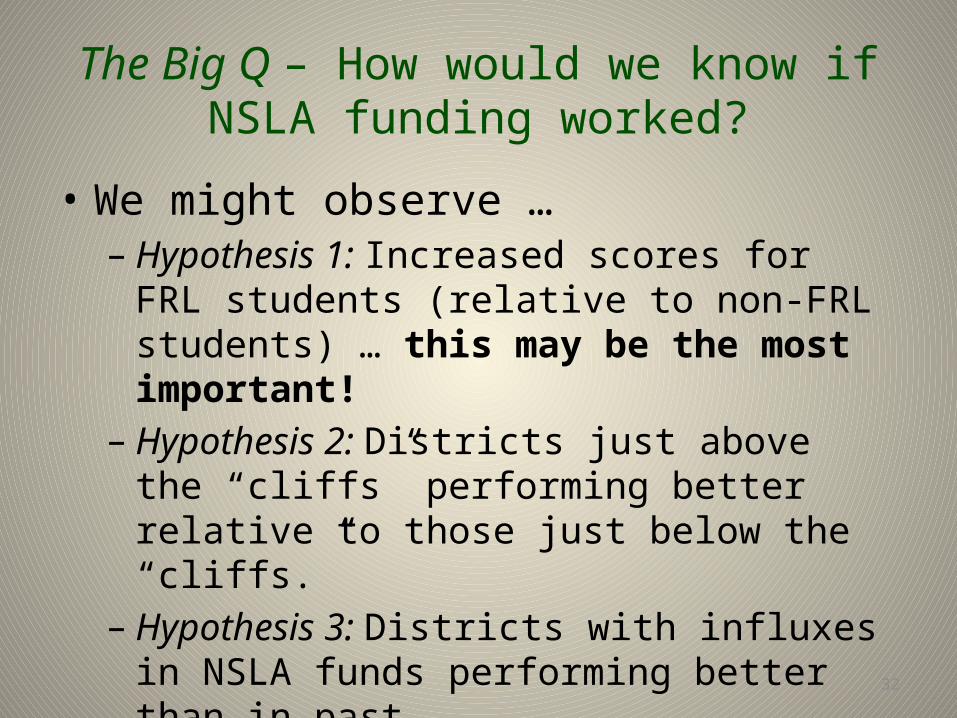
• We might observe …– Hypothesis 1: Increased scores for FRL students
(relative to non-FRL students) … this may be the most important!
– Hypothesis 2: Districts just above the “cliffs” performing better relative to those just below the “cliffs.”
– Hypothesis 3: Districts with influxes in NSLA funds performing better than in past.
32
Hypothesis 1:FRL Students vs Non-FRL Students
• If NSLA Funding were working, we might expect to see increase in achievement for FRL students relative to non-FRL students.
33
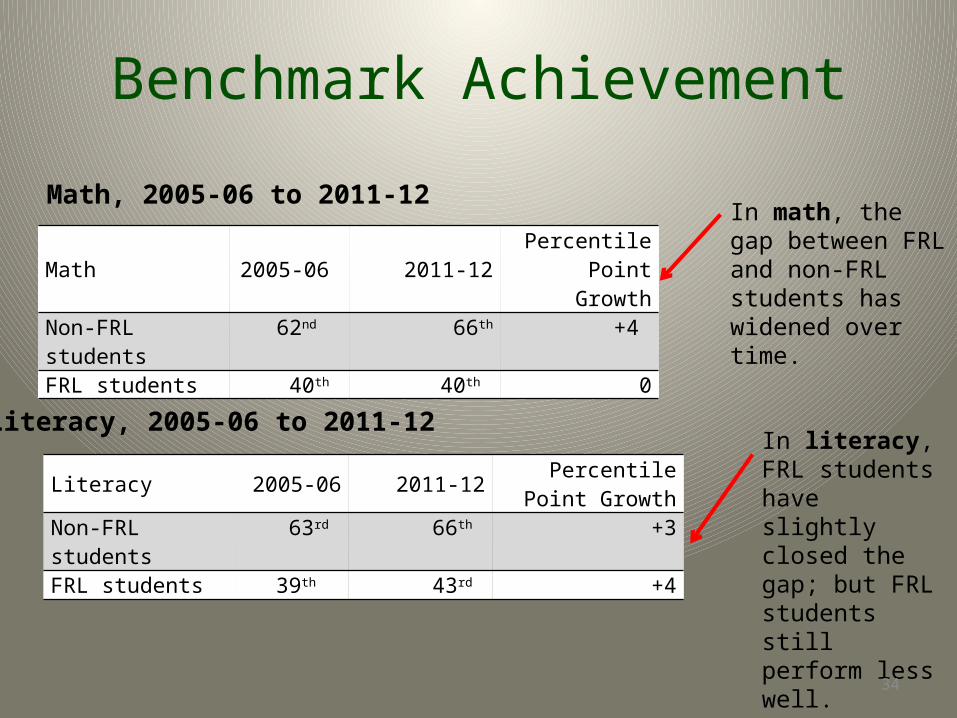
Benchmark Achievement
Math 2005-06 2011-12Percentile Point
GrowthNon-FRL students 62nd 66th +4 FRL students 40th 40th 0
Literacy 2005-06 2011-12Percentile Point
GrowthNon-FRL students 63rd 66th +3FRL students 39th 43rd +4
Math, 2005-06 to 2011-12
Literacy, 2005-06 to 2011-12
In math, the gap between FRL and non-FRL students has widened over time.
In literacy, FRL students have slightly closed the gap; but FRL students still perform less well.
34
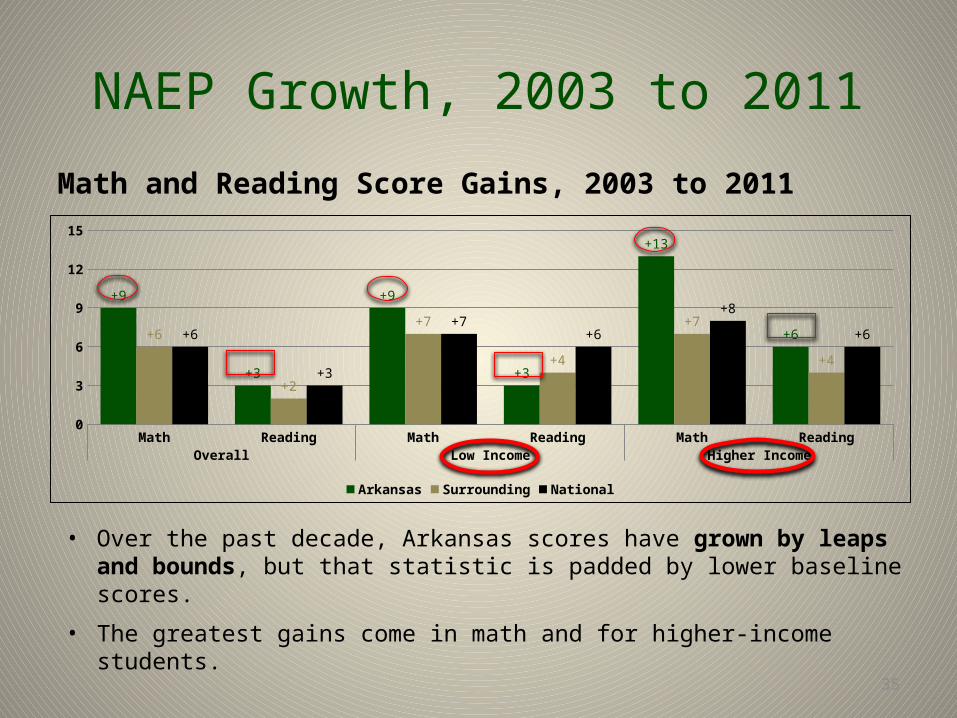
NAEP Growth, 2003 to 2011
35
Math Reading Math Reading Math ReadingOverall Low Income Higher Income
0
3
6
9
12
15
+9
+3
+9
+3
+13
+6+6
+2
+7
+4
+7
+4
+6
+3
+7+6
+8
+6
Arkansas Surrounding National
Math and Reading Score Gains, 2003 to 2011
• Over the past decade, Arkansas scores have grown by leaps and bounds, but that statistic is padded by lower baseline scores.
• The greatest gains come in math and for higher-income students.
Hypothesis 1:FRL Students vs Non-FRL Students
• Achievement gap between FRL and non-FRL students continues to exist.– Benchmark• Gap is widening in math performance• Gap is slightly shrinking in literacy
– NAEP• Non-FRL produced higher gains than FRL students
over time
36
Hypothesis 2:“Cliff” Districts
• “Cliffs” cause districts with very similar demographics to be treated differently in the funding system. • For example, a district with 69% FRL receives less funding
per FRL pupil than a district with 70% FRL; however, student bodies with 69% and 70% FRL look relatively similar.
• The “cliffs” allow us to compare the performance of relatively similar districts (e.g. 69% to 70%) that receive different amounts of funding.
• Thus, if NSLA were working, we would see greater performance for districts “above the cliffs”
37
Hypothesis 2:“Cliff” Districts
2007-08 2008-09 2009-10 2010-11 2011-12 2012-132.00
2.20
2.40
2.60
2.80
3.00
3.20
3.40
3.60
3.80
4.00
64%-69% 70% - 75%
State Average
Benchmark Math GPA, 2007-08 to 2012-13
2007-08 2008-09 2009-10 2010-11 2011-12 2012-132.00
2.20
2.40
2.60
2.80
3.00
3.20
3.40
3.60
3.80
4.00
64%-69% 70% - 75%
State Average
Benchmark Literacy GPA, 2007-08 to 2012-13
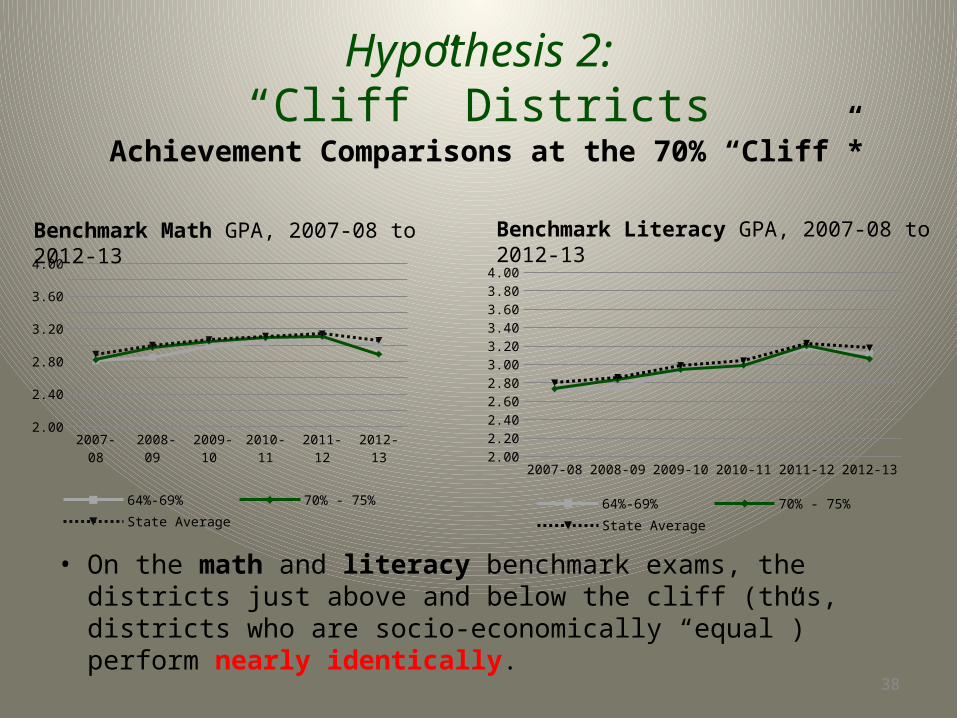
• On the math and literacy benchmark exams, the districts just above and below the cliff (thus, districts who are socio-economically “equal”) perform nearly identically.
Achievement Comparisons at the 70% “Cliff”*
38
2007-08 2008-09 2009-10 2010-11 2011-12 2012-132.00
2.20
2.40
2.60
2.80
3.00
3.20
3.40
3.60
3.80
4.00
84%-89% 90%-95%
State Average
2007-08 2008-09 2009-10 2010-11 2011-12 2012-132.00
2.20
2.40
2.60
2.80
3.00
3.20
3.40
3.60
3.80
4.00
84%-89% 90%-95%
State Average
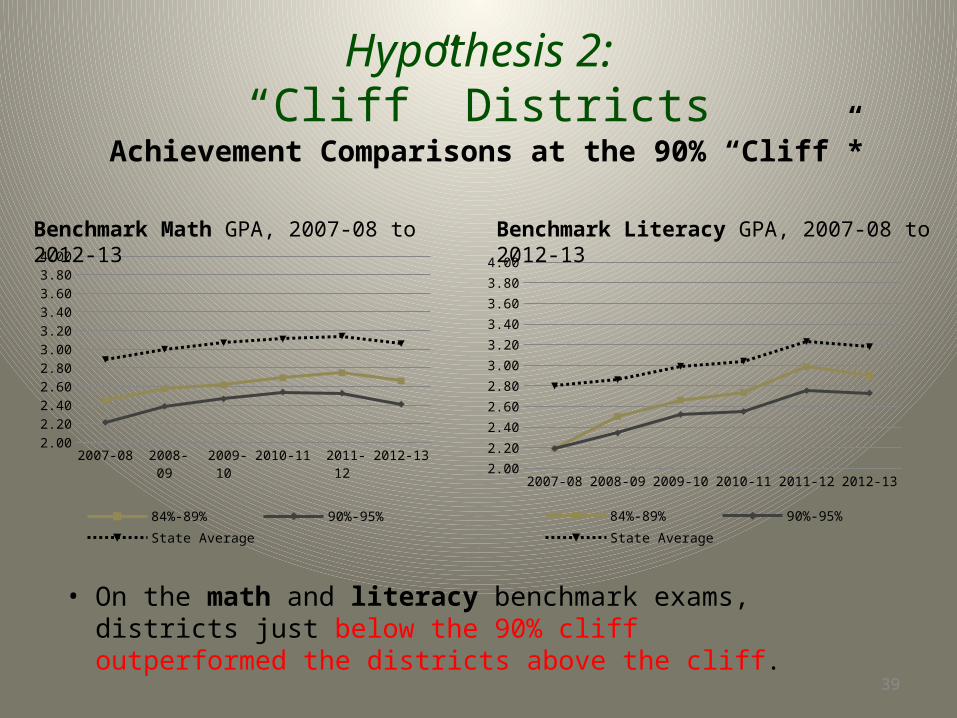
• On the math and literacy benchmark exams, districts just below the 90% cliff outperformed the districts above the cliff.
Hypothesis 2:“Cliff” Districts
Benchmark Math GPA, 2007-08 to 2012-13 Benchmark Literacy GPA, 2007-08 to 2012-13
Achievement Comparisons at the 90% “Cliff”*
39
Hypothesis 3:Increased Funding
• When a district “moves up a tier” by having a higher % of FRL students, FRL students may perform at higher levels after the district has received more funding.
• Thus, if NSLA were working, we would see greater performance for districts after the new funds
• Since 2004-05, some districts have moved into a higher tier of poverty funding. The achievement of these districts was compared and at both the 70% and 90% cliffs, no district showed an increase in achievement as a result of a financial windfall.
40
So, what do we know about NSLA?
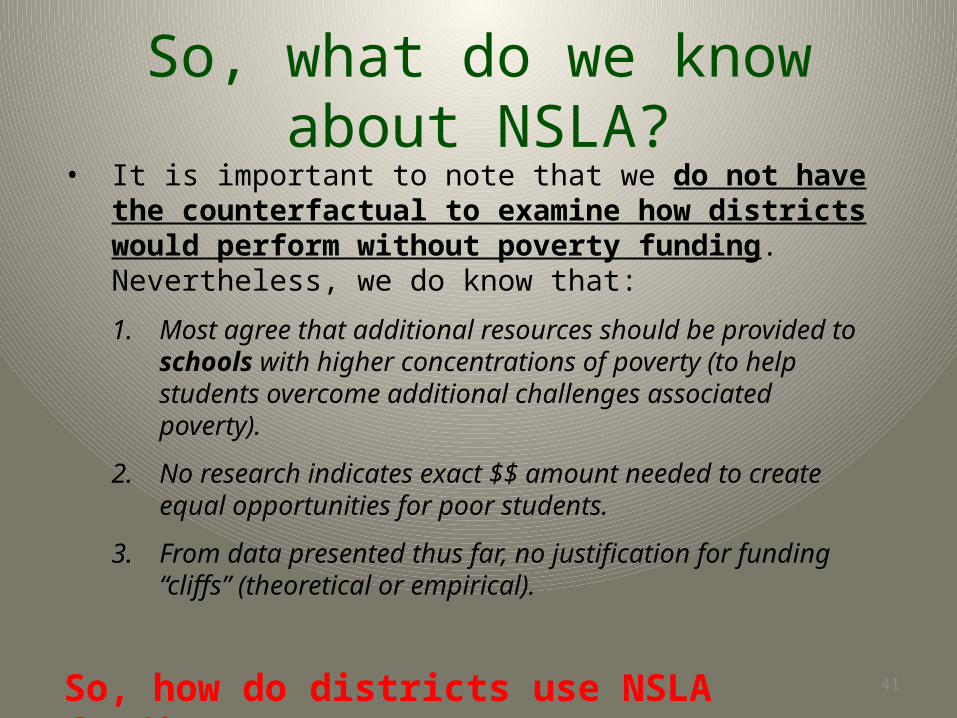
• It is important to note that we do not have the counterfactual to examine how districts would perform without poverty funding. Nevertheless, we do know that:
1. Most agree that additional resources should be provided to schools with higher concentrations of poverty (to help students overcome additional challenges associated poverty).
2. No research indicates exact $$ amount needed to create equal opportunities for poor students.
3. From data presented thus far, no justification for funding “cliffs” (theoretical or empirical).
So, how do districts use NSLA funding?
41
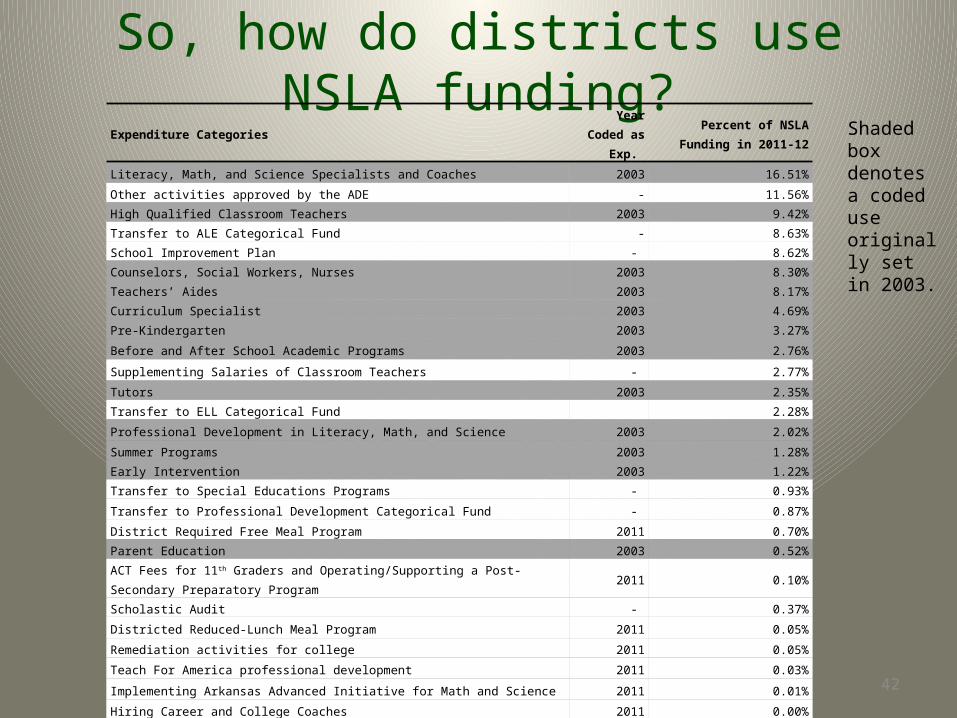
So, how do districts use NSLA funding?Expenditure Categories
Year Coded as Exp.
Percent of NSLA Funding in 2011-12
Literacy, Math, and Science Specialists and Coaches 2003 16.51%
Other activities approved by the ADE - 11.56%High Qualified Classroom Teachers 2003 9.42%Transfer to ALE Categorical Fund - 8.63%School Improvement Plan - 8.62%Counselors, Social Workers, Nurses 2003 8.30%Teachers’ Aides 2003 8.17%Curriculum Specialist 2003 4.69%Pre-Kindergarten 2003 3.27%
Before and After School Academic Programs 2003 2.76%
Supplementing Salaries of Classroom Teachers - 2.77%
Tutors 2003 2.35%Transfer to ELL Categorical Fund 2.28%
Professional Development in Literacy, Math, and Science 2003 2.02%
Summer Programs 2003 1.28%Early Intervention 2003 1.22%Transfer to Special Educations Programs - 0.93%
Transfer to Professional Development Categorical Fund - 0.87%
District Required Free Meal Program 2011 0.70%Parent Education 2003 0.52%ACT Fees for 11th Graders and Operating/Supporting a Post-Secondary Preparatory Program 2011 0.10%Scholastic Audit - 0.37%
Districted Reduced-Lunch Meal Program 2011 0.05%
Remediation activities for college 2011 0.05%
Teach For America professional development 2011 0.03%
Implementing Arkansas Advanced Initiative for Math and Science 2011 0.01%
Hiring Career and College Coaches 2011 0.00%
Materials, supplies, and equipment including technology 2003 -
Expenses related to a longer school day 2011 -Expenses related to a longer school year 2011 -
Shaded box denotes a coded use originally set in 2003.
42
How do districts use NSLA funding?
• The majority of districts distribute funding among 8 or more expenditure codes.
• Districts seldom focus the money in one or two specific areas; therefore, it seems if many districts use the funding to plug gaps in budgets.
• It is unclear as to whether all districts are specifically pinpointing the funding towards students in poverty (or schools serving these students).
• For example, a district may spend a large portion of funding on Highly Qualified teachers or Specialists – these teachers may or may not work specifically with the low-income students.
• Furthermore, districts do not use all the funding – many have balances at the end of the year.
43
How do districts use NSLA funding?
• Given the uncertainty, could we have expected great gains? – Funds have spent across the board by most
districts– No clear evidence that funding has been focused
for students in poverty–Money is allocated to district offices and not even
to schools with high levels of poverty
44
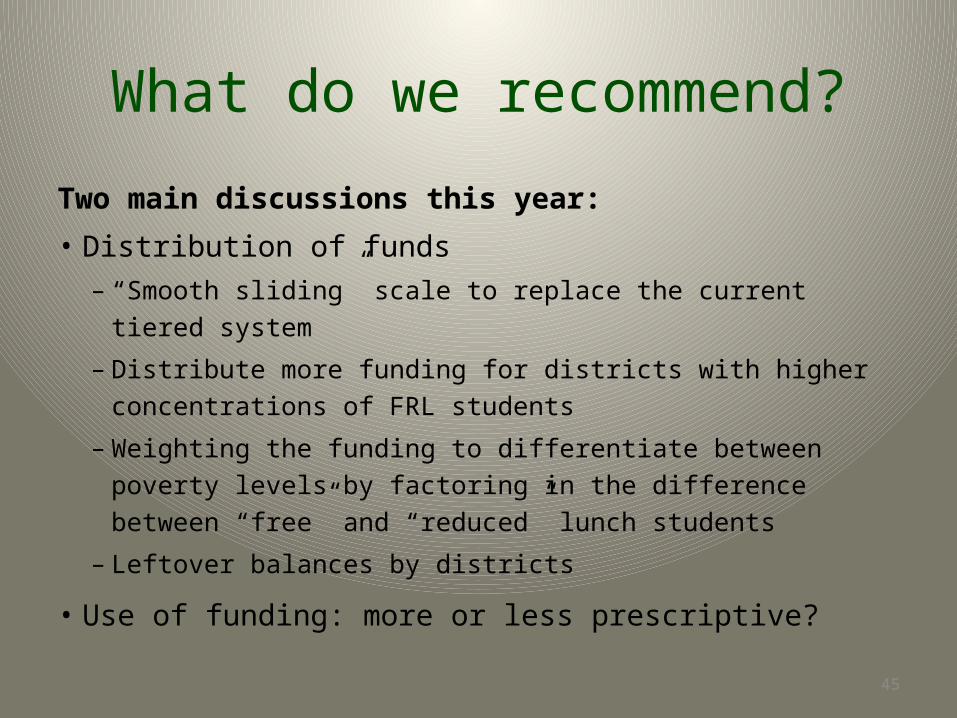
What do we recommend?
Two main discussions this year:
• Distribution of funds
– “Smooth sliding” scale to replace the current tiered system
– Distribute more funding for districts with higher concentrations of
FRL students
– Weighting the funding to differentiate between poverty levels by
factoring in the difference between “free” and “reduced” lunch
students
– Leftover balances by districts
• Use of funding: more or less prescriptive?
45
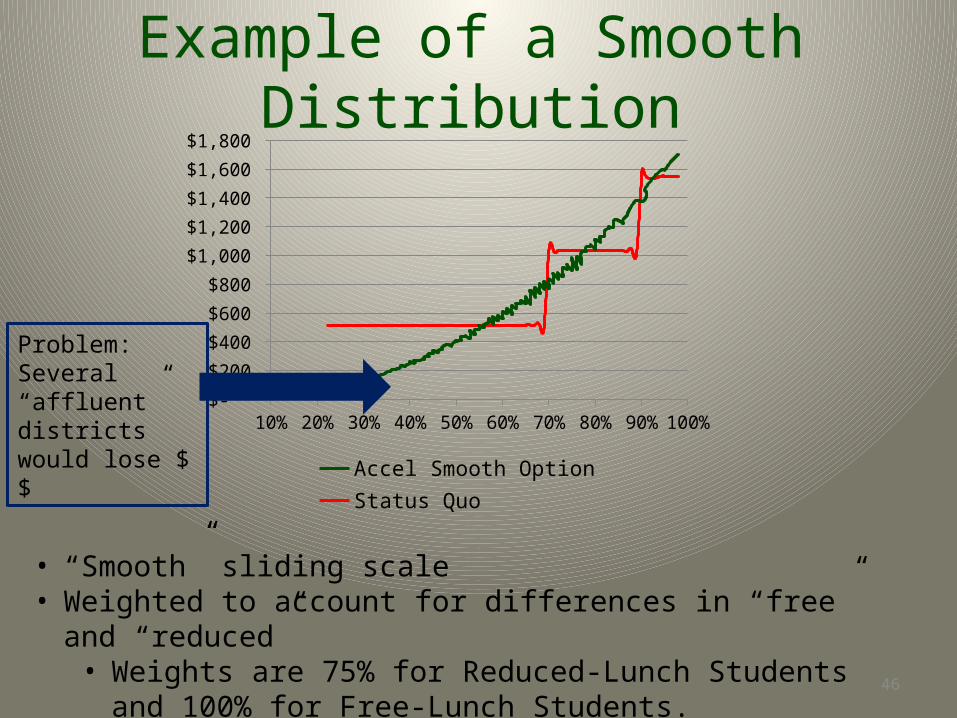
Example of a Smooth Distribution
10% 20% 30% 40% 50% 60% 70% 80% 90% 100% $-
$200
$400
$600
$800
$1,000
$1,200
$1,400
$1,600
$1,800
Accel Smooth Option Status Quo
• “Smooth” sliding scale • Weighted to account for differences in “free” and “reduced”
• Weights are 75% for Reduced-Lunch Students and 100% for Free-Lunch Students.
46
Problem: Several “affluent” districts would lose $$
Smoother … but prescriptive?
Should the use of NSLA funding be more prescriptive?
Long debate over extent of “mandating the spending matrix”
• Arguments for prescriptive use:– Current lack of focus of funds– Pinpoint only to students in poverty– Use prescriptive manner as a way to figure out what works
• Arguments against prescriptive use:– Flexibility is necessary: State-wide policies may not fit for
all.– What do you prescribe? Research isn’t conclusive on what
works best 47
Concluding Thoughts• Arkansas scores on the Benchmark and EOC have improved in the
past 10 years, but… much of the NAEP increases occurred before
2003 (slides 18 and 19)
• On the NAEP, Arkansas students have only slightly increased scores
in 4th grade and 8th grade
– FRL and non-FRL students have produced gains; but non-FRL students
have experienced greater gains
• It is difficult to determine the effectiveness of NSLA funding over the
past 10 years.
– The gap between FRL and non-FRL students has not shrunk.
• Policymakers and districts need to continue to strategically think
about how NSLA funding can be pinpointed so that students in
poverty can achieve at higher levels. 48
Comments? Questions?
Thank you for your time and input!
49