fulton financial corporation
TRANSCRIPT

DealPointData.comFulton Financial Corporation10-K on 02/21/2020 SEC DocumentSEC Filing
UNITED STATESSECURITIES AND EXCHANGE COMMISSION
Washington, DC 20549______________________________________________________
FORM 10-K☒ ANNUAL REPORT PURSUANT TO SECTION 13 OR 15(d) OF THE SECURITIES EXCHANGE ACT OF 1934
For the fiscal year ended December 31, 2019, or
☐ TRANSITION REPORT PURSUANT TO SECTION 13 OR 15(d) OF THE SECURITIES EXCHANGE ACT OF 1934
Commission File Number: 0-10587_______________________________________________________
FULTON FINANCIAL CORPORATION(Exact name of registrant as specified in its charter)
Pennsylvania 23-2195389(State or other jurisdiction ofincorporation or organization)
(I.R.S. EmployerIdentification No.)
One Penn Square P. O. Box 4887 Lancaster, Pennsylvania 17604(Address of principal executive offices) (Zip Code)
(717) 291-2411(Registrant’s telephone number, including area code)
Securities registered pursuant to Section 12(b) of the Act:
Title of each class Trading Symbol Name of exchange on which registeredCommon Stock, $2.50 par value FULT The Nasdaq Stock Market, LLC
Securities registered pursuant to Section 12(g) of theAct:None
Indicate by check mark whether the registrant is a well-known seasoned issuer, as defined in Rule 405 of the Securities Act. Yes x No ¨Indicate by check mark whether the registrant is not required to file reports pursuant to Section 13 or Section 15(d) of the Act. Yes ¨ No xIndicate by check mark whether the registrant (1) has filed all reports required to be filed by Section 13 or 15(d) of the Securities Exchange Act of 1934 during the preceding 12months (or for such shorter period that the registrant was required to file such reports), and (2) has been subject to such filing requirements for the past 90 days. Yes x No ¨Indicate by check mark whether the registrant has submitted electronically if any, every Interactive Data File required to be submitted pursuant to Rule 405 of Regulation S-T(§232.405 of this chapter) during the preceding 12 months (or for such shorter period that the registrant was required to submit such files). Yes x No ¨Indicate by check mark whether the registrant is a large accelerated filer, an accelerated filer, a non-accelerated filer, or a smaller reporting company, or an emerging growthcompany. See the definitions of "large accelerated filer," "accelerated filer," "smaller reporting company," and " emerging growth company" in Rule 12b-2 of the Exchange Act.(Check One):
Large accelerated filer x Accelerated filer ¨ Emerging growth company ☐ Non-accelerated filer ¨ Smaller reporting company ☐ If an emerging growth company, indicate by check mark if the registrant has elected not to use the extended transition period for complying with any new or revised financialaccounting standards provided pursuant to Section 13(a) of the Exchange Act. ¨
Indicate by check mark whether the registrant is a shell company (as defined in Rule 12b-2 of the Act). Yes ☐ No x
The aggregate market value of the voting Common Stock held by non-affiliates of the registrant, based on the average bid and asked prices on June 30, 2019, the last business dayof the registrant’s most recently completed second fiscal quarter, was approximately $2.6 billion. The number of shares of the registrant’s Common Stock outstanding on February 7,2020 was 164,294,000.
DOCUMENTS INCORPORATED BY REFERENCEPortions of the Definitive Proxy Statement of the Registrant for the Annual Meeting of Shareholders to be held on May 19, 2020 are incorporated by reference in Part III.
1
TABLE OF CONTENTS
Description Page PART I Item 1. Business 3Item 1A. Risk Factors 15Item 1B. Unresolved Staff Comments 27Item 2. Properties 27Item 3. Legal Proceedings 27Item 4. Mine Safety Disclosures 27 PART II Item 5. Market for Registrant’s Common Equity, Related Stockholder Matters and Issuer Purchases of Equity Securities 28Item 6. Selected Financial Data 31Item 7. Management’s Discussion and Analysis of Financial Condition and Results of Operations 33Item 7A. Quantitative and Qualitative Disclosures About Market Risk 60Item 8. Financial Statements and Supplementary Data: Consolidated Balance Sheets 65 Consolidated Statements of Income 66 Consolidated Statements of Comprehensive Income 67 Consolidated Statements of Shareholders’ Equity 68 Consolidated Statements of Cash Flows 69 Notes to Consolidated Financial Statements 70 Management Report On Internal Control Over Financial Reporting 121 Report of Independent Registered Public Accounting Firm 122 Quarterly Consolidated Results of Operations (unaudited) 124Item 9. Changes in and Disagreements With Accountants on Accounting and Financial Disclosure 125Item 9A. Controls and Procedures 125Item 9B. Other Information 125 PART III Item 10. Directors, Executive Officers and Corporate Governance 126Item 11. Executive Compensation 126Item 12. Security Ownership of Certain Beneficial Owners and Management and Related Stockholder Matters 126Item 13. Certain Relationships and Related Transactions, and Director Independence 126Item 14. Principal Accounting Fees and Services 126 PART IV Item 15. Exhibits, Financial Statement Schedules 127Item 16. Form 10-K Summary 129
Signatures 130 Exhibit Index 132
2

PART I
Item 1. Business
General
Fulton Financial Corporation was incorporated under the laws of Pennsylvania on February 8, 1982 and became a bank holding company through the acquisitionof all of the outstanding stock of Fulton Bank, N.A. ("Fulton Bank") on June 30, 1982. In this Report, "the Corporation" refers to Fulton Financial Corporation andits subsidiaries that are consolidated for financial reporting purposes, except that when referring to Fulton Financial Corporation as a public company, as a bankholding company or as a financial holding company, or to the common stock or other securities issued by Fulton Financial Corporation, references to "theCorporation" refer solely to Fulton Financial Corporation. References to "the Parent Company" refer solely to Fulton Financial Corporation. In 2000, theCorporation became a financial holding company as defined in the GLB Act, which gave the Corporation the ability to expand its financial services activities underits holding company structure. See "Competition" and "Supervision and Regulation." The Corporation directly owns 100% of the common stock of Fulton Bankand eight non-bank entities. As of December 31, 2019, the Corporation had approximately 3,500 full-time equivalent employees.
The common stock of the Corporation is listed for quotation on the Global Select Market of The Nasdaq Stock Market under the symbol FULT. The Corporation'sInternet address is www.fult.com. Electronic copies of the Corporation's 2019 Annual Report on Form 10-K are available free of charge by visiting "InvestorRelations" at www.fult.com. Electronic copies of quarterly reports on Form 10-Q and current reports on Form 8-K are also available at this Internet address. Thesereports, as well as any amendments thereto, are posted on the Corporation's website as soon as reasonably practicable after they are electronically filed with theSecurities and Exchange Commission ("SEC").
Banking and Financial Services Subsidiary
The Corporation, through its banking subsidiary, Fulton Bank, delivers financial services within its five-state market area (Pennsylvania, Delaware, Maryland, NewJersey and Virginia) in a personalized, community-oriented style that emphasizes relationship banking. As recently as 2018, the Corporation had six bankingsubsidiaries. During 2018, the Corporation began the process of consolidating its banking subsidiaries into Fulton Bank, which was completed in September 2019.The consolidation process resulted in the Corporation conducting its core banking business through a single bank subsidiary, Fulton Bank, which reduced thenumber of government agencies that regulate the Corporation's banking operations.
The Corporation operates in areas that are home to a wide range of manufacturing, distribution, health care and other service companies. The Corporation is notdependent upon one or a few customers or any one industry, and the loss of any single customer or a few customers would not have a material adverse impact onthe Corporation. However, a large portion of the Corporation's loan portfolio is comprised of commercial loans, commercial mortgage loans and constructionloans. See Item 1A. "Risk Factors - Economic and Credit Risks - The composition of the Corporation's loan and lease portfolio and competition for loans andleases subject the Corporation to credit risk."
The Corporation offers a full range of consumer and commercial banking products and services in its market area. Personal banking services include variouschecking account and savings deposit products, certificates of deposit and individual retirement accounts. The Corporation offers a variety of consumer lendingproducts to customers in its market areas. Secured consumer loan products include home equity loans and lines of credit, which are underwritten based on loan-to-value limits specified in the Corporation's lending policy. The Corporation also offers a variety of fixed, variable and adjustable rate products, includingconstruction loans and jumbo residential mortgage loans. Residential mortgages are offered through Fulton Mortgage Company, which operates as a division ofFulton Bank. Consumer loan products also include automobile loans, personal lines of credit and checking account overdraft protection.
Commercial banking services are provided to small and medium sized businesses (generally with sales of less than $150 million) in the Corporation's market area.The Corporation's policies limit the maximum total lending commitment to a single borrower to $55.0 million as of December 31, 2019, which is significantlybelow the Corporation's regulatory lending limit. In addition, the Corporation has established lower total lending limits based on the Corporation's internal riskrating of the borrower and for certain types of lending commitments. Commercial lending products include commercial, financial, agricultural and real estateloans. Variable, adjustable and fixed rate loans are provided, with variable and adjustable rate loans generally tied to an index, such as the Prime Rate or theLondon Interbank Offered Rate ("LIBOR"), as well as interest rate swaps. The Corporation's commercial lending policy encourages relationship banking andprovides strict guidelines related to customer creditworthiness and collateral requirements for secured loans. In addition, equipment finance leasing, letters ofcredit, cash management services and traditional deposit products are offered to commercial customers.
3

Wealth management services, which include investment management, trust, brokerage, insurance and investment advisory services, are offered to consumer andcommercial customers in the Corporation's market area by Fulton Financial Advisors, a division of Fulton Bank.
The Corporation delivers products and services through traditional branch banking, with a network of full service branch offices. Electronic delivery channelsinclude a network of automated teller machines, telephone banking, mobile banking and online banking. The variety of available delivery channels allowscustomers to access their account information and perform certain transactions, such as depositing checks, transferring funds and paying bills, at virtually any timeof the day. Fulton Bank has 230 branches, not including remote service facilities (mainly stand-alone automated teller machines), and its main office is located inLancaster, Pennsylvania.
Non-Bank Subsidiaries
The Corporation owns 100% of the common stock of five non-bank subsidiaries, which are consolidated for financial reporting purposes: (i) Fulton FinancialRealty Company, which holds title to or leases certain properties where Corporation branch offices and other facilities are located; (ii) Central PennsylvaniaFinancial Corp., which owns limited partnership interests in partnerships invested primarily in low- and moderate-income housing projects; (iii) FFC Management,Inc., which owns certain passive investments; (iv) FFC Penn Square, Inc., which owns trust preferred securities ("TruPS") issued by a subsidiary of Fulton Bank;and (v) Fulton Insurance Services Group, Inc., which engages in the sale of various life insurance products.
The Corporation also owns 100% of the common stock of three non-bank subsidiaries which are not consolidated for financial reporting purposes. The followingtable provides information for these non-bank subsidiaries, whose sole assets consist of junior subordinated deferrable interest debentures issued by theCorporation, as of December 31, 2019:
Subsidiary State of Incorporation Total Assets (in thousands)Columbia Bancorp Statutory Trust Delaware $ 6,186Columbia Bancorp Statutory Trust II Delaware 4,124Columbia Bancorp Statutory Trust III Delaware 6,186
Competition
The banking and financial services industries are highly competitive. Within its geographic region, the Corporation faces direct competition from other commercialbanks, varying in size from local community banks to regional and national banks, credit unions and non-bank entities. As a result of the wide availability ofelectronic delivery channels, the Corporation also faces competition from financial institutions that do not have a physical presence in the Corporation'sgeographic markets.
The industry is also highly competitive due to the various types of entities that now compete aggressively for customers that were traditionally served only by thebanking industry. Under the current financial services regulatory framework, banks, insurance companies and securities firms may affiliate under a financialholding company structure, allowing their expansion into non-banking financial services activities that had previously been restricted. These activities include afull range of banking, securities and insurance activities, including securities and insurance underwriting, issuing and selling annuities and merchant bankingactivities. Moreover, the Corporation faces increased competition from certain non-bank entities, such as financial technology companies and marketplace lenders,which in many cases are not subject to the same regulatory compliance obligations as the Corporation. While the Corporation does not currently engage in manyof the activities described above, further entry into these businesses may enhance the ability of the Corporation to compete in the future.
Supervision and Regulation
The Corporation operates in an industry that is subject to laws and regulations that are enforced by a number of federal and state agencies. Changes in these lawsand regulations, including interpretation and enforcement activities, could impact the cost of operating in the financial services industry, limit or expandpermissible activities or affect competition among banks and other financial institutions.
The Corporation is a registered bank holding company, and has elected to be treated as a financial holding company, under the Bank Holding Company Act of1956, as amended ("BHCA"). The Corporation is regulated, supervised and examined by the Board of Governors of the Federal Reserve System ("Federal ReserveBoard"). Fulton Bank is a national banking association chartered
4

under the laws of the United States and is primarily regulated by the Office of the Comptroller of the Currency ("OCC"). In addition, the Consumer FinancialProtection Bureau ("CFPB") examines Fulton Bank for compliance with most federal consumer financial protection laws, including the laws relating to fair lendingand prohibiting unfair, deceptive or abusive acts or practices in connection with the offer, sale or provision of consumer financial products or services, and forenforcing such laws with respect to Fulton Bank and its affiliates.
Federal statutes that apply to the Corporation and its subsidiaries include the Gramm-Leach-Bliley Act ("GLB Act"), the BHCA, the Dodd-Frank Wall StreetReform and Consumer Protection Act ("Dodd-Frank Act"), the Federal Reserve Act, the National Bank Act and the Federal Deposit Insurance Act, among others. Ingeneral, these statutes, regulations promulgated thereunder, and related interpretations establish the eligible business activities of the Corporation, certainacquisition and merger restrictions, limitations on intercompany transactions (such as loans and dividends), cash reserve requirements, lending limitations,compliance with unfair, deceptive and abusive acts and practices prohibitions, limitations on investments, and capital adequacy requirements, among other things.Such laws and regulations are intended primarily for the protection of depositors, customers and the Federal Deposit Insurance Fund ("DIF"), as well as tominimize risk to the banking system as a whole, and not for the protection of the Corporation's shareholders or non-depository creditors.
The following discussion is general in nature and seeks to highlight some of the more significant regulatory requirements to which the Corporation is subject, butdoes not purport to be complete or to describe all applicable laws and regulations.
BHCA - The Corporation is subject to regulation and examination by the Federal Reserve Board, and is required to file periodic reports and to provide additionalinformation that the Federal Reserve Board may require. The BHCA regulates activities of bank holding companies, including requirements and limitations relatingto capital, transactions with officers, directors and affiliates, securities issuances, dividend payments and extensions of credit, among others. The BHCA permitsthe Federal Reserve Board, in certain circumstances, to issue cease and desist orders and other enforcement actions against bank holding companies (and their non-banking affiliates) to correct or curtail unsafe or unsound banking practices. In addition, the Federal Reserve Board must approve certain proposed changes inorganizational structure or other business activities before they occur. The BHCA imposes certain restrictions upon the Corporation regarding the acquisition ofsubstantially all of the assets of, or direct or indirect ownership or control of, any bank for which it is not already the majority owner.
Source of Strength - Federal banking law requires bank holding companies such as the Corporation to act as a source of financial strength and to commit capitaland other financial resources to each of their banking subsidiaries. This support may be required at times when the Corporation may not be able to provide suchsupport without adversely affecting its ability to meet other obligations, or when, absent such requirements, the Corporation might not otherwise choose toprovide such support. If the Corporation is unable to provide such support, the Federal Reserve Board could instead require the divestiture of the Corporation'ssubsidiaries and impose operating restrictions pending the divestiture. If a bank holding company commits to a federal bank regulator that it will maintain thecapital of its bank subsidiary, whether in response to the Federal Reserve Board's invoking its source of strength authority or in response to other regulatorymeasures, that commitment will be assumed by the bankruptcy trustee and the bank will be entitled to priority payment in respect of that commitment.
The Economic Growth, Regulatory Relief, and Consumer Protection Act - In May 2018, the Economic Growth, Regulatory Relief, and Consumer Protection Act("Economic Growth Act") became law. Among other things, the Economic Growth Act amended certain provisions of the Dodd-Frank Act to raise the total assetthreshold for mandatory applicability of enhanced prudential standards for bank holding companies to $250 billion and to allow the Federal Reserve Board toapply enhanced prudential standards to bank holding companies with between $100 billion and $250 billion in total assets to address financial stability risks orsafety and soundness concerns. The Economic Growth Act's increased threshold took effect immediately for bank holding companies with total assets of less than$100 billion, including the Corporation.
The Economic Growth Act also enacted other important changes, for which the banking agencies issued certain corresponding proposed and interim final rules,including:
• Raising the total asset threshold for Dodd-Frank Act company-run stress tests from $10 billion to $250 billion;• Prohibiting federal banking agencies from imposing higher capital requirements for High Volatility Commercial Real Estate ("HVCRE") exposures unless
such exposures meet the statutory definition for high volatility acquisition, development or construction ("ADC") loans in the Economic Growth Act;• Exempting from appraisal requirements certain transactions involving real property in rural areas and valued at less than $400,000;
5

• Providing that reciprocal deposits are not treated as brokered deposits in the case of a "well capitalized" institution that received a "outstanding" or "good"rating on its most recent examination to the extent the amount of such deposits does not exceed the lesser of $5 billion or 20% of the bank's totalliabilities;
• Directing the CFPB to provide guidance on the applicability of the TILA-RESPA Integrated Disclosure rule to mortgage assumption transactions andconstruction-to-permanent home loans, as well the extent to which lenders can rely on model disclosures that do not reflect recent regulatory changes.
Given Fulton Bank's size, a number of additional benefits afforded to community banks under applicable asset thresholds are not available to Fulton Bank.
Consumer Financial Protection Laws and Enforcement - The CFPB and the federal banking agencies continue to focus attention on consumer protection laws andregulations. The CFPB is responsible for promoting fairness and transparency for mortgages, credit cards, deposit accounts and other consumer financial productsand services and for interpreting and enforcing the federal consumer financial laws that govern the provision of such products and services. Federal consumerfinancial laws enforced by the CFPB include, but are not limited to, the Equal Credit Opportunity Act ("ECOA"), Truth in Lending Act ("TILA"), the Truth inSavings Act, Home Mortgage Disclosure Act, Real Estate Settlement Procedures Act ("RESPA"), the Fair Debt Collection Practices Act, and the Fair CreditReporting Act. The CFPB is also authorized to prevent any institution under its authority from engaging in an unfair, deceptive, or abusive act or practice inconnection with consumer financial products and services. As a residential mortgage lender, the Corporation is subject to multiple federal consumer protectionstatutes and regulations, including, but not limited to, those referenced above.
In particular, fair lending laws prohibit discrimination in the provision of banking services. Fair lending laws include ECOA and the Fair Housing Act ("FHA"),which outlaw discrimination in credit and residential real estate transactions on the basis of prohibited factors including, among others, race, color, national origin,gender, and religion. A lender may be liable for policies that result in a disparate treatment of, or have a disparate impact on, a protected class of applicants orborrowers. If a pattern or practice of lending discrimination is alleged by a regulator, then that agency may refer the matter to the U.S. Department of Justice("DOJ") for investigation. Failure to comply with these and similar statutes and regulations can result in the Corporation becoming subject to formal or informalenforcement actions, the imposition of civil money penalties and consumer litigation.
The CFPB has exclusive examination and primary enforcement authority with respect to compliance with federal consumer financial protection laws andregulations by institutions under its supervision and is authorized, individually or jointly with the federal banking agencies, to conduct investigations to determinewhether any person is, or has, engaged in conduct that violates such laws or regulations. The CFPB may bring an administrative enforcement proceeding or civilaction in federal district court. In addition, in accordance with a memorandum of understanding entered into between the CFPB and the DOJ, the two agencieshave agreed to coordinate efforts related to enforcing the fair lending laws, which includes information sharing and conducting joint investigations; however, theextent to which such coordination may actually occur is unpredictable and may change over time as the result of a number of factors, including changes inleadership at the DOJ and CFPB, as well as changes in the enforcement policies and priorities of each agency. As an independent bureau funded by the FederalReserve Board, the CFPB may impose requirements that are more stringent than those of the other bank regulatory agencies.
As an insured depository institution with total assets of more than $10 billion, Fulton Bank is subject to the CFPB's supervisory and enforcement authorities. TheDodd-Frank Act also permits states to adopt stricter consumer protection laws and state attorneys general to enforce consumer protection rules issued by the CFPB.As a result, Fulton Bank operates in a stringent consumer compliance environment.
Ability-to-pay rules and qualified mortgages - Under CFPB rules that implement TILA, mortgage lenders are required to make a reasonable and good faithdetermination, based on verified and documented information, that a consumer applying for a residential mortgage loan has a reasonable ability to repay the loanaccording to its terms. These rules prohibit creditors, such as Fulton Bank, from extending residential mortgage loans without regard for the consumer's ability torepay and add restrictions and requirements to residential mortgage origination and servicing practices. In addition, these rules restrict the imposition ofprepayment penalties and compensation practices relating to residential mortgage loan origination. Mortgage lenders are required to determine consumers' abilityto repay in one of two ways. The first alternative requires the mortgage lender to consider eight underwriting factors when making the credit decision. Themortgage lender may also originate "qualified mortgages," which are entitled to a presumption that the creditor making the loan satisfied the ability-to-repayrequirements. In general, a qualified mortgage is a residential mortgage loan that does not have certain high risk features, such as negative amortization, interest-only payments, balloon payments, or a term exceeding 30 years. In addition, to be a qualified mortgage, the points and fees paid by a consumer cannot exceed 3%of the total loan amount, and the borrower's total debt-to-income ratio must be no higher than 43% (subject to certain limited exceptions for loans eligible forpurchase, guarantee or insurance by a government sponsored enterprise or a federal agency).
6

Integrated disclosures under the Real Estate Settlement Procedures Act and the Truth in Lending Act - Under CFPB rules, mortgage lenders are required to providea loan estimate, not later than the third business day after submission of a loan application, and a closing disclosure at least three days prior to the loan closing.The loan estimate must detail the terms of the loan, including, among other things, expenses, projected monthly mortgage payments and estimated closing costs.The closing disclosure must include, among other things, closing costs and a comparison of costs reported on the loan estimate to actual charges to be applied atclosing.
Volcker Rule - Provisions of the Dodd-Frank Act, commonly known as the "Volcker Rule," prohibit banks and their affiliates from engaging in proprietary tradingand investing in and sponsoring hedge funds and private equity funds and other private funds that are, among other things, offered within specified exemptions tothe Investment Company Act, known as "covered funds," subject to certain exemptions. In October 2019, the federal banking agencies, the Commodity FuturesTrading Commission and the SEC (the "Volcker Rule Regulators") finalized amendments, effective on January 1, 2020, but with a required compliance date ofJanuary 1, 2021, to their regulations implementing the Volcker Rule, tailoring compliance requirements based on the size and scope of a banking entity's tradingactivities and clarifying and amending certain definitions, requirements and exemptions. In January 2020, the Volcker Rule Regulators issued a proposal intendedto clarify and amend certain definitions, requirements and exemptions relating to covered funds and the currently effective regulations. The Corporation iscurrently evaluating the potential impact of the recently finalized and proposed amendments, and the ultimate impact of the amendments on the Corporation'sinvesting and trading activities will depend on, among other things, further rulemaking and guidance from the Volcker Rule Regulators and the development ofmarket practices and standards.
Capital Requirements - The Corporation and Fulton Bank are subject to risk-based requirements and rules issued by the federal banking agencies (the "Basel IIIRules") that are based upon the final framework of the Basel Committee for strengthening capital and liquidity regulation. Under the Basel III Rules, theCorporation and Fulton Bank apply the standardized approach in measuring their risk-weighted assets ("RWA") and regulatory capital.
Under the Basel III Rules, the Corporation and Fulton Bank are subject to the following minimum capital ratios:
• A minimum Common Equity Tier 1 ("CET1") capital ratio of 4.50% of RWA;• A minimum Tier 1 capital ratio of 6.00% of RWA,; and• A minimum Total capital ratio of 8.00% of RWA.
The Basel III Rules also include a "capital conservation buffer" of 2.5%, composed entirely of CET1 capital, in addition to the minimum capital to RWA ratiosoutlined above, resulting in effective minimum CET1, Tier 1 and total capital ratios of 7.0%, 8.5% and 10.5%, respectively. The capital conservation buffer isdesigned to absorb losses during periods of economic stress. Banking institutions with a capital ratio above the minimum, but below the conservation buffer, willface constraints on dividends, equity repurchases, and compensation based on the amount of the shortfall and the institution's "eligible retained income" (that is,four quarter trailing net income, net of distributions and tax effects not reflected in net income). If Fulton Bank fails to maintain the required minimum capitalconservation buffer, the Corporation will be subject to limits, and possibly prohibitions, on its ability to obtain capital distributions from Fulton Bank. If theCorporation does not receive sufficient cash dividends from Fulton Bank, it may not have sufficient funds to pay dividends on its capital stock, service its debtobligations or repurchase its common stock. In addition, the restrictions on payments of discretionary cash bonuses to executive officers may make it moredifficult for the Corporation to retain key personnel. As of December 31, 2019, the Corporation and Fulton Bank met the minimum capital requirements, includingthe capital conservation buffer, as prescribed in the Basel III Rules.
The Corporation and Fulton Bank are also required to maintain a minimum Tier 1 leverage ratio (Tier 1 capital to a quarterly average of non-risk weighted totalassets) of 4%. The Corporation and Fulton Bank are not subject to the Basel III Rules' countercyclical buffer or the supplementary leverage ratio.
The Basel III Rules provide for a number of deductions from and adjustments to CET1. These include, for example, goodwill, other intangible assets, and deferredtax assets ("DTAs") that arise from net operating loss and tax credit carryforwards net of any related valuation allowance. Mortgage servicing rights ("MSRs"),DTAs arising from temporary differences that could not be realized through net operating loss carrybacks and investments in non-consolidated financialinstitutions must also be deducted from CET1 to the extent that they exceed certain thresholds. In July 2019, the federal banking agencies adopted final rulesintended to simplify the capital treatment for certain DTAs, MSRs, investments in non-consolidated financial entities and minority interests for bankingorganizations, such as the Corporation and Fulton Bank, that are not subject to the advanced approaches framework (the "Capital Simplification Rules"). TheCapital Simplification Rules were effective for the Corporation as of January 1, 2020.
The Corporation and Fulton Bank, as non-advanced approaches banking organizations, made a one-time, permanent election under the Basel III Rules to excludethe effects of certain components of accumulated other comprehensive income ("AOCI") included in shareholders' equity under U.S. GAAP in determiningregulatory capital ratios.
7

Under the Basel III Rules, certain off-balance sheet commitments and obligations are converted into RWA, that together with on-balance sheet assets, are the baseagainst which regulatory capital is measured. The Basel III Rule defined the risk-weighting categories for bank holding companies and banks that follow thestandardized approach, such as the Corporation and Fulton Bank, based on a risk-sensitive analysis, depending on the nature of the exposure.
The Capital Simplifications Rules adopted in July 2019 eliminated the standalone prior approval requirement in the Basel III Capital Rules for any repurchase ofcommon stock. In certain circumstances, the Corporation's repurchases of its common stock may be subject to a prior approval or notice requirement under otherregulations or policies of the Federal Reserve Board. Any redemption or repurchase of preferred stock or subordinated debt remains subject to the prior approval ofthe Federal Reserve Board.
In December 2017, the Basel Committee published the last version of the Basel III accord, generally referred to as "Basel IV." Among other things, these standardsrevise the Basel Committee's standardized approach for credit risk (including by recalibrating risk weights and introducing new capital requirements for certain"unconditionally cancellable commitments," such as unused credit card and home equity lines of credit) and provides a new standardized approach for operationalrisk capital. Under the Basel framework, these standards will generally be effective on January 1, 2022, with an aggregate output floor phasing in through January1, 2027. Under the current U.S. capital rules, operational risk capital requirements and a capital floor apply only to advanced approaches institutions, and not to theCorporation or Fulton Bank. The impact of Basel IV on the Corporation and Fulton Bank will depend on the manner in which it is implemented by the federalbanking agencies.
As noted above, the federal banking agencies have implemented the provisions of the Economic Growth Act that provide certain capital relief pursuant a new andnarrower definition of HVCRE exposures that are subject to a heightened risk weight.
Stress Testing and Capital Planning - As a result of the Economic Growth Act and implementing regulations adopted by the Federal Reserve Board and OCC, theCorporation and Fulton Bank are no longer subject to company-run stress testing requirements under the Dodd-Frank Act. The Federal Reserve Board continues tosupervise the Corporation's capital planning and risk management practices through the regular supervisory process.
Current Expected Credit Losses Transitional Provisions - In June 2016, the Financial Accounting Standards Board ("FASB") issued an accounting standard update,"Financial Instruments-Credit Losses (Topic 326), Measurement of Credit Losses on Financial Instruments," which replaces the existing "incurred loss" model forrecognizing credit losses with an "expected loss" model referred to as the Current Expected Credit Loss ("CECL") model. Under the CECL model, the Corporationis required to present certain financial assets carried at amortized cost, such as loans held for investment and held-to-maturity debt securities, at the net amountexpected to be collected. The measurement of expected credit losses is based on information about past events, including historical experience, current conditions,and reasonable and supportable forecasts that affect the collectability of the reported amount. In December 2018, the federal banking agencies approved a finalrule modifying their regulatory capital rules and providing an option to phase in over a period of three years the day-one regulatory capital effects of the CECLmodel. The final rule also revises the agencies' other rules to reflect the update to the accounting standards. The new CECL standard became effective for theCorporation on January 1, 2020. See "Note 1 - Summary of Significant Accounting Policies - Recently Issued Accounting Standards" in the Notes to ConsolidatedFinancial Statements in Item 8. "Financial Statements and Supplementary Data" for additional information on CECL and its impact on the Corporation's allowancefor credit losses and regulatory capital.
Prompt Corrective Action - The Federal Deposit Insurance Corporation Improvement Act ("FDICIA") established a system of prompt corrective action to attemptto resolve the problems of undercapitalized institutions. The FDICIA, among other things, establishes five capital categories for FDIC-insured banks: "wellcapitalized," "adequately capitalized," "undercapitalized," "significantly undercapitalized" and "critically undercapitalized." An insured depository institution istreated as well capitalized if its total risk-based capital ratio is 10.00% or greater, its Tier 1 risk-based capital ratio is 8.00% or greater, its CET1 risk-based capitalratio is 6.50% or greater and its Tier 1 leverage capital ratio is 5.00% or greater, and it is not subject to any order or directive to meet a specific capital level. As ofDecember 31, 2019, Fulton Bank's capital ratios were above the minimum levels required to be considered "well capitalized" by the OCC.
Under this system, the federal banking agencies are required to take certain, and authorized to take other, prompt corrective actions against undercapitalizedinstitutions, the severity of which increase as the capital category of an institution declines, including restrictions on growth of assets and other forms ofexpansion. Generally, a capital restoration plan must be filed with the institution's primary federal regulator within 45 days of the date an institution receives noticethat it is "undercapitalized," "significantly undercapitalized" or "critically undercapitalized." Although prompt corrective action regulations apply only to depositoryinstitutions and not to bank holding companies, the holding company must guarantee any such capital restoration plan in certain circumstances. The liability ofthe parent holding company under any such guarantee is limited to the lesser of five percent of the bank's assets at the time it became "undercapitalized" or theamount needed to comply. The parent holding company might also
8

be liable for civil money damages for failure to fulfill that guarantee. In the event of the bankruptcy of the parent holding company, such guarantee would takepriority over the parent's general unsecured creditors.
In addition, regulators consider both risk-based capital ratios and other factors that can affect a bank's financial condition, including (i) concentrations of creditrisk, (ii) interest rate risk, and (iii) risks from non-traditional activities, along with an institution's ability to manage those risks, when determining capital adequacy.This evaluation is made during the institution's safety and soundness examination. An institution may be downgraded to, or deemed to be in, a capital categorythat is lower than is indicated by its capital ratios if it is determined to be in an unsafe or unsound condition or if it receives an unsatisfactory examination ratingwith respect to certain matters.
Brokered Deposits - The FDICIA and FDIC regulations limit the ability of an insured depository institution, such as Fulton Bank, to accept, renew or roll overbrokered deposits unless the institution is well-capitalized under the prompt corrective action framework described above, or unless it is adequately capitalized andobtains a waiver from the FDIC. In addition, less than well-capitalized banks are subject to restrictions on the interest rates they may pay on deposits. In December2019, the FDIC issued a proposed rule that seeks to bring brokered deposits regulations in line with modern deposit taking methods and that may reduce theamount of deposits that would be classified as brokered. The impact on the Corporation and Fulton Bank from any changes to the brokered deposit regulationswill depend on the final form of the proposed rule and the development of market practices and structures.
Loans and Dividends from Bank Subsidiary - There are various restrictions on the extent to which Fulton Bank can make loans and other extensions of credit(including credit exposure arising from repurchase and reverse repurchase agreements, securities borrowing and derivative transactions) to, or enter into certaintransactions with, its affiliates, which include the Corporation and its non-bank subsidiaries. In general, these restrictions require that such transactions: arelimited, as to any one of the Corporation or its non-bank subsidiaries, to 10% of Fulton Bank's regulatory capital (20% in the aggregate to all such entities); satisfycertain qualitative limitations, including that any covered transaction be made on an arm's length basis; and, in the case of extensions of credit, be secured bydesignated amounts of specified collateral.
For safety and soundness reasons, banking regulations also limit the amount of cash that can be transferred from Fulton Bank to the Parent Company in the formof dividends. Generally, dividends are limited to the lesser of the amounts calculated under an earnings retention test and an undivided profits test. Under theearnings retention test, without the prior approval of the OCC, a dividend may not be paid if the total of all dividends declared by a bank in any calendar year is inexcess of the current year's net income combined with the retained net income of the two preceding years. Under the undivided profits test, a dividend may not bepaid in excess of a bank's undivided profits. In addition, banks are prohibited from paying dividends when doing so would cause them to fall below the regulatoryminimum capital levels. See "Note 11 - Regulatory Matters," in the Notes to Consolidated Financial Statements in Item 8 "Financial Statements and SupplementaryData" for additional information regarding regulatory capital and dividend and loan limitations.
Federal Deposit Insurance - The deposits of Fulton Bank are insured up to the applicable limits by the DIF, generally up to $250,000 per insured depositor. FultonBank pays deposit insurance premiums based on assessment rates established by the FDIC. The FDIC has established a risk-based assessment system under whichinstitutions are classified and pay premiums according to their perceived risk to the DIF. In addition, the FDIC possesses backup enforcement authority over adepository institution holding company, such as the Corporation, if the conduct or threatened conduct of such holding company poses a risk to the DIF, althoughsuch authority may not be used if the holding company is generally in sound condition and does not pose a foreseeable and material risk to the DIF.
FDIC assessment rates for large institutions that have more than $10 billion in assets, such as Fulton Bank, are calculated based on a "scorecard" methodology thatseeks to capture both the probability that an individual large institution will fail and the magnitude of the impact on the DIF if such a failure occurs, basedprimarily on the difference between the institution's average of total assets and average tangible equity. The FDIC has the ability to make discretionary adjustmentsto the total score, up or down, based upon significant risk factors that are not adequately captured in the scorecard. For large institutions, including Fulton Bank,after accounting for potential base-rate adjustments, the total assessment rate could range from 1.5 to 40 basis points on an annualized basis. An institution'sassessment is determined by multiplying its assessment rate by its assessment base, which is asset based.
The Tax Cuts and Jobs Act of 2017 (the "Tax Act"), which was signed into law on December 22, 2017, disallows the deduction of FDIC deposit insurancepremium payments for banking organizations with total consolidated assets of $50 billion or more. For banks with less than $50 billion in total consolidatedassets, such as Fulton Bank, the premium deduction is phased out based on the proportion of the bank's assets exceeding $10 billion.
Anti-Money Laundering Requirements and the USA Patriot Act - The USA PATRIOT Act of 2001 ("Patriot Act"), which amended the Bank Secrecy Act of 1970("BSA"), and other anti-money laundering ("AML") laws and regulations impose affirmative
9
obligations on a wide range of financial institutions to maintain appropriate policies, procedures and controls to detect, prevent and report money laundering andterrorist financing.
Among other requirements, the Patriot Act and related regulations impose the following requirements on financial institutions:
• Establishment of AML programs;• Establishment of a program specifying procedures for obtaining identifying information from customers seeking to open new accounts, including
verifying the identity of customers within a reasonable period of time;• Establishment of enhanced due diligence policies, procedures and controls designed to detect and report money laundering; and• Prohibition on correspondent accounts for foreign shell banks and compliance with recordkeeping obligations with respect to correspondent accounts of
foreign banks.
Failure to comply with the requirements of the Patriot Act and other AML laws and regulations could have serious legal, financial, regulatory and reputationalconsequences. In addition, bank regulators will consider a holding company's effectiveness in combating money laundering when ruling on BHCA and BankMerger Act applications. In addition, financial institutions are subject to customer due diligence requirements, issued by the Financial Crimes EnforcementNetwork, to identify and verify the identity of natural persons, known as beneficial owners, who own, control, and profit from legal entity customers when thosecustomers open accounts. The Corporation has adopted policies, procedures and controls to address compliance with the Patriot Act and other AML laws andregulations, and will continue to revise and update its policies, procedures and controls to reflect required changes. See Item 1A. "Risk Factors - Legal, Complianceand Reputational Risks - Failure to comply with the BSA, the Patriot Act and related AML requirements, or with sanctions laws, could subject the Corporation toenforcement actions, fines, penalties, sanctions and other remedial actions."
Commercial Real Estate Guidance - Under guidance issued by the federal banking agencies, the agencies have expressed concerns with institutions that easecommercial real estate underwriting standards, and have directed financial institutions to maintain underwriting discipline and exercise risk management practicesto identify, measure and monitor lending risks. The agencies have also issued guidance that requires a financial institution to employ enhanced risk managementpractices if the institution is exposed to significant concentration risk. Under that guidance, an institution is potentially exposed to significant concentration risk if(i) total reported loans for construction, land development, and other land represent 100% or more of total capital or (ii) total reported loans secured by multi-family and non-farm residential properties, loans for construction, land development, and other land loans otherwise sensitive to the general commercial real estatemarket, including loans to commercial real estate related entities, represent 300% or more of total capital, and the outstanding balance of the institution'scommercial real estate loan portfolio has increased by 50% or more during the prior 36 months.
Community Reinvestment - Under the Community Reinvestment Act of 1977 ("CRA"), Fulton Bank has a continuing and affirmative obligation, consistent with itssafe and sound operation, to ascertain and meet the credit needs of its entire community, including low- and moderate-income areas. The CRA does not establishspecific lending requirements or programs for financial institutions, nor does it limit an institution's discretion to develop the types of products and services that itbelieves are best suited to its particular community. The CRA requires an institution's primary federal regulator, in connection with its examination of theinstitution, to assess the institution's record of meeting the credit needs of its community and to take such record into account in its evaluation of certainapplications by such institution. The assessment focuses on three tests: (1) a lending test, to evaluate the institution's record of making loans, includingcommunity development loans, in its designated assessment areas; (2) an investment test, to evaluate the institution's record of investing in communitydevelopment projects, affordable housing, and programs benefiting low- or moderate-income individuals and areas and small businesses; and (3) a service test, toevaluate the institution's delivery of banking services throughout its CRA assessment area, including low- and moderate-income areas. The CRA also requires allinstitutions to make public disclosure of their CRA ratings. As of December 31, 2019, Fulton Bank was rated as "satisfactory." Regulations require that FultonBank publicly disclose certain agreements that are in fulfillment of CRA. Fulton Bank is not a party to any such agreements at this time.
In December 2019, the OCC and the FDIC issued a notice of proposed rulemaking with the stated intention to (i) clarify which activities qualify for CRA credit; (ii)update where activities count for CRA credit; (iii) create a more transparent and objective method for measuring CRA performance; and (iv) provide for moretransparent, consistent, and timely CRA-related data collection, recordkeeping, and reporting. However, the Federal Reserve Board has not joined the proposedrulemaking. The impact on Fulton Bank from any changes to the CRA regulations will depend on the final form of the proposed rule and how it is implementedand applied.
Standards for Safety and Soundness - Pursuant to the requirements of FDICIA, as amended by the Riegle Community Development and Regulatory ImprovementAct of 1994 ("Riegle-Neal Act"), the federal bank regulatory agencies adopted guidelines establishing
10

general standards relating to internal controls, information systems, internal audit systems, loan documentation, credit underwriting, interest rate risk exposure,asset growth, asset quality, earnings, compensation, fees and benefits. In general, the guidelines require, among other things, appropriate systems and practices toidentify and manage the risks and exposures specified in the guidelines. In addition, the agencies have adopted regulations that authorize, but do not require, anagency to order an institution that has been given notice by an agency that it is not satisfying any of such safety and soundness standards to submit a complianceplan. If the institution fails to submit an acceptable compliance plan or fails in any material respect to implement an accepted compliance plan, the regulator mustissue an order directing corrective actions and may issue an order directing other actions of the types to which a significantly undercapitalized institution is subjectunder the "prompt corrective action" provisions of FDICIA. If the institution fails to comply with such an order, the regulator may seek to enforce such order injudicial proceedings and to impose civil money penalties.
The guidelines prohibit excessive compensation as an unsafe and unsound practice and describe compensation as excessive when the amounts paid areunreasonable or disproportionate to the services performed by an executive officer, employee, director or principal shareholder. The federal banking agencies haveissued guidance that provides that, to be consistent with safety and soundness principles, a banking organization's incentive compensation arrangements should:(1) provide employees with incentives that appropriately balance risk and reward; (2) be compatible with effective controls and risk management; and (3) besupported by strong corporate governance, including active and effective oversight by the banking organization's board of directors. Monitoring methods andprocesses used by a banking organization should be commensurate with the size and complexity of the organization and its use of incentive compensation.
During the second quarter of 2016, as required by the Dodd-Frank Act, the federal bank regulatory agencies and the SEC proposed revised rules on incentive-basedcompensation arrangements at specified regulated entities having at least $1 billion in total assets (including the Corporation and Fulton Bank), but these proposedrules have not been finalized.
Privacy Protection and Cybersecurity - Fulton Bank is subject to regulations implementing the privacy protection provisions of the GLB Act. These regulationsrequire Fulton Bank to disclose its privacy policy, including identifying with whom it shares "nonpublic personal information," to customers at the time ofestablishing the customer relationship and annually thereafter. The regulations also require Fulton Bank to provide its customers with initial and annual noticesthat accurately reflect its privacy policies and practices. In addition, to the extent its sharing of such information is not covered by an exception, Fulton Bank isrequired to provide its customers with the ability to "opt-out" of having Fulton Bank share their nonpublic personal information with unaffiliated third parties.
Fulton Bank is subject to regulatory guidelines establishing standards for safeguarding customer information. These regulations implement certain provisions ofthe GLB Act. The guidelines describe the federal bank regulatory agencies' expectations for the creation, implementation and maintenance of an informationsecurity program, which would include administrative, technical and physical safeguards appropriate to the size and complexity of the institution and the natureand scope of its activities. The standards set forth in the guidelines are intended to ensure the security and confidentiality of customer records and information,protect against any anticipated threats or hazards to the security or integrity of such records and protect against unauthorized access to or use of such records orinformation that could result in substantial harm or inconvenience to any customer. These guidelines, along with related regulatory materials, increasingly focus onrisk management and processes related to information technology and the use of third parties in the provision of financial services. In October 2016, the federalbanking agencies issued an advance notice of proposed rulemaking on enhanced cybersecurity risk-management and resilience standards that would apply to largeand interconnected banking organizations and to services provided by third parties to these firms. As proposed, these enhanced standards would apply only todepository institutions and depository institution holding companies with total consolidated assets of $50 billion or more; however, it is possible that if theseenhanced standards are implemented, the Federal Reserve Board will consider them in connection with the examination and supervision of banking organizationsbelow the $50 billion threshold. The federal banking agencies have not yet taken further action on these proposed standards.
In addition, certain states have enacted laws establishing consumer privacy protections and data security requirements in their respective states. For example, theCalifornia Consumer Privacy Act (“CCPA”) gives California residents new rights to receive certain disclosures regarding the collection, use, and sharing of“Personal Information,” as well as rights to access, delete, and restrict the sale of certain personal information collected about them. The CCPA went into effect onJanuary 1, 2020, and Fulton Bank will need to comply with the CCPA in serving the small number of its customers that are residents of California. Privacy anddata security legislation remained a priority issue in 2019. Attempts by state and local governments to regulate consumer privacy have the potential to create apatchwork of differing and/or conflicting state regulations.
Federal Reserve System - Federal Reserve Board regulations require depository institutions to maintain cash reserves against specified deposit liabilities. The dollaramount of a depository institution's reserve requirement is determined by applying the reserve ratios specified in the Federal Reserve Board's Regulation D to aninstitution's reservable liabilities (primarily net transaction
11

accounts such as NOW and demand deposit accounts). A reserve of 3% must be maintained against aggregate transaction account balances of between $16.9million and $127.5 million (subject to adjustment by the Federal Reserve Board) plus a reserve of 10% (subject to adjustment by the Federal Reserve Board withina range of between 8% and 14%) against that portion of total transaction account balances in excess of $127.5 million. The first $16.9 million of otherwisereservable balances (subject to adjustment by the Federal Reserve Board) are exempt from the reserve requirements. Fulton Bank is in compliance with theforegoing requirements.
Required reserves must be maintained in the form of either vault cash, an account at a Federal Reserve Bank or a pass-through account as defined by the FederalReserve Board. Pursuant to the Emergency Economic Stabilization Act of 2008, the Federal Reserve Banks pay interest on depository institutions' required andexcess reserve balances. The interest rate paid on required reserve balances is currently the average target federal funds rate over the reserve maintenance period.The rate on excess balances will be set equal to the lowest target federal funds rate in effect during the reserve maintenance period.
Acquisitions - The BHCA requires a bank holding company to obtain the prior approval of the Federal Reserve Board before:
• the company may acquire direct or indirect ownership or control of any voting shares of any bank or savings and loan association, if after such acquisitionthe bank holding company will directly or indirectly own or control more than five percent of any class of voting securities of the institution;
• any of the company's subsidiaries, other than a bank, may acquire all or substantially all of the assets of any bank or savings and loan association; or• the company may merge or consolidate with any other bank or financial holding company.
Prior regulatory approval is also generally required for mergers, acquisitions and consolidations involving other insured depository institutions. In reviewingacquisition and merger applications, the bank regulatory authorities will consider, among other things, the competitive effect of the transaction, financial andmanagerial issues, including the capital position of the combined organization, convenience and needs factors, including the applicant's CRA record, theeffectiveness of the subject organizations in combating money laundering activities, and the transaction's effect on the stability of the U.S. banking or financialsystem.
The Change in Bank Control Act prohibits a person, entity or group of persons or entities acting in concert, from acquiring "control" of a bank holding companyor bank unless the Federal Reserve Board has been given prior notice and has not objected to the transaction. Under Federal Reserve Board regulations, theacquisition of 10% or more (but less than 25%) of the voting stock of a corporation would, under the circumstances set forth in the regulations, create a rebuttablepresumption of acquisition of control of the corporation.
Permissible Activities - As a bank holding company, the Corporation may engage in the business of banking, managing or controlling banks, performing servicingactivities for subsidiaries, and engaging in activities that the Federal Reserve Board has determined, by order or regulation, are so closely related to banking as to bea proper incident thereto. As a financial holding company, the Corporation may also may engage in or acquire and retain the shares of a company engaged inactivities that are financial in nature or incidental or complementary to activities that are financial in nature as long as the Corporation continues to meet theeligibility requirements for financial holding companies, including that the Corporation and each of its U.S. depository institution subsidiaries remain "well-capitalized" and "well-managed."
A depository institution is considered "well-capitalized" if it satisfies the requirements of the Prompt Corrective Action framework described above. A depositoryinstitution is considered "well-managed" if it received a composite rating and management rating of at least "satisfactory" in its most recent examination. If afinancial holding company ceases to be well-capitalized and well-managed, the financial holding company must enter into a non-public confidential agreementwith the Federal Reserve Board to comply with all applicable capital and management requirements. Until the financial holding company returns to compliance, theFederal Reserve Board may impose limitations or conditions on the conduct of its activities, and the company may not commence any new non-banking financialactivities permissible for financial holding companies or acquire a company engaged in such financial activities without prior approval of the Federal ReserveBoard. If the company does not timely return to compliance, the Federal Reserve Board may require divestiture of the financial holding company's bankingsubsidiaries. Bank holding companies and banks must also be well-capitalized and well-managed in order to acquire banks located outside their home state. Afinancial holding company will also be limited in its ability to commence non-banking financial activities or acquire a company engaged in such financial activitiesif any of its insured depository institution subsidiaries fails to maintain a "satisfactory" rating under the CRA.
Activities that are "financial in nature" include securities underwriting, dealing and market making, advising mutual funds and investment companies, insuranceunderwriting and agency, merchant banking, and activities that the Federal Reserve Board, in consultation with the Secretary of the Treasury, determines to befinancial in nature or incidental to such financial activity.
12
"Complementary activities" are activities that the Federal Reserve Board determines upon application to be complementary to a financial activity and that do notpose a safety and soundness issue.
Enforcement Powers of Federal Banking Regulators - The Federal Reserve Board and other U.S. banking agencies have broad enforcement powers with respect toan insured depository institution and its holding company, including the power to (i) impose cease and desist orders, substantial fines and other civil penalties, (ii)terminate deposit insurance, and (iii) appoint a conservator or receiver. Failure to comply with applicable laws or regulations could subject the Corporation orFulton Bank, as well as their officers and directors, to administrative sanctions and potentially substantial civil and criminal penalties.
In addition, under the BHCA, the Federal Reserve Board has the authority to require a bank holding company to terminate any activity or to relinquish control of anon-bank subsidiary upon the Federal Reserve Board's determination that such activity or control constitutes a serious risk to the financial soundness and stabilityof a depository institution subsidiary of the bank holding company.
Federal Securities Laws - The Corporation is subject to the periodic reporting, proxy solicitation, tender offer, insider trading, corporate governance and otherrequirements under the Securities Exchange Act of 1934. Among other things, the federal securities laws require management to issue a report on the effectivenessof its internal controls over financial reporting. In addition, the Corporation's independent registered public accountants are required to issue an opinion on theeffectiveness of the Corporation's internal control over financial reporting. These reports can be found in Part II, Item 8, "Financial Statements and SupplementaryData." Certifications of the Chief Executive Officer and the Chief Financial Officer as required by the Sarbanes-Oxley Act of 2002 and the resulting SEC rules canbe found in the "Signatures" and "Exhibits" sections.
13

Executive Officers
The executive officers of the Corporation are as follows:
Name Age (1) Office Held and Term of Office E. Philip Wenger
62
Director of the Corporation since 2009 and Director of Fulton Bank, N.A since 2019. Chairman of the Board and ChiefExecutive Officer of the Corporation since January 2013. Mr. Wenger previously served as President of theCorporation from 2008 to 2017, Chief Operating Officer of the Corporation from 2008 to 2012, a Director of FultonBank, N.A. from 2003 to 2009, Chairman of Fulton Bank, N.A. from 2006 to 2009 and has been employed by theCorporation in a number of positions since 1979.
Mark R. McCollom
55
Senior Executive Vice President and Chief Financial Officer of the Corporation since March of 2018. Mr. McCollomjoined the Corporation in November 2017 as Senior Executive Vice President and Chief Financial Officer Designee.Before joining the corporation he was a Senior Managing Director, Chief Administrative Officer and COO of GriffinFinancial Group, LLC. Prior to his role at Griffin Financial Group, Mr. McCollom was the Chief Financial Officer ofSovereign Bancorp, Inc. He has over 30 years of experience in the financial services industry.
Curtis J. Myers
51
Director of the Corporation since 2019 and Director of Fulton Bank, N.A. since 2009. President and Chief OperatingOfficer of the Corporation since January 1, 2018. Chairman and Chief Executive Officer of Fulton Bank, N.A. sinceMay 2018. Mr. Myers served as Senior Executive Vice President of the Corporation from July 2013 to December 2017.President and Chief Operating Officer of Fulton Bank, N.A. since February 2009. He served as Executive VicePresident of the Corporation since August 2011. Mr. Myers has been employed by Fulton Bank, N.A. in a number ofpositions since 1990.
David M. Campbell
58
Senior Executive Vice President, and Director of Strategic Initiatives and Operations since December 2014. Mr.Campbell joined the Corporation as Chief Administrative Officer of Fulton Financial Advisors, a division of FultonBank, N.A. in 2009, and was promoted to President of Fulton Financial Advisors in 2010. He has more than 30 yearsof experience in financial services.
Beth Ann L. Chivinski
59
Senior Executive Vice President and Chief Risk Officer of the Corporation effective June 1, 2016. Previously, sheserved as the Corporation’s Chief Audit Executive April 2013 to June 2016 and was promoted to Senior ExecutiveVice President of the Corporation in 2014. Prior to that, she served as the Corporation’s Executive Vice President,Controller and Chief Accounting Officer from June 2004 to March 31, 2013. Ms. Chivinski has worked in variouspositions with the Corporation since 1994.
Meg R. Mueller
55
Senior Executive Vice President and Head of Commercial Business since January 1, 2018. Ms. Mueller served as ChiefCredit Officer of the Corporation from 2010 - 2017 and was promoted to Senior Executive Vice President of theCorporation in 2013. Ms. Mueller has been employed by the Corporation in a number of positions since 1996.
Angela M. Sargent
52
Senior Executive Vice President and Chief Information Officer of the Corporation since July 2013. Ms. Sargent servedas Executive Vice President and Chief Information Officer from 2002 to 2013 and has been employed by theCorporation in a number of positions since 1992.
Angela M. Snyder
55
Senior Executive Vice President and Head of Consumer Banking since January 1, 2018. She heads the Corporation'sConsumer Banking line of business. Ms. Snyder joined the Corporation in 2002 as President of Woodstown NationalBank she then served as Chairwoman, President and CEO of Fulton Bank of New Jersey until 2019, when theCorporation consolidated that bank into Fulton Bank, N.A. Ms Snyder served as Chairwoman of the New JerseyBankers Association in 2017. She has more than 30 years of experience in the financial services industry.
Daniel R. Stolzer
63
Senior Executive Vice President, Chief Legal Officer and Corporate Secretary since January 1, 2018. Mr. Stolzerjoined the Corporation in 2013 as Executive Vice President, General Counsel and Corporate Secretary. Prior to joiningthe Corporation, Mr. Stolzer served as chief counsel special projects at PNC Financial Services Group in Pittsburgh,PA and deputy general counsel at KeyCorp in Cleveland, OH. He has more than 30 years of experience working infinancial services law beginning with work at several law firms, including Cadwalader, Wickersham & Taft in NewYork City where he was a member of the Corporate Securities and Capital Markets practice groups.
. Bernadette M. Taylor
58
Senior Executive Vice President, and Chief Human Resource Officer since May 2015. In 2001, she was promoted toSenior Vice President of employee services. She served as Executive Vice President of employee services,employment, and director of human resources before her promotion in 2015 to Chief Human Resources Officer. Dr.Taylor joined the Corporation in 1994 as Corporate Training Director at Fulton Financial Corporation.
(1) As of December 31, 2019
14

Item 1A. Risk Factors
An investment in the Corporation's securities involves certain risks, including, among others, the risks described below. In addition to the other information contained inthis report, you should carefully consider the following risk factors.
ECONOMIC AND CREDIT RISKS.
Difficult conditions in the economy and the financial markets may materially adversely affect the Corporation's business and results of operations.
The Corporation's results of operations and financial condition are affected by conditions in the economy and the financial markets generally. The Corporation'sfinancial performance is highly dependent upon the business environment in the markets where the Corporation operates and in the United States as a whole.Unfavorable or uncertain economic and market conditions can be caused by: declines in economic growth, business activity or investor or business confidence;limitations on the availability, or increases in the cost, of credit and capital; changes in the rate of inflation or in interest rates; high unemployment; governmentalfiscal and monetary policies; the level of, or changes in, prices of raw materials, goods or commodities; global economic conditions; trade policies and tariffsaffecting other countries as well as retaliatory policies and tariffs by such countries; geopolitical events; natural disasters; public health crises, such as epidemicsand pandemics; acts of war or terrorism; or a combination of these or other factors.
Specifically, the business environment impacts the ability of borrowers to pay interest on, and repay principal of, outstanding loans and leases and the value ofcollateral, if any, securing those loans and leases, as well as demand for loans, leases and other products and services the Corporation offers. If the quality of theCorporation's loan and lease portfolio declines, the Corporation may have to increase its provision for credit losses, which would negatively impact its results ofoperations, and could result in charge-offs of a higher percentage of its loans. Unlike large, national institutions, the Corporation is not able to spread the risks ofunfavorable local economic conditions across a large number of diversified economies and geographic locations. If the communities in which the Corporationoperates do not grow, or if prevailing economic conditions locally or nationally are unfavorable, its business could be adversely affected. In addition, increasedmarket competition in a lower demand environment could adversely affect the profit potential of the Corporation.
The Corporation is subject to certain risks in connection with the establishment and level of its allowance for credit losses.
The allowance for credit losses consists of the allowance for loan and lease losses, which is recorded as a reduction to loans and leases on the consolidated balancesheet, and the reserve for unfunded lending commitments, which is included in other liabilities on the consolidated balance sheet. While the Corporation believesthat its allowance for credit losses as of December 31, 2019 was sufficient to cover incurred losses in the loan and lease portfolio on that date, the Corporation mayneed to increase its provision for credit losses in future periods due to changes in the risk characteristics of the loan and lease portfolio, thereby negativelyimpacting its results of operations.
The allowance for credit losses represents management's estimate of losses inherent in the loan and lease portfolio as of the balance sheet date. Management'sestimate of losses inherent in the loan and lease portfolio is dependent on the proper application of its methodology for determining its allowance needs. The mostcritical judgments underpinning that methodology include: the ability to identify potential problem loans and leases in a timely manner; proper collateral valuationof loans and leases evaluated for impairment; proper measurement of allowance needs for pools of loans and leases evaluated for impairment; and an overallassessment of the risk profile of the loan and lease portfolio.
The Corporation determines the appropriate level of the allowance for credit losses based on many quantitative and qualitative factors, including, but not limitedto: the size and composition of the loan and lease portfolio; changes in risk ratings; changes in collateral values; delinquency levels; historical losses; andeconomic conditions. In addition, as the Corporation's loan and lease portfolio grows, it will generally be necessary to increase the allowance for credit lossesthrough additional provisions for credit losses, which will impact the Corporation's operating results.
If the Corporation's assumptions and judgments regarding such matters prove to be inaccurate, its allowance for credit losses might not be sufficient, andadditional provisions for credit losses may be necessary. Depending on the amount of such provisions for credit losses, the adverse impact on the Corporation'searnings could be material.
Furthermore, banking regulators may require the Corporation to make additional provisions for credit losses or otherwise recognize further loan and lease charge-offs or impairments following their periodic reviews of the Corporation's loan and lease portfolio, underwriting procedures and allowance for credit losses. Anyincrease in the Corporation's allowance for credit losses or loan and lease charge-offs as required by such regulatory agencies could have a material adverse effecton the Corporation's financial
15

condition and results of operations. See Item 7. "Management's Discussion and Analysis of Financial Condition and Results of Operations-Financial Condition-Provision and Allowance for Credit Losses."
The FASB's Accounting Standards Update 2016-13, effective for the Corporation as of January 1, 2020, substantially changes the accounting for credit losses onloans, leases and other financial assets held by banks, financial institutions and other organizations. The new standard requires the recognition of credit losses onloans, leases and other financial assets based on an entity's current estimate of expected losses over the lifetime of each loan, lease or other financial asset, referredto as the Current Expected Credit Loss ("CECL") model, as opposed to the existing "incurred loss" model, which required recognition of losses on loans, leasesand other financial assets only when those losses were "probable." In December 2018, the bank regulatory agencies approved a final rule modifying the agencies'regulatory capital rules and providing an option to phase in over a period of three years the day-one regulatory capital effects of adoption of the CECL model. TheCorporation expects to recognize a one-time cumulative-effect adjustment to the allowance for credit losses as of the date of adoption of the CECL model. Thedetermination of the one-time cumulative-effect adjustment, and the determination of the allowance for credit losses in future periods, under the CECL modeldepend significantly upon the Corporation's assumptions and judgments with respect to a variety of factors, including the performance of the loan and leaseportfolio, the weighted-average remaining lives of different classifications of loans and leases within the loan and lease portfolio and current and forecastedeconomic conditions, as well as changes in the rate of growth in the loan and lease portfolio and changes in the composition of the loan and lease portfolio,among other factors. As under the existing incurred loss model, if the Corporation's assumptions and judgments regarding such matters prove to be inaccurate, itsallowance for credit losses might not be sufficient, and additional provisions for credit losses might need to be made. Depending on the amount of such provisionsfor credit losses, the adverse impact on the Corporation's earnings could be material. See "Note 1 - Summary of Significant Accounting Policies - Recently IssuedAccounting Standards" in the Notes to Consolidated Financial Statements in Item 8. "Financial Statements and Supplementary Data."
The composition of the Corporation's loan and lease portfolio and competition for loans and leases subject the Corporation to credit risk.
Approximately 72% of the Corporation's loan and lease portfolio was in commercial loans, commercial mortgage loans, and construction loans at December 31,2019. Commercial loans, commercial mortgage loans and construction loans generally involve a greater degree of credit risk than residential mortgage loans andconsumer loans because they typically have larger balances and are likely to be more sensitive to broader economic factors and conditions. Because payments onthese loans often depend on the successful operation and management of businesses and properties, repayment of such loans may be affected by factors outsidethe borrower's control, such as adverse conditions in the real estate markets, adverse economic conditions or changes in governmental regulation.
Furthermore, intense competition among both bank and non-bank lenders, coupled with moderate levels of recent economic growth, could increase pressure onthe Corporation to relax its credit standards and/or underwriting criteria in order to achieve the Corporation's loan growth targets. A relaxation of credit standardsor underwriting criteria could result in greater challenges in the repayment or collection of loans should economic conditions, or individual borrower performance,deteriorate to a degree that could impact loan performance. Additionally, competitive pressures could drive the Corporation to consider loans and customerrelationships that are outside of the Corporation's established risk appetite or target customer base. See Item 7. "Management's Discussion and Analysis ofFinancial Condition and Results of Operations-Financial Condition-Loans and Leases."
MARKET RISKS.
The Corporation is subject to interest rate risk.
The Corporation cannot predict or control changes in interest rates. The Corporation is affected by fiscal and monetary policies of the federal government,including those of the Federal Reserve Board, which regulates the national money supply and engages in other lending and investment activities in order tomanage recessionary and inflationary pressures, many of which affect interest rates charged on loans and leases and paid on deposits.
Net interest income is the difference between interest earned on interest-earning assets and interest paid on interest-bearing liabilities. Net interest income is themost significant component of the Corporation's net income, accounting for approximately 75% of total revenues in 2019. Changes in market interest rates, in theshape of the yield curve or in spreads between different market interest rates can have a material effect on the Corporation's net interest margin, or the differencebetween interest earned on loans, leases and investments and interest paid on deposits and borrowings. The rates on some interest-earning assets, such as loans,leases and investments, and interest-bearing liabilities, such as deposits and borrowings, adjust concurrently with, or within a brief period after, changes in marketinterest rates, while others adjust only periodically or not at all during their terms. Thus, changes in market interest rates might, for example, result in a decrease inthe interest earned on interest-earning assets that is not
16

accompanied by a corresponding decrease in the interest paid on interest-bearing liabilities, or the decrease in interest paid might be at a slower pace, or in asmaller amount, than the decrease in interest earned, reducing the Corporation's net interest income and/or net interest margin. See Item 7. "Management'sDiscussion and Analysis of Financial Condition and Results of Operations-Net Interest Income."
Changes in interest rates may also affect the average life of loans and certain investment securities, most notably mortgage-backed securities. Decreases in interestrates can result in increased prepayments of loans and certain investment securities, as borrowers or issuers refinance to reduce their borrowing costs. Under thosecircumstances, the Corporation would be subject to reinvestment risk to the extent that it is not able to reinvest the cash received from such prepayments at ratesthat are comparable to the rates on the loans and investment securities which are prepaid. Conversely, increases in interest rates may extend the average life offixed rate assets, which could restrict the Corporation's ability to reinvest in higher yielding alternatives, and may result in customers withdrawing certificates ofdeposit early so long as the early withdrawal penalty is less than the interest they could receive as a result of the higher interest rates.
Changes in interest rates also affect the fair value of interest-earning investment securities. Generally, the value of interest-earning investment securities movesinversely with changes in interest rates. In the event that the fair value of an investment security declines below its amortized cost, the Corporation is required todetermine whether the decline constitutes an other-than-temporary impairment. The determination of whether a decline in fair value is other-than-temporarydepends on a number of factors, including whether the Corporation has the intent and ability to retain the investment security for a period of time sufficient toallow for any anticipated recovery in fair value. If a determination is made that a decline is other-than-temporary, an other-than-temporary impairment charge isrecorded.
The planned phasing out of LIBOR as a financial benchmark presents risks to the financial instruments originated or held by the Corporation.
The London Interbank Offered Rate ("LIBOR") is the reference rate used for many of the Corporation's transactions, including variable and adjustable rate loans,derivative contracts, borrowings and other financial instruments. However, a reduced volume of interbank unsecured term borrowing, coupled with legal andregulatory proceedings related to rate manipulation by certain financial institutions, has led to international reconsideration of LIBOR as a financial benchmark.The United Kingdom Financial Conduct Authority ("FCA"), which regulates the process for establishing LIBOR, announced in July 2017 that the FCA intends tostop persuading, or compelling, banks to submit rates for the calculation of LIBOR after 2021.
Regulators, industry groups and certain committees (e.g., the Alternative Reference Rates Committee) have, among other things, published recommended fallbacklanguage for LIBOR-linked financial instruments, identified recommended alternatives for certain LIBOR rates (e.g., the Secured Overnight Financing Rate as therecommended alternative to U.S. Dollar LIBOR), and proposed implementations of the recommended alternatives in floating rate instruments. At this time, it is notpossible to predict whether these recommendations and proposals will be broadly accepted, whether they will continue to evolve, and what the effect of theirimplementation may be on the markets for floating-rate financial instruments. The uncertainty surrounding potential reforms, including the use of alternativereference rates and changes to the methods and processes used to calculate rates, may have an adverse effect on the trading market for LIBOR-based securities,loan yields, and the amounts received and paid on derivative contracts and other financial instruments. In addition, the implementation of LIBOR reform proposalsmay result in increased compliance and operational costs.
Changes in interest rates can affect demand for the Corporation's products and services.
Movements in interest rates can cause demand for some of the Corporation's products and services to be cyclical. For example, demand for residential mortgageloans has historically tended to increase during periods when interest rates were declining and to decrease during periods when interest rates were rising. As aresult, the Corporation may need to periodically increase or decrease the size of certain of its businesses, including its personnel, to more appropriately matchincreases and decreases in demand and volume. The need to change the scale of these businesses is challenging, and there is often a lag between changes in thebusinesses and the Corporation's reaction to these changes.
Price fluctuations in securities markets, as well as other market events, such as a disruption in credit and other markets and the abnormal functioning of markets forsecurities, could have an impact on the Corporation's results of operations.
The market value of the Corporation's securities investments, which include mortgage-backed securities, state and municipal securities, auction rate securities, andcorporate debt securities, as well as the revenues the Corporation earns from its trust and investment management services business, are particularly sensitive toprice fluctuations and market events. Declines in the values
17

of the Corporation's securities holdings, combined with adverse changes in the expected cash flows from these investments, could result in other-than-temporaryimpairment charges.
The Corporation's investment management and trust services revenue, which is partially based on the value of the underlying investment portfolios, can also beimpacted by fluctuations in the securities markets. If the values of those investment portfolios decrease, whether due to factors influencing U.S. or internationalsecurities markets, in general, or otherwise, the Corporation's revenue could be negatively impacted. In addition, the Corporation's ability to sell its brokerageservices is dependent, in part, upon consumers' level of confidence in securities markets. See Item 7A. "Quantitative and Qualitative Disclosures About MarketRisk."
LIQUIDITY RISK.
Changes in interest rates or disruption in liquidity markets may adversely affect the Corporation's sources of funding.
The Corporation must maintain sufficient sources of liquidity to meet the demands of its depositors and borrowers, support its operations and meet regulatoryexpectations. The Corporation's liquidity management policies and practices emphasize core deposits and repayments and maturities of loans, leases andinvestments as its primary sources of liquidity. These primary sources of liquidity can be supplemented by Federal Home Loan Bank ("FHLB") advances,borrowings from the Federal Reserve Bank, proceeds from the sales of loans and use of liquidity resources of the Corporation, including capital markets funding.Lower-cost, core deposits may be adversely affected by changes in interest rates, and secondary sources of liquidity can be more costly to the Corporation thanfunding provided by deposit account balances having similar maturities. In addition, adverse changes in the Corporation's results of operations or financialcondition, downgrades in the Corporation's credit ratings, regulatory actions involving the Corporation, or changes in regulatory, industry or market conditionscould lead to increases in the cost of these secondary sources of liquidity, the inability to refinance or replace these secondary funding sources as they mature, orthe withdrawal of unused borrowing capacity under these secondary funding sources.
The Corporation relies on customer deposits as its primary source of funding. A substantial majority of the Corporation's deposits are in non-maturing accounts,which deposit customers can withdraw on demand or upon several days' notice. Factors, many of which are outside the Corporation's control, can causefluctuations in both the level and cost of customer deposits. These factors include competition for customer deposits from other financial institutions and non-bank competitors, changes in interest rates, the rates of return available from alternative investments or asset classes, changes in customer confidence in theCorporation or in financial institutions generally, and the liquidity needs of the Corporation's deposit customers. Further, deposits from state and municipalentities, primarily in non-maturing, interest-bearing accounts, are a significant source of deposit funding for the Corporation, representing approximately 12% oftotal deposits at December 31, 2019. State and municipal customers frequently maintain large deposit account balances substantially in excess of the per-depositorlimit of FDIC insurance, and may be more sensitive than other depositors to changes in interest rates and the other factors discussed above. Advances intechnology, such as online banking, mobile banking, digital payment platforms and the acceleration of financial technology innovation, have also made it easier tomove money, potentially causing customers to switch financial institutions or switch to non-bank competitors. Movement of customer deposits into higher-yielding deposit accounts offered by the Corporation, the need to offer higher interest rates on deposit accounts to retain customer deposits, or the movement ofcustomer deposits into alternative investments or deposits of other banks or non-bank providers could increase the Corporation's funding costs, reduce its netinterest margin and/or create liquidity challenges.
Market conditions have been negatively impacted by disruptions in the liquidity markets in the past, and such disruptions or an adverse change in theCorporation's results of operations or financial condition could, in the future, have a negative impact on secondary sources of liquidity. If the Corporation is notable to continue to rely primarily on customer deposits to meet its liquidity and funding needs, continue to access secondary, non-deposit funding sources onfavorable terms or otherwise fails to manage its liquidity effectively, the Corporation's ability to continue to grow may be constrained, and the Corporation'sliquidity, operating margins, results of operations and financial condition may be materially adversely affected. See Item 7A. "Quantitative and QualitativeDisclosures About Market Risk-Interest Rate Risk, Asset/Liability Management and Liquidity."
LEGAL, COMPLIANCE AND REPUTATIONAL RISKS.
The Corporation and Fulton Bank are subject to extensive regulation and supervision and may be adversely affected by changes in laws and regulations or anyfailure to comply with laws and regulations.
Virtually every aspect of the Corporation's and Fulton Bank's operations is subject to extensive regulation and supervision by federal and state regulatory agencies,including the Federal Reserve Board, OCC, FDIC, CFPB, DOJ, UST, SEC, HUD, state attorneys general and state banking, financial services, securities andinsurance regulators. Under this regulatory framework,
18

regulatory agencies have broad authority in carrying out their supervisory, examination and enforcement responsibilities to address compliance with applicablelaws and regulations, including laws and regulations relating to capital adequacy, asset quality, liquidity, risk management and financial accounting and reporting,as well as laws and regulations governing consumer protection, fair lending, privacy, information security and cybersecurity risk management, third-party vendorrisk management, and AML and anti-terrorism laws, among other aspects of the Corporation's business. Failure to comply with these regulatory requirements,including inadvertent or unintentional violations, may result in the assessment of fines and penalties, or the commencement of informal or formal regulatoryenforcement actions against the Corporation or Fulton Bank. Other negative consequences can also result from such failures, including regulatory restrictions onthe Corporation's activities, including restrictions on the Corporation's ability to grow through acquisition, reputational damage, restrictions on the ability ofinstitutional investment managers to invest in the Corporation's securities and increases in the Corporation's costs of doing business.
The U.S. Congress and state legislatures and federal and state regulatory agencies continually review banking and other laws, regulations and policies for possiblechanges. Changes in applicable federal or state laws, regulations or governmental policies may affect the Corporation and its business. The effects of such changesare difficult to predict and may produce unintended consequences. New laws, regulations or changes in the regulatory environment could limit the types offinancial services and products the Corporation may offer, alter demand for existing products and services, increase the ability of non-banks to offer competingfinancial services and products, increase compliance burdens, or otherwise adversely affect the Corporation's business, results of operations or financial condition.
Compliance with banking and financial services statutes and regulations is also important to the Corporation's ability to engage in new activities or to expand uponexisting activities. Regulators continue to scrutinize banks through longer and more intensive examinations. Federal and state banking agencies possess broadpowers to take supervisory actions, as they deem appropriate. These supervisory actions may result in higher capital requirements, higher deposit insurancepremiums and limitations on the Corporation's operations and expansion activities that could have a material adverse effect on its business and profitability. TheCorporation has dedicated significant time, effort, and expense over time to comply with regulatory and supervisory standards and requirements imposed by theCorporation's regulators, and the Corporation expects that it will continue to do so. If the Corporation fails to develop at a reasonable cost the systems andprocesses necessary to comply with the standards and requirements imposed by these rules, it could have a material adverse effect on the Corporation's business,financial condition, or results of operations.
Failure to comply with the BSA, the Patriot Act and related AML requirements, or with sanctions laws, could subject the Corporation to enforcement actions, fines,penalties, sanctions and other remedial actions.
Regulators have broad authority to enforce AML and sanctions laws. Failure to comply with AML and sanctions laws or to maintain an adequate complianceprogram can lead to significant monetary penalties and reputational damage, and federal regulators evaluate the effectiveness of an applicant in combating moneylaundering when considering approval of applications to acquire, merge, or consolidate with another banking institution, or to engage in other expansionaryactivities. There have been a number of significant enforcement actions by regulators, as well as state attorneys general and the DOJ, against banks, broker-dealersand non-bank financial institutions with respect to AML and sanctions laws and some have resulted in substantial penalties, including criminal pleas. Enforcementactions have included the Federal Reserve Board's Consent Order against the Corporation in 2014 (the "Consent Order"), which was terminated in May 2019, inconnection with alleged deficiencies in the Corporation's BSA/AML compliance program. Any violation of law or regulation, possibly even inadvertent orunintentional violations, could result in the fines, sanctions or other penalties described above, including one or more additional consent orders against FultonBank or the Corporation, which could have significant reputational or other consequences and could have a material adverse effect on our business, financialcondition and results of operations.
Additional expenses and investments have been incurred in recent years as the Corporation expanded its hiring of personnel and use of outside professionals, suchas consulting and legal services, and made capital investments in operating systems to strengthen and support the Corporation's BSA/AML compliance program,as well as the Corporation's broader compliance and risk management infrastructures. The expense and capital investment associated with all of these efforts,including those undertaken in connection with the Consent Order, have had an adverse effect on the Corporation's results of operations in recent periods and couldhave a material adverse effect on the Corporation's results of operations in one or more future periods.
The Dodd-Frank Act continues to have a significant impact on the Corporation's business and results of operations.
The Dodd-Frank Act has had a substantial impact on many aspects of the financial services industry. The Corporation has been impacted, and will likely continueto be impacted in the future, by the so-called Durbin Amendment to the Dodd-Frank Act, which reduced debit card interchange revenue of banks, and revisedFDIC deposit insurance assessments. The Corporation has also been
19

impacted by the Dodd-Frank Act in the areas of corporate governance, capital requirements, risk management and regulation under federal consumer protectionlaws.
The CFPB, which was established pursuant to the Dodd-Frank Act, has imposed enforcement actions against a variety of bank and non-bank market participantswith respect to a number of consumer financial products and services. These actions have resulted in those participants expending significant time, money andresources to adjust to the initiatives being pursued by the CFPB. These enforcement actions may serve as precedent for how the CFPB interprets and enforcesconsumer protection laws, including practices or acts that are deemed to be unfair, deceptive or abusive, with respect to all supervised institutions, which mayresult in the imposition of higher standards of compliance with such laws. Other federal financial regulatory agencies, including the OCC, as well as state attorneysgeneral and state banking agencies and other state financial regulators, also have been increasingly active in this area with respect to institutions over which theyhave jurisdiction. See Item 1. "Business-Supervision and Regulation."
Changes in U.S. federal, state or local tax laws may negatively impact the Corporation's financial performance.
The Corporation is subject to changes in tax law that could increase the Corporation's effective tax rates. These law changes may be retroactive to previous periodsand as a result could negatively affect the Corporation's current and future financial performance. In December 2017, the Tax Act was signed into law, whichresulted in significant changes to the U.S. Internal Revenue Code of 1986, as amended (the "Code"). The Tax Act reduced the Corporation's Federal corporateincome tax rate to 21% beginning in 2018. However, the Tax Act also imposed limitations on the Corporation's ability to take certain deductions, such as thededuction for FDIC deposit insurance premiums, which partially offset the increase in net income from the lower tax rate.
In addition, a number of the changes to the Code are set to expire in future years. There is substantial uncertainty concerning whether those expiring provisionswill be extended, or whether future legislation will further revise the Code.
Negative publicity could damage the Corporation's reputation and business.
Reputation risk, or the risk to the Corporation's earnings and capital from negative public opinion, is inherent in the Corporation's business. Negative publicopinion could result from the Corporation's actual, alleged or perceived conduct in any number of activities, including lending practices, litigation, corporategovernance, regulatory, compliance, mergers and acquisitions, and disclosure, sharing or inadequate protection of customer information, and from actions takenby government agencies and community organizations in response to that conduct. In addition, unfavorable public opinion regarding the broader financial servicesindustry, or arising from the actions of individual financial institutions, can have an adverse effect on the Corporation's reputation. Because the Corporationconducts its businesses under the "Fulton" brand, negative public opinion about one line of business could affect the Corporation's other lines of businesses.Further, the increased use of social media platforms facilitates the rapid and widespread dissemination of information, including inaccurate, misleading, or falseinformation, which could magnify the potential harm to the Corporation's reputation. Any of these or other events that impair the Corporation's reputation canaffect the Corporation's ability to attract and retain customers and employees, and access sources of funding and capital, any of which could have materiallyadverse effect on the Corporation's results of operations and financial condition.
From time to time the Corporation may be the subject of litigation and governmental or administrative proceedings. Adverse outcomes of any such litigation orproceedings may have a material adverse impact on the Corporation's business and results of operations as well as its reputation.
Many aspects of the Corporation's business involve substantial risk of legal liability. From time to time, the Corporation has been named or threatened to benamed as defendant in various lawsuits arising from its business activities (and in some cases from the activities of companies that were acquired). In addition, theCorporation is periodically the subject of governmental investigations and other forms of regulatory or governmental inquiry. For example, the Corporation isresponding to an investigation by the staff of the Division of Enforcement of the U.S. Securities and Exchange Commission regarding certain accountingdeterminations that could have impacted the Corporation's reported earnings per share. Like other large financial institutions, the Corporation is also subject to riskfrom potential employee misconduct, including non-compliance with policies and improper use or disclosure of confidential information. These lawsuits,investigations, inquiries and other matters could lead to administrative, civil or criminal proceedings, or result in adverse judgments, settlements, fines, penalties,restitution, injunctions or other types of sanctions, or the need for the Corporation to undertake remedial actions, or to alter its business, financial or accountingpractices. Substantial legal liability or significant regulatory actions against the Corporation could materially adversely affect the Corporation's business, financialcondition or results of operations and/or cause significant reputational harm. The Corporation establishes reserves for legal claims when payments associated withthe claims become probable and the costs can be reasonably estimated. For matters where a loss is not probable, or the amount of the loss cannot be reasonablyestimated by the Corporation, no loss reserve is established. However, the Corporation may still incur potentially significant legal costs for a matter, even if areserve has not been established.
20
The Corporation can provide no assurance as to the outcome or resolution of legal or administrative actions or investigations, and such actions and investigationsmay result in judgments against the Corporation for significant damages or the imposition of regulatory restrictions on the Corporation's operations. Resolution ofthese types of matters can be prolonged and costly, and the ultimate results or judgments are uncertain due to the inherent uncertainty in the outcomes oflitigation and other proceedings.
STRATEGIC AND EXTERNAL RISKS.
The Corporation may not be able to achieve its growth plans.
The Corporation's business plan includes the pursuit of profitable growth. Under current economic, competitive and regulatory conditions, profitable growth maybe difficult to achieve due to one or more of the following factors:
• In the current interest rate environment, it may become more difficult for the Corporation to further increase its net interest margin or its net interestmargin may come under downward pressure. As a result, income growth will likely need to come from growth in the volume of earning assets, particularlyloans, and an increase in non-interest income. However, customer demand and competition could make such income growth difficult to achieve; and
• The Corporation may seek to supplement organic growth through acquisitions, but may not be able to identify suitable acquisition opportunities, obtainthe required regulatory approvals or successfully integrate acquired businesses.
To achieve profitable growth, the Corporation may pursue new lines of business or offer new products or services, all of which can involve significant costs,uncertainties and risks. Any new activity the Corporation pursues may require a significant investment of time and resources, and may not generate the anticipatedreturn on that investment. Sustainable growth requires that the Corporation manage risks by balancing loan and deposit growth at acceptable levels of risk,maintaining adequate liquidity and capital, hiring and retaining qualified employees, successfully managing the costs and implementation risks with respect tostrategic projects and initiatives, and integrating acquisition targets while managing costs. In addition, the Corporation may not be able to effectively implementand manage any new activities. External factors, such as the need to comply with additional regulations, the availability, or introduction, of competitivealternatives in the market, and changes in customer preferences may also impact the successful implementation of any new activity. Any new activity could have asignificant impact on the effectiveness of the Corporation's system of internal controls. If the Corporation is not able to adequately identify and manage the risksassociated with new activities, the Corporation's business, results of operations and financial condition could be materially and adversely impacted.
The Corporation faces a variety of risks in connection with completed and potential acquisitions.
The Corporation may seek to supplement organic growth through acquisitions of banks or branches, or other financial businesses or assets. Acquiring other banks,branches, financial businesses or assets involves a variety of risks commonly associated with acquisitions, including, among other things:
• The possible loss of key employees and customers of the acquired business;• Potential disruption of the acquired business and the Corporation's business;• Exposure to potential asset quality issues of the acquired business;• Potential exposure to unknown or contingent liabilities of the acquired business including, without limitation, liabilities for regulatory and compliance
issues;• Potential changes in banking or tax laws or regulations that may affect the acquired business; and• Potential difficulties in integrating the acquired business, resulting in the diversion of resources from the operation of the Corporation's existing
businesses. Acquisitions typically involve the payment of a premium over book and market values, and therefore, some dilution of the Corporation's tangible book value andnet income per common share may occur in connection with any future transaction. Failure to realize the expected revenue increases, cost savings, increases ingeographic or product presence, and/or other projected benefits from an acquisition could have a material adverse effect on the Corporation's business, financialcondition and results of operations. In addition, the Corporation faces significant competition from other financial services institutions, some of which may havegreater financial resources than the Corporation, when considering acquisition opportunities. Accordingly, attractive opportunities may not be available and therecan be no assurance that the Corporation will be successful in identifying, completing or integrating future acquisitions.
21

The competition the Corporation faces is significant and may reduce the Corporation's customer base and negatively impact the Corporation's results of operations.
There is significant competition among commercial banks in the market areas served by the Corporation. In addition, the Corporation also competes with otherproviders of financial services, such as savings and loan associations, credit unions, consumer finance companies, securities firms, insurance companies,commercial finance and leasing companies, the mutual funds industry, full service brokerage firms and discount brokerage firms, some of which are subject to lessextensive regulation than the Corporation and have different cost structures. Some of the Corporation's competitors have greater resources, higher lending limits,lower cost of funds and may offer other services not offered by the Corporation. The Corporation also experiences competition from a variety of institutionsoutside its market areas. Some of these institutions conduct business primarily over the Internet and, as a result, may be able to realize certain cost savings andoffer products and services at more favorable rates and with greater convenience to the customer. The financial services industry could become even morecompetitive as a result of legislative, regulatory and technological changes and continued consolidation. In addition, technology has lowered barriers to entry andmade it possible for non-banks to offer products and services traditionally provided by banks, such as funds transfers, payment services, residential mortgageloans, consumer loans and wealth and investment management services. Competition with non-banks, including technology companies, to provide financialproducts and services is intensifying. In particular, the activity of financial technology companies ("Fintechs") has grown significantly over recent years and isexpected to continue to grow. Fintechs have and may continue to offer bank or bank-like products.
Competition may adversely affect the rates the Corporation pays on deposits and charges on loans, and could result in the loss of fee income, as well as the loss ofcustomer deposits and the income generated from those deposits, thereby potentially adversely affecting the Corporation's profitability and its ability to continueto grow. The Corporation's profitability and continued growth depends upon its continued ability to successfully compete in the market areas it serves. See Item 1."Business-Competition."
If the goodwill that the Corporation has recorded or records in the future in connection with its acquisitions becomes impaired, it could have a negative impact onthe Corporation's results of operations.
In the past, the Corporation supplemented its internal growth with strategic acquisitions of banks, branches and other financial services companies. In the future,the Corporation may seek to supplement organic growth through additional acquisitions. If the purchase price of an acquired company exceeds the fair value ofthe company's net assets, the excess is carried on the acquirer's balance sheet as goodwill. As of December 31, 2019, the Corporation had $532.7 million ofgoodwill recorded on its balance sheet. The Corporation is required to evaluate goodwill for impairment at least annually. Write-downs of the amount of anyimpairment, if necessary, are to be charged to earnings in the period in which the impairment occurs. There can be no assurance that future evaluations of goodwillwill not result in impairment charges.
Changes in accounting policies, standards, and interpretations could materially affect how the Corporation reports its financial condition and results of operations.
The preparation of the Corporation's financial statements in accordance with U.S. generally accepted accounting principles requires management to make estimatesand assumptions that affect the reported amounts of assets and liabilities as of the date of the financial statements, as well as revenues and expenses during theperiod. A summary of the accounting policies that the Corporation considers to be most important to the presentation of its financial condition and results ofoperations, because they require management's most difficult judgments as a result of the need to make estimates about the effects of matters that are inherentlyuncertain, including those related to the allowance for credit losses, goodwill, income taxes, and fair value measurements, is set forth in Item 7. "Management'sDiscussion and Analysis of Financial Condition and Results of Operations-Critical Accounting Policies" and within "Note 1-Summary of Significant AccountingPolicies," in the Notes to Consolidated Financial Statements in Item 8. "Financial Statements and Supplementary Data."
A variety of factors could affect the ultimate values of assets, liabilities, income and expenses recognized and reported in the Corporation's financial statements,and these ultimate values may differ materially from those determined based on management's estimates and assumptions. In addition, the FASB, regulatoryagencies, and other bodies that establish accounting standards from time to time change the financial accounting and reporting standards governing thepreparation of the Corporation's financial statements. For example, see "The Corporation is subject to certain risks in connection with the establishment and levelof its allowance for credit losses" above for a discussion of CECL and its impact on the Corporation's allowance for credit losses. Further, those bodies thatestablish and interpret the accounting standards (such as the FASB, the Securities and Exchange Commission, and banking regulators) may change priorinterpretations or positions regarding how these standards should be applied. These changes can be difficult to predict and can materially affect how theCorporation records and reports its financial condition and results of operations.
22

OPERATIONAL RISKS.
The Corporation is exposed to many types of operational and other risks, and the Corporation's framework for managing risks may not be effective in mitigatingrisk.
The Corporation is exposed to many types of operational risk, including the risk of human error or fraud by employees and other third parties, intentional andinadvertent misrepresentation by loan applicants, borrowers or guarantors, unsatisfactory performance by employees and vendors, clerical and record-keepingerrors, computer and telecommunications systems malfunctions or failures and reliance on data that may be faulty or incomplete. In an environment characterizedby continual, rapid technological change, as discussed below, when the Corporation introduces new products and services, or makes changes to its informationtechnology systems and processes, these operational risks are increased. Any of these operational risks could result in the Corporation's diminished ability tooperate one or more of its businesses, financial loss, potential liability to customers, inability to secure insurance, reputational damage and regulatory intervention,which could materially adversely affect the Corporation.
The Corporation's risk management framework is subject to inherent limitations, and risks may exist, or develop in the future, that the Corporation has notanticipated or identified. If the Corporation's risk management framework proves to be ineffective, the Corporation could suffer unexpected losses and could bematerially adversely affected.
The Corporation's operational risks include risks associated with third-party vendors and other financial institutions.
The Corporation relies upon certain third-party vendors to provide products and services necessary to maintain its day-to-day operations, including, notably,responsibility for the core processing system that services Fulton Bank. Accordingly, the Corporation's operations are exposed to the risk that these vendors mightnot perform in accordance with applicable contractual arrangements or service level agreements. The failure of an external vendor to perform in accordance withapplicable contractual arrangements or service level agreements could be disruptive to the Corporation's operations, which could have a material adverse effect onthe Corporation's financial condition or results of operations, and damage its reputation. Further, third-party vendor risk management has become a point ofregulatory emphasis recently. A failure of the Corporation to follow applicable regulatory guidance in this area could expose the Corporation to regulatorysanctions.
The commercial soundness of many financial institutions may be closely interrelated as a result of credit, trading, execution of transactions or other relationshipsbetween the institutions. As a result, concerns about, or a default or threatened default by, one institution could lead to significant market-wide liquidity and creditproblems, losses or defaults by other institutions. This risk is sometimes referred to as "systemic risk" and may adversely affect financial intermediaries, such asclearing agencies, clearing houses, banks, securities firms and exchanges, with which the Corporation interacts on a daily basis, and therefore could adverselyaffect the Corporation.
Any of these operational or other risks could result in the Corporation's diminished ability to operate one or more of its businesses, financial loss, potential liabilityto customers, inability to secure insurance, reputational damage and regulatory intervention, which could materially adversely affect the Corporation.
The Corporation's internal controls may be ineffective.
One critical component of the Corporation's risk management framework is its system of internal controls. Management regularly reviews and updates theCorporation's internal controls, disclosure controls and procedures, and corporate governance policies and procedures. Any system of controls, however welldesigned and operated, is based in part on certain assumptions and can provide reasonable, but not absolute, assurances that the objectives of the controls are met.Any failure or circumvention of the Corporation's controls and procedures or failure to comply with regulations related to controls and procedures could have amaterial adverse effect on the Corporation's business, results of operations, financial condition and reputation. See Item 9A. "Controls and Procedures."
Loss of, or failure to adequately safeguard, confidential or proprietary information may adversely affect the Corporation's operations, net income or reputation.
The Corporation's business is highly dependent on information systems and technology and the ability to collect, process, transmit and store significant amountsof confidential information regarding customers, employees and others on a daily basis. While the Corporation performs some of the functions required to operateits business directly, it also outsources significant business functions, such as processing customer transactions, maintenance of customer-facing websites,including its online and mobile banking functions, and developing software for new products and services, among others. These relationships require theCorporation to allow third parties to access, store, process and transmit customer information. As a result, the Corporation may be subject to cyber
23

security risks directly, as well as indirectly through the vendors to whom it outsources business functions and the downstream service providers of those vendors.The increased use of smartphones, tablets and other mobile devices, as well as cloud computing, may also heighten these and other operational risks. Cyber threatscould result in unauthorized access, loss or destruction of confidential information or customer data, unavailability, degradation or denial of service, introductionof computer viruses or ransomware and other adverse events, causing the Corporation to incur additional costs (such as repairing systems or adding new personnelor protection technologies). Cyber threats may also subject the Corporation to regulatory investigations, litigation or enforcement actions require the payment ofregulatory fines or penalties or undertaking costly remediation efforts with respect to third parties affected by a cyber security incident, all or any of which couldadversely affect the Corporation's business, financial condition or results of operations and damage its reputation.
Like other financial institutions, the Corporation continuously experiences malicious cyber activity directed at its websites, computer systems, software, networksand its users. This malicious activity includes attempts at unauthorized access, implantation of computer viruses or malware, and denial-of-service attacks. TheCorporation also experiences large volumes of phishing and other forms of social engineering attempted for the purpose of perpetrating fraud against theCorporation, its employees or its customers. While, to date, malicious cyber activity, cyber attacks and other information security breaches have not had a materialadverse impact on the Corporation, there can be no assurance that such events will not have a material adverse impact on the Corporation’s business, results ofoperations, financial condition or reputation in the future.
The Corporation uses monitoring and preventive controls to detect and respond to data breaches and cyber threats involving its own systems before they becomesignificant. The Corporation regularly evaluates its systems and controls and implements upgrades as necessary. The Corporation also attempts to reduce itsexposure to its vendors' data privacy and cyber incidents by performing initial vendor due diligence that is updated periodically for critical vendors, negotiatingservice level standards with vendors, negotiating for indemnification from vendors for confidentiality and data breaches, and limiting third-party access to the leastprivileged level necessary to perform outsourced functions, among other things. The additional cost to the Corporation of data and cyber security monitoring andprotection systems and controls includes the cost of hardware and software, third party technology providers, consulting and forensic testing firms, insurancepremium costs and legal fees, in addition to the incremental cost of personnel who focus a substantial portion of their responsibilities on data and cyber security.
There can be no assurance that the measures employed by the Corporation to detect and combat direct or indirect cyber threats will be effective. In addition,because the methods of cyber attacks change frequently or, in some cases, are not recognized until launched, the Corporation may be unable to implementeffective preventive control measures or proactively address these methods and the probability of a successful attack cannot be predicted. The Corporation's or avendor's failure to promptly identify and counter a cyber attack may result in increased costs and other negative consequences, such as the loss of, or inability toaccess, data, degradation or denial of service and introduction of computer viruses. Although the Corporation maintains insurance coverage that may, subject topolicy terms and conditions, cover certain aspects of cyber risks, such insurance coverage may be inapplicable or otherwise insufficient to cover any or all losses.Further, a successful cyber security attack that results in a significant loss of customer data or compromises the Corporation's ability to function would have amaterial adverse effect on the Corporation's business, reputation, financial condition and results of operation.
Account data compromise events at large retailers, health insurers, a national consumer credit reporting agency and others in recent years have resulted inheightened legislative and regulatory focus on privacy, data protection and information security. New or revised laws and regulations may significantly impact theCorporation's current and planned privacy, data protection and information security-related practices, the collection, use, sharing, retention and safeguarding ofconsumer and employee information, and current or planned business activities. Compliance with current or future privacy, data protection and informationsecurity laws to which the Corporation is subject could result in higher compliance and technology costs and could restrict the Corporation's ability to providecertain products and services, which could materially and adversely affect the Corporation's profitability. The Corporation's failure to comply with privacy, dataprotection and information security laws could result in potentially significant regulatory and governmental investigations and/or actions, litigation, fines,sanctions and damage to the Corporation's reputation and its brand.
The Corporation is subject to a variety of risks in connection with origination and sale of loans.
The Corporation originates residential mortgage loans and other loans, such as loans guaranteed, in part, by the U.S. Small Business Administration, all or portionsof which are later sold in the secondary market to government sponsored enterprises or agencies, such as the Federal National Mortgage Association (Fannie Mae),and other non-government sponsored investors. In connection with such sales, the Corporation makes certain representations and warranties with respect tomatters such as the underwriting, origination, documentation or other characteristics of the loans sold. The Corporation may be required to repurchase a loan, or toreimburse the purchaser of a loan for any related losses, if it is determined that the loan sold was in violation of representations or warranties made at the time ofthe sale, and, in some cases, if there is evidence of borrower fraud, in the event of early payment
24

default by the borrower on the loan, or for other reasons. The Corporation maintains reserves for potential losses on certain loans sold, however, it is possible thatlosses incurred in connection with loan repurchases and reimbursement payments may be in excess of any applicable reserves, and the Corporation may be requiredto increase reserves and may sustain additional losses associated with such loan repurchases and reimbursement payments in the future, which could have amaterial adverse effect on the Corporation's financial condition or results of operations.
In addition, the sale of residential mortgage loans and other loans in the secondary market serves as a source of non-interest income and liquidity for theCorporation, and can reduce its exposure to risks arising from changes in interest rates. Efforts to reform government sponsored enterprises and agencies, changesin the types of, or standards for, loans purchased by government sponsored enterprises or agencies and other investors, or the Corporation's failure to maintain itsstatus as an eligible seller of such loans may limit the Corporation's ability to sell these loans. The inability of the Corporation to continue to sell these loans couldreduce the Corporation's non-interest income, limit the Corporation's ability to originate and fund these loans in the future, and make managing interest rate riskmore challenging, any of which could have a material adverse effect on the Corporation's results of operations and financial condition.
The Corporation continually encounters technological change.
The financial services industry is continually undergoing rapid technological change with frequent introductions of new technology-driven products and services.The effective use of technology increases efficiency and enables financial institutions to better serve customers and to reduce costs. The Corporation's futuresuccess depends, in part, upon its ability to address the needs of its customers by using technology to provide products and services that will satisfy customerdemands, as well as to create additional efficiencies in the Corporation's operations. The costs of new technology, including personnel, can be high, in bothabsolute and relative terms. Many of the Corporation's financial institution competitors have substantially greater resources to invest in technologicalimprovements. In addition, new payment, credit and investment and wealth management services developed and offered by non-bank or non-traditionalcompetitors pose an increasing threat to the products and services traditionally provided by financial institutions like the Corporation. The Corporation may not beable to effectively implement new technology-driven products and services, be successful in marketing these products and services to its customers, or effectivelydeploy new technologies to improve the efficiency of its operations. Failure to successfully keep pace with technological change affecting the financial servicesindustry could have a material adverse impact on the Corporation's business, financial condition and results of operations.
There can be no assurance, given the past pace of change and innovation, that the Corporation's technology, either purchased or developed internally, will meet orcontinue to meet the needs of the Corporation and the needs of its customers.
In addition, advances in technology, as well as changing customer preferences favoring access to the Corporation's products and services through digital channels,could decrease the value of the Corporation's branch network and other assets. If customers increasingly choose to access the Corporation's products and servicesthrough digital channels, the Corporation may find it necessary to consolidate, close or sell branch locations or restructure its branch network. These actions couldlead to losses on assets, expenses to reconfigure branches and the loss of customers in affected markets. As a result, the Corporation's business, financial conditionor results of operations may be adversely affected.
The Corporation may not be able to attract and retain skilled people.
The Corporation's success depends, in large part, on its ability to attract and retain skilled people. Competition for talented personnel in most activities engaged inby the Corporation can be intense, and the Corporation may not be able to hire sufficiently skilled people or to retain them. The unexpected loss of services of oneor more of the Corporation's key personnel could have a material adverse impact on the Corporation's business because of their skills, knowledge of theCorporation's markets, years of industry experience and the difficulty of promptly finding qualified replacement personnel.
RISKS RELATED TO AN INVESTMENT IN THE CORPORATION'S SECURITIES.
The Corporation's future growth may require the Corporation to raise additional capital in the future, but that capital may not be available when it is needed or maybe available only at an excessive cost.
The Corporation is required by regulatory agencies to maintain adequate levels of capital to support its operations. The Corporation anticipates that current capitallevels will satisfy regulatory requirements for the foreseeable future. The Corporation, however, may at some point choose to raise additional capital to supportfuture growth. The Corporation's ability to raise additional capital will depend, in part, on conditions in the financial markets at that time, which are outside of theCorporation's control. Accordingly, the Corporation may be unable to raise additional capital, if and when needed, on terms acceptable to the Corporation, or atall.
25
If the Corporation cannot raise additional capital when needed, its ability to expand operations through internal growth and acquisitions could be materiallyimpacted. In the event of a material decrease in the Corporation's stock price, future issuances of equity securities could result in dilution of existing shareholderinterests.
Capital requirements have been adopted by U.S. banking regulators that may limit the Corporation's ability to return earnings to shareholders or operate or invest inits business.
The Corporation and Fulton Bank are subject to capital requirements under the Basel III Rules. Failure to meet the established capital requirements could result inthe federal banking regulators placing limitations or conditions on the activities of the Corporation or Fulton Bank or restricting the commencement of newactivities, and such failure could subject the Corporation or Fulton Bank to a variety of enforcement remedies, including limiting the ability of the Corporation orFulton Bank to pay dividends, issuing a directive to increase capital and terminating FDIC deposit insurance. In addition, the failure to comply with the capitalconservation buffer will result in restrictions on capital distributions and discretionary cash bonus payments to executive officers. As of December 31, 2019, theCorporation's current capital levels met the minimum capital requirements, including the capital conservation buffer, as set forth in the Basel III Rules. See Item 1."Business-Supervision and Regulation-Capital Requirements."
In addition, the implementation of certain regulations with regard to regulatory capital could disproportionately affect the Corporation's regulatory capital positionrelative to that of its competitors, including those who may not be subject to the same regulatory requirements.
The Corporation is a holding company and relies on dividends and other payments from its subsidiaries for substantially all of its revenue and its ability to makedividend payments, distributions and other payments.
Fulton Financial Corporation is a separate and distinct legal entity from its bank and non-bank subsidiaries, and depends on the payment of dividends and otherpayments and distributions from its subsidiaries, principally Fulton Bank, for substantially all of its revenues. As a result, the Corporation's ability to makedividend payments on its common stock depends primarily on compliance with applicable federal regulatory requirements and the receipt of dividends and otherdistributions from its subsidiaries. There are various regulatory and prudential supervisory restrictions, which may change from time to time, that impact the abilityof Fulton Bank to pay dividends or make other payments to the Corporation. There can be no assurance that Fulton Bank will be able to pay dividends at pastlevels, or at all, in the future. If the Corporation does not receive sufficient cash dividends or is unable to borrow from Fulton Bank, then the Corporation may nothave sufficient funds to pay dividends to its shareholders, repurchase its common stock or service its debt obligations. See Item 1. "Business-Supervision andRegulation-Loans and Dividends from Bank Subsidiary."
In addition, the Corporation has pursued a strategy of capital management under which it has sought to deploy its capital, through stock repurchases, increasedregular dividends and special dividends, in a manner that is beneficial to the Corporation's shareholders. This capital management strategy is subject to regulatorysupervision. In July 2019, the Federal Reserve Board eliminated the standalone prior approval requirement in the capital rules for repurchase or redemption ofcommon stock. In certain circumstances, however, the Corporation's repurchases of its common stock may be subject to a prior approval or notice requirementunder the regulations or policies of the Federal Reserve Board. As a result, the Corporation may not be able to enter the market for stock repurchases on a timelybasis when the Corporation's board of directors and management believe such repurchases to be most opportune, or at all.
A downgrade in the credit ratings of the Corporation or Fulton Bank could have a material adverse impact on the Corporation.
Moody's Investors Service, Inc. and DBRS, Inc. continuously evaluate the Corporation and Fulton Bank, and their ratings of the Corporation's and Fulton Bank'slong-term and short-term debt are based on a number of factors, including financial strength, as well as factors not entirely within the Corporation's and FultonBank's control, such as conditions affecting the financial services industry generally. In light of these reviews and the continued focus on the financial servicesindustry generally, the Corporation and Fulton Bank may not be able to maintain their current respective ratings. Ratings downgrades by any of these credit ratingagencies could have a significant and immediate impact on the Corporation's funding and liquidity through cash obligations, reduced funding capacity andcollateral triggers. A reduction in the Corporation's or Fulton Bank's credit ratings could also increase the Corporation's and Fulton Bank's borrowing costs andlimit their access to the capital markets.
Downgrades in the credit or financial strength ratings assigned to the counterparties with whom the Corporation transacts could create the perception that theCorporation's financial condition will be adversely impacted as a result of potential future defaults by such counterparties. Additionally, the Corporation could beadversely affected by a general, negative perception of financial institutions caused by the downgrade of other financial institutions. Accordingly, ratingsdowngrades for other financial institutions could affect the market price of the Corporation's stock and could limit the Corporation's access to or increase its costof capital.
26

Anti-takeover provisions could negatively impact the Corporation's shareholders.
Provisions of banking laws, Pennsylvania corporate law and of the Corporation's Amended and Restated Articles of Incorporation and Bylaws could make it moredifficult for a third party to acquire control of the Corporation or have the effect of discouraging a third party from attempting to acquire control of theCorporation. To the extent that these provisions discourage such a transaction, holders of the Corporation's common stock may not have an opportunity to disposeof part or all of their stock at a higher price than that prevailing in the market. These provisions may also adversely affect the market price of the Corporation'sstock. In addition, some of these provisions make it more difficult to remove, and thereby may serve to entrench, the Corporation's incumbent directors andofficers, even if their removal would be regarded by some shareholders as desirable.
Certain provisions of Pennsylvania corporate law applicable to the Corporation and the Corporation's Amended and Restated Articles of Incorporation and Bylawsinclude provisions which may be considered to be "anti-takeover" in nature because they may have the effect of discouraging or making more difficult theacquisition of control of the Corporation by means of a hostile tender offer, exchange offer, proxy contest or similar transaction. These provisions are intended toprotect the Corporation's shareholders by providing a measure of assurance that the Corporation's shareholders will be treated fairly in the event of an unsolicitedtakeover bid and by preventing a successful takeover bidder from exercising its voting control to the detriment of the other shareholders. However, theseprovisions, taken as a whole, may also discourage a hostile tender offer, exchange offer, proxy solicitation or similar transaction relating to the Corporation'scommon stock, even if the accomplishment of a given transaction may be favorable to the interests of shareholders.
The ability of a third party to acquire the Corporation is also limited under applicable banking regulations. The BHCA requires any "bank holding company" (asdefined in that Act) to obtain the approval of the Federal Reserve Board prior to acquiring more than 5% of the Corporation's outstanding common stock. Anyperson other than a bank holding company is required to obtain prior approval of the Federal Reserve Board to acquire 10% or more of the Corporation'soutstanding common stock under the Change in Bank Control Act of 1978 and, under certain circumstances, such approvals are required at an even lowerownership percentage. Any holder of 25% or more of the Corporation's outstanding common stock, other than an individual, is subject to regulation as a bankholding company under the BHCA. In addition, the delays associated with obtaining necessary regulatory approvals for acquisitions of interests in bank holdingcompanies also tend to make more difficult certain methods of effecting acquisitions. While these provisions do not prohibit an acquisition, they would likely actas deterrents to an unsolicited takeover attempt.
Item 1B. Unresolved Staff CommentsNone.
Item 2. Properties
The Corporation's full-service banking branch properties as of December 31, 2019 totaled 230 branches. Of those branches, 96 were owned and 134 were leased.Remote service facilities (mainly stand-alone automated teller machines) are excluded from these totals. The Corporate headquarters is located in Lancaster,Pennsylvania. The Corporation owns two dedicated operations centers, located in East Petersburg, Pennsylvania and Mantua, New Jersey.
Item 3. Legal Proceedings
The information presented in the "Legal Proceedings" section of "Note 18 - Commitments and Contingencies" in the Notes to Consolidated Financial Statements isincorporated herein by reference.
Item 4. Mine Safety Disclosures
Not applicable.
27
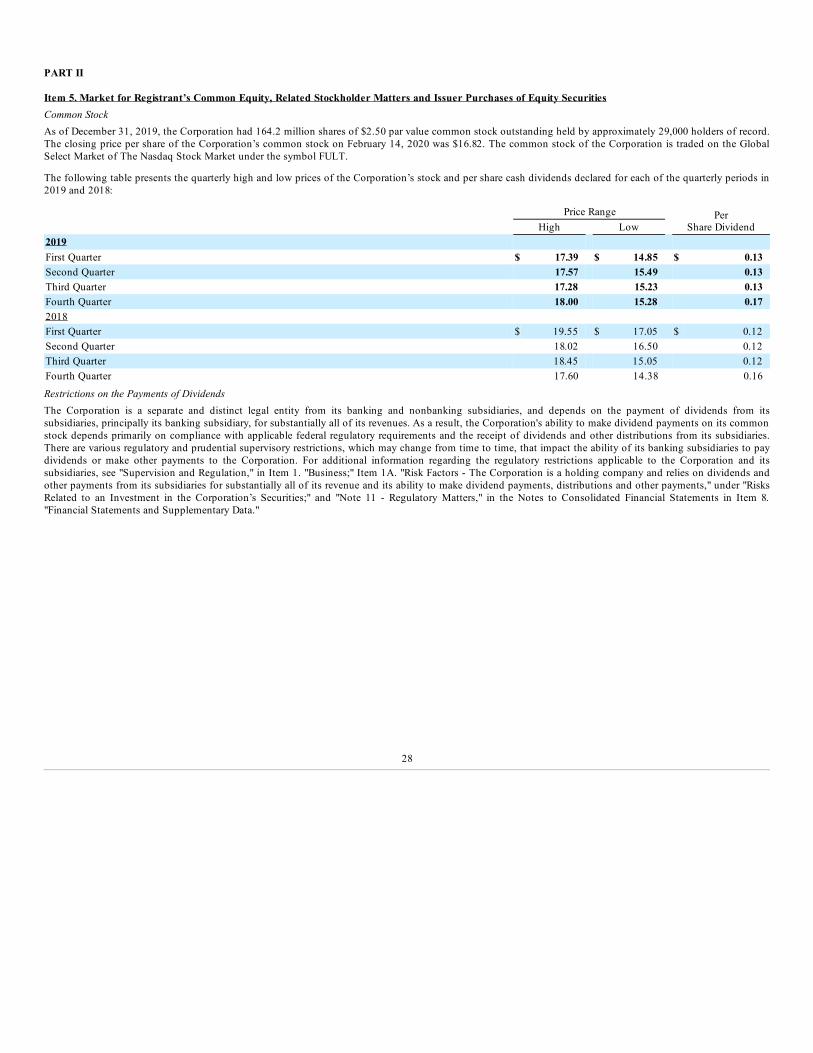
PART II
Item 5. Market for Registrant’s Common Equity, Related Stockholder Matters and Issuer Purchases of Equity SecuritiesCommon StockAs of December 31, 2019, the Corporation had 164.2 million shares of $2.50 par value common stock outstanding held by approximately 29,000 holders of record.The closing price per share of the Corporation’s common stock on February 14, 2020 was $16.82. The common stock of the Corporation is traded on the GlobalSelect Market of The Nasdaq Stock Market under the symbol FULT.
The following table presents the quarterly high and low prices of the Corporation’s stock and per share cash dividends declared for each of the quarterly periods in2019 and 2018:
Price Range PerShare Dividend High Low
2019 First Quarter $ 17.39 $ 14.85 $ 0.13Second Quarter 17.57 15.49 0.13Third Quarter 17.28 15.23 0.13Fourth Quarter 18.00 15.28 0.172018 First Quarter $ 19.55 $ 17.05 $ 0.12Second Quarter 18.02 16.50 0.12Third Quarter 18.45 15.05 0.12Fourth Quarter 17.60 14.38 0.16
Restrictions on the Payments of DividendsThe Corporation is a separate and distinct legal entity from its banking and nonbanking subsidiaries, and depends on the payment of dividends from itssubsidiaries, principally its banking subsidiary, for substantially all of its revenues. As a result, the Corporation's ability to make dividend payments on its commonstock depends primarily on compliance with applicable federal regulatory requirements and the receipt of dividends and other distributions from its subsidiaries.There are various regulatory and prudential supervisory restrictions, which may change from time to time, that impact the ability of its banking subsidiaries to paydividends or make other payments to the Corporation. For additional information regarding the regulatory restrictions applicable to the Corporation and itssubsidiaries, see "Supervision and Regulation," in Item 1. "Business;" Item 1A. "Risk Factors - The Corporation is a holding company and relies on dividends andother payments from its subsidiaries for substantially all of its revenue and its ability to make dividend payments, distributions and other payments," under "RisksRelated to an Investment in the Corporation’s Securities;" and "Note 11 - Regulatory Matters," in the Notes to Consolidated Financial Statements in Item 8."Financial Statements and Supplementary Data."
28
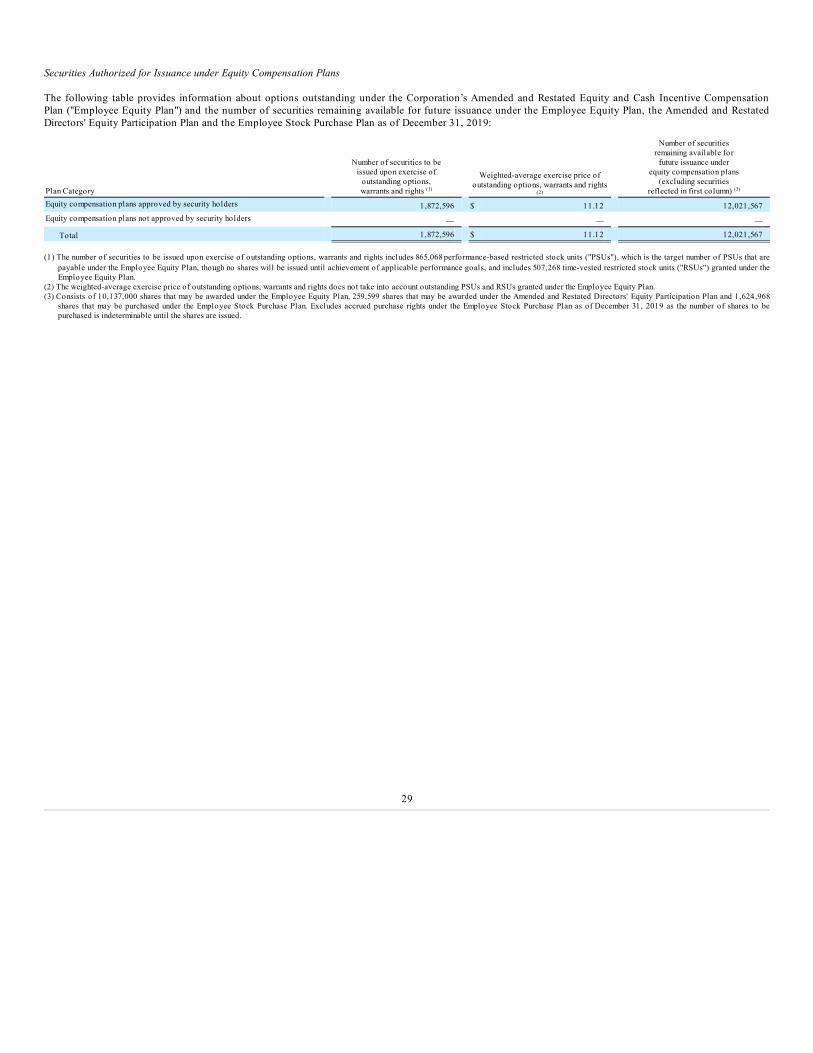
Securities Authorized for Issuance under Equity Compensation Plans
The following table provides information about options outstanding under the Corporation’s Amended and Restated Equity and Cash Incentive CompensationPlan ("Employee Equity Plan") and the number of securities remaining available for future issuance under the Employee Equity Plan, the Amended and RestatedDirectors' Equity Participation Plan and the Employee Stock Purchase Plan as of December 31, 2019:
Plan Category
Number of securities to beissued upon exercise of
outstanding options,warrants and rights (1)
Weighted-average exercise price ofoutstanding options, warrants and rights
(2)
Number of securitiesremaining available for
future issuance underequity compensation plans
(excluding securitiesreflected in first column) (3)
Equity compensation plans approved by security holders 1,872,596 $ 11.12 12,021,567Equity compensation plans not approved by security holders — — —
Total 1,872,596 $ 11.12 12,021,567
(1) The number of securities to be issued upon exercise of outstanding options, warrants and rights includes 865,068 performance-based restricted stock units ("PSUs"), which is the target number of PSUs that arepayable under the Employee Equity Plan, though no shares will be issued until achievement of applicable performance goals, and includes 507,268 time-vested restricted stock units ("RSUs") granted under theEmployee Equity Plan.
(2) The weighted-average exercise price of outstanding options, warrants and rights does not take into account outstanding PSUs and RSUs granted under the Employee Equity Plan.(3) Consists of 10,137,000 shares that may be awarded under the Employee Equity Plan, 259,599 shares that may be awarded under the Amended and Restated Directors' Equity Participation Plan and 1,624,968
shares that may be purchased under the Employee Stock Purchase Plan. Excludes accrued purchase rights under the Employee Stock Purchase Plan as of December 31, 2019 as the number of shares to bepurchased is indeterminable until the shares are issued.
29

Performance GraphThe following graph shows cumulative total shareholder return (i.e., price change, plus reinvestment of dividends) on the common stock of Fulton FinancialCorporation during the five-year period ended December 31, 2019, compared with (1) the NASDAQ Bank Index and (2) the Standard and Poor's 500 index ("S&P500"). The graph is not indicative of future price performance.
The graph below is furnished under this Part II, Item 5 of this Form 10-K and shall not be deemed to be "soliciting material" or to be "filed" with the SEC orsubject to Regulation 14A or 14C, or to the liabilities of Section 18 of the Securities Exchange Act of 1934, as amended.
Year Ending December 31Index 2014 2015 2016 2017 2018 2019Fulton Financial Corporation $ 100.00 $ 108.44 $ 161.06 $ 157.29 $ 140.33 $ 163.49S&P 500 $ 100.00 $ 101.38 $ 113.51 $ 138.29 $ 132.23 $ 173.86NASDAQ Bank Index $ 100.00 $ 102.21 $ 129.34 $ 153.13 $ 128.02 $ 175.61
30
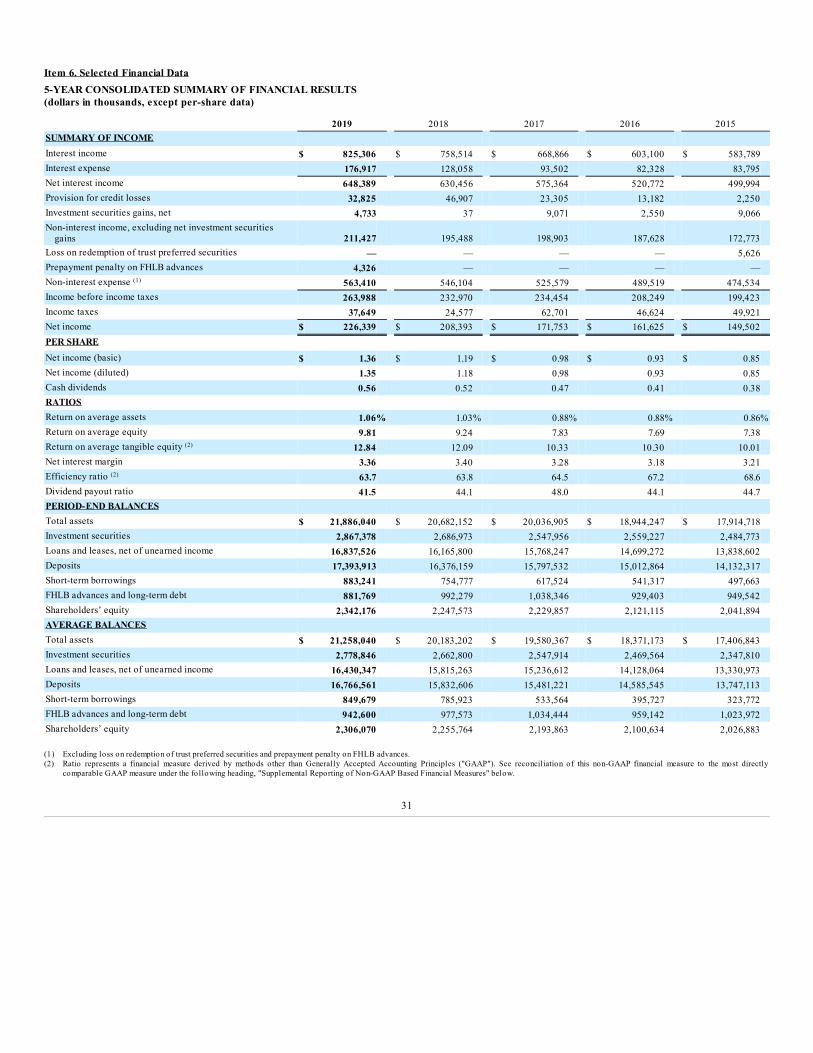
Item 6. Selected Financial Data5-YEAR CONSOLIDATED SUMMARY OF FINANCIAL RESULTS(dollars in thousands, except per-share data)
2019 2018 2017 2016 2015SUMMARY OF INCOME Interest income $ 825,306 $ 758,514 $ 668,866 $ 603,100 $ 583,789Interest expense 176,917 128,058 93,502 82,328 83,795Net interest income 648,389 630,456 575,364 520,772 499,994Provision for credit losses 32,825 46,907 23,305 13,182 2,250Investment securities gains, net 4,733 37 9,071 2,550 9,066Non-interest income, excluding net investment securities
gains 211,427 195,488 198,903 187,628 172,773Loss on redemption of trust preferred securities — — — — 5,626Prepayment penalty on FHLB advances 4,326 — — — —Non-interest expense (1) 563,410 546,104 525,579 489,519 474,534Income before income taxes 263,988 232,970 234,454 208,249 199,423Income taxes 37,649 24,577 62,701 46,624 49,921Net income $ 226,339 $ 208,393 $ 171,753 $ 161,625 $ 149,502PER SHARE Net income (basic) $ 1.36 $ 1.19 $ 0.98 $ 0.93 $ 0.85Net income (diluted) 1.35 1.18 0.98 0.93 0.85Cash dividends 0.56 0.52 0.47 0.41 0.38RATIOS Return on average assets 1.06% 1.03% 0.88% 0.88% 0.86%Return on average equity 9.81 9.24 7.83 7.69 7.38Return on average tangible equity (2) 12.84 12.09 10.33 10.30 10.01Net interest margin 3.36 3.40 3.28 3.18 3.21Efficiency ratio (2) 63.7 63.8 64.5 67.2 68.6Dividend payout ratio 41.5 44.1 48.0 44.1 44.7PERIOD-END BALANCES Total assets $ 21,886,040 $ 20,682,152 $ 20,036,905 $ 18,944,247 $ 17,914,718Investment securities 2,867,378 2,686,973 2,547,956 2,559,227 2,484,773Loans and leases, net of unearned income 16,837,526 16,165,800 15,768,247 14,699,272 13,838,602Deposits 17,393,913 16,376,159 15,797,532 15,012,864 14,132,317Short-term borrowings 883,241 754,777 617,524 541,317 497,663FHLB advances and long-term debt 881,769 992,279 1,038,346 929,403 949,542Shareholders’ equity 2,342,176 2,247,573 2,229,857 2,121,115 2,041,894AVERAGE BALANCES Total assets $ 21,258,040 $ 20,183,202 $ 19,580,367 $ 18,371,173 $ 17,406,843Investment securities 2,778,846 2,662,800 2,547,914 2,469,564 2,347,810Loans and leases, net of unearned income 16,430,347 15,815,263 15,236,612 14,128,064 13,330,973Deposits 16,766,561 15,832,606 15,481,221 14,585,545 13,747,113Short-term borrowings 849,679 785,923 533,564 395,727 323,772FHLB advances and long-term debt 942,600 977,573 1,034,444 959,142 1,023,972Shareholders’ equity 2,306,070 2,255,764 2,193,863 2,100,634 2,026,883
(1) Excluding loss on redemption of trust preferred securities and prepayment penalty on FHLB advances.(2) Ratio represents a financial measure derived by methods other than Generally Accepted Accounting Principles ("GAAP"). See reconciliation of this non-GAAP financial measure to the most directly
comparable GAAP measure under the following heading, "Supplemental Reporting of Non-GAAP Based Financial Measures" below.
31
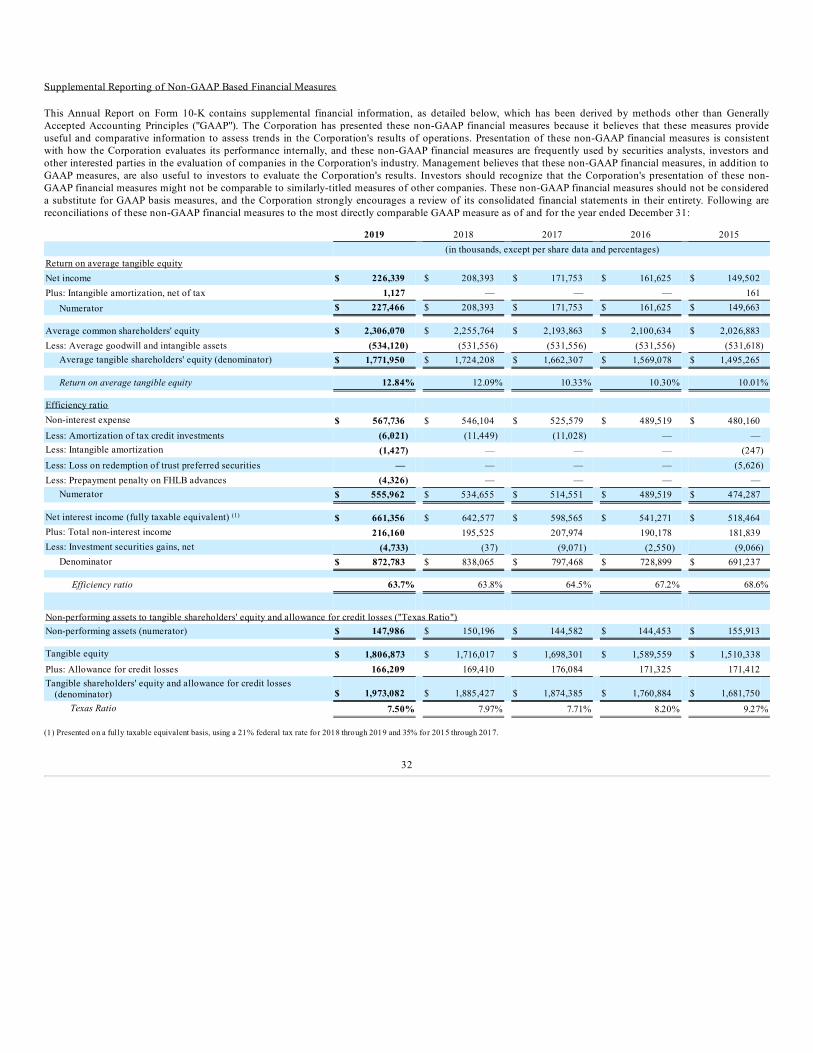
Supplemental Reporting of Non-GAAP Based Financial Measures
This Annual Report on Form 10-K contains supplemental financial information, as detailed below, which has been derived by methods other than GenerallyAccepted Accounting Principles ("GAAP"). The Corporation has presented these non-GAAP financial measures because it believes that these measures provideuseful and comparative information to assess trends in the Corporation's results of operations. Presentation of these non-GAAP financial measures is consistentwith how the Corporation evaluates its performance internally, and these non-GAAP financial measures are frequently used by securities analysts, investors andother interested parties in the evaluation of companies in the Corporation's industry. Management believes that these non-GAAP financial measures, in addition toGAAP measures, are also useful to investors to evaluate the Corporation's results. Investors should recognize that the Corporation's presentation of these non-GAAP financial measures might not be comparable to similarly-titled measures of other companies. These non-GAAP financial measures should not be considereda substitute for GAAP basis measures, and the Corporation strongly encourages a review of its consolidated financial statements in their entirety. Following arereconciliations of these non-GAAP financial measures to the most directly comparable GAAP measure as of and for the year ended December 31:
2019 2018 2017 2016 2015 (in thousands, except per share data and percentages)Return on average tangible equityNet income $ 226,339 $ 208,393 $ 171,753 $ 161,625 $ 149,502Plus: Intangible amortization, net of tax 1,127 — — — 161
Numerator $ 227,466 $ 208,393 $ 171,753 $ 161,625 $ 149,663
Average common shareholders' equity $ 2,306,070 $ 2,255,764 $ 2,193,863 $ 2,100,634 $ 2,026,883Less: Average goodwill and intangible assets (534,120) (531,556) (531,556) (531,556) (531,618)
Average tangible shareholders' equity (denominator) $ 1,771,950 $ 1,724,208 $ 1,662,307 $ 1,569,078 $ 1,495,265
Return on average tangible equity 12.84% 12.09% 10.33% 10.30% 10.01%
Efficiency ratio Non-interest expense $ 567,736 $ 546,104 $ 525,579 $ 489,519 $ 480,160Less: Amortization of tax credit investments (6,021) (11,449) (11,028) — —Less: Intangible amortization (1,427) — — — (247)Less: Loss on redemption of trust preferred securities — — — — (5,626)Less: Prepayment penalty on FHLB advances (4,326) — — — —
Numerator $ 555,962 $ 534,655 $ 514,551 $ 489,519 $ 474,287
Net interest income (fully taxable equivalent) (1) $ 661,356 $ 642,577 $ 598,565 $ 541,271 $ 518,464Plus: Total non-interest income 216,160 195,525 207,974 190,178 181,839Less: Investment securities gains, net (4,733) (37) (9,071) (2,550) (9,066)
Denominator $ 872,783 $ 838,065 $ 797,468 $ 728,899 $ 691,237
Efficiency ratio 63.7% 63.8% 64.5% 67.2% 68.6%
Non-performing assets to tangible shareholders' equity and allowance for credit losses ("Texas Ratio")Non-performing assets (numerator) $ 147,986 $ 150,196 $ 144,582 $ 144,453 $ 155,913
Tangible equity $ 1,806,873 $ 1,716,017 $ 1,698,301 $ 1,589,559 $ 1,510,338Plus: Allowance for credit losses 166,209 169,410 176,084 171,325 171,412Tangible shareholders' equity and allowance for credit losses
(denominator) $ 1,973,082 $ 1,885,427 $ 1,874,385 $ 1,760,884 $ 1,681,750Texas Ratio 7.50% 7.97% 7.71% 8.20% 9.27%
(1) Presented on a fully taxable equivalent basis, using a 21% federal tax rate for 2018 through 2019 and 35% for 2015 through 2017.
32

Item 7. Management’s Discussion and Analysis of Financial Condition and Results of OperationsThis Management’s Discussion and Analysis of Financial Condition and Results of Operations ("Management’s Discussion") relates to Fulton FinancialCorporation (the "Corporation"), a financial holding company registered under the Bank Holding Company Act and incorporated under the laws of theCommonwealth of Pennsylvania in 1982, and its wholly owned subsidiaries. Management’s Discussion should be read in conjunction with the consolidatedfinancial statements and other financial information presented in this report.
FORWARD-LOOKING STATEMENTS
The Corporation has made, and may continue to make, certain forward-looking statements with respect to its financial condition, results of operations andbusiness. Do not unduly rely on forward-looking statements. Forward-looking statements can be identified by the use of words such as "may," "should," "will,""could," "estimates," "predicts," "potential," "continue," "anticipates," "believes," "plans," "expects," "future," "intends," "projects," the negative of these terms andother comparable terminology. These forward looking statements may include projections of, or guidance on, the Corporation’s future financial performance,expected levels of future expenses, anticipated growth strategies, descriptions of new business initiatives and anticipated trends in the Corporation’s business orfinancial results.
Forward-looking statements are neither historical facts, nor assurance of future performance. Instead, they are based on current beliefs, expectations andassumptions regarding the future of the Corporation’s business, future plans and strategies, projections, anticipated events and trends, the economy and otherfuture conditions. Because forward-looking statements relate to the future, they are subject to inherent uncertainties, risks and changes in circumstances that aredifficult to predict and many of which are outside of the Corporation’s control, and actual results and financial condition may differ materially from thoseindicated in the forward-looking statements. Therefore, you should not unduly rely on any of these forward-looking statements. Any forward-looking statement isbased only on information currently available and speaks only as of the date when made. The Corporation undertakes no obligation, other than as required by law,to update or revise any forward-looking statements, whether as a result of new information, future events or otherwise. Many factors could affect future financialresults including, without limitation:
• the impact of adverse conditions in the economy and financial markets on the performance of the Corporation’s loan and lease portfolio and demand forthe Corporation’s products and services;
• increases in non-performing assets, which may require the Corporation to increase the allowance for credit losses, charge off loans and leases and incurelevated collection and carrying costs related to such non-performing assets;
• investment securities gains and losses, including other-than-temporary declines in the value of securities which may result in charges to earnings;• the effects of market interest rates, and the relative balances of interest rate-sensitive assets to interest rate-sensitive liabilities, on net interest margin and
net interest income;• the planned phasing out of LIBOR as a benchmark reference rate;• the effects of changes in interest rates on demand for the Corporation’s products and services;• the effects of changes in interest rates or disruptions in liquidity markets on the Corporation’s sources of funding;• the effects of the extensive level of regulation and supervision to which the Corporation and Fulton Bank, N.A. ("Fulton Bank" or "the Bank") are subject;• the effects of the significant amounts of time and expense associated with regulatory compliance and risk management;• the potential for negative consequences from regulatory violations, investigations and examinations, or failure to comply with the BSA, the Patriot Act
and related AML requirements, including potential supervisory actions, the assessment of fines and penalties, the imposition of sanctions and the need toundertake remedial actions;
• the continuing impact of the Dodd-Frank Act on the Corporation’s business and results of operations;• the effects of, and uncertainty surrounding, new legislation, changes in regulation and government policy, which could result in significant changes in
banking and financial services regulation;• the effects of actions by the federal government, including those of the Federal Reserve Board and other government agencies, that impact money supply
and market interest rates;• the effects of changes in U.S. federal, state or local tax laws;• the effects of negative publicity on the Corporation’s reputation;• the effects of adverse outcomes in litigation and governmental or administrative proceedings;• the potential to incur losses in connection with repurchase and indemnification payments related to sold loans;• the Corporation’s ability to achieve its growth plans;• completed and potential acquisitions may affect costs and the Corporation may not be able to successfully integrate the acquired business or realize the
anticipated benefits from such acquisitions;• the effects of competition on deposit rates and growth, loan rates and growth and net interest margin;
33

• the Corporation’s ability to manage the level of non-interest expenses, including salaries and employee benefits expenses, operating risk losses andgoodwill impairment;
• the effects of changes in accounting policies, standards, and interpretations on the Corporation’s reporting of its financial condition and results ofoperations;
• the impact of operational risks, including the risk of human error, inadequate or failed internal processes and systems, computer and telecommunicationssystems failures, faulty or incomplete data and an inadequate risk management framework;
• the impact of failures of third parties upon which the Corporation relies to perform in accordance with contractual arrangements;• the failure or circumvention of the Corporation’s system of internal controls;• the loss of, or failure to safeguard, confidential or proprietary information;• the Corporation’s failure to identify and to address cyber-security risks, including data breaches and cyber-attacks;• the Corporation’s ability to keep pace with technological changes;• the Corporation’s ability to attract and retain talented personnel;• capital and liquidity strategies, including the Corporation’s ability to comply with applicable capital and liquidity requirements, and the Corporation’s
ability to generate capital internally or raise capital on favorable terms;• the Corporation’s reliance on its subsidiaries for substantially all of its revenues and its ability to pay dividends or other distributions; and• the effects of any downgrade in the Corporation’s or Fulton Bank’s credit ratings on their borrowing costs or access to capital markets.
OVERVIEW
The Corporation is a financial holding company, which, through its wholly owned banking subsidiary, provides a full range of retail and commercial financialservices in Pennsylvania, Delaware, Maryland, New Jersey and Virginia. During 2018, the Corporation consolidated two of its wholly owned banking subsidiariesinto its lead bank, Fulton Bank, and during 2019, the remaining three wholly owned banking subsidiaries were consolidated into Fulton Bank.
The Corporation generates the majority of its revenue through net interest income, or the difference between interest earned on loans and investments and interestpaid on deposits and borrowings. Growth in net interest income is dependent upon balance sheet growth and maintaining or increasing the net interest margin,which is net interest income (fully taxable-equivalent, or "FTE") as a percentage of average interest-earning assets. The Corporation also generates revenue throughfees earned on the various services and products offered to its customers and through gains on sales of assets, such as loans, investments and properties.Offsetting these revenue sources are provisions for credit losses on loans and leases and off-balance sheet credit risks, non-interest expenses and income taxes.
The following table presents a summary of the Corporation’s earnings and selected performance ratios:
2019 2018Net income (in thousands) $ 226,339 $ 208,393Diluted net income per share $ 1.35 $ 1.18Return on average assets 1.06% 1.03%Return on average equity 9.81% 9.24%Return on average tangible equity (1) 12.84% 12.09%Net interest margin (2) 3.36% 3.40%Efficiency ratio (1) 63.7% 63.8%Non-performing assets to total assets 0.68% 0.73%Annualized net charge-offs to average loans and leases 0.22% 0.34% (1) Ratio represents a financial measure derived by methods other than U.S. Generally Accepted Accounting Principles ("GAAP"). See reconciliation of this non-GAAP financial measure to the most directly
comparable GAAP measure under the heading, "Supplemental Reporting of Non-GAAP Based Financial Measures," in Item 6. Selected Financial Data.(2) Presented on an FTE basis, using a 21% Federal tax rate and statutory interest expense disallowances. See also the "Net Interest Income" section of Management’s Discussion.
34

Following is a summary of the financial highlights for the year ended December 31, 2019:
• Net Income Per Share Growth - Diluted net income per share increased $0.17, or 14.4%, to $1.35 in 2019 compared to $1.18 in 2018. The growth in netincome per share was due to a $17.9 million, or 8.6%, increase in net income and the impact of an 8.8 million, or 5.0%, decrease in weighted averagediluted shares outstanding in comparison to 2018. The increase in net income was driven by a $17.9 million, or 2.8%, increase in net interest income, a$14.1 million decrease in the provision for credit losses, a $15.9 million, or 8.1%, increase in non-interest income, and a $4.7 million increase ininvestment securities gains, partially offset by a $21.6 million, or 4.0%, increase in non-interest expense and a $13.1 million increase in income taxes.
• Net Interest Income Growth - The $17.9 million increase in net interest income resulted from growth in interest-earning assets, partially offset by theimpact of a lower net interest margin.
◦ Net Interest Margin - For the year ended December 31, 2019, the net interest margin decreased 4 basis points, or 1.2%, in comparison to 2018,driven by an 18 basis point increase in yields on interest-earning assets, being more than offset by a 22 basis point increase in the cost of funds.
◦ Loan and Lease Growth - Average loans and leases increased $615.1 million, or 3.9%, in comparison to 2018, with notable increases in residentialand commercial mortgages and commercial loans. Loan and lease growth occurred throughout all geographic markets.
◦ Deposit Growth - Average deposits increased $934.0 million, or 5.9%, in comparison to 2018. The increase was the result of growth in all deposittypes. At December 31, 2019, the loan-to-deposit ratio was 96.8%, as compared to 98.7% at December 31, 2018.
• Provision for Credit Losses - The provision for credit losses decreased $14.1 million, to $32.8 million, for the year ended December 31, 2019. During 2018,the Corporation recorded a $36.8 million provision related to fraud committed by a single, large commercial relationship ("Commercial Relationship"). In2019, the Corporation recorded a $20.0 million provision for a certain commercial borrower.
• Non-Interest Income - Non-interest income, excluding securities gains, increased $15.9 million, or 8.2%, in comparison to 2018. Increases were experiencedin wealth management, commercial and consumer banking and mortgage banking.
• Investment Securities Gains - Investment securities gains totaled $4.7 million in 2019, as compared to $37,000 in 2018. During the third quarter of 2019,the Corporation completed a balance sheet restructuring, which included the sale of approximately $400 million of investment securities and acorresponding prepayment of Federal Home Loan Bank ("FHLB") advances. As a result of these transactions, $4.5 million of investment securities gainswere realized. See Note 3, "Investment Securities," in the Notes to Consolidated Financial Statements for additional details.
• Non-Interest Expense - Non-interest expense increased $21.6 million, or 4.0%, in comparison to 2018, driven largely by higher salaries and employeebenefits expense, other outside services and data processing and software expenses. Partially offsetting these increases was a reduction in amortization oftax credit investments, FDIC insurance expense due to the recognition of $3.2 million in assessment credits in 2019 and professional fees. In addition, theCorporation recorded $4.3 million of prepayment penalties on certain FHLB advances in conjunction with the above-mentioned balance sheetrestructuring.
In connection with the consolidation of the Corporation's subsidiary banks into Fulton Bank ("Charter Consolidation"), expenses totaling $10.9 millionand $3.6 million were incurred in 2019 and 2018, respectively.
• Income Taxes - Income tax expense for 2019 resulted in an effective tax rate ("ETR") of 14.3%, as compared to 10.5% for 2018. The increase in the ETRwas primarily a result of higher income before income taxes and from realizing a one-time tax benefit associated with legislative changes enacted in NewJersey in the third quarter of 2018. The ETR is generally lower than the federal statutory rate of 21% due to tax-exempt interest income earned on loans,investments in tax-free municipal securities and investments in community development projects that generate tax credits under various federal programs.
35

CRITICAL ACCOUNTING POLICIES
The following is a summary of those accounting policies that the Corporation considers to be most important to the presentation of its financial condition andresults of operations, because they require management’s most difficult judgments as a result of the need to make estimates about the effects of matters that areinherently uncertain. See additional information regarding these critical accounting policies in "Note 1 - Summary of Significant Accounting Policies," in the Notesto the Consolidated Financial Statements in Item 8. "Financial Statements and Supplementary Data."
Allowance for Credit Losses - The allowance for credit losses consists of the allowance for loan and lease losses and the reserve for unfunded lendingcommitments. The allowance for loan and lease losses represents management’s estimate of incurred losses in the portfolio as of the balance sheet date and isrecorded as a reduction to loans and/or leases. The reserve for unfunded lending commitments represents management’s estimate of losses inherent in its unfundedloan and lease commitments and letters of credit and is recorded in other liabilities on the consolidated balance sheet.
The Corporation’s allowance for loan and lease losses includes: 1) specific allowances allocated to loans and leases evaluated for impairment under the FinancialAccounting Standards Board's Accounting Standards Codification ("ASC") Section 310-10-35; and 2) allowances calculated for pools of loans and leasesevaluated for impairment under ASC Subtopic 450-20.
Management's estimate of incurred losses in the loan and lease portfolio is based on a methodology that includes the following critical judgments:
• Identification of potential problem loans and leases in a timely manner. For commercial loans, commercial mortgages and construction loans to commercialborrowers, an internal risk rating process is used. The Corporation believes that internal risk ratings are the most relevant credit quality indicator for thesetypes of loans. The migration of loans through the various internal risk rating categories is a significant component of the allowance for credit lossesmethodology for these loans, which bases the probability of default on this migration. Assigning risk ratings involves judgment. The Corporation's loanreview officers provide an independent assessment of risk rating accuracy. Ratings may be changed based on the ongoing monitoring proceduresperformed by loan officers or credit administration staff, or if specific loan review assessments identify a deterioration or an improvement in the loan.
The Corporation does not assign internal risk ratings for residential mortgages, home equity loans, consumer loans, lease receivables, and constructionloans to individuals secured by residential real estate, as these portfolios consist of a larger number of loans with smaller balances. Instead, these portfoliosare evaluated for risk through the monitoring of delinquency status.
• Proper collateral valuation of impaired loans and leases evaluated for impairment under ASC Section 310-10-35. Substantially all of the Corporation’simpaired loans and leases to borrowers with total outstanding loan and lease balances greater than or equal to $1.0 million are measured based on theestimated fair value of each loan and lease’s collateral. Collateral could be in the form of real estate, in the case of impaired commercial mortgages andconstruction loans, or business assets, such as accounts receivable or inventory, in the case of commercial loans. Commercial loans may also be secured byreal property.
For loans secured by real estate, estimated fair values are determined primarily through appraisals performed by state certified third-party appraisers,discounted to arrive at expected net sale proceeds. For collateral-dependent loans, estimated real estate fair values are also net of estimated selling costs.When a real estate-secured loan becomes impaired, a decision is made regarding whether an updated appraisal of the real estate is necessary. This decisionis based on various considerations, including: the age of the most recent appraisal; the loan-to-value ratio based on the original appraisal; the condition ofthe property; the Corporation’s experience and knowledge of the real estate market; the purpose of the loan; market factors; payment status; the strengthof any guarantors; and the existence and age of other indications of value such as broker price opinions, among others. The Corporation generally obtainsupdated appraisals performed by state certified third-party appraisers for impaired loans secured predominately by real estate every 12 months.
When updated appraisals are not obtained for loans evaluated for impairment under FASB ASC Section 310-10-35 that are secured by real estate, fairvalues are estimated based on the original appraisal values, as long as the original appraisal indicated an acceptable loan-to-value position and, in theopinion of the Corporation's internal credit administration staff, there has not been a significant deterioration in the collateral value since the originalappraisal was performed.
• Proper measurement of allowance needs for pools of loans and leases under FASB ASC Subtopic 450-20. For loan and lease loss allocation purposes, loansand leases are segmented into pools with similar characteristics. These pools are established by general loan and lease type, or "portfolio segments," aspresented in the table under the heading, "Loans
36

and Leases, net of unearned income," within "Note 4 - Loans and Leases and Allowance for Credit Losses," in the Notes to Consolidated FinancialStatements in Item 8. "Financial Statements and Supplementary Data." Certain portfolio segments are further disaggregated and evaluated collectively forimpairment based on "class segments," which are largely based on the type of collateral underlying each loan or lease. For commercial loans, classsegments include loans secured by collateral and unsecured loans. Construction loan class segments include loans secured by commercial real estate, loansto commercial borrowers secured by residential real estate and loans to individuals secured by residential real estate. Consumer loan class segments arebased on collateral types and include direct consumer installment loans, home equity loans and indirect automobile loans. Equipment lease financingincludes commercial vehicle, construction, manufacturing and medical equipment leases.
Commercial loans, commercial mortgages and construction loans to commercial borrowers are further segmented into separate pools based on internallyassigned risk ratings. Residential mortgages, home equity loans, consumer loans, and lease receivables are further segmented into separate pools based ondelinquency status.
A loss rate is calculated for each pool through a migration analysis based on historical losses as loans and leases migrate through the various risk rating ordelinquency categories. Estimated loss rates are based on a probability of default and a loss given default. The loss rate is adjusted to consider qualitativefactors, such as economic conditions and trends.
• Overall assessment of the risk profile of the loan and lease portfolio. The allocation of the allowance for credit losses is reviewed to evaluate itsappropriateness in relation to the overall risk profile of the loan and lease portfolio. The Corporation considers risk factors such as: local and nationaleconomic conditions; trends in delinquencies and non-accrual loans and leases; the diversity of borrower industry types; and the composition of theportfolio by loan and lease type. Prior to 2017, the Corporation maintained an unallocated allowance for credit losses for factors and conditions that existat the balance sheet date, but are not specifically identifiable, and to recognize the inherent imprecision in estimating and measuring loss exposure. In2017, enhancements were made to allow for the impact of these factors and conditions to be quantified in the allowance allocation process. Accordingly,an unallocated allowance for credit losses is no longer necessary.
For additional details related to the allowance for credit losses, see "Note 4 - Loans and Leases and Allowance for Credit Losses," in the Notes to ConsolidatedFinancial Statements in Item 8. "Financial Statements and Supplementary Data."
Goodwill - Goodwill recorded in connection with acquisitions is not amortized to expense, but is tested at least annually for impairment. A quantitative annualimpairment test is not required if, based on a qualitative analysis, the Corporation determines that the existence of events and circumstances indicate that it is morelikely than not that goodwill is not impaired. The Corporation completes its annual goodwill impairment test in October of each year.
Reporting unit valuation is inherently subjective, with a number of factors based on assumptions and management judgments. Among these are future growthrates for the reporting units, selection of comparable market transactions, discount rates and earnings capitalization rates. Changes in assumptions and results dueto economic conditions, industry factors and reporting unit performance could result in different assessments of the fair values of reporting units and could resultin impairment charges.
For additional details related to the annual goodwill impairment test, see "Note 6 - Goodwill and Intangible Assets," in the Notes to Consolidated FinancialStatements in Item 8. "Financial Statements and Supplementary Data."
Income Taxes – The provision for income taxes is based upon income before income taxes, adjusted for the effect of certain tax-exempt income, non-deductibleexpenses and credits. In addition, certain items of income and expense are reported in different periods for financial reporting and tax return purposes. The taxeffects of these temporary differences are recognized currently in the deferred income tax provision or benefit. Deferred tax assets or liabilities are computed basedon the difference between the financial statement and income tax bases of assets and liabilities using the applicable enacted marginal tax rate.
The Corporation must also evaluate the likelihood that deferred tax assets will be recovered through future taxable income. If any such assets are more likely thannot to not be recovered, a valuation allowance must be recognized. The assessment of the carrying value of deferred tax assets is based on certain assumptions,changes in which could have a material impact on the Corporation’s consolidated financial statements.
On a periodic basis, the Corporation evaluates its income tax positions based on tax laws, regulations and financial reporting considerations, and recordsadjustments as appropriate. Recognition and measurement of tax positions is based upon management’s evaluations of current taxing authorities’ examinations ofthe Corporation’s tax returns, recent positions taken by the taxing authorities on similar transactions and the overall tax environment.
37

Fair Value Measurements – Assets and liabilities are categorized in a fair value hierarchy for the inputs to valuation techniques used to measure at fair value basedon the following categories (from highest to lowest priority):
• Level 1 – Inputs that represent quoted prices for identical instruments in active markets.• Level 2 – Inputs that represent quoted prices for similar instruments in active markets, or quoted prices for identical instruments in non-active markets.
Also includes valuation techniques whose inputs are derived principally from observable market data other than quoted prices, such as interest rates orother market-corroborated means.
• Level 3 – Inputs that are largely unobservable, as little or no market data exists for the instrument being valued.
The determination of fair value for assets categorized as Level 3 items involves a great deal of subjectivity due to the use of unobservable inputs. In addition,determining when a market is no longer active and placing little or no reliance on distressed market prices requires the use of management’s judgment. TheCorporation's Level 3 assets include available for sale debt securities in the form of pooled trust preferred securities, certain single-issuer trust preferred securitiesissued by financial institutions and auction rate securities. The Corporation also categorizes impaired loans and leases, net of allowance, other real estate owned("OREO") and mortgage servicing rights ("MSRs") as Level 3 assets measured at fair value on a nonrecurring basis.
The Corporation engages third-party valuation experts to assist in valuing interest rate swap derivatives and most available-for-sale investment securities, bothmeasured at fair value on a recurring basis, and MSRs, which are measured at fair value on a non-recurring basis. The pricing data and market quotes theCorporation obtains from outside sources are reviewed internally for reasonableness.
For additional details see "Note 19 - Fair Value Measurements," in the Notes to Consolidated Financial Statements in Item 8. "Financial Statements andSupplementary Data."
Recently Issued Accounting Standards
For a description of accounting standards recently issued, but not yet adopted by the Corporation, see "Recently Issued Accounting Standards," in "Note 1 -Summary of Significant Accounting Policies" in the Notes to Consolidated Financial Statements in Item 8. "Financial Statements and Supplementary Data."
38

RESULTS OF OPERATIONS
Net Interest Income
Net interest income is the most significant component of the Corporation’s net income. The Corporation manages the risk associated with changes in interest ratesthrough the techniques described within Item 7A, "Quantitative and Qualitative Disclosures About Market Risk." The following table provides a comparativeaverage balance sheet and net interest income analysis for 2019 compared to 2018 and 2017. Interest income and yields are presented on an FTE basis, using a21% federal tax rate for 2019 and 2018 and 35% for 2017, as well as statutory interest expense disallowances. The discussion following this table is based on thesetax-equivalent amounts.
2019 2018 2017
AverageBalance Interest ( 1)
Yield/Rate
AverageBalance Interest (1)
Yield/Rate
AverageBalance Interest (1)
Yield/Rate
(dollars in thousands)ASSETS Interest-earning assets:
Loans and leases, net of unearned income (2) $ 16,430,347 $ 747,119 4.55% $ 15,815,263 $ 691,954 4.38% $ 15,236,612 $ 620,803 4.07%Taxable investment securities (3) 2,278,448 62,556 2.74 2,246,555 56,039 2.49 2,132,426 47,029 2.21Tax-exempt investment securities (3) 500,398 17,998 3.57 416,119 15,285 3.65 407,157 17,794 4.37Equity securities (3) — — — 126 5 3.97 8,331 500 6.00
Total investment securities 2,778,846 80,554 2.89 2,662,800 71,329 2.68 2,547,914 65,323 2.56Loans held for sale 25,795 1,351 5.24 22,970 1,159 5.05 20,008 876 4.38Other interest-earning assets 445,008 9,249 2.08 382,569 6,193 1.62 451,015 5,066 1.12
Total interest-earning assets 19,679,996 838,273 4.26 18,883,602 770,635 4.08 18,255,549 692,068 3.79Noninterest-earning assets:
Cash and due from banks 119,144 104,595 108,523 Premises and equipment 239,376 231,762 219,960 Other assets (3) 1,385,689 1,123,857 1,168,759 Less: Allowance for loan and lease losses (166,165) (160,614) (172,424)
Total Assets $ 21,258,040 $ 20,183,202 $ 19,580,367 LIABILITIES AND EQUITY Interest-bearing liabilities:
Demand deposits $ 4,384,059 $ 33,348 0.76% $ 4,063,929 $ 22,789 0.56% $ 3,831,865 $ 12,976 0.34%Savings deposits 5,018,381 41,823 0.83 4,684,023 27,226 0.58 4,468,205 13,477 0.30Brokered deposits 245,483 5,779 2.35 121,863 2,480 2.04 49,126 613 1.25Time deposits 2,869,344 50,825 1.77 2,675,670 35,217 1.32 2,721,724 30,726 1.13
Total interest-bearing deposits 12,517,267 131,775 1.05 11,545,485 87,712 0.76 11,070,920 57,792 0.52Short-term borrowings 849,679 14,543 1.70 785,923 8,489 1.07 533,564 2,779 0.52FHLB advances and long-term debt 942,600 30,599 3.25 977,573 31,857 3.26 1,034,444 32,932 3.18
Total interest-bearing liabilities 14,309,546 176,917 1.24 13,308,981 128,058 0.96 12,638,928 93,503 0.74Noninterest-bearing liabilities:
Demand deposits 4,249,294 4,287,121 4,410,301 Total deposits 16,766,561 15,832,606 15,481,221 Other liabilities 393,130 331,336 337,275 Total Liabilities 18,951,970 17,927,438 17,386,504 Total Interest-bearing liabilities and noninterest-bearing deposits ("Cost of Funds") 18,558,840 0.95 17,596,102 0.73 17,049,229 0.55
Shareholders’ equity 2,306,070 2,255,764 2,193,863 Total Liabilities and Shareholders' Equity $ 21,258,040 $ 20,183,202 $ 19,580,367
Net interest income/net interest margin (FTE) 661,356 3.36% 642,577 3.40% 598,565 3.28%
Tax equivalent adjustment (12,967) (12,121) (23,201) Net interest income $ 648,389 $ 630,456 $ 575,364 (1) Includes dividends earned on equity securities.
(2) Average balances include non-performing loans and leases.
(3) Average balances include amortized historical cost for available for sale securities; the related unrealized holding gains (losses) are included in other assets.
39

The following table summarizes the changes in FTE interest income and interest expense resulting from changes in average balances (volumes) and changes inrates:
2019 vs. 2018 Increase (decrease) due to change
in 2018 vs. 2017 Increase (decrease) due to
change in Volume Rate Net Volume Rate Net (in thousands) Interest income on:
Loans and leases $ 27,465 $ 27,702 $ 55,167 $ 24,166 $ 46,985 $ 71,151Taxable investment securities 797 5,720 6,517 2,622 6,388 9,010Tax-exempt investment securities 2,744 (31) 2,713 395 (2,904) (2,509)Equity securities (5) — (5) (368) (127) (495)Loans held for sale 148 44 192 139 144 283Other interest-earning assets 1,117 1,939 3,056 (854) 1,981 1,127
Total interest income $ 32,266 $ 35,374 $ 67,640 $ 26,100 $ 52,467 $ 78,567Interest expense on:
Demand deposits $ 1,912 $ 8,647 $ 10,559 $ 842 $ 8,971 $ 9,813Savings deposits 2,055 12,542 14,597 683 13,066 13,749Brokered deposits 2,870 429 3,299 1,311 556 1,867Time deposits 2,740 12,868 15,608 (527) 5,018 4,491Short-term borrowings 735 5,319 6,054 1,746 3,964 5,710FHLB advances and long-term debt (1,126) (132) (1,258) (1,839) 764 (1,075)
Total interest expense $ 9,186 $ 39,673 $ 48,859 $ 2,216 $ 32,339 $ 34,555
Note: Changes which are partially attributable to both volume and rate are allocated to the volume and rate components presented above based on the percentage of the direct changes that are attributable toeach component.
Comparison of 2019 to 2018
The Federal Open Market Committee ("FOMC") increased the target federal funds rate ("Fed Funds Rate") by 25 basis points in each of March, June, Septemberand December of 2018. During 2019, the FOMC decreased the Fed Funds Rate by 25 basis points in each of August, September and October. These changes in theFed Funds Rate resulted in corresponding increases or decreases to the index rates for the Corporation's variable and adjustable rate loans, primarily the prime rateand the London Interbank Offered Rate ("LIBOR") as well as for certain interest-bearing liabilities.
FTE net interest income increased $18.8 million, or 2.9%, to $661.4 million in 2019. Net interest margin decreased 4 basis points to 3.36% in 2019 from 3.40% in2018. As summarized above, FTE interest income increased $35.4 million as the result of an 18 basis point increase in the yield on interest-earning assets, andincreased $32.3 million as the result of a $796.4 million, or 4.2%, increase in average interest-earning assets, primarily loans and leases. The average yield on theloan and lease portfolio increased 17 basis points, to 4.55%, largely due to the aforementioned increases in the Fed Funds Rate in 2018 and correspondingincreases to loan index rates. All variable and certain adjustable rate loans repriced to higher rates as a result of these interest rate increases, and yields on new loanoriginations exceeded the average yield on the loan portfolio. Adjustable rate loans reprice on dates specified in the loan agreements, which may be later than thedate the Fed Funds Rate and related loan index rates increase or decrease. Therefore, the benefit of increases or the reverse effect of decreases in index rates onadjustable rate loans may not be fully realized until future periods.
Interest expense increased $48.9 million, with a 28 basis point increase in the rate on average interest-bearing liabilities contributing $39.7 million to this increase.The rates on average interest-bearing time, savings accounts and demand deposits increased 45, 25 and 20 basis points, respectively. These rate increasescontributed $12.9 million, $12.5 million and $8.6 million, respectively, to the increase in interest expense. In addition, the 63 basis point increase in the rates onshort-term borrowings contributed $5.3 million to the increase in interest expense.
Assuming no further changes in the Fed Funds Rate, as a result of the interest rate decreases in the second half of 2019, yields on the loan portfolio are likely todecrease in the future. Deposit cost changes typically lag the changes in the loan yields as most deposit rates are not directly tied to an index.
40
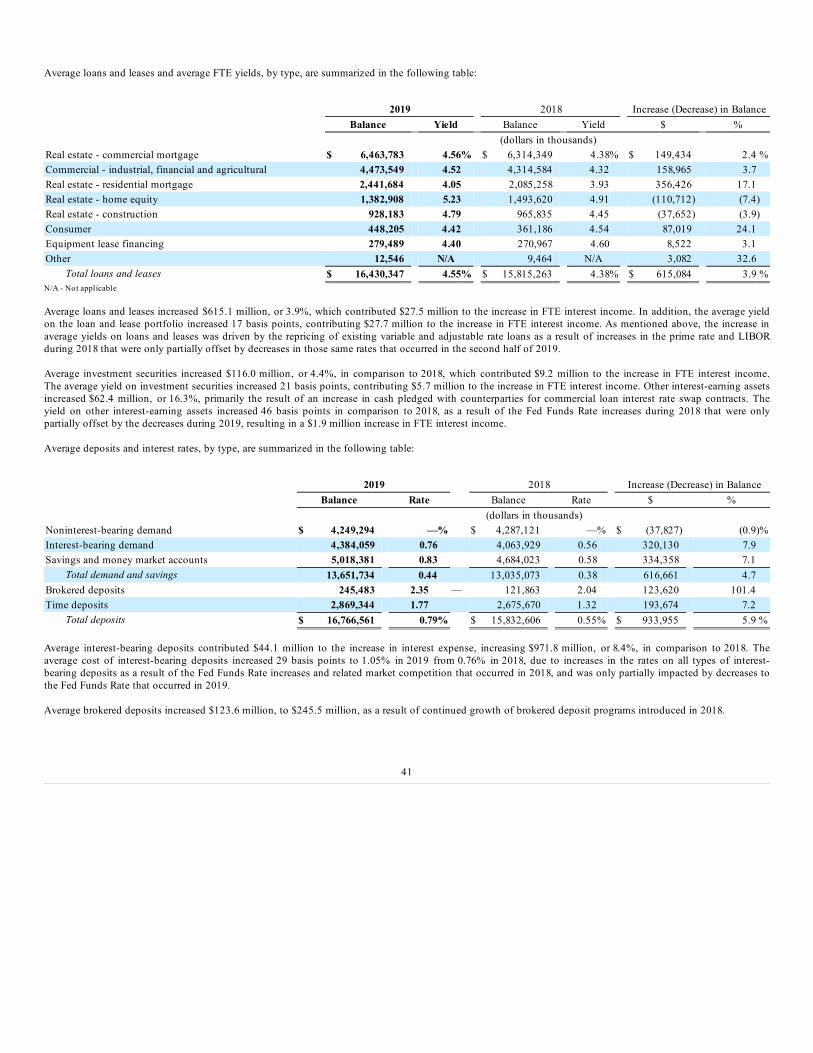
Average loans and leases and average FTE yields, by type, are summarized in the following table:
Increase (Decrease) in Balance 2019 2018
Balance Yield Balance Yield $ % (dollars in thousands)Real estate - commercial mortgage $ 6,463,783 4.56% $ 6,314,349 4.38% $ 149,434 2.4 %Commercial - industrial, financial and agricultural 4,473,549 4.52 4,314,584 4.32 158,965 3.7Real estate - residential mortgage 2,441,684 4.05 2,085,258 3.93 356,426 17.1Real estate - home equity 1,382,908 5.23 1,493,620 4.91 (110,712) (7.4)Real estate - construction 928,183 4.79 965,835 4.45 (37,652) (3.9)Consumer 448,205 4.42 361,186 4.54 87,019 24.1Equipment lease financing 279,489 4.40 270,967 4.60 8,522 3.1Other 12,546 N/A 9,464 N/A 3,082 32.6
Total loans and leases $ 16,430,347 4.55% $ 15,815,263 4.38% $ 615,084 3.9 %N/A - Not applicable
Average loans and leases increased $615.1 million, or 3.9%, which contributed $27.5 million to the increase in FTE interest income. In addition, the average yieldon the loan and lease portfolio increased 17 basis points, contributing $27.7 million to the increase in FTE interest income. As mentioned above, the increase inaverage yields on loans and leases was driven by the repricing of existing variable and adjustable rate loans as a result of increases in the prime rate and LIBORduring 2018 that were only partially offset by decreases in those same rates that occurred in the second half of 2019.
Average investment securities increased $116.0 million, or 4.4%, in comparison to 2018, which contributed $9.2 million to the increase in FTE interest income.The average yield on investment securities increased 21 basis points, contributing $5.7 million to the increase in FTE interest income. Other interest-earning assetsincreased $62.4 million, or 16.3%, primarily the result of an increase in cash pledged with counterparties for commercial loan interest rate swap contracts. Theyield on other interest-earning assets increased 46 basis points in comparison to 2018, as a result of the Fed Funds Rate increases during 2018 that were onlypartially offset by the decreases during 2019, resulting in a $1.9 million increase in FTE interest income.
Average deposits and interest rates, by type, are summarized in the following table:
Increase (Decrease) in Balance 2019 2018
Balance Rate Balance Rate $ % (dollars in thousands)Noninterest-bearing demand $ 4,249,294 —% $ 4,287,121 —% $ (37,827) (0.9)%Interest-bearing demand 4,384,059 0.76 4,063,929 0.56 320,130 7.9Savings and money market accounts 5,018,381 0.83 4,684,023 0.58 334,358 7.1
Total demand and savings 13,651,734 0.44 13,035,073 0.38 616,661 4.7Brokered deposits 245,483 2.35 — 121,863 2.04 123,620 101.4Time deposits 2,869,344 1.77 2,675,670 1.32 193,674 7.2
Total deposits $ 16,766,561 0.79% $ 15,832,606 0.55% $ 933,955 5.9 %
Average interest-bearing deposits contributed $44.1 million to the increase in interest expense, increasing $971.8 million, or 8.4%, in comparison to 2018. Theaverage cost of interest-bearing deposits increased 29 basis points to 1.05% in 2019 from 0.76% in 2018, due to increases in the rates on all types of interest-bearing deposits as a result of the Fed Funds Rate increases and related market competition that occurred in 2018, and was only partially impacted by decreases tothe Fed Funds Rate that occurred in 2019.
Average brokered deposits increased $123.6 million, to $245.5 million, as a result of continued growth of brokered deposit programs introduced in 2018.
41

Average borrowings and interest rates, by type, are summarized in the following table:
Increase (Decrease) in Balance 2019 2018
Balance Rate Balance Rate $ % (dollars in thousands)Short-term borrowings:
Total short-term customer funding (1) 355,983 0.77 446,668 0.48 (90,685) (20.3)%Federal funds purchased 132,578 2.20 229,715 1.70 (97,137) (42.3)Short-term FHLB advances and other borrowings (2) 361,118 2.43 109,540 2.20 251,578 229.7
Total short-term borrowings 849,679 1.70 785,923 1.07 63,756 8.1FHLB advances and other long-term debt:
FHLB advances 555,229 2.38 590,948 2.46 (35,719) (6.0)Other long-term debt 387,371 4.48 386,625 4.47 746 0.2
Total FHLB advances and other long-term debt 942,600 3.25 977,573 3.26 (34,973) (3.6)Total borrowings $ 1,792,279 2.51% $ 1,763,496 2.29% $ 28,783 1.6 %
(1) Includes repurchase agreements and short-term promissory notes.(2) Represents "FHLB" advances with an original maturity term of less than one year.
Total average borrowings increased $28.8 million, or 1.6%, while the total average cost of these funds increased 22 basis points, to 2.51%. Total average short-term borrowings increased $63.8 million, or 8.1%, due to an increase in short-term FHLB advances and other borrowings, partially offset by decreases in averageshort-term customer funding and federal funds purchased. The cost of average short-term borrowings increased 63 basis points to 1.70% in 2019, largely due tothe annual average impact of Fed Funds Rate increases.
Average FHLB advances decreased $35.7 million, or 6.0%, and the average rate decreased 8 basis points as higher rate advances were paid off or matured andreplaced with advances at lower average rates.
Comparison of 2018 to 2017
FTE net interest income increased $44.0 million, or 7.4%, to $642.6 million in 2018. Net interest margin increased 12 basis points to 3.40% in 2018 from 3.28% in2017. Interest rate increases on both interest-earning assets and interest-bearing liabilities and the corresponding increases in FTE interest income and interestexpense were largely the result of 25 basis point rate increases to the Fed Funds Rate in December of 2017 and March, June and September of 2018. The additional25 basis point increase to the Fed Funds Rate in December of 2018 did not have a significant impact on the Corporation's financial results for the year endedDecember 31, 2018. The increases in the Fed Funds Rate resulted in corresponding increases to the index rates for the Corporation's variable and adjustable rateloans, primarily the prime rate and LIBOR.
As summarized above, FTE interest income increased $52.5 million as the result of a 29 basis point increase in the yield on interest-earning assets, and increased$26.1 million as the result of a $628.1 million, or 3.4%, increase in average interest-earning assets, primarily loans. The average yield on the loan portfolioincreased 31 basis points, to 4.38%, largely due to the aforementioned increases in the Fed Funds Rate and corresponding increases to loan index rates. All variableand certain adjustable rate loans repriced to higher rates during 2018, and yields on new loan originations exceeded the average yield on the loan portfolio.Adjustable rate loans reprice on dates specified in the loan agreements, which may be later than the date the Fed Funds Rate and related loan index rates increase ordecrease. Therefore, the benefit of increases in index rates on adjustable rate loans may not be fully realized until future periods.
Interest expense increased $34.6 million, with a 22 basis point increase in the rate on average interest-bearing liabilities contributing $32.3 million to this increase.The rates on average interest-bearing demand deposits and savings accounts increased 22 basis points and 28 basis points, respectively. These rate increasescontributed $9.0 million and $13.1 million to the increase in interest expense, respectively. In addition, the 19 basis point and 55 basis point increases in the rateson time deposits and short-term borrowings contributed $5.0 million and $4.0 million, respectively, to the increase in interest expense.
42

Average loans and leases and average FTE yields, by type, are summarized in the following table:
Increase (Decrease) in Balance 2018 2017
Balance Yield Balance Yield $ % (dollars in thousands)Real estate - commercial mortgage $ 6,314,349 4.38% $ 6,161,731 4.04% $ 152,618 2.5 %Commercial - industrial, financial and agricultural 4,314,584 4.32 4,236,810 4.01 77,774 1.8Real estate - home equity 1,493,620 4.91 1,582,705 4.38 (89,085) (5.6)Real estate - residential mortgage 2,085,258 3.93 1,779,270 3.80 305,988 17.2Real estate - construction 965,835 4.45 921,879 4.08 43,956 4.8Consumer 361,186 4.54 304,162 4.99 57,024 18.7Equipment lease financing 270,967 4.60 244,740 4.45 26,227 10.7Other 9,464 N/A 5,315 N/A 4,149 78.1
Total loans and leases $ 15,815,263 4.38% $ 15,236,612 4.07% $ 578,651 3.8 %N/A - Not applicable
Average loans and leases increased $578.7 million, or 3.8%, which contributed $24.2 million to the increase in FTE interest income. In addition, the average yieldon the loan and lease portfolio increased 31 basis points, contributing $47.0 million to the increase in FTE interest income. As mentioned above, the increase inaverage yields on loans was driven by the repricing of existing variable and adjustable rate loans as a result of increases in the prime rate and LIBOR.
Average investment securities increased $114.9 million, or 4.5%, in comparison to 2017, which contributed $2.6 million to the increase in FTE interest income.The average yield on investment securities increased 12 basis points, contributing $3.4 million to the increase in FTE interest income. Other interest-earning assetsdecreased $68.4 million, or 15.2%, reflecting lower balances on deposit with the Federal Reserve Bank ("FRB"). The yield on other interest-earning assets increased50 basis points in comparison to 2017, as a result of the Fed Funds Rate increases, resulting in a $1.1 million increase in FTE interest income.
Average deposits and interest rates, by type, are summarized in the following table:
Increase (Decrease) in Balance 2018 2017
Balance Rate Balance Rate $ % (dollars in thousands)Noninterest-bearing demand $ 4,287,121 —% $ 4,410,301 —% $ (123,180) (2.8)%Interest-bearing demand 4,063,929 0.56 3,831,865 0.34 232,064 6.1Savings and money market accounts 4,684,023 0.58 4,468,205 0.30 215,818 4.8
Total demand and savings 13,035,073 0.38 12,710,371 0.12 324,702 2.6Brokered deposits 121,863 1.25 2.04 49 49,126 2.04 1.25 72,737 148.1Time deposits 2,675,670 1.32 2,721,724 1.13 (46,054) (1.7)
Total deposits $ 15,832,606 0.55% $ 15,481,221 0.37% $ 351,385 2.3 %
Average interest-bearing deposits contributed $29.9 million to the increase in interest expense, increasing $474.6 million, or 4.3%, in comparison to 2017. Theaverage cost of interest-bearing deposits increased 24 basis points, to 0.76%, in 2018 from 0.52% in 2017, due to increases in the rates on all types of interest-bearing deposits.
The $324.7 million, or 2.6%, increase in average total demand and savings account balances was primarily due to a $388.4 million, or 6.5%, increase in personalaccount balances, a $147.0 million increase in other account balances partially offset by decreases of $173.9 million, or 3.9%, and $36.8 million, or 1.9%, inbusiness account balances and state and municipal account balances, respectively.
Total average borrowings increased $195.5 million, or 12.5%, while the total average cost of these funds increased one basis point to 2.29%. The increase inaverage short-term borrowings reflects the need for additional funding to support average loan growth, which outpaced increases in average deposits.
43

Average borrowings and interest rates, by type, are summarized in the following table:
2018 2017 Increase in Balance Balance Rate Balance Rate $ % (dollars in thousands)Short-term borrowings:
Total short-term customer funding (1) 446,668 0.48 297,418 0.19 149,250 50.2 %Federal funds purchased 229,715 1.70 163,102 0.92 66,613 40.8Short-term FHLB advances (2) 109,540 2.20 73,044 0.94 36,496 50.0
Total short-term borrowings 785,923 1.07 533,564 0.52 252,359 47.3FHLB advances and other long-term debt:
FHLB Advances 590,948 2.46 640,737 2.31 (49,789) (7.8)Other long-term debt 386,625 4.47 393,707 4.61 (7,082) (1.8)
Total FHLB advances and other long-term debt 977,573 3.26 1,034,444 3.18 (56,871) (5.5)Total borrowings $ 1,763,496 2.29% $ 1,568,008 2.28% $ 195,488 12.5 %
(1) Includes repurchase agreements and short-term promissory notes.(2) Represents FHLB advances with an original maturity term of less than one year.
Total average short-term borrowings increased $252.4 million, or 47.3%, due to an increase in average customer short-term promissory notes, federal fundspurchased and short-term FHLB advances. The cost of average short-term borrowings increased 55 basis points, to 1.07%, in 2018, largely due to the Fed FundsRate increases.
Average FHLB advances and other long-term debt decreased $56.9 million due mainly to the $49.8 million decrease in FHLB advances. The average rate on FHLBadvances and other long-term debt increased 8 basis points, the net result of a 15 basis point increase on the rate of the FHLB advances, largely due to the FedFunds Rate increases, and a 14 basis point decrease in other long-term debt.
Provision for Credit Losses
The provision for credit losses decreased $14.1 million, to $32.8 million, for the year ended December 31, 2019. During 2018, the Corporation recorded a $36.8million provision related to fraud committed by the Commercial Relationship. In 2019, the Corporation recorded a $20.0 million provision for a certain commercialborrower. See additional details under "Provision and Allowance for Credit Losses" in the "Financial Condition" section below.
The provision for credit losses is recognized as an expense in the consolidated statements of income and is the amount necessary to adjust the allowance for creditlosses to its appropriate balance, as determined through the Corporation's allowance methodology. The Corporation determines the appropriate level of theallowance for credit losses based on many quantitative and qualitative factors, including, but not limited to: the size and composition of the loan and leaseportfolio, changes in risk ratings, changes in collateral values, delinquency levels, historical losses and economic conditions. See further discussion of theCorporation's allowance methodology under the heading "Critical Accounting Policies" above. For details related to the Corporation's allowance and provision forcredit losses, see "Provision and Allowance for Credit Losses," under "Financial Condition" below.
44

Non-Interest Income and ExpenseComparison of 2019 to 2018Non-Interest IncomeThe following table presents the components of non-interest income:
Increase (Decrease) 2019 2018 $ % (dollars in thousands)Wealth management $ 55,678 $ 52,148 $ 3,530 6.8 %Commercial banking:
Merchant and card 24,077 23,427 650 2.8Cash management 18,392 17,581 811 4.6Commercial loan interest rate swap 14,875 9,831 5,044 51.3Other 13,773 13,090 683 5.2
Total commercial banking 71,117 63,929 7,188 11.2Consumer banking:
Card 20,515 19,497 1,018 5.2Overdraft 17,949 17,606 343 2.0Other 11,039 11,319 (280) (2.5)
Total consumer banking 49,503 48,422 1,081 2.2Mortgage banking:
Gain on sales of mortgage loans 17,881 13,021 4,860 37.3Mortgage servicing 5,218 6,005 (787) (13.1)
Total mortgage banking 23,099 19,026 4,073 21.4Other 12,030 11,963 67 0.6
Total, excluding net investment securities gains 211,427 195,488 15,939 8.2Investment securities gains, net 4,733 37 4,696 N/M
Total non-interest income $ 216,160 $ 195,525 $ 20,635 10.6 %
N/M - Not meaningful
Excluding net investment securities gains, non-interest income increased $15.9 million, or 8.2%, for the year ended December 31, 2019, as compared to the sameperiod in 2018, with increases across all major categories
Wealth management fees increased $3.5 million, or 6.8%, resulting primarily from growth in brokerage income due to an increase in client asset levels andimproved overall market performance, as well as the acquisitions of two small wealth management firms in 2019.
Total commercial banking income increased $7.2 million, or 11.2%, compared to 2018, driven mainly by an increase in commercial loan interest rate swap feesalong with increases in merchant and card income and cash management fees.
Total consumer banking increased $1.1 million, or 2.2%, compared to 2018, driven primarily by card income.
Mortgage banking income increased $4.1 million, or 21.4%, mainly due to gains on sales of mortgage loans. The increase in gains resulted from both highervolumes of loans sold and higher spreads on sales.
Investment securities gains increased $4.7 million compared to 2018 mainly attributed to the sale of approximately $400 million of investment securities and acorresponding prepayment of FHLB advances. This balance sheet restructuring occurred in the third quarter of 2019. See Note 3, "Investment Securities," in theNotes to Consolidated Financial Statements for additional details.
45

Non-Interest Expense
The following table presents the components of non-interest expense:
Increase (Decrease) 2019 2018 $ % (dollars in thousands)Salaries and employee benefits $ 311,934 $ 303,202 $ 8,732 2.9 %Net occupancy 52,826 51,678 1,148 2.2Data processing and software 44,679 41,286 3,393 8.2Other outside services 39,989 33,758 6,231 18.5Equipment 13,575 13,243 332 2.5Professional fees 13,134 14,161 (1,027) (7.3)Marketing 9,848 8,854 994 11.2State taxes 8,894 9,590 (696) (7.3)FDIC insurance 7,780 10,993 (3,213) (29.2)Amortization of tax credit investments 6,021 11,449 (5,428) (47.4)Prepayment penalty on FHLB advances 4,326 — 4,326 N/MIntangible amortization 1,427 — 1,427 N/MOther 53,303 47,890 5,413 11.3
Total $ 567,736 $ 546,104 $ 21,632 4.0 % N/M - Not meaningful
In 2019, $10.9 million of expenses were incurred related to Charter Consolidation, as compared to $3.6 million in 2018, a $7.3 million increase. The 2019 expenseswere primarily in salaries and benefits ($1.9 million of severance expense), other outside services ($6.6 million), intangible amortization ($1.0 million write-off) andadvertising ($650,000).
The following provides explanations for the more significant fluctuations in expense levels, excluding charter consolidation costs, by category:
• Salaries and employee benefits increased $6.8 million (excluding charter consolidation costs) mainly due to an increase in employee salaries (annual meritincreases). Healthcare and 401(k) plan matching expense also increased, but were partially offset by lower defined benefit pension expense driven bychanges in the discount rate compared to 2018.
• Net occupancy expense increased $1.1 million, or 2.2%, due mainly to the addition of new properties.
• Data processing and software increased $3.4 million, or 8.2%, reflecting higher transaction volumes and costs related to growth and technology initiatives.
• Marketing increased $1.0 million, or 11.2%, due to additional promotions, primarily related to deposits.
• FDIC insurance expense decreased $3.2 million, or 29.2%, due to the recognition of assessment credits in 2019.
• Amortization of tax credit investments decreased $5.4 million as 2018 included amortization for one significant investment which generated acorresponding credit to income taxes.
• 2019 includes approximately $4.3 million of penalties related to the prepayment of certain FHLB advances in conjunction with the previously mentionedbalance sheet restructuring.
• Other expenses increased $5.4 million due to losses on sale of fixed assets, telecommunications expense and operating risk losses.
46

Comparison of 2018 to 2017
Non-Interest IncomeThe following table presents the components of non-interest income:
Increase (Decrease) 2018 2017 $ % (dollars in thousands)Wealth management $ 52,148 $ 49,249 $ 2,899 5.9 %Commercial banking:
Merchant and card 23,427 21,191 2,236 10.6Cash management 17,581 14,444 3,137 21.7Commercial loan interest rate swap 9,831 11,694 (1,863) (15.9)Other 13,090 18,400 (5,310) (28.9)
Total commercial banking 63,929 65,729 (1,800) (2.7)Consumer banking:
Card 19,497 18,479 1,018 5.5Overdraft 17,606 18,717 (1,111) (5.9)Other 11,319 11,723 (404) (3.4)
Total consumer banking 48,422 48,919 (497) (1.0)Mortgage banking:
Gain on sales of mortgage loans 13,021 13,036 (15) (0.1)Mortgage servicing 6,005 6,892 (887) (12.9)
Total mortgage banking 19,026 19,928 (902) (4.5)Other 11,963 15,078 (3,115) (20.7)
Total, excluding net investment securities gains 195,488 198,903 (3,415) (1.7)Investment securities gains, net 37 9,071 (9,034) N/M
Total non-interest income $ 195,525 $ 207,974 $ (12,449) (6.0)%
N/M - Not meaningful
Excluding investment securities gains, non-interest income decreased $3.4 million, or 1.7%, for the year ended December 31, 2018, as compared to the sameperiod in 2017.
Wealth management fees increased $2.9 million, or 5.9%, with growth in both trust commissions and brokerage income, due to overall market performance andcontinued focus on asset gathering.
Total commercial banking income decreased $1.8 million, or 2.7%, primarily due to decreases in commercial loan interest rate swaps, resulting from lower newcommercial loan originations in 2018, and other commercial banking income being partially offset by increases in merchant and card income and cashmanagement fees.
Total commercial banking income decreased $497,000, or 1.0%, primarily due to decreases in overdraft fees, which were partially offset by an increase in cardincome.
Mortgage servicing income decreased $887,000, or 12.9%, due to the inclusion in 2017 of a $1.3 million reduction to the MSR valuation allowance, recorded as anincrease to mortgage servicing income.
Other income decreased $3.1 million, or 20.7%, as 2017 included a $5.1 million litigation settlement gain.
Investment securities gains decreased $9.0 million, as 2017 included gains on sales of financial institution common stocks.
47
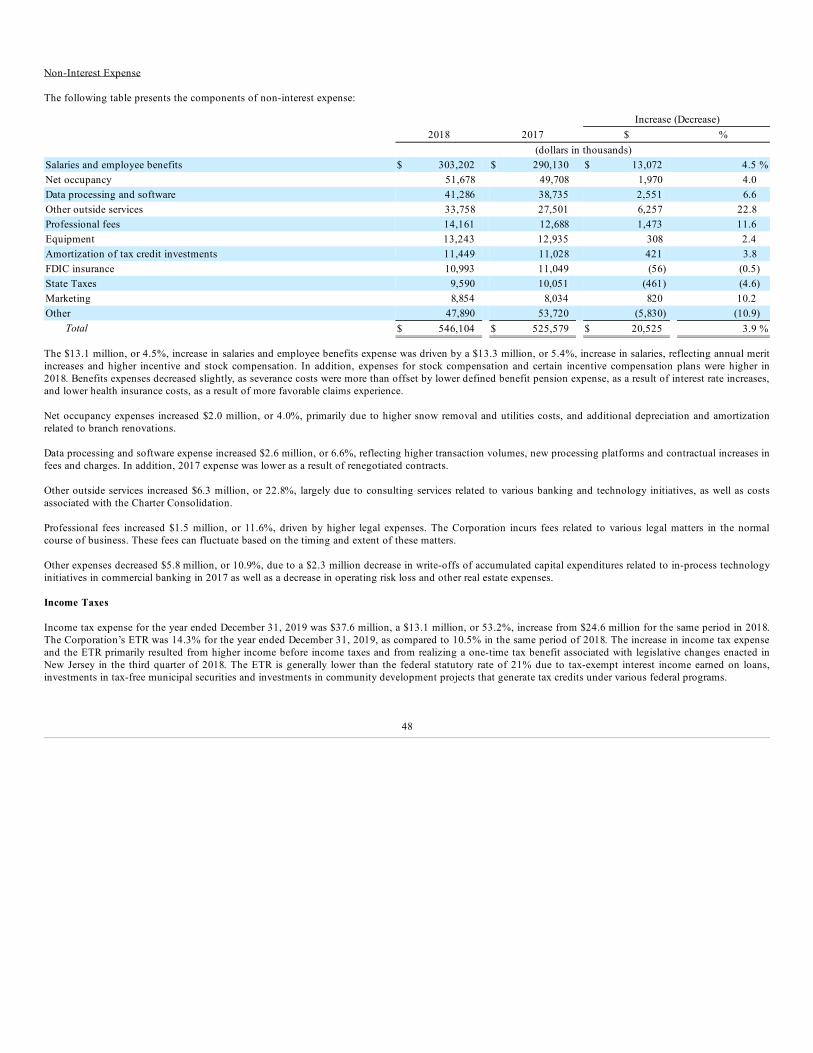
Non-Interest Expense
The following table presents the components of non-interest expense:
Increase (Decrease) 2018 2017 $ % (dollars in thousands)Salaries and employee benefits $ 303,202 $ 290,130 $ 13,072 4.5 %Net occupancy 51,678 49,708 1,970 4.0Data processing and software 41,286 38,735 2,551 6.6Other outside services 33,758 27,501 6,257 22.8Professional fees 14,161 12,688 1,473 11.6Equipment 13,243 12,935 308 2.4Amortization of tax credit investments 11,449 11,028 421 3.8FDIC insurance 10,993 11,049 (56) (0.5)State Taxes 9,590 10,051 (461) (4.6)Marketing 8,854 8,034 820 10.2Other 47,890 53,720 (5,830) (10.9)
Total $ 546,104 $ 525,579 $ 20,525 3.9 %
The $13.1 million, or 4.5%, increase in salaries and employee benefits expense was driven by a $13.3 million, or 5.4%, increase in salaries, reflecting annual meritincreases and higher incentive and stock compensation. In addition, expenses for stock compensation and certain incentive compensation plans were higher in2018. Benefits expenses decreased slightly, as severance costs were more than offset by lower defined benefit pension expense, as a result of interest rate increases,and lower health insurance costs, as a result of more favorable claims experience.
Net occupancy expenses increased $2.0 million, or 4.0%, primarily due to higher snow removal and utilities costs, and additional depreciation and amortizationrelated to branch renovations.
Data processing and software expense increased $2.6 million, or 6.6%, reflecting higher transaction volumes, new processing platforms and contractual increases infees and charges. In addition, 2017 expense was lower as a result of renegotiated contracts.
Other outside services increased $6.3 million, or 22.8%, largely due to consulting services related to various banking and technology initiatives, as well as costsassociated with the Charter Consolidation.
Professional fees increased $1.5 million, or 11.6%, driven by higher legal expenses. The Corporation incurs fees related to various legal matters in the normalcourse of business. These fees can fluctuate based on the timing and extent of these matters.
Other expenses decreased $5.8 million, or 10.9%, due to a $2.3 million decrease in write-offs of accumulated capital expenditures related to in-process technologyinitiatives in commercial banking in 2017 as well as a decrease in operating risk loss and other real estate expenses.
Income Taxes
Income tax expense for the year ended December 31, 2019 was $37.6 million, a $13.1 million, or 53.2%, increase from $24.6 million for the same period in 2018.The Corporation’s ETR was 14.3% for the year ended December 31, 2019, as compared to 10.5% in the same period of 2018. The increase in income tax expenseand the ETR primarily resulted from higher income before income taxes and from realizing a one-time tax benefit associated with legislative changes enacted inNew Jersey in the third quarter of 2018. The ETR is generally lower than the federal statutory rate of 21% due to tax-exempt interest income earned on loans,investments in tax-free municipal securities and investments in community development projects that generate tax credits under various federal programs.
48

FINANCIAL CONDITION
The table below presents condensed consolidated ending balance sheets.
December 31, Increase (Decrease) 2019 2018 $ % (dollars in thousands)Assets
Cash and cash equivalents $ 517,791 $ 445,687 $ 72,104 16.2 %FRB and FHLB stock 97,422 79,283 18,139 22.9Loans held for sale 37,828 27,099 10,729 39.6Investment securities 2,867,378 2,686,973 180,405 6.7Loans and leases, net of allowance 16,673,904 16,005,263 668,641 4.2Premises and equipment 240,046 234,529 5,517 2.4Goodwill and intangibles 535,303 531,556 3,747 0.7Other assets 916,368 671,762 244,606 36.4
Total Assets $ 21,886,040 $ 20,682,152 $ 1,203,888 5.8 %Liabilities and Shareholders’ Equity
Deposits $ 17,393,913 $ 16,376,159 $ 1,017,754 6.2 %Short-term borrowings 883,241 754,777 128,464 17.0FHLB advances and long-term debt 881,769 992,279 (110,510) (11.1)Other liabilities 384,941 311,364 73,577 23.6
Total Liabilities 19,543,864 18,434,579 1,109,285 6.0 Total Shareholders’ Equity 2,342,176 2,247,573 94,603 4.2
Total Liabilities and Shareholders’ Equity $ 21,886,040 $ 20,682,152 $ 1,203,888 5.8 %
Cash and Cash Equivalents
Th e $72.1 million, or 16.2%, increase in cash and cash equivalents mainly resulted from additional collateral required to be posted with counterparties forderivative contracts.
FRB and FHLB Stock
FRB and FHLB stock increased $18.1 million, or 22.9%, due to a $19.6 million increase in FRB stock partially offset by a $1.5 million decrease in FHLB stock.Additional FRB stock was required to be purchased as a result of the Charter Consolidation.
49
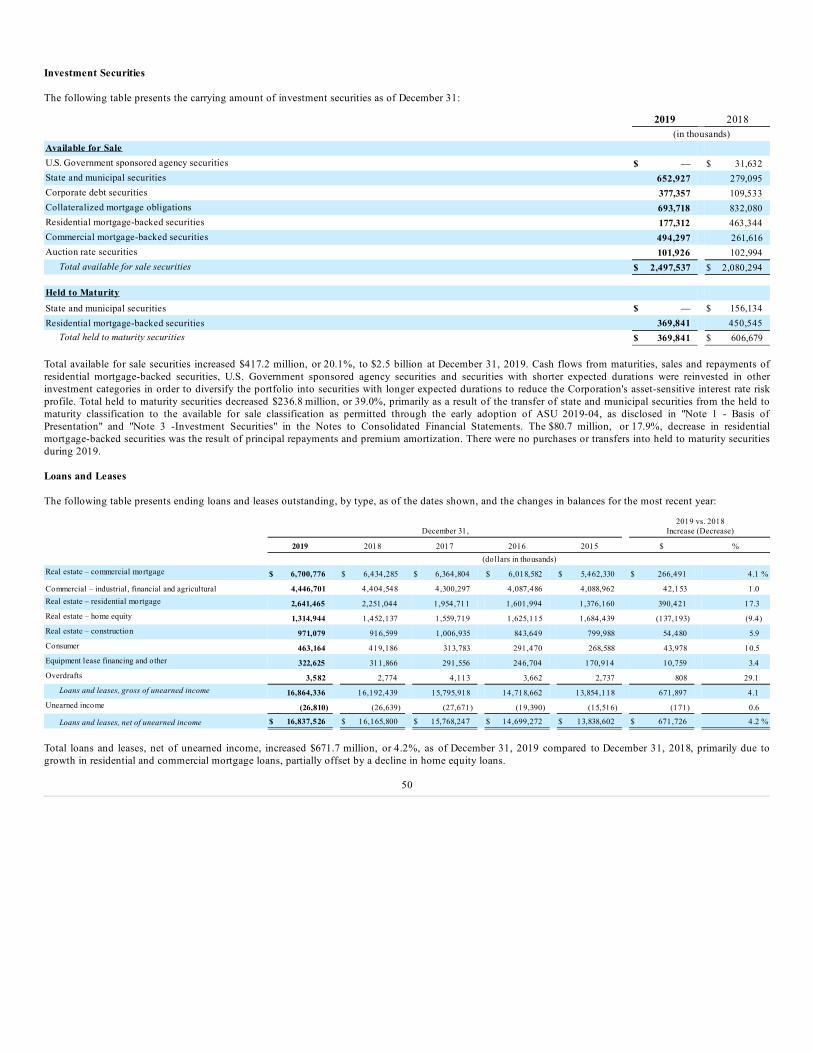
Investment Securities
The following table presents the carrying amount of investment securities as of December 31:
2019 2018 (in thousands)Available for Sale U.S. Government sponsored agency securities $ — $ 31,632State and municipal securities 652,927 279,095Corporate debt securities 377,357 109,533Collateralized mortgage obligations 693,718 832,080Residential mortgage-backed securities 177,312 463,344Commercial mortgage-backed securities 494,297 261,616Auction rate securities 101,926 102,994
Total available for sale securities $ 2,497,537 $ 2,080,294 Held to Maturity State and municipal securities $ — $ 156,134Residential mortgage-backed securities 369,841 450,545
Total held to maturity securities $ 369,841 $ 606,679
Total available for sale securities increased $417.2 million, or 20.1%, to $2.5 billion at December 31, 2019. Cash flows from maturities, sales and repayments ofresidential mortgage-backed securities, U.S. Government sponsored agency securities and securities with shorter expected durations were reinvested in otherinvestment categories in order to diversify the portfolio into securities with longer expected durations to reduce the Corporation's asset-sensitive interest rate riskprofile. Total held to maturity securities decreased $236.8 million, or 39.0%, primarily as a result of the transfer of state and municipal securities from the held tomaturity classification to the available for sale classification as permitted through the early adoption of ASU 2019-04, as disclosed in "Note 1 - Basis ofPresentation" and "Note 3 -Investment Securities" in the Notes to Consolidated Financial Statements. The $80.7 million, or 17.9%, decrease in residentialmortgage-backed securities was the result of principal repayments and premium amortization. There were no purchases or transfers into held to maturity securitiesduring 2019.
Loans and Leases
The following table presents ending loans and leases outstanding, by type, as of the dates shown, and the changes in balances for the most recent year:
December 31, 2019 vs. 2018
Increase (Decrease)
2019 2018 2017 2016 2015 $ % (dollars in thousands)Real estate – commercial mortgage $ 6,700,776 $ 6,434,285 $ 6,364,804 $ 6,018,582 $ 5,462,330 $ 266,491 4.1 %
Commercial – industrial, financial and agricultural 4,446,701 4,404,548 4,300,297 4,087,486 4,088,962 42,153 1.0Real estate – residential mortgage 2,641,465 2,251,044 1,954,711 1,601,994 1,376,160 390,421 17.3Real estate – home equity 1,314,944 1,452,137 1,559,719 1,625,115 1,684,439 (137,193) (9.4)Real estate – construction 971,079 916,599 1,006,935 843,649 799,988 54,480 5.9Consumer 463,164 419,186 313,783 291,470 268,588 43,978 10.5Equipment lease financing and other 322,625 311,866 291,556 246,704 170,914 10,759 3.4Overdrafts 3,582 2,774 4,113 3,662 2,737 808 29.1
Loans and leases, gross of unearned income 16,864,336 16,192,439 15,795,918 14,718,662 13,854,118 671,897 4.1Unearned income (26,810) (26,639) (27,671) (19,390) (15,516) (171) 0.6
Loans and leases, net of unearned income $ 16,837,526 $ 16,165,800 $ 15,768,247 $ 14,699,272 $ 13,838,602 $ 671,726 4.2 %
Total loans and leases, net of unearned income, increased $671.7 million, or 4.2%, as of December 31, 2019 compared to December 31, 2018, primarily due togrowth in residential and commercial mortgage loans, partially offset by a decline in home equity loans.
50

The Corporation does not have a significant concentration of credit risk with any single borrower, industry or geographic location within its footprint. As ofDecember 31, 2019, approximately $7.7 billion, or 45.6%, of the loan and lease portfolio was comprised of commercial mortgage and construction loans. TheCorporation's policies limit the maximum total lending commitment to an individual borrower to $55.0 million as of December 31, 2019. In addition, theCorporation has established lower total lending limits for certain types of lending commitments, and lower total lending limits based on the Corporation's internalrisk rating of an individual borrower at the time the lending commitment is approved. As of December 31, 2019, the Corporation had 172 relationships with totalborrowing commitments between $20.0 million and $55.0 million.
The following table summarizes the industry concentrations within the commercial mortgage and the commercial-industrial, financial and agricultural loanportfolios as of December 31:
2019 2018Real estate (1) 41.4% 35.9%Health care 8.1 7.8Agriculture 7.1 7.3Construction (2) 6.2 5.7Manufacturing 6.0 5.5Other services (except public administration) 4.7 4.5Retail 4.2 4.6Educational services 4.1 4.6Accommodation and food services 4.1 3.7Wholesale trade 3.6 3.5Professional, scientific, and technical services 2.9 2.8Arts, entertainment, and recreation 2.2 2.3Public administration 2.0 2.3Transportation and warehousing 1.2 1.3Other 2.2 8.2
Total 100.0% 100.0%(1) Includes commercial loans to borrowers engaged in the business of: renting, leasing or managing real estate for others; selling and/or buying real estate for others; and appraising real estate.(2) Includes commercial loans to borrowers engaged in the construction industry.
Commercial loans and commercial mortgage loans also include shared national credits, which are participations in loans or loan commitments of at least $100million that are shared by three or more banks. The Corporation only participates in shared national credits to borrowers located in its geographic markets andthese are subject to the Corporation's standard underwriting policies. As of December 31, 2019, commercial loan shared national credits increased $4.6 million, or6.8%, in comparison to 2018, to $72.1 million. As of December 31, 2019 and 2018 none of the shared national credits were past due.
51

Provision and Allowance for Credit Losses
The Corporation accounts for the credit risk associated with lending activities through the allowance for credit losses and the provision for credit losses.
A summary of the Corporation’s credit loss experience follows:
2019 2018 2017 2016 2015 (dollars in thousands)
Loans and leases, net of unearned income outstanding at end of year $ 16,837,526 $ 16,165,800 $ 15,768,247 $ 14,699,272 $ 13,838,602
Average balance of loans and leases, net of unearned income $ 16,430,347 $ 15,815,263 $ 15,236,612 $ 14,128,064 $ 13,330,973
Balance of allowance for credit losses at beginning of year $ 169,410 $ 176,084 $ 171,325 $ 171,412 $ 185,931
Loans and leases charged off: Commercial – industrial, financial and agricultural 42,410 52,441 19,067 15,276 15,639
Real estate - home equity and consumer 4,694 6,127 4,567 7,712 5,831
Equipment lease financing and other 2,560 2,521 3,035 3,815 2,656
Real estate – commercial mortgage 1,837 2,045 2,169 3,580 4,218
Real estate – residential mortgage 1,545 1,574 687 2,326 3,612
Real estate – construction 143 1,368 3,765 1,218 201
Total charged off 53,189 66,076 33,290 33,927 32,157
Recoveries of loans and leases previously charged off: Commercial – industrial, financial and agricultural 8,721 4,994 7,771 8,981 5,264
Real estate - home equity and consumer 1,994 2,393 1,969 2,466 2,492
Real estate – construction 2,591 1,829 1,582 3,924 2,824
Real estate – commercial mortgage 2,202 1,622 1,668 3,373 2,801
Equipment lease financing and other 666 1,037 968 842 685
Real estate – residential mortgage 989 620 786 1,072 1,322
Total recoveries 17,163 12,495 14,744 20,658 15,388
Net loans and leases charged off 36,026 53,581 18,546 13,269 16,769
Provision for credit losses 32,825 46,907 23,305 13,182 2,250
Balance at end of year $ 166,209 $ 169,410 $ 176,084 $ 171,325 $ 171,412
Components of Allowance for Credit Losses: Allowance for loan and lease losses $ 163,622 $ 160,537 $ 169,910 $ 168,679 $ 169,054
Reserve for unfunded lending commitments (1) 2,587 8,873 6,174 2,646 2,358
Allowance for credit losses $ 166,209 $ 169,410 $ 176,084 $ 171,325 $ 171,412
Selected Asset Quality Ratios: Net charge-offs to average loans and leases 0.22% 0.34% 0.12% 0.09% 0.13%
Allowance for loan losses to total loans and leases 0.97% 0.99% 1.08% 1.15% 1.22%
Allowance for credit losses to total loans and leases 0.99% 1.05% 1.12% 1.17% 1.24%
Non-performing assets (2) to total assets 0.68% 0.73% 0.72% 0.76% 0.87%
Non-performing assets (2) to total loans and leases and OREO 0.88% 0.93% 0.92% 0.98% 1.13%
Non-accrual loans to total loans and leases 0.74% 0.80% 0.79% 0.82% 0.94%
Allowance for credit losses to non-performing loans and leases 117.75% 121.29% 130.67% 130.15% 118.37%Non-performing assets (2) to tangible shareholders' equity and allowance for credit losses (3)
("Texas Ratio") 7.50% 7.97% 7.71% 8.20% 9.27%
(1) Reserve for unfunded lending commitments is recorded within other liabilities on the consolidated balance sheets.(2) Includes accruing loans and leases past due 90 days or more.(3) Ratio represents a financial measure derived by methods other than Generally Accepted Accounting Principles ("GAAP"). See reconciliation of this non-GAAP financial measure to the most directly
comparable GAAP measure under the heading, "Supplemental Reporting of Non-GAAP Based Financial Measures," in Item 6. "Selected Financial Data."
The provision for credit losses decreased $14.1 million in comparison to 2018. In 2019, the Corporation recorded a $20.0 million provision for a certaincommercial borrower, which was subsequently charged off in 2019. In 2018, the Corporation recorded a provision of $36.8 million for a credit loss related to theCommercial Relationship and recorded a $33.9 million charge-off.
52
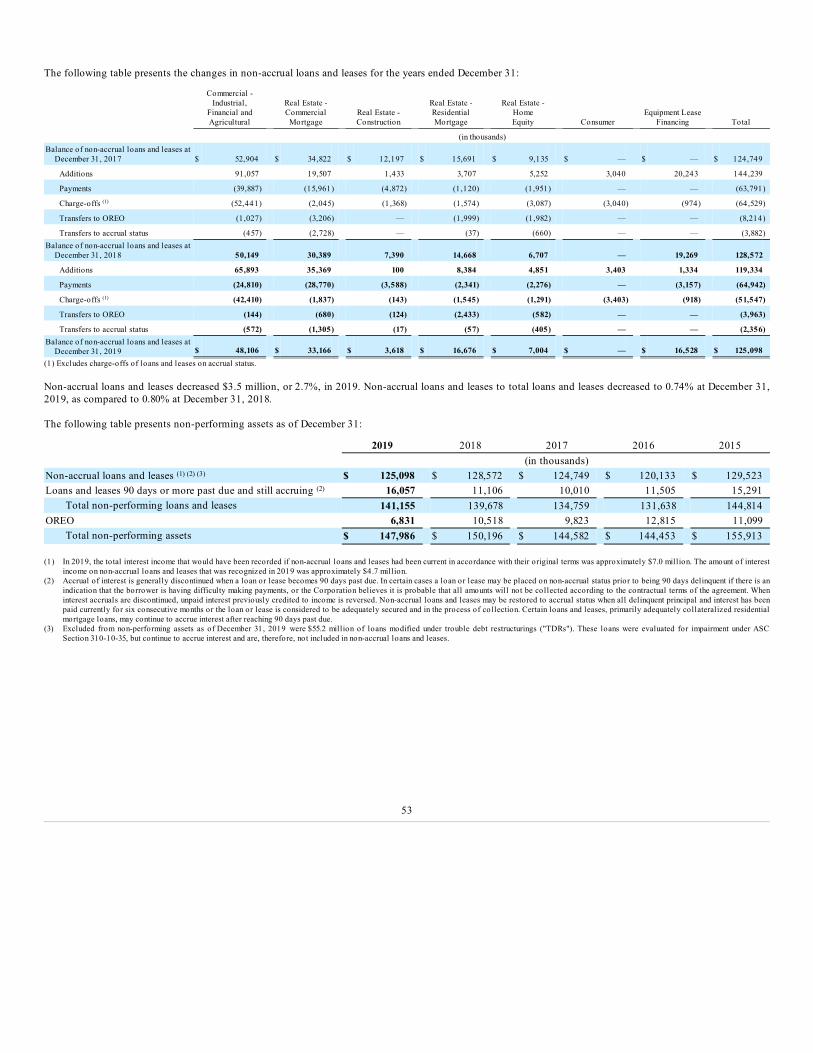
The following table presents the changes in non-accrual loans and leases for the years ended December 31:
Commercial -Industrial,
Financial andAgricultural
Real Estate -Commercial
Mortgage Real Estate -Construction
Real Estate -ResidentialMortgage
Real Estate -HomeEquity Consumer
Equipment LeaseFinancing Total
(in thousands)Balance of non-accrual loans and leases at
December 31, 2017 $ 52,904 $ 34,822 $ 12,197 $ 15,691 $ 9,135 $ — $ — $ 124,749
Additions 91,057 19,507 1,433 3,707 5,252 3,040 20,243 144,239
Payments (39,887) (15,961) (4,872) (1,120) (1,951) — — (63,791)
Charge-offs (1) (52,441) (2,045) (1,368) (1,574) (3,087) (3,040) (974) (64,529)
Transfers to OREO (1,027) (3,206) — (1,999) (1,982) — — (8,214)
Transfers to accrual status (457) (2,728) — (37) (660) — — (3,882)Balance of non-accrual loans and leases at
December 31, 2018 50,149 30,389 7,390 14,668 6,707 — 19,269 128,572
Additions 65,893 35,369 100 8,384 4,851 3,403 1,334 119,334
Payments (24,810) (28,770) (3,588) (2,341) (2,276) — (3,157) (64,942)
Charge-offs (1) (42,410) (1,837) (143) (1,545) (1,291) (3,403) (918) (51,547)
Transfers to OREO (144) (680) (124) (2,433) (582) — — (3,963)
Transfers to accrual status (572) (1,305) (17) (57) (405) — — (2,356)Balance of non-accrual loans and leases at
December 31, 2019 $ 48,106 $ 33,166 $ 3,618 $ 16,676 $ 7,004 $ — $ 16,528 $ 125,098(1) Excludes charge-offs of loans and leases on accrual status.
Non-accrual loans and leases decreased $3.5 million, or 2.7%, in 2019. Non-accrual loans and leases to total loans and leases decreased to 0.74% at December 31,2019, as compared to 0.80% at December 31, 2018.
The following table presents non-performing assets as of December 31:
2019 2018 2017 2016 2015 (in thousands)Non-accrual loans and leases (1) (2) (3) $ 125,098 $ 128,572 $ 124,749 $ 120,133 $ 129,523Loans and leases 90 days or more past due and still accruing (2) 16,057 11,106 10,010 11,505 15,291
Total non-performing loans and leases 141,155 139,678 134,759 131,638 144,814OREO 6,831 10,518 9,823 12,815 11,099
Total non-performing assets $ 147,986 $ 150,196 $ 144,582 $ 144,453 $ 155,913 (1) In 2019, the total interest income that would have been recorded if non-accrual loans and leases had been current in accordance with their original terms was approximately $7.0 million. The amount of interest
income on non-accrual loans and leases that was recognized in 2019 was approximately $4.7 million.(2) Accrual of interest is generally discontinued when a loan or lease becomes 90 days past due. In certain cases a loan or lease may be placed on non-accrual status prior to being 90 days delinquent if there is an
indication that the borrower is having difficulty making payments, or the Corporation believes it is probable that all amounts will not be collected according to the contractual terms of the agreement. Wheninterest accruals are discontinued, unpaid interest previously credited to income is reversed. Non-accrual loans and leases may be restored to accrual status when all delinquent principal and interest has beenpaid currently for six consecutive months or the loan or lease is considered to be adequately secured and in the process of collection. Certain loans and leases, primarily adequately collateralized residentialmortgage loans, may continue to accrue interest after reaching 90 days past due.
(3) Excluded from non-performing assets as of December 31, 2019 were $55.2 million of loans modified under trouble debt restructurings ("TDRs"). These loans were evaluated for impairment under ASCSection 310-10-35, but continue to accrue interest and are, therefore, not included in non-accrual loans and leases.
53

The following table presents non-performing loans and leases, by type, as of the dates shown, and the changes in non-performing loans and leases for the mostrecent year:
December 31, 2019 vs. 2018 Increase
(Decrease) 2019 2018 2017 2016 2015 $ % (dollars in thousands)Commercial – industrial, financial and agricultural $ 49,491 $ 51,269 $ 54,309 $ 43,460 $ 44,071 $ (1,778) (3.5)%Real estate – commercial mortgage 37,279 32,153 35,447 39,319 41,170 5,126 15.9Real estate – residential mortgage 22,411 19,101 20,971 23,655 28,484 3,310 17.3Real estate – home equity 10,568 9,769 11,507 13,154 14,683 799 8.2Real estate – construction 4,306 7,390 12,197 9,842 12,460 (3,084) (41.7)Consumer 458 409 296 1,891 2,440 49 12.0Equipment lease financing 16,642 19,587 32 317 1,506 (2,945) (15.0)
Total non-performing loans and leases $ 141,155 $ 139,678 $ 134,759 $ 131,638 $ 144,814 $ 1,477 1.1 %
Non-performing loans and leases increased $1.5 million, or 1.1%, in comparison to December 31, 2018. As a percentage of total loans, non-performing loans andleases were 0.84% at December 31, 2019, a decrease from 0.86% at December 31, 2018.
The following table presents TDRs as of December 31:
2019 2018 2017 2016 2015 (in thousands)Real estate – residential mortgage $ 21,551 $ 24,102 $ 26,016 $ 27,617 $ 28,511Real estate – home equity 15,068 16,665 15,558 8,594 4,556Real estate – commercial mortgage 13,330 15,685 13,959 15,957 17,563Commercial – industrial, financial and agricultural 5,193 5,143 10,820 6,627 5,953Consumer 8 10 26 39 33Real estate – construction — — — 726 3,942
Total accruing TDRs 55,150 61,605 66,379 59,560 60,558Non-accrual TDRs (1) 20,825 28,659 29,051 27,850 31,035
Total TDRs $ 75,975 $ 90,264 $ 95,430 $ 87,410 $ 91,593(1) Included within non-accrual loans in the preceding table.
Total TDRs modified during 2019 and still outstanding as of December 31, 2019 were $10.6 million. Of these loans, $2.0 million, or 18.5%, had a payment defaultduring 2019, which the Corporation defines as a single missed scheduled payment, subsequent to modification. TDRs modified during 2018 and still outstandingas of December 31, 2018 totaled $18.4 million. Of these loans, $5.0 million, or 27.0%, had a payment default subsequent to modification during 2018.
The following table summarizes OREO, by property type, as of December 31:
2019 2018 (in thousands)Residential properties $ 3,078 $ 3,665Commercial properties 2,058 4,127Undeveloped land 1,695 2,726
Total OREO $ 6,831 $ 10,518
As noted under the heading "Critical Accounting Policies" within Management's Discussion, the Corporation's ability to identify potential problem loans and leasesin a timely manner is key to maintaining an adequate allowance for credit losses. For commercial loans, commercial mortgages and construction loans tocommercial borrowers, an internal risk rating process is used to monitor credit quality. For a complete description of the Corporation's risk ratings, refer to the"Allowance for Credit Losses" section within "Note 1 - Summary of Significant Accounting Policies," in the Notes to Consolidated Financial Statements in Item 8."Financial Statements and Supplementary Data." The evaluation of credit risk for residential mortgages, home equity loans, construction
54

loans to individuals, consumer loans and equipment lease financing is based on aggregate payment history, through the monitoring of delinquency levels andtrends.
Total internally risk rated loans were $12.0 billion and $11.7 billion as of December 31, 2019 and 2018, respectively. The following table presents criticized loans,or those with internal risk ratings of special mention or lower for commercial loans, commercial mortgages and construction loans to commercial borrowers, byclass segment, as of December 31:
Special Mention 2019 vs. 2018 Increase
(Decrease) Substandard or Lower 2019 vs. 2018 Increase
(Decrease) Total Criticized Loans
2019 2018 $ % 2019 2018 $ % 2019 2018
(dollars in thousands)
Real estate - commercial mortgage $ 137,163 $ 170,827 $ (33,664) (19.7)% $ 134,206 $ 133,995 $ 211 0.2 % $ 271,369 $ 304,822
Commercial - secured 171,442 193,470 (22,028) (11.4) 195,884 129,026 66,858 51.8 367,326 322,496
Commercial - unsecured 9,665 4,016 5,649 140.7 3,876 3,963 (87) (2.2) 13,541 7,979Total commercial - industrial, financial and
agricultural 181,107 197,486 (16,379) (8.3) 199,760 132,989 66,771 50.2 380,867 330,475
Construction - commercial residential 2,897 6,912 (4 ,015) (58.1) 3,461 6,881 (3,420) (49.7) 6,358 13,793
Construction - commercial 1,322 1,163 159 13.7 2,676 2,533 143 5.6 3,998 3,696
Total construction (excluding construction - other) 4,219 8,075 (3,856) (47.8) 6,137 9,414 (3,277) (34.8) 10,356 17,489
Total $ 322,489 $ 376,388 $ (53,899) (14.3)% $ 340,103 $ 276,398 $ 63,705 23.0 % $ 662,592 $ 652,786
% of total risk rated loans 2.7% 3.2% 2.8% 2.4% 5.5% 5.6%
As of December 31, 2019, total loans with risk ratings of special mention decreased by $53.9 million, and total loans with a risk rating of substandard or lowerincreased by $63.7 million, resulting in an overall increase in total criticized loans of $9.8 million, or 1.5%, higher than 2018. The decrease in special mention loanswas driven by certain large-pay offs as well as the shifting of loans into the sub-standard or lower rating in both real estate commercial mortgage and commercialsecured loans. The $66.9 million increase in commercial secured was primarily the result of the aforementioned shifts from special mention as well othercommercial relationships now being classified as substandard or lower during 2019.
The following table presents, by class segment, a summary of delinquency status and rates, as a percentage of total loans and leases, for loans and leases that donot have internal risk ratings as of December 31:
Delinquent (1) Non-performing (2) Total
2019 2018 2019 2018 2019 2018
$ % $ % $ % $ % $ % $ %
(dollars in thousands)Real estate - home
equity $ 12,341 0.94% $ 10,702 0.74% $ 10,568 0.80% $ 9,769 0.67% $ 22,909 1.74% $ 20,471 1.41%Real estate -
residentialmortgage 34,291 1.30 28,988 1.29 22,411 0.85 19,101 0.85 56,702 2.15 48,089 2.14
Real estate -construction -other 895 0.95 — — 809 0.86 490 0.68 1,704 1.81 490 0.68
Consumer - direct 465 0.72 338 0.60 190 0.30 66 0.12 655 1.02 404 0.72
Consumer - indirect 4,685 1.17 3,405 0.94 268 0.07 343 0.09 4,953 1.24 3,748 1.03
Total Consumer 5,150 1.11 3,743 0.89 458 0.10 409 0.10 5,608 1.21 4,152 0.99Equipment lease
financing 4,012 1.34 1,302 0.45 16,642 5.56 19,587 6.80 20,654 6.90 20,889 7.25
Total $ 56,689 1.19% $ 44,735 1.00% $ 50,888 1.06% $ 49,356 1.10% $ 107,577 2.24% $ 94,091 2.10%
(1) Includes all accruing loans and leases P30D days to P89D days past due.(2) Includes all accruing loans and leases P90D days or more past due and all non-accrual loans and leases.
Total non-risk weighted loans increased $13.5 million, or 14.3%.
55

The following table summarizes the allocation of the allowance for loan and lease losses:
2019 2018 2017 2016 2015
Allowance
%In Each
Category (1) Allowance
%In Each
Category (1) Allowance
%In Each
Category (1) Allowance
%In Each
Category (1) Allowance
%In Each
Category (1)
(dollars in thousands)Real estate -
commercialmortgage $ 45,610 39.6% $ 52,889 39.7% $ 58,793 40.3% $ 46,842 40.9% $ 47,866 39.5%
Commercial -industrial,financial andagricultural 68,602 26.4 58,868 27.2 66,280 27.2 54,353 27.8 57,098 29.5
Real estate -residentialmortgage 19,771 15.7 18,921 13.9 16,088 12.4 22,929 10.9 21,375 9.9
Consumer, homeequity, equipmentlease financing 25,196 12.5 24,798 13.5 22,129 13.7 33,567 14.7 27,458 15.3
Real estate -construction 4,443 5.8 5,061 5.7 6,620 6.4 6,455 5.7 6,529 5.8Unallocated — N/A — N/A — N/A 4,533 N/A 8,728 N/A Total $ 163,622 100.0% $ 160,537 100.0% $ 169,910 100.0% $ 168,679 100.0% $ 169,054 100.0%N/A – Not applicable(1) Represents the percentage of loans and/or leases in each category
Management believes that the $163.6 million allowance for loan losses as of December 31, 2019 was sufficient to cover incurred losses in the loan portfolio. Seeadditional disclosures in "Note 1 - Summary of Significant Accounting Policies," and "Note 4 - Loans and Leases and Allowance for Credit Losses," in the Notesto Consolidated Financial Statements in Item 8. "Financial Statements and Supplementary Data;" and "Critical Accounting Policies" above.
Goodwill and Intangible Assets
Goodwill and intangible assets, net of amortization, increased $3.7 million, or 0.7%, as a result of the acquisitions of the assets of two wealth managementbusiness with approximately $320 million in assets under management or administration in 2019, partially offset by approximately $1.0 million trade nameintangible write-off due to the Charter Consolidation.
Other Assets
Other assets increased $244.6 million, or 36.4%, to $916.4 million as of December 31, 2019, primarily driven by right-of-use assets recorded as a result of theadoption of ASU 2016-02 ($102.8 million), additional investments in bank-owned life insurance ($100.0 million) and higher fair values of commercial loan interestrate swap derivatives ($82.8 million). See Note 1, "Summary of Significant Accounting Policies," and Note 17, "Leases," in the Notes to Consolidated FinancialStatements for additional disclosures resulting from ASU 2016-02 adoption.
56

Deposits and Borrowings
The following table presents ending deposits, by type, as of December 31:
Increase 2019 2018 $ % (dollars in thousands)Noninterest-bearing demand $ 4,453,324 $ 4,310,105 $ 143,219 3.3%Interest-bearing demand 4,720,188 4,240,974 479,214 11.3Savings and money market accounts 5,153,941 4,926,937 227,004 4.6
Total demand and savings 14,327,453 13,478,016 849,437 6.3Brokered deposits 264,531 176,239 88,292 50.1Time deposits 2,801,929 2,721,904 80,025 2.9
Total deposits $ 17,393,913 $ 16,376,159 $ 1,017,754 6.2%
The following table presents ending borrowings, by type as of December 31:
Increase (Decrease) 2019 2018 $ % (dollars in thousands)Short-term borrowings:
Total short-term customer funding (1) $ 383,241 $ 369,777 $ 13,464 3.6%Short-term FHLB advances (2) 500,000 385,000 115,000 29.9
Total short-term borrowings 883,241 754,777 128,464 17.0FHLB advances and other long-term debt:
FHLB advances 491,024 601,978 (110,954) (18.4)Other long-term debt 390,745 390,301 444 0.1
Total FHLB advances and other long-term debt 881,769 992,279 (110,510) (11.1)Total borrowings $ 1,765,010 $ 1,747,056 $ 17,954 1.0%
(1) Includes repurchase agreements and short-term promissory notes.(2) Represents FHLB advances with an original maturity term of less than one year.
Total short-term borrowings increased $128.5 million, or 17.0%, mainly due to a $115.0 million increase in short-term FHLB advances. The decrease in total FHLBadvances and other long-term debt was the result of a $111.0 million decrease in long-term FHLB advances as a result of pay-offs and maturing advances thatwere not replaced, but resulted in the increase to short-term borrowings.
Other Liabilities
Other liabilities increased $73.6 million, or 23.6%, to $384.9 million as of December 31, 2019. The increase resulted primarilyfrom the recognition of a lease liability of $109.6 million as a result of the adoption of ASU 2016-02, partially offset by a decrease in the defined benefit planobligation as a result of additional funding in 2019. See Note 1, "Summary of Significant Accounting Policies," and Note 17, "Leases," in the Notes toConsolidated Financial Statements for additional disclosures resulting from ASU 2016-02 adoption.
Shareholders’ Equity
Total shareholders’ equity increased $94.6 million, or 4.2%, to $2.3 billion, or 10.7% of total assets, as of December 31, 2019. The increase was due primarily to$226.3 million of net income, a $58.9 million net increase in accumulated other comprehensive income, $7.4 million of stock-based compensation awards and $6.4million of common stock issued, partially offset by $111.5 million of common stock repurchases and $93.0 million of common stock cash dividends.
See "Note 14 - Shareholders' Equity" in the Notes to the Consolidated Financial Statements in Item 8. "Financial Statements and Supplementary Data." for detailsof the Corporation's share repurchase programs and activities. Under all repurchase programs, repurchased shares are added to treasury stock, at cost. As permittedby securities laws and other legal requirements, and subject to market conditions and other factors, purchases may be made from time to time in open market orprivately negotiated transactions, including, without limitation, through accelerated share repurchase transactions.
57
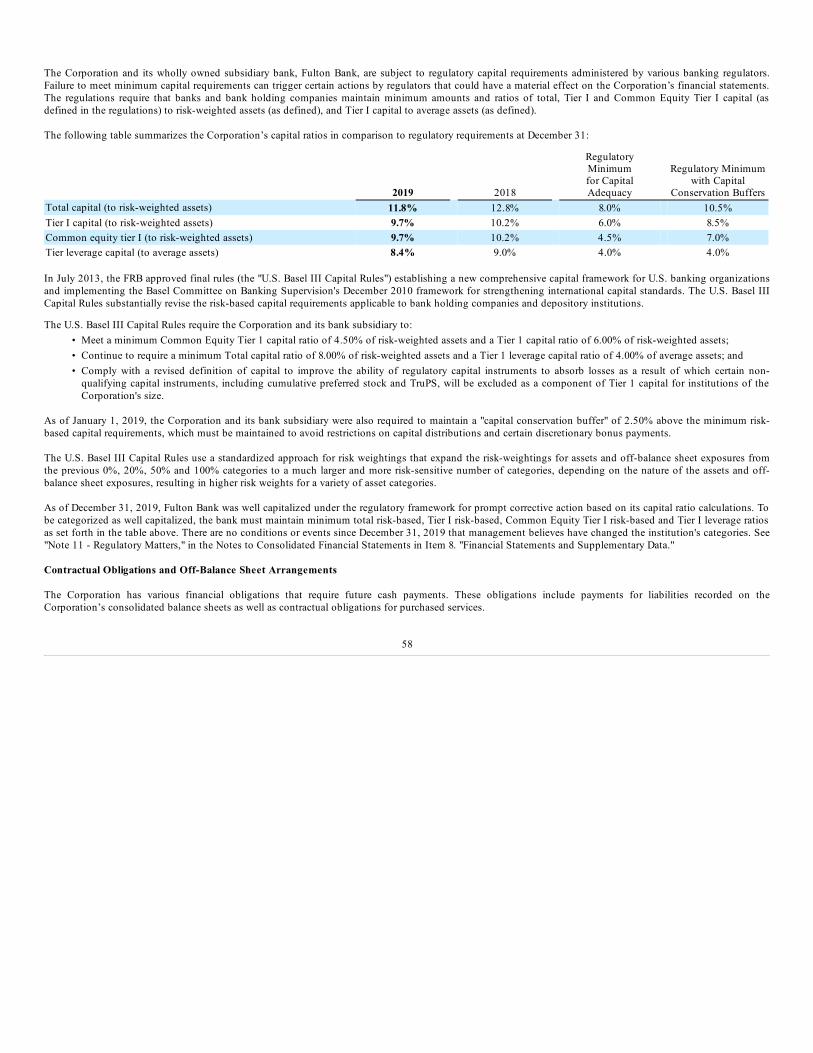
The Corporation and its wholly owned subsidiary bank, Fulton Bank, are subject to regulatory capital requirements administered by various banking regulators.Failure to meet minimum capital requirements can trigger certain actions by regulators that could have a material effect on the Corporation’s financial statements.The regulations require that banks and bank holding companies maintain minimum amounts and ratios of total, Tier I and Common Equity Tier I capital (asdefined in the regulations) to risk-weighted assets (as defined), and Tier I capital to average assets (as defined).
The following table summarizes the Corporation’s capital ratios in comparison to regulatory requirements at December 31:
2019 2018
RegulatoryMinimumfor CapitalAdequacy
Regulatory Minimumwith Capital
Conservation BuffersTotal capital (to risk-weighted assets) 11.8% 12.8% 8.0% 10.5%Tier I capital (to risk-weighted assets) 9.7% 10.2% 6.0% 8.5%Common equity tier I (to risk-weighted assets) 9.7% 10.2% 4.5% 7.0%Tier leverage capital (to average assets) 8.4% 9.0% 4.0% 4.0%
In July 2013, the FRB approved final rules (the "U.S. Basel III Capital Rules") establishing a new comprehensive capital framework for U.S. banking organizationsand implementing the Basel Committee on Banking Supervision's December 2010 framework for strengthening international capital standards. The U.S. Basel IIICapital Rules substantially revise the risk-based capital requirements applicable to bank holding companies and depository institutions.
The U.S. Basel III Capital Rules require the Corporation and its bank subsidiary to:• Meet a minimum Common Equity Tier 1 capital ratio of 4.50% of risk-weighted assets and a Tier 1 capital ratio of 6.00% of risk-weighted assets;• Continue to require a minimum Total capital ratio of 8.00% of risk-weighted assets and a Tier 1 leverage capital ratio of 4.00% of average assets; and• Comply with a revised definition of capital to improve the ability of regulatory capital instruments to absorb losses as a result of which certain non-
qualifying capital instruments, including cumulative preferred stock and TruPS, will be excluded as a component of Tier 1 capital for institutions of theCorporation's size.
As of January 1, 2019, the Corporation and its bank subsidiary were also required to maintain a "capital conservation buffer" of 2.50% above the minimum risk-based capital requirements, which must be maintained to avoid restrictions on capital distributions and certain discretionary bonus payments.
The U.S. Basel III Capital Rules use a standardized approach for risk weightings that expand the risk-weightings for assets and off-balance sheet exposures fromthe previous 0%, 20%, 50% and 100% categories to a much larger and more risk-sensitive number of categories, depending on the nature of the assets and off-balance sheet exposures, resulting in higher risk weights for a variety of asset categories.
As of December 31, 2019, Fulton Bank was well capitalized under the regulatory framework for prompt corrective action based on its capital ratio calculations. Tobe categorized as well capitalized, the bank must maintain minimum total risk-based, Tier I risk-based, Common Equity Tier I risk-based and Tier I leverage ratiosas set forth in the table above. There are no conditions or events since December 31, 2019 that management believes have changed the institution's categories. See"Note 11 - Regulatory Matters," in the Notes to Consolidated Financial Statements in Item 8. "Financial Statements and Supplementary Data."
Contractual Obligations and Off-Balance Sheet Arrangements
The Corporation has various financial obligations that require future cash payments. These obligations include payments for liabilities recorded on theCorporation’s consolidated balance sheets as well as contractual obligations for purchased services.
58
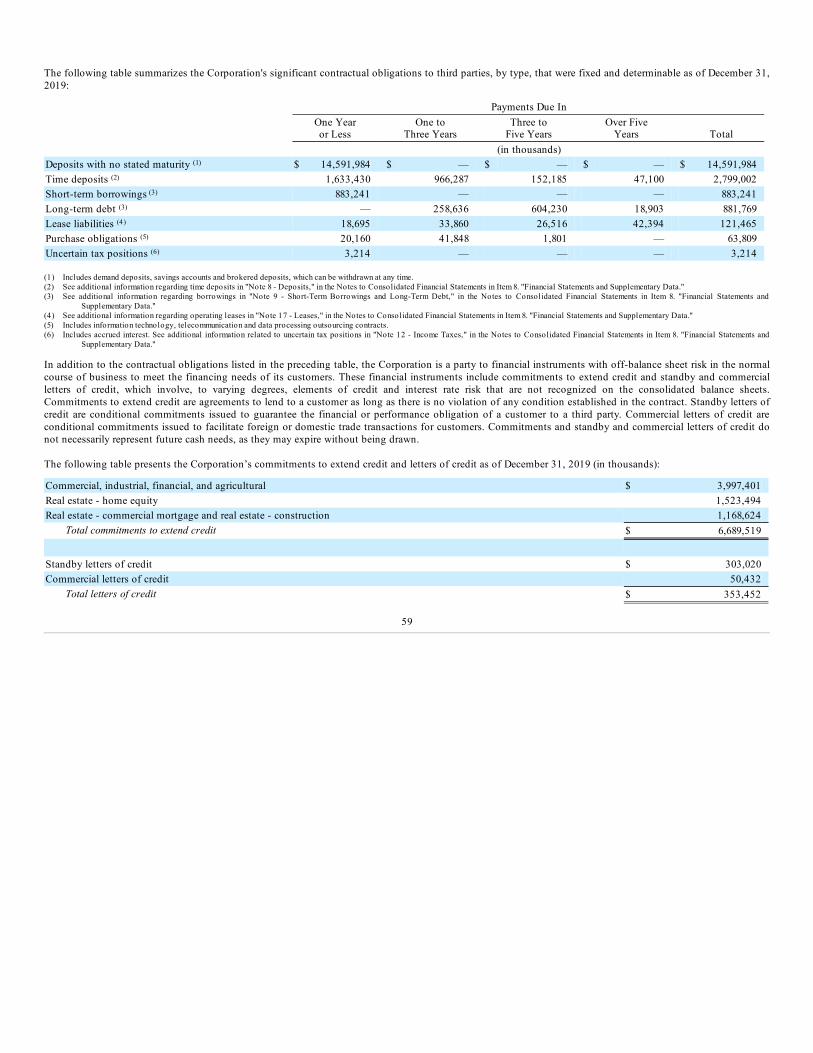
The following table summarizes the Corporation's significant contractual obligations to third parties, by type, that were fixed and determinable as of December 31,2019:
Payments Due In
One Yearor Less
One toThree Years
Three toFive Years
Over FiveYears Total
(in thousands)Deposits with no stated maturity (1) $ 14,591,984 $ — $ — $ — $ 14,591,984Time deposits (2) 1,633,430 966,287 152,185 47,100 2,799,002Short-term borrowings (3) 883,241 — — — 883,241Long-term debt (3) — 258,636 604,230 18,903 881,769Lease liabilities (4) 18,695 33,860 26,516 42,394 121,465Purchase obligations (5) 20,160 41,848 1,801 — 63,809Uncertain tax positions (6) 3,214 — — — 3,214 (1) Includes demand deposits, savings accounts and brokered deposits, which can be withdrawn at any time.(2) See additional information regarding time deposits in "Note 8 - Deposits," in the Notes to Consolidated Financial Statements in Item 8. "Financial Statements and Supplementary Data."(3) See additional information regarding borrowings in "Note 9 - Short-Term Borrowings and Long-Term Debt," in the Notes to Consolidated Financial Statements in Item 8. "Financial Statements and
Supplementary Data."(4) See additional information regarding operating leases in "Note 17 - Leases," in the Notes to Consolidated Financial Statements in Item 8. "Financial Statements and Supplementary Data."(5) Includes information technology, telecommunication and data processing outsourcing contracts.(6) Includes accrued interest. See additional information related to uncertain tax positions in "Note 12 - Income Taxes," in the Notes to Consolidated Financial Statements in Item 8. "Financial Statements and
Supplementary Data."
In addition to the contractual obligations listed in the preceding table, the Corporation is a party to financial instruments with off-balance sheet risk in the normalcourse of business to meet the financing needs of its customers. These financial instruments include commitments to extend credit and standby and commercialletters of credit, which involve, to varying degrees, elements of credit and interest rate risk that are not recognized on the consolidated balance sheets.Commitments to extend credit are agreements to lend to a customer as long as there is no violation of any condition established in the contract. Standby letters ofcredit are conditional commitments issued to guarantee the financial or performance obligation of a customer to a third party. Commercial letters of credit areconditional commitments issued to facilitate foreign or domestic trade transactions for customers. Commitments and standby and commercial letters of credit donot necessarily represent future cash needs, as they may expire without being drawn.
The following table presents the Corporation’s commitments to extend credit and letters of credit as of December 31, 2019 (in thousands):
Commercial, industrial, financial, and agricultural $ 3,997,401Real estate - home equity 1,523,494Real estate - commercial mortgage and real estate - construction 1,168,624
Total commitments to extend credit $ 6,689,519 Standby letters of credit $ 303,020Commercial letters of credit 50,432
Total letters of credit $ 353,452
59

Item 7A. Quantitative and Qualitative Disclosures About Market RiskMarket risk is the exposure to economic loss that arises from changes in the values of certain financial instruments. The types of market risk exposures generallyfaced by financial institutions include interest rate risk, equity market price risk, debt security market price risk, foreign currency price risk and commodity pricerisk. Due to the nature of its operations, foreign currency price risk and commodity price risk are not significant to the Corporation.
Interest Rate Risk, Asset/Liability Management and Liquidity
Interest rate risk creates exposure in two primary areas. First, changes in rates have an impact on the Corporation’s liquidity position and could affect its ability tomeet obligations and continue to grow. Second, movements in interest rates can create fluctuations in the Corporation’s net interest income and changes in theeconomic value of its equity.
The Corporation employs various management techniques to minimize its exposure to interest rate risk. An Asset/Liability Management Committee is responsiblefor reviewing the interest rate sensitivity and liquidity positions of the Corporation, approving asset and liability management policies, and overseeing theformulation and implementation of strategies regarding balance sheet positions.
The Corporation uses two complementary methods to measure and manage interest rate risk. They are simulation of net interest income and estimates of economicvalue of equity. Using these measurements in tandem provides a reasonably comprehensive summary of the magnitude of the Corporation's interest rate risk, levelof risk as time evolves, and exposure to changes in interest rates.
Simulation of net interest income is performed for the next 12-month period. A variety of interest rate scenarios are used to measure the effects of sudden andgradual movements upward and downward in the yield curve. These results are compared to the results obtained in a flat or unchanged interest rate scenario.Simulation of net interest income is used primarily to measure the Corporation’s short-term earnings exposure to rate movements. The Corporation’s policy limitsthe potential exposure of net interest income, in a non-parallel instantaneous shock, to 10% of the base case net interest income for a 100 basis point shock ininterest rates, 15% for a 200 basis point shock and 20% for a 300 basis point shock. A "shock" is an immediate upward or downward movement of interest rates.The shocks do not take into account changes in customer behavior that could result in changes to mix and/or volumes in the balance sheet, nor does it take intoaccount the potential effects of competition on the pricing of deposits and loans over the forward 12-month period.
Contractual maturities and repricing opportunities of loans are incorporated in the simulation model as are prepayment assumptions, maturity data and call optionswithin the investment portfolio. Assumptions based on past experience are incorporated into the model for non-maturity deposit accounts. The assumptions usedare inherently uncertain and, as a result, the model cannot precisely measure future net interest income or precisely predict the impact of fluctuations in marketinterest rates on net interest income. Actual results will differ from the model's simulated results due to timing, amount and frequency of interest rate changes aswell as changes in market conditions and the application and timing of various management strategies.
The following table summarizes the expected impact of abrupt interest rate changes, i.e. a non-parallel instantaneous shock, on net interest income as ofDecember 31, 2019 (due to the current level of interest rates, the 300 basis point downward shock scenario is not shown):
Rate Shock (1)Annual change
in net interest income % Change in net interest
income+300 bp + $68.0 million + 10.3%+200 bp + $46.3 million + 7.0%+100 bp + $23.7 million + 3.6%–100 bp – $37.1 million – 5.6%–200 bp – $79.6 million – 12.1%
(1) These results include the effect of implicit and explicit interest rate floors that limit further reduction in interest rates.
Economic value of equity estimates the discounted present value of asset and liability cash flows. Discount rates are based upon market prices for like assets andliabilities. Abrupt changes or "shocks" in interest rates, both upward and downward, are used to determine the comparative effect of such interest rate movementsrelative to the unchanged environment. This measurement tool is used primarily to evaluate the longer-term repricing risks and options in the Corporation’sbalance sheet. The Corporation's policy limits the economic value of equity that may be at risk, in a non-parallel instantaneous shock, to 10% of the base case
60

economic value of equity for a 100 basis point shock in interest rates, 20% for a 200 basis point shock and 30% for a 300 basis point shock. As of December 31,2019, the Corporation was within economic value of equity policy limits for every 100 basis point shock.
Commercial Interest Rate Swaps
The Corporation enters into interest rate swaps with certain qualifying commercial loan customers to meet their interest rate risk management needs. TheCorporation simultaneously enters into interest rate swaps with dealer counterparties, with identical notional amounts and terms. The net result of these interestrate swaps is that the customer pays a fixed rate of interest and the Corporation receives a floating rate. These interest rate swaps are derivative financialinstruments and the gross fair values are recorded in other assets and liabilities on the consolidated balance sheets, with changes in fair value during the periodrecorded in other non-interest expense on the consolidated statements of income.
Liquidity
The Corporation must maintain a sufficient level of liquid assets to meet the cash needs of its customers, who, as depositors, may want to withdraw funds or who,as borrowers, need credit availability. Liquidity is provided on a continuous basis through scheduled and unscheduled principal and interest payments oninvestments and outstanding loans and through the availability of deposits and borrowings. The Corporation also maintains secondary sources that provideliquidity on a secured and unsecured basis to meet short-term and long-term needs.
The Corporation maintains liquidity sources in the form of demand and savings deposits, brokered deposits, time deposits, repurchase agreements and short-termpromissory notes. The Corporation can access additional liquidity from these sources, if necessary, by increasing the rates of interest paid on those accounts andborrowings. The positive impact to liquidity resulting from paying higher interest rates could have a detrimental impact on the net interest margin and net interestincome if rates on interest-earning assets do not experience a proportionate increase. Borrowing availability with the FHLB and the FRB, along with federal fundslines at various correspondent banks, provides the Corporation with additional liquidity.
Fulton Bank is a member of the FHLB and has access to FHLB overnight and term credit facilities. As of December 31, 2019, the Corporation had $991.0 millionof short- and long-term advances outstanding from the FHLB with an additional borrowing capacity of approximately $3.7 billion under these facilities. Advancesfrom the FHLB are secured by qualifying commercial real estate and residential mortgage loans, investments and other assets.
As of December 31, 2019, the Corporation had aggregate availability under federal funds lines of $1.7 billion, with no outstanding borrowings against thatamount. A combination of commercial real estate loans, commercial loans and securities are pledged to the FRB of Philadelphia to provide access to FRB DiscountWindow borrowings. As of December 31, 2019, the Corporation had $334.3 million of collateralized borrowing availability at the Discount Window, and nooutstanding borrowings.
Liquidity must also be managed at the Corporation parent company level. For safety and soundness reasons, banking regulations limit the amount of cash that canbe transferred from subsidiary banks to the parent company in the form of loans and dividends. Generally, these limitations are based on the subsidiary banks’regulatory capital levels and their net income. See "Note 11 - Regulatory Matters - Dividend and Loan Limitations" in the Notes to Consolidated FinancialStatements in Item 8. "Financial Statements and Supplementary Data" for additional information concerning limitations on the dividends that may be paid to theCorporation, and loans that may be granted to the Corporation. Management continues to monitor the liquidity and capital needs of the parent company and willimplement appropriate strategies, as necessary, to remain adequately capitalized and to meet its cash needs.
The Corporation’s sources and uses of funds were discussed in general terms in the "Net Interest Income" section of Management’s Discussion and Analysis. Theconsolidated statements of cash flows provide additional information. The Corporation’s operating activities during 2019 generated $127.7 million of cash, mainlydue to net income of $226.3 million, partially offset by the net impact of other operating activities of $98.6 million as a result of increases in bank-owned lifeinsurance and net changes to fair values of derivative assets and liabilities. Cash used in investing activities was $893.3 million, due to net increases in investmentsand loans. Net cash provided by financing activities was $837.7 million due mainly to increases in deposits exceeding the net decrease in long-term debt and theacquisition of treasury stock.
61

The following table presents the expected maturities of available for sale investment securities, at estimated fair value, and held to maturity investment securities,at amortized cost, as of December 31, 2019 and the weighted average yields on such securities (calculated based on historical cost):
Maturing
Within One Year After One But
Within Five Years After Five But
Within Ten Years After Ten Years Amount Yield Amount Yield Amount Yield Amount YieldAvailable for sale (dollars in thousands)State and municipal (1) $ 675 3.02% $ 15,963 4.21% $ 7,423 6.43% $ 628,866 3.97%Corporate debt securities 2,155 2.01 18,287 3.58 348,465 3.80 101,926 3.06Auction rate securities (2) — — — — — — 8,450 4.10
Total $ 2,830 2.25% $ 34,250 3.87% $ 355,888 3.85% $ 739,242 3.83%
Held to maturity Residential mortgage-backed securities (3) $ — —% $ — —% $ — —% $ 156,134 4.16%
Available for sale Collateralized mortgage obligations (3) $ 693,719 2.89% Residential mortgage-backed securities (3) 177,312 2.45% Commercial mortgage-backed securities (3) 494,297 2.72% Held to maturity Residential mortgage-backed securities (3) $ 369,841 2.08% (1) Weighted average yields on tax-exempt securities have been computed on a fully taxable-equivalent basis assuming a federal tax rate of 21% and statutory interest expense disallowances.(2) Maturities of auction rate securities are based on contractual maturities.(3) Maturities for mortgage-backed securities and collateralized mortgage obligations are dependent upon the interest rate environment and prepayments on the underlying loans. For the purpose of this table, all
balances and weighted average rates are shown in one period. As of December 31, 2019, the weighted average remaining lives of collateralized mortgage obligations and mortgage-backed securities were fourand six years, respectively.
The Corporation’s investment portfolio consists mainly of mortgage-backed securities and collateralized mortgage obligations which have stated maturities thatmay differ from actual maturities due to borrowers’ ability to prepay obligations. Cash flows from such investments are dependent upon the performance of theunderlying mortgage loans and are generally influenced by the level of interest rates. As rates increase, cash flows generally decrease as prepayments on theunderlying mortgage loans decrease. As rates decrease, cash flows generally increase as prepayments increase.
The following table presents the approximate contractual maturities of fixed rate loans and loan types subject to changes in interest rates as of December 31, 2019:
One Yearor Less
OneThrough
Five Years More ThanFive Years Total
(in thousands)Commercial - industrial, financial and agricultural
Adjustable and floating rate $ 743,150 $ 2,050,214 $ 423,071 $ 3,216,435Fixed rate 591,667 562,871 75,728 1,230,266
Total $ 1,334,817 $ 2,613,085 $ 498,799 $ 4,446,701Real estate – mortgage (1):
Adjustable and floating rate $ 1,408,557 $ 4,571,459 $ 2,487,116 $ 8,467,132Fixed rate 626,095 1,081,456 482,502 2,190,053
Total $ 2,034,652 $ 5,652,915 $ 2,969,618 $ 10,657,185Real estate – construction:
Adjustable and floating rate $ 279,844 $ 354,663 $ 230,064 $ 864,571Fixed rate 96,543 7,383 2,582 106,508
Total $ 376,387 $ 362,046 $ 232,646 $ 971,079
(1) Includes commercial mortgages, residential mortgages and home equity loans.
62

Contractual maturities of time deposits as of December 31, 2019 were as follows (in thousands):
Year
2020 $ 1,636,3572021 529,3782022 436,9092023 109,0442024 43,141Thereafter 47,100 $ 2,801,929
Contractual maturities of time deposits of $100,000 or more outstanding, included in the table above, as of December 31, 2019 were as follows (in thousands):
Three months or less $ 239,122Over three through six months 202,469Over six through twelve months 378,698Over twelve months 546,961
Total $ 1,367,250
Debt Security Market Price Risk
Debt security market price risk is the risk that changes in the values of debt securities, unrelated to interest rate changes, could have a material impact on thefinancial position or results of operations of the Corporation. The Corporation’s debt security investments consist primarily of U.S. government sponsored agencyissued mortgage-backed securities and collateralized mortgage obligations, state and municipal securities, auction rate securities and corporate debt securities. Allof the Corporation's investments in mortgage-backed securities and collateralized mortgage obligations have principal payments that are guaranteed by U.S.government sponsored agencies.
State and Municipal Securities
As of December 31, 2019, the Corporation owned state and municipal securities issued by various states and municipalities with a total fair value of $652.9million. Uncertainty with respect to the financial strength of state and municipal bond insurers places emphasis on the underlying strength of issuers. Pressure onlocal tax revenues of issuers due to adverse economic conditions could have an adverse impact on the underlying credit quality of issuers. The Corporationevaluates existing and potential holdings primarily based on the underlying creditworthiness of the issuing state or municipality and then, to a lesser extent, on anycredit enhancement. State and municipal securities can be supported by the general obligation of the issuing state or municipality, allowing the securities to berepaid by any means available to the issuing state or municipality. As of December 31, 2019, approximately 99% of state and municipal securities were supportedby the general obligation of corresponding states or municipalities. Approximately 55% of these securities were school district issuances, which are also supportedby the states of the issuing municipalities.
Auction Rate Securities
As of December 31, 2019, the Corporation’s investments in student loan auction rate securities, also known as auction rate certificates ("ARCs"), had a cost basisof $107.4 million and an estimated fair value of $101.9 million. The fair values of the ARCs currently in the portfolio were derived using significant unobservableinputs based on an expected cash flows model which produced fair values that may not represent those that could be expected from settlement of theseinvestments in the current market. The expected cash flows model produced fair values which assumed a return to market liquidity sometime within the next fiveyears. The Corporation believes that the trusts underlying the ARCs will self-liquidate as student loans are repaid.
The credit quality of the underlying debt associated with the ARCs is also a factor in the determination of their estimated fair value. As of December 31, 2019, allof the ARCs were rated above investment grade. All of the loans underlying the ARCs have principal payments which are guaranteed by the federal government.At December 31, 2019, all of the Corporation's ARCs were current and making scheduled interest payments.
63

Corporate Debt Securities
The Corporation holds corporate debt securities in the form of single-issuer trust preferred securities and subordinated debt and senior debt issued by financialinstitutions. As of December 31, 2019, these securities had an amortized cost of $370.4 million and an estimated fair value of $377.4 million.
See "Note 3 - Investment Securities," in the Notes to Consolidated Financial Statements in Item 8. "Financial Statements and Supplementary Data" for furtherdiscussion related to the Corporation’s other-than-temporary impairment evaluations for debt securities, and see "Note 19 - Fair Value Measurements," in the Notesto Consolidated Financial Statements in Item 8. "Financial Statements and Supplementary Data" for further discussion related to the fair values of debt securities.
64

Item 8. Financial Statements and Supplementary Data
CONSOLIDATED BALANCE SHEETS (dollars in thousands, except per-share data)
December 31, 2019 2018Assets Cash and due from banks $ 132,283 $ 103,436Interest-bearing deposits with other banks 385,508 342,251
Total Cash and Cash Equivalents 517,791 445,687Federal Reserve Bank and Federal Home Loan Bank stock 97,422 79,283Loans held for sale 37,828 27,099Investment securities:
Available for sale, at estimated fair value 2,497,537 2,080,294Held to maturity, at amortized cost 369,841 606,679
Loans and leases, net of unearned income 16,837,526 16,165,800Allowance for loan and lease losses (163,622) (160,537)
Net Loans and Leases 16,673,904 16,005,263Premises and equipment 240,046 234,529Accrued interest receivable 60,898 58,879Goodwill and intangibles 535,303 531,556Other assets 855,470 612,883
Total Assets $ 21,886,040 $ 20,682,152Liabilities Deposits:
Noninterest-bearing $ 4,453,324 $ 4,310,105Interest-bearing 12,940,589 12,066,054
Total Deposits 17,393,913 16,376,159Short-term borrowings 883,241 754,777Accrued interest payable 8,834 10,529Federal Home Loan Bank advances and long-term debt 881,769 992,279Other liabilities 376,107 300,835
Total Liabilities 19,543,864 18,434,579Shareholders’ Equity Common stock, $2.50 par value, 600 million shares authorized, 222.4 million shares issued in 2019 and
221.8 million shares issued in 2018 556,110 554,377Additional paid-in capital 1,499,681 1,489,703Retained earnings 1,079,391 946,032Accumulated other comprehensive loss (137) (59,063)Treasury stock, 58.2 million shares in 2019 and 51.6 million shares in 2018 (792,869) (683,476)
Total Shareholders’ Equity 2,342,176 2,247,573Total Liabilities and Shareholders’ Equity $ 21,886,040 $ 20,682,152
See Notes to Consolidated Financial Statements
65
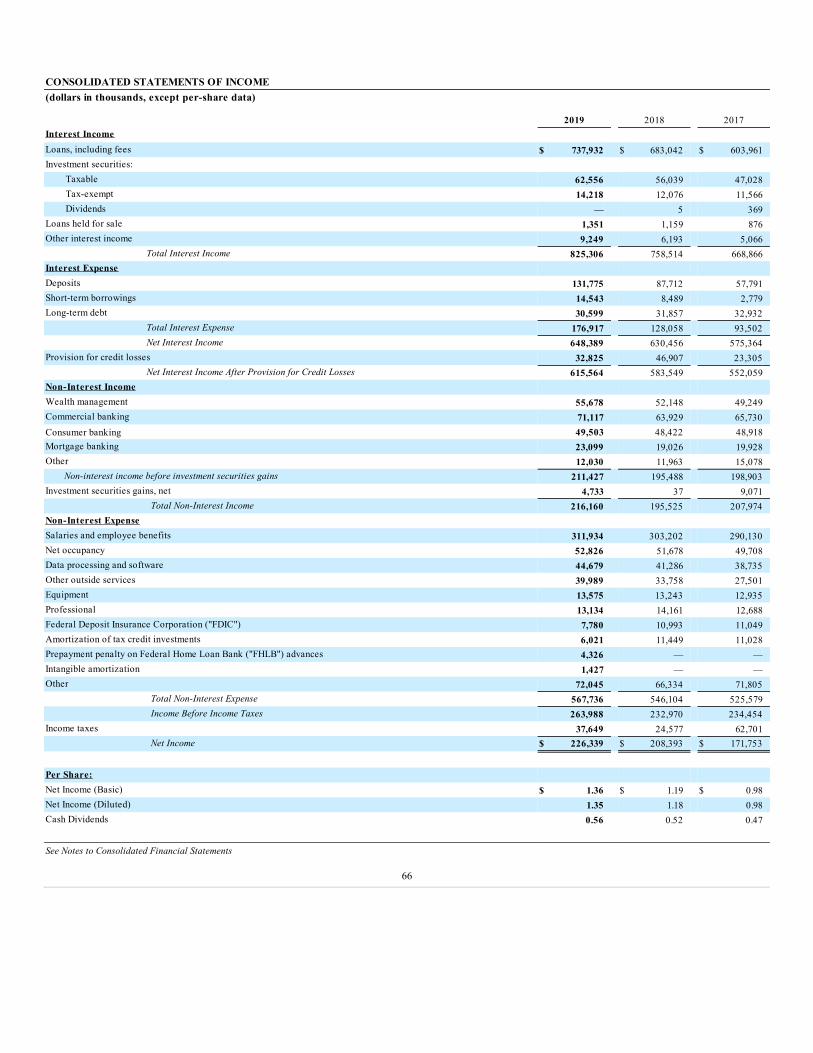
CONSOLIDATED STATEMENTS OF INCOME(dollars in thousands, except per-share data)
2019 2018 2017Interest Income Loans, including fees $ 737,932 $ 683,042 $ 603,961Investment securities:
Taxable 62,556 56,039 47,028Tax-exempt 14,218 12,076 11,566Dividends — 5 369
Loans held for sale 1,351 1,159 876Other interest income 9,249 6,193 5,066
Total Interest Income 825,306 758,514 668,866Interest Expense Deposits 131,775 87,712 57,791Short-term borrowings 14,543 8,489 2,779Long-term debt 30,599 31,857 32,932
Total Interest Expense 176,917 128,058 93,502Net Interest Income 648,389 630,456 575,364
Provision for credit losses 32,825 46,907 23,305Net Interest Income After Provision for Credit Losses 615,564 583,549 552,059
Non-Interest Income Wealth management 55,678 52,148 49,249Commercial banking 71,117 63,929 65,730Consumer banking 49,503 48,422 48,918Mortgage banking 23,099 19,026 19,928Other 12,030 11,963 15,078
Non-interest income before investment securities gains 211,427 195,488 198,903Investment securities gains, net 4,733 37 9,071
Total Non-Interest Income 216,160 195,525 207,974Non-Interest Expense Salaries and employee benefits 311,934 303,202 290,130Net occupancy 52,826 51,678 49,708Data processing and software 44,679 41,286 38,735Other outside services 39,989 33,758 27,501Equipment 13,575 13,243 12,935Professional 13,134 14,161 12,688Federal Deposit Insurance Corporation ("FDIC") 7,780 10,993 11,049Amortization of tax credit investments 6,021 11,449 11,028Prepayment penalty on Federal Home Loan Bank ("FHLB") advances 4,326 — —Intangible amortization 1,427 — —Other 72,045 66,334 71,805
Total Non-Interest Expense 567,736 546,104 525,579Income Before Income Taxes 263,988 232,970 234,454
Income taxes 37,649 24,577 62,701Net Income $ 226,339 $ 208,393 $ 171,753
Per Share: Net Income (Basic) $ 1.36 $ 1.19 $ 0.98Net Income (Diluted) 1.35 1.18 0.98Cash Dividends 0.56 0.52 0.47 See Notes to Consolidated Financial Statements
66

CONSOLIDATED STATEMENTS OF COMPREHENSIVE INCOME(in thousands)
2019 2018 2017Net Income $ 226,339 $ 208,393 $ 171,753Other Comprehensive (Loss) Income, net of tax: Unrealized gains (losses) on available for sale investment securities:
Unrealized gain (loss) on securities 56,919 (24,326) 10,432Reclassification adjustment for securities gains included in net income (3,686) (30) (5,894)Amortization of net unrealized losses on securities transferred to held to maturity 6,285 2,098 —Non-credit related unrealized (loss) gain on other-than-temporarily impaired debt securities (680) 222 185
Net unrealized gains (losses) on available for sale investment securities 58,838 (22,036) 4,723Defined benefit pension plan and postretirement benefits:
Unrecognized pension and postretirement (cost) income (937) 1,400 (609)Amortization of net unrecognized pension and postretirement income 1,025 1,648 1,361
Net unrealized gains on defined benefit pension and postretirement plans 88 3,048 752Other Comprehensive Income (Loss) 58,926 (18,988) 5,475Total Comprehensive Income $ 285,265 $ 189,405 $ 177,228
See Notes to Consolidated Financial Statements
67

CONSOLIDATED STATEMENTS OF SHAREHOLDERS’ EQUITY(in thousands, except per share data)
Common Stock Additional
Paid-inCapital
AccumulatedOther
Comprehensive(Loss) Income
Shares
Outstanding Amount RetainedEarnings
TreasuryStock Total
Balance at December 31, 2016 174,040 $ 549,707 $ 1,467,602 $ 732,099 $ (38,449) $ (589,844) $ 2,121,115
Net income 171,753 171,753Other comprehensive income 5,475 5,475Stock issued, including related tax benefits 1,130 2,525 5,578 435 8,538Stock-based compensation awards 5,209 5,209Common stock cash dividends - $0.47 per share (82,233) (82,233)
Balance at December 31, 2017 175,170 $ 552,232 $ 1,478,389 $ 821,619 $ (32,974) $ (589,409) $ 2,229,857Net income 208,393 208,393Other comprehensive loss (18,988) (18,988)Stock issued 977 2,062 3,432 1,241 6,735Stock-based compensation awards 33 83 7,882 7,965Acquisition of treasury stock (5,996) (95,308) (95,308)Reclassification of stranded tax effects (1) 7,101 (7,101) —Common stock cash dividends - $0.52 per share (91,081) (91,081)
Balance at December 31, 2018 170,184 $ 554,377 $ 1,489,703 $ 946,032 $ (59,063) $ (683,476) $ 2,247,573Net income 226,339 226,339Other comprehensive income 58,926 58,926Stock issued 883 1,733 2,565 2,064 6,362Stock-based compensation awards 7,413 7,413Acquisition of treasury stock (6,849) (111,457) (111,457)Common stock cash dividends - $0.56 per share (92,980) (92,980)
Balance at December 31, 2019 164,218 $ 556,110 $ 1,499,681 $ 1,079,391 $ (137) $ (792,869) $ 2,342,176
See Notes to Consolidated Financial Statements(1) Result of adoption of Accounting Standard Update ("ASU") 2018-02. See Note 1 to Consolidated Financial Statements for further details.
68

CONSOLIDATED STATEMENTS OF CASH FLOWS(in thousands)
2019 2018 2017CASH FLOWS FROM OPERATING ACTIVITIES:
Net Income $ 226,339 $ 208,393 $ 171,753Adjustments to reconcile net income to net cash provided by operating activities:
Provision for credit losses 32,825 46,907 23,305Depreciation and amortization of premises and equipment 28,200 28,156 28,096Amortization of tax credit investments 32,810 38,606 37,185Net amortization of investment security premiums 9,387 9,297 10,107Deferred income tax (benefit) expense (165) (15,749) 24,896Re-measurement of net deferred tax asset — (809) 15,635Investment securities gains, net (4,733) (37) (9,071)Gain on sales of mortgage loans held for sale (17,882) (13,021) (13,036)Proceeds from sales of mortgage loans held for sale 916,725 795,756 644,400Originations of mortgage loans held for sale (909,572) (778,304) (634,197)Intangible amortization 1,427 — —Amortization of issuance costs and discounts on long-term debt 842 813 845Stock-based compensation 7,413 7,965 5,209Other changes, net (195,903) (31,153) (17,369)
Total adjustments (98,626) 88,427 116,005Net cash provided by operating activities 127,713 296,820 287,758
CASH FLOWS FROM INVESTING ACTIVITIES: Proceeds from sales of available for sale securities 710,739 54,638 184,734Proceeds from paydowns and maturities of held to maturity securities 83,121 35,900 —Proceeds from principal repayments and maturities of available for sale securities 234,702 290,681 417,673Purchases of securities available for sale (1,138,070) (558,949) (584,921)Purchase of Federal Reserve Bank and Federal Home Loan Bank stock (18,139) (18,522) (3,272)Net increase in loans and leases (708,048) (447,849) (1,087,521)Net purchases of premises and equipment (33,717) (39,883) (33,092)Net cash paid for acquisitions (5,174) — —Net change in tax credit investments (18,760) (56,733) (28,932)
Net cash used in investing activities (893,346) (740,717) (1,135,331)CASH FLOWS FROM FINANCING ACTIVITIES:
Net increase in demand and savings deposits 849,437 435,872 782,525Net increase in time deposits 168,317 142,755 2,143Increase in short-term borrowings 128,464 137,253 76,207Additions to long-term debt 485,000 50,000 223,251Repayments of long-term debt (596,056) (100,165) (115,153)Net proceeds from issuance of common stock 6,362 6,735 8,538Dividends paid (92,330) (89,654) (80,368)Acquisition of treasury stock (111,457) (95,308) —
Net cash provided by financing activities 837,737 487,488 897,143Net Increase in Cash and Cash Equivalents 72,104 43,591 49,570Cash and Cash Equivalents at Beginning of Year 445,687 402,096 352,526Cash and Cash Equivalents at End of Year $ 517,791 $ 445,687 $ 402,096
Supplemental Disclosures of Cash Flow Information Cash paid during period for:
Interest $ 178,612 $ 126,846 $ 93,817Income taxes 9,193 13,547 6,537
Supplemental schedule of certain noncash activities Transfer of available for sale securities to held to maturity securities $ — $ 641,672 $ —Transfer of held to maturity securities to available for sale securities 158,898 — —
See Notes to Consolidated Financial Statements
69

NOTES TO CONSOLIDATED FINANCIAL STATEMENTS
NOTE 1 – SUMMARY OF SIGNIFICANT ACCOUNTING POLICIES
Business: Fulton Financial Corporation ("Corporation" or "Parent Company") is a financial holding company which provides a full range of banking and financialservices to businesses and consumers through its wholly owned banking subsidiary, Fulton Bank, N.A. ("Fulton Bank" or the "Bank"). In addition, the ParentCompany owns the following non-bank subsidiaries: Fulton Financial Realty Company, Central Pennsylvania Financial Corp., FFC Management, Inc., FFC PennSquare, Inc. and Fulton Insurance Services Group, Inc. Collectively, the Parent Company and its subsidiaries are referred to as the Corporation.
The Corporation’s primary sources of revenue are interest income on loans, investment securities and other interest-earning assets and fee income earned on itsproducts and services. Its expenses consist of interest expense on deposits and borrowed funds, provision for credit losses, other operating expenses and incometaxes. The Corporation’s primary competition is other financial services providers operating in its region. Competitors also include financial services providerslocated outside the Corporation’s geographic market as a result of the growth in electronic delivery channels. The Corporation is subject to the regulations ofcertain federal and state agencies and undergoes periodic examinations by such regulatory authorities.
The Corporation offers, through its banking subsidiary, a full range of retail and commercial banking services in Pennsylvania, Delaware, Maryland, New Jerseyand Virginia. Industry diversity is the key to the economic well-being of these markets and the Corporation is not dependent upon any single customer or industry.In 2017, the Corporation had six banking subsidiaries. During 2018, the Corporation consolidated two of its wholly owned banking subsidiaries into its lead bank,Fulton Bank, and during 2019, the remaining three wholly-owned banking subsidiaries were consolidated into Fulton Bank.
Basis of Financial Statement Presentation: The consolidated financial statements have been prepared in conformity with accounting principles generally acceptedin the United States ("GAAP") and include the accounts of the Parent Company and all wholly owned subsidiaries. All significant intercompany accounts andtransactions have been eliminated. The preparation of financial statements in accordance with GAAP requires management to make estimates and assumptions thataffect the reported amounts of assets and liabilities, the disclosed amount of contingent assets and liabilities as of the date of the financial statements and thereported amounts of revenues and expenses during the period. Actual results could differ from those estimates. The Corporation evaluates subsequent eventsthrough the date of the filing of this report with the Securities and Exchange Commission ("SEC").
Cash and Cash Equivalents and Restricted Cash: Cash and cash equivalents consists of cash and due from banks and interest bearing deposits with other banks,which includes restricted cash. Restricted cash comprises cash balances required to be maintained with the Federal Reserve Bank ("FRB"), based on customertransaction deposit account levels, and cash balances provided as collateral on derivative contracts and other contracts. See Note 2, "Restrictions on Cash and CashEquivalents" for additional information.
FRB and FHLB Stock: The Bank is a member of the FRB and FHLB and is required by federal law to hold stock in these institutions according to predeterminedformulas. These restricted investments are carried at cost on the consolidated balance sheets and are periodically evaluated for impairment.
Investments: Debt securities are classified as held to maturity ("HTM") at the time of purchase when the Corporation has both the intent and ability to hold theseinvestments until they mature. Such debt securities are carried at cost, adjusted for amortization of premiums and accretion of discounts using the effective yieldmethod. The Corporation does not engage in trading activities; however, since the investment portfolio serves as a source of liquidity, most debt securities areclassified as available for sale ("AFS"). AFS securities are carried at estimated fair value with the related unrealized holding gains and losses reported inshareholders’ equity as a component of other comprehensive income, net of tax. Realized securities gains and losses are computed using the specific identificationmethod and are recorded on a trade date basis.
Securities are evaluated periodically to determine whether declines in value are other-than-temporary. Impaired debt securities are determined to be other-than-temporarily impaired if the Corporation concludes at the balance sheet date that it has the intent to sell, or believes it will more likely than not be required to sell,an impaired debt security before a recovery of its amortized cost basis. Credit losses on other-than-temporarily impaired debt securities are recorded throughearnings, regardless of the intent or the requirement to sell. Credit loss is measured as the difference between the present value of an impaired debt security’sexpected cash flows and its amortized cost. Non-credit related other-than-temporary impairment ("OTTI") charges are recorded as decreases
70

to accumulated other comprehensive income as long as the Corporation has no intent or expected requirement to sell the impaired debt security before a recoveryof its amortized cost basis.
The Corporation early adopted ASU 2019-04, "Codification Improvements to Topic 326, Financial Instruments - Credit Losses, Topic 815, Derivative andHedging, and Topic 825, Financial Instruments," in the third quarter of 2019, which permitted the one-time reclassification of certain HTM securities to AFS underTopic 815, specific to the transition guidance of ASU update 2017-12, which the Corporation adopted on January 1, 2019. See “Note 3 - Investment Securities”for additional information on this reclassification. The portion of this standards update related to codification improvements specific to Topic 326 will beimplemented upon the Corporation’s adoption of ASU 2016-13 in the first quarter of 2020. Additional codification improvements to Topic 825, specifically ASU2016-01, which the Corporation adopted as of January 1, 2018, did not have an impact on the Corporation's consolidated financial statements.
Fair Value Option: The Corporation has elected to measure mortgage loans held for sale at fair value. Derivative financial instruments related to mortgagebanking activities are also recorded at fair value, as detailed under the heading "Derivative Financial Instruments," below. The Corporation determines fair value forits mortgage loans held for sale based on the price that secondary market investors would pay for loans with similar characteristics, including interest rate and term,as of the date fair value is measured. Changes in fair values during the period are recorded as components of mortgage banking income on the consolidatedstatements of income. Interest income earned on mortgage loans held for sale is classified in interest income on the consolidated statements of income.
Loans and Lease Receivables: Loan and leases are stated at their principal amount outstanding, except for mortgage loans held for sale, which are carried at fairvalue. Interest income on loans is accrued as earned. Unearned income on lease financing receivables is recognized on a basis which approximates the effectiveyield method.
In general, a loan or lease is placed on non-accrual status once it becomes 90 days delinquent as to principal or interest. In certain cases a loan or lease may beplaced on non-accrual status prior to being 90 days delinquent if there is an indication that the borrower is having difficulty making payments, or the Corporationbelieves it is probable that all amounts will not be collected according to the contractual terms of the loan or lease agreement. When interest accruals arediscontinued, unpaid interest previously credited to income is reversed. Non-accrual loans and leases may be restored to accrual status when all delinquentprincipal and interest has been paid currently for six consecutive months or the loan or lease is considered secured and in the process of collection. TheCorporation generally applies payments received on non-accruing loans and leases to principal until such time as the principal is paid off, after which time anypayments received are recognized as interest income. If the Corporation believes that all amounts outstanding on a non-accrual loan or lease will ultimately becollected, payments received subsequent to its classification as a non-accrual loan or lease are allocated between interest income and principal.
A loan or lease that is 90 days delinquent may continue to accrue interest if the loan or lease is both adequately secured and is in the process of collection. Past duestatus is determined based on contractual due dates for loan payments. An adequately secured loan or lease is one that has collateral with a supported fair valuethat is sufficient to discharge the debt, and/or has an enforceable guarantee from a financially responsible party. A loan or lease is considered to be in the processof collection if collection is proceeding through legal action or through other activities that are reasonably expected to result in repayment of the debt orrestoration to current status in the near future.
Loans and leases deemed to be a loss are written off through a charge against the allowance for loan or lease losses. Closed-end consumer loans are generallycharged off when they become 120 days past due (180 days for open-end consumer loans) if they are not adequately secured by real estate. All other loans andleases are evaluated for possible charge-off when it is probable that the balance will not be collected, based on the ability of the borrower to pay and the value ofthe underlying collateral. Principal recoveries of loans or leases previously charged off are recorded as increases to the allowance for loan or lease losses.
Loan Origination Fees and Costs: Loan origination fees and the related direct origination costs are deferred and amortized over the life of the loan as anadjustment to interest income using the effective yield method. For mortgage loans sold, net loan origination fees and costs are included in the gain or loss on saleof the related loan, as components of mortgage banking.
Troubled Debt Restructurings ("TDRs"): Loans whose terms are modified are classified as TDRs if it is determined that those borrowers are experiencingfinancial difficulty and the Corporation grants the borrowers concessions. Concessions, whether negotiated or imposed by bankruptcy, granted under a TDRtypically involve a temporary deferral of scheduled loan payments, an extension of a loan’s stated maturity date or a reduction in the interest rate. Non-accrualTDRs can be restored to accrual status if principal and interest payments, under the modified terms, are current for six consecutive months after modification.
71

Allowance for Credit Losses: The allowance for credit losses consists of the allowance for loan and lease losses and the reserve for unfunded lendingcommitments. The allowance for loan and lease losses represents management’s estimate of incurred losses in the loan and lease portfolio as of the balance sheetdate and is recorded as a reduction to loans and leases. The reserve for unfunded lending commitments represents management’s estimate of incurred losses in itsunfunded loan commitments and other off-balance sheet credit exposures, such as letters of credit, and is recorded in other liabilities on the consolidated balancesheets. The allowance for credit losses is increased by charges to expense, through the provision for credit losses, and decreased by charge-offs, net of recoveries.Management believes that the allowance for loan and lease losses and the reserve for unfunded lending commitments are adequate as of the balance sheet date;however, future changes to the allowance or reserve may be necessary based on changes in any of the factors discussed in the following paragraphs.
Maintaining an appropriate allowance for credit losses is dependent upon various factors, including the ability to identify potential problem loans and leases in atimely manner. For commercial loans, commercial mortgages and construction loans to commercial borrowers, an internal risk rating process is used. TheCorporation believes that internal risk ratings are the most relevant credit quality indicator for these types of loans. The migration of loans through the variousinternal risk rating categories is a significant component of the allowance for credit loss methodology for these loans, which bases the probability of default onthis migration. Assigning risk ratings involves judgment. The Corporation's loan review officers provide a separate assessment of risk rating accuracy. Risk ratingsmay be changed based on the ongoing monitoring procedures performed by loan officers or credit administration staff, or if specific loan review assessmentsidentify a deterioration or an improvement in the loan.
The following is a summary of the Corporation's internal risk rating categories:
• Pass: These loans do not currently pose undue credit risk and can range from the highest to average quality, depending on the degree of potential risk.
• Special Mention: These loans have a heightened credit risk, but not to the point of justifying a classification of substandard. Loans in this category arecurrently acceptable, but are nevertheless potentially weak.
• Substandard or Lower: These loans are inadequately protected by current sound worth and paying capacity of the borrower. There exists a well-definedweakness or weaknesses that jeopardize the normal repayment of the debt.
The Corporation does not assign internal risk ratings for smaller balance, homogeneous loans and leases, such as home equity, residential mortgage, consumer,lease receivables and construction loans to individuals secured by residential real estate. For these loans and leases, the most relevant credit quality indicator isdelinquency status. The migration of loans and leases through the various delinquency status categories is a significant component of the allowance for credit lossmethodology for these loans and leases, which bases the probability of default on this migration.
The Corporation’s allowance for loan and lease losses includes: 1) specific allowances allocated to loans and leases evaluated for impairment under the FinancialAccounting Standards Board's Accounting Standards Codification ("ASC") Section 310-10-35; and 2) allowances calculated for pools of loans evaluated forimpairment under ASC Subtopic 450-20.
A loan or lease is considered to be impaired if it is probable that all amounts will not be collected according to the contractual terms of the loan or lease agreement.Impaired loans and leases consist of all loans and leases on non-accrual status and accruing TDRs. An allowance for loan and lease losses is established for animpaired loan or lease if its carrying value exceeds its estimated fair value. Impaired loans and leases to borrowers with total outstanding commitments greater thanor equal to $1.0 million are evaluated individually for impairment. Impaired loans and leases to borrowers with total outstanding commitments less than $1.0million are pooled and evaluated for impairment collectively.
All loans and leases evaluated for impairment under ASC Section 310-10-35 are measured for losses on a quarterly basis. As of December 31, 2019 and 2018,substantially all of the Corporation’s impaired loans and leases to borrowers with total outstanding loan or lease balances greater than or equal to $1.0 million weremeasured based on the estimated fair value of each loan or lease’s collateral. Collateral could be in the form of real estate, in the case of impaired commercialmortgages and construction loans, or business assets, such as accounts receivable or inventory, in the case of commercial and industrial loans. Commercial andindustrial loans may also be secured by real property.
For loans and leases secured by real estate, estimated fair values are determined primarily through appraisals performed by state certified third-party appraisers,discounted to arrive at expected net sale proceeds. For collateral dependent loans, estimated real estate fair values are also net of estimated selling costs. When areal estate secured loan becomes impaired, a decision is made regarding whether an updated appraisal of the real estate is necessary. This decision is based onvarious considerations, including: the age of the most recent appraisal; the loan-to-value ratio based on the original appraisal; the condition of the property; the
72

Corporation’s experience and knowledge of the real estate market; the purpose of the loan or lease; market factors; payment status; the strength of any guarantors;and the existence and age of other indications of value such as broker price opinions, among others. The Corporation generally obtains updated appraisalsperformed by state certified third-party appraisers for impaired loans and leases secured predominantly by real estate every 12 months.
As of December 31, 2019 and 2018, approximately 93% and 89%, respectively, of impaired loans or leases with principal balances greater than or equal to $1.0million, whose primary collateral is real estate, were measured at estimated fair value using appraisals performed by state certified third-party appraisers that hadbeen updated within the preceding 12 months.
When updated appraisals are not obtained for loans and leases secured by real estate and evaluated for impairment under ASC Section 310-10-35, fair values areestimated based on the original appraisal values, as long as the original appraisal indicated an acceptable loan-to-value position and, in the opinion of theCorporation's internal credit administration staff, there has not been a significant deterioration in the collateral value since the original appraisal was performed.
For impaired loans and leases with principal balances greater than or equal to $1.0 million secured by non-real estate collateral, such as accounts receivable orinventory, estimated fair values are determined based on borrower financial statements, inventory listings, accounts receivable agings or borrowing basecertificates. Indications of value from these sources are generally discounted based on the age of the financial information or the quality of the assets. Liquidationor collection discounts are applied to these assets based upon existing loan evaluation policies.
All loans and leases not evaluated for impairment under ASC Section 310-10-35 are evaluated for impairment under ASC Subtopic 450-20, using a pooled lossevaluation approach. Loans and leases are segmented into pools with similar characteristics and a consistently developed loss factor is then applied to all loans inthese pools. Certain portfolio segments are further disaggregated and evaluated collectively for impairment based on class segments. For commercial loans, classsegments include loans secured by collateral and unsecured loans. Construction loan class segments include loans secured by commercial real estate, loans tocommercial borrowers secured by residential real estate and loans to individuals secured by residential real estate. Consumer loan class segments are based oncollateral types and include direct consumer installment loans, home equity loans and indirect automobile loans.
The Corporation segments its loan and lease portfolio by general loan and lease type, or "portfolio segments," as presented in the table under the heading, "Loansand leases, net of unearned income," within Note 4, "Loans and Leases and Allowance for Credit Losses." Certain portfolio segments are further disaggregated andevaluated collectively for impairment based on "class segments," which are largely based on the type of collateral underlying each loan and lease. For commercialloans, class segments include loans secured by collateral and unsecured loans. Construction loan class segments include loans secured by commercial real estate,loans to commercial borrowers secured by residential real estate and loans to individuals secured by residential real estate. Consumer loan class segments are basedon collateral types and include direct consumer installment loans and indirect automobile loans.
The Corporation calculates allowance for loan and lease loss allocation needs for loans evaluated under ASC Subtopic 450-20 through the following procedures:
• The loans and leases are segmented into pools with similar characteristics, as noted above. Commercial loans, commercial mortgages and constructionloans to commercial borrowers are further segmented into separate pools based on internally assigned risk ratings. Residential mortgages, home equityloans, consumer loans, and lease receivables are further segmented into separate pools based on delinquency status;
• A loss rate is calculated for each pool through an analysis of historical losses as loans and leases migrate through the various risk rating or delinquencycategories. Estimated loss rates are based on a probability of default and a loss rate forecast;
• The loss rate is adjusted to consider qualitative factors, such as economic conditions and trends; and
• The resulting adjusted loss rate is applied to the balance of the loans and leases in the pool to arrive at the allowance allocation for the pool.
The allocation of the allowance for credit losses is reviewed to evaluate its appropriateness in relation to the overall risk profile of the loan and lease portfolio. TheCorporation considers risk factors such as: local and national economic conditions; trends in delinquencies and non-accrual loans and leases; the diversity ofborrower industry types; and the composition of the portfolio by loan and lease type.
73
Premises and Equipment: Premises and equipment are stated at cost, less accumulated depreciation and amortization. The provision for depreciation andamortization is generally computed using the straight-line method over the estimated useful lives of the related assets, which are a maximum of 50 years forbuildings and improvements, 8 years for furniture and 5 years for equipment. Leasehold improvements are amortized over the shorter of the useful life or the non-cancelable lease term. See Note 5, "Premises and Equipment" for additional information.
Other Real Estate Owned ("OREO"): Assets acquired in settlement of mortgage loan indebtedness are recorded as OREO and are included in other assets on theconsolidated balance sheets, initially at the lower of the estimated fair value of the asset, less estimated selling costs, or the carrying amount of the loan. Costs tomaintain the assets and subsequent gains and losses on sales are included in other non-interest expense on the consolidated statements of income.
Mortgage Servicing Rights ("MSRs"): The estimated fair value of MSRs related to residential mortgage loans sold and serviced by the Corporation is recorded asan asset upon the sale of such loans. MSRs are amortized as a reduction to servicing income over the estimated lives of the underlying loans.
MSRs are stratified and evaluated for impairment by comparing each stratum's carrying amount to its estimated fair value. Fair values are determined through adiscounted cash flows valuation completed by a third-party valuation expert. Significant inputs to the valuation include expected net servicing income, thediscount rate and the expected lives of the underlying loans. Expected life is based on the contractual terms of the loans, as adjusted for prepayment projections.To the extent the amortized cost of the MSRs exceeds their estimated fair value, a valuation allowance is established through a charge against servicing income,included as a component of mortgage banking income on the consolidated statements of income. If subsequent valuations indicate that impairment no longerexists, the valuation allowance is reduced through an increase to servicing income. See Note 7, "Mortgage Servicing Rights" for additional information.
Derivative Financial Instruments: The Corporation manages its exposure to certain interest rate and foreign currency risks through the use of derivatives. None ofthe Corporation's outstanding derivative contracts are designated as hedges and none are entered into for speculative purposes. Derivative instruments are carried atfair value, with changes in fair value recognized in earnings as components of non-interest income or non-interest expense on the consolidated statements ofincome.
Derivative contracts create counterparty credit risk with both the Corporation's customers and with institutional derivative counterparties. The Corporation managescounterparty credit risk through its credit approval processes, monitoring procedures and obtaining adequate collateral, when the Corporation determines it isappropriate to do so and in accordance with counterparty contracts.
Mortgage Banking Derivatives
In connection with its mortgage banking activities, the Corporation enters into commitments to originate certain fixed-rate residential mortgage loans forcustomers, also referred to as interest rate locks. In addition, the Corporation enters into forward commitments for the future sales or purchases of mortgage-backed securities to or from third-party counterparties to hedge the effect of changes in interest rates on the values of both the interest rate locks and mortgageloans held for sale. Forward sales commitments may also be in the form of commitments to sell individual mortgage loans at a fixed price at a future date. Theamount necessary to settle each interest rate lock is based on the price that secondary market investors would pay for loans with similar characteristics, includinginterest rate and term, as of the date fair value is measured.
Interest Rate Swaps
The Corporation enters into interest rate swaps with certain qualifying commercial loan customers to meet their interest rate risk management needs. TheCorporation simultaneously enters into interest rate swaps with dealer counterparties, with identical notional amounts and terms. The net result of these interestrate swaps is that the customer pays a fixed rate of interest and the Corporation receives a floating rate. The Bank exceeds $10 billion in total assets and is requiredto clear all eligible interest rate swap contracts with a central counterparty. As a result, the Bank is subject to the regulations of the Commodity Futures TradingCommission.
Foreign Exchange Contracts
The Corporation enters into foreign exchange contracts to accommodate the needs of its customers. Foreign exchange contracts are commitments to buy or sellforeign currency on a specific date at a contractual price. The Corporation limits its foreign exchange exposure with customers by entering into contracts withinstitutional counterparties to mitigate its foreign exchange risk. The Corporation also holds certain amounts of foreign currency with international correspondentbanks ("Foreign Currency Nostro
74
Accounts"). The Corporation limits the total overnight net foreign currency open positions, which is defined as an aggregate of all outstanding contracts andForeign Currency Nostro Account balances, to $500,000. See "Note 10 - Derivative Financial Instruments" for additional information.
Balance Sheet Offsetting: Although certain financial assets and liabilities may be eligible for offset on the consolidated balance sheets because they are subject tomaster netting arrangements or similar agreements, the Corporation elects to not offset such qualifying assets and liabilities.
The Corporation is a party to interest rate swap transactions with financial institution counterparties and customers. Under these agreements, the Corporation hasthe right to net-settle multiple contracts with the same counterparty in the event of default on, or termination of, any one contract. Cash collateral is posted by theparty with a net liability position in accordance with contract thresholds and can be used to settle the fair value of the interest rate swap agreements in the event ofdefault. A daily settlement occurs through a clearing agent for changes in the fair value of centrally cleared derivatives. Not all of the derivatives are required to becleared through a daily clearing agent. As a result, the total fair values of interest rate swap derivative assets and derivative liabilities recognized on theconsolidated balance sheets are not equal and offsetting.
The Corporation is also a party to foreign currency exchange contracts with financial institution counterparties, under which the Corporation has the right to net-settle multiple contracts with the same counterparty in the event of default on, or termination of, any one contract. As with interest rate swap contracts, cashcollateral is posted by the party with a net liability position in accordance with contract thresholds and can be used to settle the fair value of the foreign currencyexchange contracts in the event of default.
The Corporation also enters into agreements with customers in which it sells securities subject to an obligation to repurchase the same or similar securities, referredto as repurchase agreements. Under these agreements, the Corporation may transfer legal control over the assets but still maintain effective control throughagreements that both entitle and obligate the Corporation to repurchase the assets. Therefore, repurchase agreements are reported as secured borrowings, classifiedin short-term borrowings on the consolidated balance sheets, while the securities underlying the repurchase agreements remain classified with investment securitieson the consolidated balance sheets. The Corporation has no intention of setting off these amounts, therefore, these repurchase agreements are not eligible foroffset. For additional details on balance sheet offsetting, see "Note 10 - Derivative Financial Instruments."
Income Taxes: The Corporation utilizes the asset and liability method in accounting for income taxes. Under this method, deferred tax assets and liabilities aredetermined based upon the difference between the values of the assets and liabilities as reflected in the financial statements and their related tax basis usingenacted tax rates in effect for the year in which the differences are expected to be recovered or settled. As changes in tax law or rates are enacted, deferred taxassets and liabilities are adjusted through the provision for income taxes. In assessing the realizability of deferred tax assets ("DTAs"), management considerswhether it is more likely than not that some portion or all of the DTAs will not be realized. The ultimate realization of DTAs is dependent upon the generation offuture taxable income and tax planning strategies which will create taxable income during the periods in which those temporary differences become deductible.Management considers the scheduled reversal of deferred tax liabilities, the amount of taxes paid in available carryback years, projected future taxable income, and,if necessary, tax planning strategies in making this assessment. A valuation allowance is provided against deferred tax assets unless it is more likely than not thatsuch deferred tax assets will be realized.
ASC Topic 740, "Income Taxes" creates a single model to address uncertainty in tax positions, and clarifies the accounting for uncertainty in income taxesrecognized in an enterprise's financial statements by prescribing the minimum recognition threshold a tax position is required to meet before being recognized inan enterprise's financial statements. It also provides guidance on derecognition, measurement, classification, interest and penalties, accounting in interim periods,disclosure and transition. The liability for unrecognized tax benefits is included in other liabilities within the consolidated balance sheets.
Effective January 1, 2018, the Corporation adopted ASU 2018-02, "Income Statement - Reporting Comprehensive Income (Topic 220): Reclassification of CertainTax Effects from Accumulated Other Comprehensive Income." This standards update permits a reclassification from accumulated other comprehensive income("AOCI") to retained earnings of the stranded tax effects resulting from the application of the Tax Cuts and Jobs Act of 2017 ("Tax Act"), which changed thefederal corporate income tax rate from a top rate of 35% to a flat rate of 21%. Upon adoption, the Corporation elected to reclassify $7.1 million of stranded taxeffects from AOCI to retained earnings at the beginning of the period of adoption. The Corporation's policy for releasing income tax effects from accumulatedother comprehensive income is to release them as investments are sold or mature and as pension and post-retirement liabilities are extinguished. See Note 12,"Income Taxes" for additional information.
Stock-Based Compensation: The Corporation grants equity awards to employees, consisting of stock options, restricted stock, restricted stock units ("RSUs") andperformance-based restricted stock units ("PSUs") under its Amended and Restated Equity
75

and Cash Incentive Compensation Plan ("Employee Equity Plan"). In addition, employees may purchase stock under the Corporation’s Employee Stock PurchasePlan ("ESPP").
The Corporation also grants equity awards to non-employee members of its board of directors and subsidiary bank board of directors under the 2011 Directors’Equity Participation Plan, which was amended and approved by shareholders as the Amended and Restated Directors’ Equity Participation Plan in 2019 ("Directors’Plan"). Under the Directors’ Plan, the Corporation can grant equity awards to non-employee holding company and subsidiary bank directors in the form of stockoptions, restricted stock, RSUs or common stock. Recent grants of equity awards under the Directors’ Plan have been limited to RSUs.
Equity awards issued under the Employee Equity Plan are generally granted annually and become fully vested over or after a three-year vesting period. The vestingperiod for non-performance-based awards represents the period during which employees are required to provide service in exchange for such awards. Equityawards under the Directors' Plan are generally granted annually and become fully vested after a one-year vesting period. Certain events, as defined in the EmployeeEquity Plan and the Directors' Plan, result in the acceleration of the vesting of equity awards. Restricted stock, RSUs and PSUs earn dividends during the vestingperiod, which are forfeitable if the awards do not vest.
The fair value of stock options, restricted stock and RSUs granted to employees is recognized as compensation expense over the vesting period for such awards.Compensation expense for PSUs is also recognized over the vesting period, however, compensation expense for PSUs may vary based on the expectations foractual performance relative to defined performance measures.
The fair value of restricted stock, RSUs and a majority of PSUs are based on the trading price of the Corporation's stock on the date of grant. The fair value ofcertain PSUs are estimated through the use of the Monte Carlo valuation methodology as of the date of grant. See Note 15, "Stock-Based Compensation Plans" foradditional information. The Corporation has not issued stock options since 2014 and accordingly, there is no compensation expense for this instrument.
Disclosures about Segments of an Enterprise and Related Information: The Corporation does not have any operating segments which require disclosure ofadditional information.
Financial Guarantees: Financial guarantees, which consist primarily of standby and commercial letters of credit, are accounted for by recognizing a liability equalto the fair value of the guarantees and crediting the liability to income over the term of the guarantee. Fair value is estimated based on the fees currently charged toenter into similar agreements with similar terms.
Goodwill and Intangible Assets: The Corporation accounts for its acquisitions using the purchase accounting method. Purchase accounting requires that all assetsacquired and liabilities assumed, including certain intangible assets that must be recognized, be recorded at their estimated fair values as of the acquisition date.Any purchase price exceeding the fair value of net assets acquired is recorded as goodwill.
During the fourth quarter of 2019, the Corporation early adopted ASU 2017-04 "Intangibles - Goodwill and Other (Topic 350): Simplifying the Test for GoodwillImpairment." This standards update eliminates the requirement to perform the “step two” impairment test, which the Corporation has not needed to perform sinceits impairment test completed in 2012. The Corporation performed a qualitative analysis, as permitted in Topic 350, in 2019 and no impairment indicators wereidentified through this analysis.
Goodwill is not amortized to expense, but is tested for impairment at least annually. Write-downs of the balance, if necessary as a result of the impairment test, arecharged to expense in the period in which goodwill is determined to be impaired. The Corporation performs its annual test of goodwill impairment as of October31st of each year. If certain events occur which indicate goodwill might be impaired between annual tests, goodwill would be tested when such events occur.
Intangible assets are amortized over their estimated lives. Some intangible assets have indefinite lives and are, therefore, not amortized. All intangible assets mustbe evaluated for impairment if certain events occur. Any impairment write-downs are recognized as non-interest expense on the consolidated statements ofincome. See "Note 6 - Goodwill and Intangible Assets," for additional details.
Variable Interest Entities ("VIEs") : ASC Topic 810 provides guidance on when to consolidate certain VIEs in the financial statements of the Corporation. VIEsare entities in which equity investors do not have a controlling financial interest or do not have sufficient equity at risk for the entity to finance activities withoutadditional financial support from other parties. VIEs are assessed for consolidation under ASC Topic 810 when the Corporation holds variable interests in theseentities. The Corporation consolidates VIEs when it is deemed to be the primary beneficiary. The primary beneficiary of a VIE is determined to be the party
76

that has the power to make decisions that most significantly affect the economic performance of the VIE and has the obligation to absorb losses or the right toreceive benefits that in either case could potentially be significant to the VIE.
Subsidiary Trusts
The Parent Company owns all of the common stock of three subsidiary trusts, which have issued securities (Trust Preferred Securities) in conjunction with theParent Company issuing junior subordinated deferrable interest debentures to the trusts. The terms of the junior subordinated deferrable interest debentures are thesame as the terms of the Trust Preferred Securities ("TruPS"). The Parent Company’s obligations under the debentures constitute a full and unconditionalguarantee by the Parent Company of the obligations of the trusts. The provisions of ASC Topic 810 related to subsidiary trusts, as interpreted by the SEC, disallowconsolidation of subsidiary trusts in the financial statements of the Corporation. As a result, TruPS are not included on the Corporation’s consolidated balancesheets. The junior subordinated debentures issued by the Parent Company to the subsidiary trusts, which have the same total balance and rate as the combinedequity securities and TruPS issued by the subsidiary trusts, remain in long-term debt. See "Note 9 - Short-Term Borrowings and Long-Term Debt," for additionalinformation.
Tax Credit Investments
The Corporation makes investments in certain community development projects, the majority of which, generate tax credits under various federal programs,including qualified affordable housing projects, New Markets Tax Credit Investments ("NMTC") projects and historic rehabilitation projects (collectively, "TaxCredit Investments" or "TCIs"). These investments are made throughout the Corporation's market area as a means of supporting the communities it serves. TheCorporation typically acts as a limited partner or member of a limited liability company in its TCIs and does not exert control over the operating or financialpolicies of the partnership or limited liability company. Tax credits earned are subject to recapture by federal taxing authorities based upon compliancerequirements to be met at the project level.
Because the Corporation owns 100% of the equity interests in its NMTC, these investments were consolidated based on ASC Topic 810 as of December 31, 2019and 2018. Investments in affordable housing projects were not consolidated based on management's assessment of the provisions of ASC Topic 810.
TCIs are tested for impairment when events or changes in circumstances indicate that it is more likely than not that the carrying amount of the investment will notbe realized. An impairment loss is measured as the amount by which the current carrying value exceeds its aggregated remaining value of the tax benefits of theinvestment. There were no impairment losses recognized for the Corporation’s TCIs in 2019, 2018 or 2017. For additional details, see "Note 12 - Income Taxes."
Fair Value Measurements: Assets and liabilities are categorized in a fair value hierarchy for the inputs to valuation techniques used to measure assets andliabilities at fair value using the following three categories (from highest to lowest priority):
• Level 1 - Inputs that represent quoted prices for identical instruments in active markets.• Level 2 - Inputs that represent quoted prices for similar instruments in active markets, or quoted prices for identical instruments in non-active markets.
Also includes valuation techniques whose inputs are derived principally from observable market data other than quoted prices, such as interest rates orother market-corroborated means.
• Level 3 - Inputs that are largely unobservable, as little or no market data exists for the instrument being valued.
The Corporation has categorized all assets and liabilities required to be measured at fair value on both a recurring and nonrecurring basis into the above threelevels. See "Note 19 - Fair Value Measurements," for additional details.
In 2008, the Corporation received Class B restricted shares of Visa, Inc. ("Visa") as part of Visa’s initial public offering. In accordance with ASC Update 2016-01,these securities are considered equity securities without readily determinable fair values. As such, the approximately 133,000 Visa Class B shares owned as ofDecember 31, 2019 were carried at a zero cost basis.
Revenue Recognition: The Corporation adopted ASC Update 2014-09, "Revenue from Contracts with Customers" using the modified retrospective methodapplied to all open contracts as of January 1, 2018 with no material impact on its consolidated financial statements. This update established a singlecomprehensive model for entities to use in accounting for revenue arising from contracts with customers and supersedes most current revenue recognitionguidance, including industry-specific guidance. The core principle prescribed by this standards update is that an entity recognizes revenue to depict the transfer ofpromised goods or services to customers in an amount that reflects the consideration to which the entity expects to be entitled in exchange for those goods orservices.
77

The sources of revenue for the Corporation are interest income from loans, leases and investments, net of interest expense on deposits and borrowings, and non-interest income. Non-interest income is earned from various banking and financial services that the Corporation offers through its subsidiary bank. Revenue isrecognized as earned based on contractual terms, as transactions occur, or as services are provided. Following is further detail of the various types of revenue theCorporation earns and when it is recognized:
Interest income: Interest income is recognized on an accrual basis according to loan and lease agreements, securities contracts or other such written contracts.
Wealth management services: Consists of trust commission income, brokerage income, money market income and insurance commission income. Trustcommission income consists of advisory fees that are based on market values of clients' managed portfolios and transaction fees for fiduciary servicesperformed, both of which are recognized as earned. Brokerage income includes advisory fees which are recognized as earned on a monthly basis and transactionfees that are recognized when transactions occur. Money market income is based on the balances held in trust accounts and is recognized monthly. Insurancecommission income is earned and recognized when policies are originated. Currently, no investment management and trust service income is based onperformance or investment results.
Commercial and consumer banking income: Consists of cash management, overdraft, non-sufficient fund fees and other service charges on deposit accounts aswell as branch fees, automated teller machine fees, debit and credit card income and merchant services fees. Also included are letter of credit fees, foreignexchange income and commercial loan interest rate swap fees. Revenue is primarily transactional and recognized when earned, at the time the transactionsoccur.
Mortgage banking income: Consists of gains or losses on the sale of residential mortgage loans and mortgage loan servicing income.
Other Income: Includes gains on sales of Small Business Association loans, cash surrender value of life insurance, and other miscellaneous income.
Leases: Effective January 1, 2019, the Corporation adopted ASU 2016-02, "Leases (Topic 842)." This standards update requires a lessee to recognize for all leaseswith an initial term greater than twelve months: (1) a right-of-use ("ROU") asset, which is an asset that represents the lessee’s right to use, or control the use of, aspecified asset for the lease term; and (2) a lease liability, which is a lessee’s obligation to make lease payments arising from a lease, each measured on adiscounted basis. The Corporation adopted this standards update in the first quarter of 2019 using the modified retrospective method, which eliminates therequirement to restate the earliest prior period presented in an entity’s financial statements. As such, financial information will not be updated and the disclosuresrequired under the new standard will not be provided for dates and periods before January 1, 2019 and continue to be reported in accordance with previousguidance (Topic 840). This standards update provides for a number of practical expedients in transition. The Corporation elected to apply the package of practicalexpedients permitted within the new standard, which, among other things, allowed it to carryforward the prior conclusions on lease identification, leaseclassification and initial direct costs. In addition, the Corporation elected to not separate lease and non-lease components. The Corporation did not elect thepractical expedient to apply hindsight in determining the lease term and in assessing impairment of the ROU assets.
As a lessee, the majority of the operating lease portfolio consists of real estate leases for the Corporation's branches, land and office space. The operating leaseshave remaining lease terms of 1 year to 20 years, some of which include options to extend the leases for 5 years or more. ROU assets and lease liabilities are notrecognized for leases with an initial term of 12 months or less. The Corporation does not have any finance leases as the lessee.
Certain real estate leases have lease payments that adjust based on annual changes in the Consumer Price Index ("CPI"). The leases that are dependent upon CPIare initially measured using the index or rate at the commencement date and are included in the measurement of the lease liability.
Operating lease expense represents fixed lease payments for operating leases recognized on a straight-line basis over the applicable lease term. Variable leaseexpense represents the payment of real estate taxes, insurance and common area maintenance based on the Corporation's pro-rata share.
Sublease income consists mostly of operating leases for space within the Corporation's offices and branches and is recorded as a reduction to net occupancyexpense on the consolidated statements of income. See "Note 17 - Leases" for additional information and expanded lessee disclosures.
78

Defined Benefit Pension Plan: Net periodic pension costs are funded based on the requirements of federal laws and regulations. The determination of net periodicpension costs is based on assumptions about future events that will affect the amount and timing of required benefit payments under the plan. These assumptionsinclude demographic assumptions such as retirement age and mortality, a discount rate used to determine the current benefit obligation, form of payment electionand a long-term expected rate of return on plan assets. Net periodic pension expense includes interest cost, based on the assumed discount rate, an expected returnon plan assets, amortization of prior service cost or credit and amortization of net actuarial gains or losses. For the Corporation, there is no service cost as the planwas curtailed in 2008, with no additional benefits accruing. Net periodic pension cost is recognized in salaries and employee benefits on the consolidatedstatements of income. For additional details, see "Note 16 - Employee Benefit Plans."
Recently Issued Accounting Standards:
Standard Description
Date ofAnticipated
Adoption Effect on Financial StatementsASC Update 2016-13Financial Instruments -Credit Losses (Topic326): Measurement ofCredit Losses onFinancial Instruments
The new impairment model prescribed by this standards update is a singleimpairment model for all financial assets (i.e., loans and HTMinvestments). The recognition of credit losses would be based on anentity’s current estimate of expected losses (referred to as the CurrentExpected Credit Loss model, or "CECL"), as opposed to recognition oflosses only when they are probable under current GAAP. This update alsorequires new disclosures for financial assets measured at amortized cost,loans and available-for-sale debt securities. Entities will apply thestandard's provisions as a cumulative-effect adjustment to retainedearnings as of the beginning of the first reporting period in which theguidance is adopted. This adjustment will also be recognized in regulatorycapital. This update is effective for interim and annual reporting periodsbeginning after December 15, 2019. Early adoption is permitted.
In November 2018, ASC Update 2018-19, "Codifications Improvements toTopic 326, Financial Instruments - Credit Losses" was issued whichclarifies that receivables arising from operating leases are accounted forusing lease guidance and not as financial instruments.
ASC Update 2019-04, 2019-05 and 2019-11 were issued to provide certainclarifications and transition relief to adopting this standards update.
First Quarter of2020
The Corporation intends to adopt these standards updateseffective with its March 31, 2020 quarterly report on Form10-Q.
The allowance for credit losses ("ACL") will be based onthe Corporation’s historical loss experience, borrowercharacteristics, forecasts of future economic conditions andother relevant factors.
The Corporation will use models and other loss estimationtechniques that are responsive to changes in forecastedeconomic conditions to interpret borrower and economicfactors in order to estimate the ACL. The Corporation willalso apply qualitative factors to account for information thatmay not be reflected in quantitatively derived results, orother relevant factors to ensure the ACL reflects the bestestimate of current expected credit losses.
Preliminary expected loss estimates have been determinedand the Corporation believes that the total allowance forcredit losses will increase between 25% to 35% as a resultof the adoption of CECL.
The Corporation is in the process of finalizing the review ofthe most recent model run, conducting scenario testing, andfinalizing certain assumptions including economic forecastsand qualitative adjustments.
The Corporation will be adopting the option to phase in overa three-year period the day-one impact of this standardsupdate on regulatory capital afforded to it in the Final Rulepublished in the Federal Register on February 14, 2019 byOffice of the Comptroller of the Currency, the Board ofGovernors of the Federal Reserve System and the FederalDeposit Insurance Corporation.
ASC Update 2018-13Fair ValueMeasurement (Topic820): DisclosureFramework - Changesto the DisclosureRequirements for FairValue Measurement
This update changes the fair value measurement disclosure requirementsof ASC Topic 820 "Fair Value Measurement." Among other things, theupdate modifies the disclosure objective paragraphs of ASC 820 toeliminate: (1) "at a minimum" from the phrase "an entity shall disclose at aminimum;" and (2) other similar disclosure requirements to promote theappropriate exercise of discretion by entities.
First Quarter 2020 The Corporation intends to adopt this standards updateeffective with its March 31, 2020 quarterly report on Form10-Q. This standard will impact the Corporation'sdisclosures relating to fair value measurement. TheCorporation does not expect the adoption of this update tohave a material impact on its consolidated financialstatements.
79

Standard Description
Date ofAnticipated
Adoption Effect on Financial StatementsASC Update 2018-14Compensation -Retirement Benefits -Defined Benefit Plans- General (Subtopic715-20): DisclosureFramework - Changesto the DisclosureRequirements forDefined Benefit Plans
This update amends ASC Topic 715-20 to add, remove, and clarifydisclosure requirements related to defined benefit pension and otherpostretirement plans. This update is effective for annual reporting periodsbeginning after December 15, 2020. Early adoption is permitted.
First Quarter 2021 The Corporation intends to adopt this standards updateeffective with its March 31, 2021 quarterly report on Form10-Q. This standard will impact the Corporation's disclosurerelating to employee benefit plans, but the Corporation doesnot expect the adoption of this update to have a materialimpact on its consolidated financial statements.
ASC Update 2018-15Intangibles - Goodwilland Other - InternalUse Software (Topic350-40): Customer’sAccounting forImplementation CostsIncurred in a CloudComputingArrangement That is aService Contract
This update requires a customer in a cloud computing arrangement that is aservice contract to follow the internal-use software guidance in ASCSubtopic 350-40 to determine which implementation costs to capitalize asassets. This update is effective for annual or interim reporting periodsbeginning after December 15, 2019. Early adoption is permitted.
First Quarter 2020 The Corporation intends to adopt this standards updateeffective with its March 31, 2020 quarterly report on Form10-Q and does not expect the adoption of this update tohave a material impact on its consolidated financialstatements.
ASC Update 2019-12Income Taxes (Topic740) - Simplifying theAccounting forIncome Taxes
This update simplifies the accounting for income taxes by removing certainexceptions to the general principles in Topic 740. It also improvesconsistent application of, and simplifies GAAP for, other areas of Topic740 by clarifying and amending existing guidance. This update is effectivefor fiscal years, and interim periods within those fiscal years, beginningafter December 15, 2020. Early adoption of the amendments is permitted.
First Quarter 2021 The Corporation intends to adopt this standards updateeffective with its March 31, 2021 quarterly report on Form10-Q and does not expect the adoption of this update tohave a material impact on its consolidated financialstatements.
Reclassifications: Certain amounts in the 2018 and 2017 consolidated financial statements and notes have been reclassified to conform to the 2019 presentation.
NOTE 2 – RESTRICTIONS ON CASH AND CASH EQUIVALENTS
The Corporation is required to maintain reserves against its deposit liabilities. These reserves are in the form of cash and balances with the FRB, included in"interest-bearing deposits with other banks." On the consolidated balance sheets, the amounts of such reserves as of December 31, 2019 and 2018 were $218.9million and $156.8 million, respectively.
In addition, collateral is posted by the Corporation with counterparties to secure derivative contracts and other contracts, which is included in "interest-bearingdeposits with other banks". On the consolidated balance sheets, the amounts of such collateral as of December 31, 2019 and 2018 were $199.6 million and $45.1million, respectively.
80
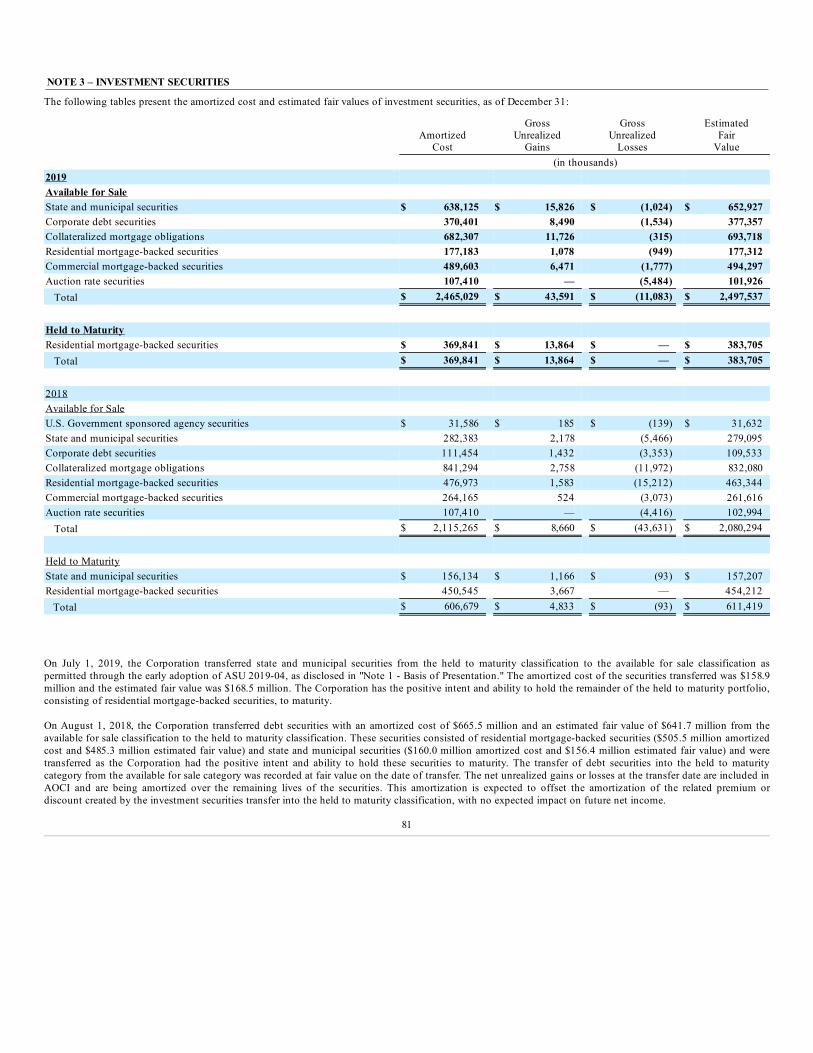
NOTE 3 – INVESTMENT SECURITIES
The following tables present the amortized cost and estimated fair values of investment securities, as of December 31:
Amortized
Cost
GrossUnrealized
Gains
GrossUnrealized
Losses
EstimatedFair
Value (in thousands)2019 Available for Sale State and municipal securities $ 638,125 $ 15,826 $ (1,024) $ 652,927Corporate debt securities 370,401 8,490 (1,534) 377,357Collateralized mortgage obligations 682,307 11,726 (315) 693,718Residential mortgage-backed securities 177,183 1,078 (949) 177,312Commercial mortgage-backed securities 489,603 6,471 (1,777) 494,297Auction rate securities 107,410 — (5,484) 101,926 Total $ 2,465,029 $ 43,591 $ (11,083) $ 2,497,537 Held to Maturity Residential mortgage-backed securities $ 369,841 $ 13,864 $ — $ 383,705 Total $ 369,841 $ 13,864 $ — $ 383,705 2018 Available for Sale U.S. Government sponsored agency securities $ 31,586 $ 185 $ (139) $ 31,632State and municipal securities 282,383 2,178 (5,466) 279,095Corporate debt securities 111,454 1,432 (3,353) 109,533Collateralized mortgage obligations 841,294 2,758 (11,972) 832,080Residential mortgage-backed securities 476,973 1,583 (15,212) 463,344Commercial mortgage-backed securities 264,165 524 (3,073) 261,616Auction rate securities 107,410 — (4,416) 102,994 Total $ 2,115,265 $ 8,660 $ (43,631) $ 2,080,294 Held to Maturity State and municipal securities $ 156,134 $ 1,166 $ (93) $ 157,207Residential mortgage-backed securities 450,545 3,667 — 454,212
Total $ 606,679 $ 4,833 $ (93) $ 611,419
On July 1, 2019, the Corporation transferred state and municipal securities from the held to maturity classification to the available for sale classification aspermitted through the early adoption of ASU 2019-04, as disclosed in "Note 1 - Basis of Presentation." The amortized cost of the securities transferred was $158.9million and the estimated fair value was $168.5 million. The Corporation has the positive intent and ability to hold the remainder of the held to maturity portfolio,consisting of residential mortgage-backed securities, to maturity.
On August 1, 2018, the Corporation transferred debt securities with an amortized cost of $665.5 million and an estimated fair value of $641.7 million from theavailable for sale classification to the held to maturity classification. These securities consisted of residential mortgage-backed securities ($505.5 million amortizedcost and $485.3 million estimated fair value) and state and municipal securities ($160.0 million amortized cost and $156.4 million estimated fair value) and weretransferred as the Corporation had the positive intent and ability to hold these securities to maturity. The transfer of debt securities into the held to maturitycategory from the available for sale category was recorded at fair value on the date of transfer. The net unrealized gains or losses at the transfer date are included inAOCI and are being amortized over the remaining lives of the securities. This amortization is expected to offset the amortization of the related premium ordiscount created by the investment securities transfer into the held to maturity classification, with no expected impact on future net income.
81
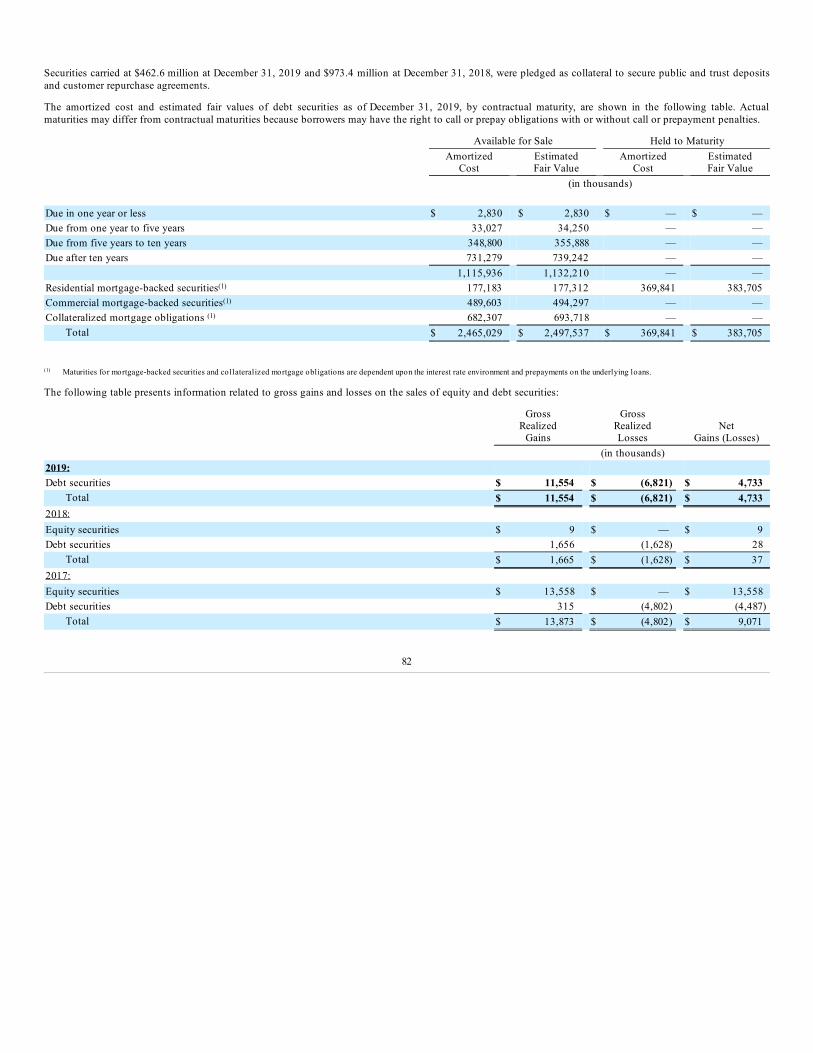
Securities carried at $462.6 million at December 31, 2019 and $973.4 million at December 31, 2018, were pledged as collateral to secure public and trust depositsand customer repurchase agreements.
The amortized cost and estimated fair values of debt securities as of December 31, 2019, by contractual maturity, are shown in the following table. Actualmaturities may differ from contractual maturities because borrowers may have the right to call or prepay obligations with or without call or prepayment penalties.
Available for Sale Held to Maturity
Amortized
Cost EstimatedFair Value
AmortizedCost
EstimatedFair Value
(in thousands) Due in one year or less $ 2,830 $ 2,830 $ — $ —Due from one year to five years 33,027 34,250 — —Due from five years to ten years 348,800 355,888 — —Due after ten years 731,279 739,242 — — 1,115,936 1,132,210 — —Residential mortgage-backed securities(1) 177,183 177,312 369,841 383,705Commercial mortgage-backed securities(1) 489,603 494,297 — —Collateralized mortgage obligations (1) 682,307 693,718 — —
Total $ 2,465,029 $ 2,497,537 $ 369,841 $ 383,705
(1) Maturities for mortgage-backed securities and collateralized mortgage obligations are dependent upon the interest rate environment and prepayments on the underlying loans.
The following table presents information related to gross gains and losses on the sales of equity and debt securities:
GrossRealized
Gains
GrossRealizedLosses
NetGains (Losses)
(in thousands)2019: Debt securities $ 11,554 $ (6,821) $ 4,733
Total $ 11,554 $ (6,821) $ 4,7332018: Equity securities $ 9 $ — $ 9Debt securities 1,656 (1,628) 28
Total $ 1,665 $ (1,628) $ 372017: Equity securities $ 13,558 $ — $ 13,558Debt securities 315 (4,802) (4,487)
Total $ 13,873 $ (4,802) $ 9,071
82

The following table presents a summary of the cumulative credit related OTTI charges, recognized as components of earnings, for debt securities held by theCorporation at December 31, 2019 and 2018:
Year ended December 31 2019 2018Balance of cumulative credit losses on debt securities, beginning of period $ (11,510) $ (11,510)Reductions for securities sold during the period 10,520 —Balance of cumulative credit losses on debt securities, end of period $ (990) $ (11,510)
The following tables present the gross unrealized losses and estimated fair values of investments, aggregated by investment category and length of time thatindividual securities have been in a continuous unrealized loss position, as of December 31:
Less Than 12 months 12 Months or Longer Total
Number ofSecurities
EstimatedFair Value
UnrealizedLosses
Number ofSecurities
EstimatedFair Value
UnrealizedLosses
EstimatedFair Value
UnrealizedLosses
2019 (dollars in thousands)
Available for Sale State and municipal securities 44 $ 136,344 $ (1,024) — $ — $ — $ 136,344 $ (1,024)
Corporate debt securities 5 30,719 (346) 8 18,759 (1,188) 49,478 (1,534)Collateralized mortgage obligations 5 33,865 (190) 1 5,330 (125) 39,195 (315)
Residential mortgage-backed securities 5 12,247 (40) 26 127,373 (909) 139,620 (949)
Commercial mortgage-backed securities 7 121,340 (1,777) — — — 121,340 (1,777)Auction rate securities — — — 177 101,926 (5,484) 101,926 (5,484)
Total available for sale (1) 66 $ 334,515 $ (3,377) 212 $ 253,388 $ (7,706) $ 587,903 $ (11,083)
(1) No held to maturity securities were in an unrealized loss position as of December 31, 2019.
Less Than 12 months 12 Months or Longer Total
Number ofSecurities
EstimatedFair Value
UnrealizedLosses
Number ofSecurities
EstimatedFair Value
UnrealizedLosses
EstimatedFair Value
UnrealizedLosses
2018 (dollars in thousands)
Available for Sale U.S. Government sponsored agency securities 1 $ 4,961 $ (31) 1 $ 5,770 $ (108) $ 10,731 $ (139)State and municipal securities 33 72,950 (1,292) 38 83,770 (4,174) 156,720 (5,466)
Corporate debt securities 8 24,419 (227) 14 25,642 (3,126) 50,061 (3,353)Collateralized mortgage obligations 39 136,563 (1,050) 89 388,173 (10,922) 524,736 (11,972)
Residential mortgage-backed securities 17 18,220 (222) 110 402,779 (14,990) 420,999 (15,212)
Commercial mortgage-backed securities 1 9,778 (35) 25 197,326 (3,038) 207,104 (3,073)Auction rate securities — — — 177 102,994 (4,416) 102,994 (4,416)
Total available for sale 99 $ 266,891 $ (2,857) 454 $ 1,206,454 $ (40,774) $ 1,473,345 $ (43,631)
Held to maturity State and municipal securities 6 20,601 (93) — — — 20,601 (93)
Total 105 $ 287,492 $ (2,950) 454 $ 1,206,454 $ (40,774) $ 1,493,946 $ (43,724)
The Corporation’s collateralized mortgage obligations and mortgage-backed securities have contractual terms that generally do not permit the issuer to settle thesecurities at a price less than the amortized cost of the investment. Because the decline in fair value of these securities is attributable to changes in interest ratesand not credit quality, and because the Corporation does not have the intent to sell and does not believe it will more likely than not be required to sell any of thesesecurities prior to a recovery of their fair value to amortized cost, the Corporation did not consider these investments to be other-than-temporarily impaired as ofDecember 31, 2019.
83

As of December 31, 2019, all auction rate certificates ("ARCs") were rated above investment grade. All of the loans underlying the ARCs have principal paymentswhich are guaranteed by the federal government. All of the loans were current and making scheduled payments and, based on management’s evaluations, were notsubject to any OTTI charges as of December 31, 2019. The Corporation does not have the intent to sell and does not believe it will more likely than not berequired to sell these securities prior to a recovery of their fair value to amortized cost, which may be at maturity.
Based on management’s evaluations, no corporate debt securities were subject to any OTTI charges as of December 31, 2019. The Corporation does not have theintent to sell and does not believe it will more likely than not be required to sell any of these securities prior to a recovery of their fair value to amortized cost,which may be at maturity.
NOTE 4 – LOANS AND LEASES AND ALLOWANCE FOR CREDIT LOSSES
Loans and leases, net of unearned incomeLoans and leases, net of unearned income are summarized as follows as of December 31:
2019 2018 (in thousands)Real estate – commercial mortgage $ 6,700,776 $ 6,434,285Commercial – industrial, financial and agricultural 4,446,701 4,404,548Real estate – residential mortgage 2,641,465 2,251,044Real estate – home equity 1,314,944 1,452,137Real estate – construction 971,079 916,599Consumer 463,164 419,186Equipment lease financing 322,625 311,866Overdrafts 3,582 2,774
Loans and leases, gross of unearned income 16,864,336 16,192,439Unearned income (26,810) (26,639)
Loans and leases, net of unearned income $ 16,837,526 $ 16,165,800
The Corporation has extended credit to officers and directors of the Corporation and to their associates. These related-party loans are made on substantially thesame terms, including interest rates and collateral, as those prevailing at the time for comparable transactions with unrelated persons and do not involve more thanthe normal risk of collection. The aggregate dollar amount of these loans, including unadvanced commitments, was $90.1 million and $116.4 million as ofDecember 31, 2019 and 2018, respectively. During 2019, additions totaled $4.2 million and repayments totaled $30.5 million for related-party loans.
Allowance for Credit Losses
The following table presents the components of the allowance for credit losses as of December 31:
2019 2018 2017 (in thousands)Allowance for loan and lease losses $ 163,622 $ 160,537 $ 169,910Reserve for unfunded lending commitments 2,587 8,873 6,174Allowance for credit losses $ 166,209 $ 169,410 $ 176,084
84
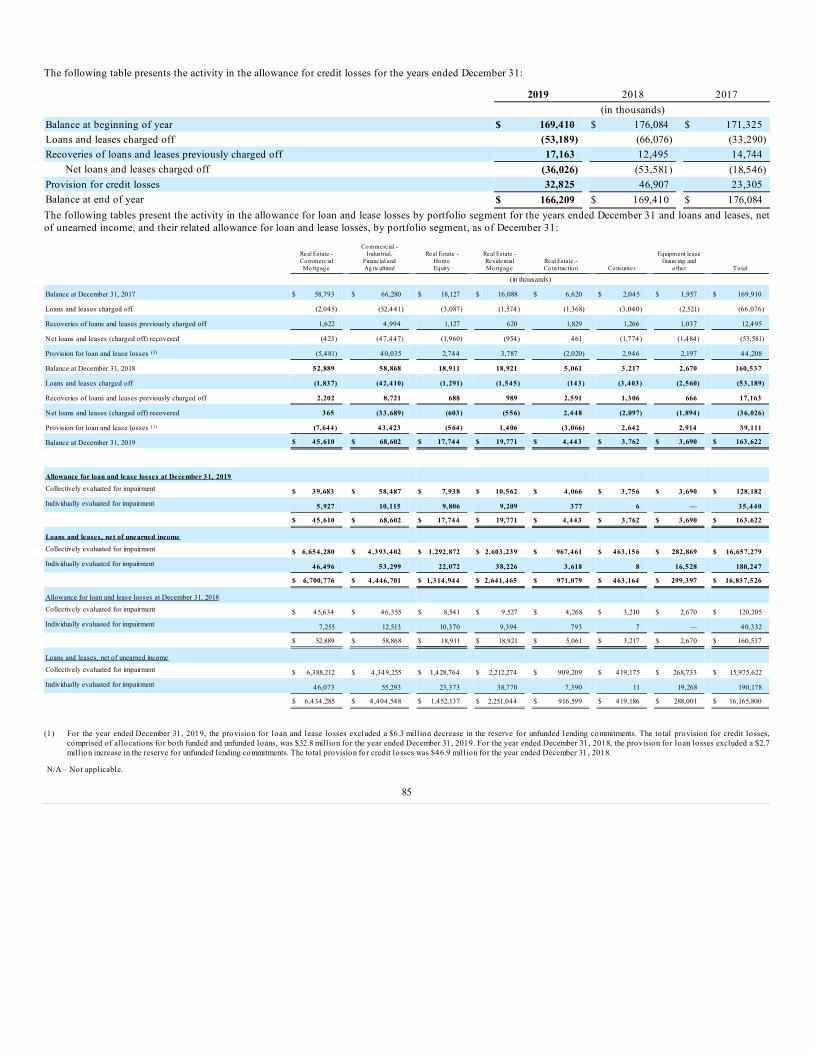
The following table presents the activity in the allowance for credit losses for the years ended December 31:
2019 2018 2017 (in thousands)Balance at beginning of year $ 169,410 $ 176,084 $ 171,325Loans and leases charged off (53,189) (66,076) (33,290)Recoveries of loans and leases previously charged off 17,163 12,495 14,744
Net loans and leases charged off (36,026) (53,581) (18,546)Provision for credit losses 32,825 46,907 23,305Balance at end of year $ 166,209 $ 169,410 $ 176,084The following tables present the activity in the allowance for loan and lease losses by portfolio segment for the years ended December 31 and loans and leases, netof unearned income, and their related allowance for loan and lease losses, by portfolio segment, as of December 31:
Real Estate -CommercialMortgage
Commercial -Industrial,
Financial andAgricultural
Real Estate -HomeEquity
Real Estate -ResidentialMortgage Real Estate -
Construction Consumer Equipment lease
financing ando ther Total
(in thousands)
Balance at December 31, 2017 $ 58,793 $ 66,280 $ 18,127 $ 16,088 $ 6,620 $ 2,045 $ 1,957 $ 169,910
Loans and leases charged off (2,045) (52,441) (3,087) (1,574) (1,368) (3,040) (2,521) (66,076)
Recoveries of loans and leases previously charged off 1,622 4,994 1,127 620 1,829 1,266 1,037 12,495
Net loans and leases (charged off) recovered (423) (47,447) (1,960) (954) 461 (1,774) (1,484) (53,581)
Provision for loan and lease losses (1) (5,481) 40,035 2,744 3,787 (2,020) 2,946 2,197 44,208
Balance at December 31, 2018 52,889 58,868 18,911 18,921 5,061 3,217 2,670 160,537
Loans and leases charged off (1,837) (42,410) (1,291) (1,545) (143) (3 ,403) (2,560) (53,189)
Recoveries of loans and leases previously charged off 2,202 8,721 688 989 2,591 1,306 666 17,163
Net loans and leases (charged off) recovered 365 (33,689) (603) (556) 2,448 (2,097) (1,894) (36,026)
Provision for loan and lease losses (1) (7,644) 43,423 (564) 1,406 (3 ,066) 2,642 2,914 39,111
Balance at December 31, 2019 $ 45,610 $ 68,602 $ 17,744 $ 19,771 $ 4,443 $ 3,762 $ 3,690 $ 163,622
Allowance for loan and lease losses at December 31, 2019 Collectively evaluated for impairment $ 39,683 $ 58,487 $ 7,938 $ 10,562 $ 4,066 $ 3,756 $ 3,690 $ 128,182
Individually evaluated for impairment 5,927 10,115 9,806 9,209 377 6 — 35,440
$ 45,610 $ 68,602 $ 17,744 $ 19,771 $ 4,443 $ 3,762 $ 3,690 $ 163,622
Loans and leases, net of unearned income Collectively evaluated for impairment $ 6,654,280 $ 4,393,402 $ 1,292,872 $ 2,603,239 $ 967,461 $ 463,156 $ 282,869 $ 16,657,279
Individually evaluated for impairment 46,496 53,299 22,072 38,226 3,618 8 16,528 180,247
$ 6,700,776 $ 4,446,701 $ 1,314,944 $ 2,641,465 $ 971,079 $ 463,164 $ 299,397 $ 16,837,526
Allowance for loan and lease losses at December 31, 2018 Collectively evaluated for impairment $ 45,634 $ 46,355 $ 8,541 $ 9,527 $ 4,268 $ 3,210 $ 2,670 $ 120,205
Individually evaluated for impairment 7,255 12,513 10,370 9,394 793 7 — 40,332
$ 52,889 $ 58,868 $ 18,911 $ 18,921 $ 5,061 $ 3,217 $ 2,670 $ 160,537
Loans and leases, net of unearned income Collectively evaluated for impairment $ 6,388,212 $ 4,349,255 $ 1,428,764 $ 2,212,274 $ 909,209 $ 419,175 $ 268,733 $ 15,975,622
Individually evaluated for impairment 46,073 55,293 23,373 38,770 7,390 11 19,268 190,178
$ 6,434,285 $ 4,404,548 $ 1,452,137 $ 2,251,044 $ 916,599 $ 419,186 $ 288,001 $ 16,165,800
(1) For the year ended December 31, 2019, the provision for loan and lease losses excluded a $6.3 million decrease in the reserve for unfunded lending commitments. The total provision for credit losses,comprised of allocations for both funded and unfunded loans, was $32.8 million for the year ended December 31, 2019. For the year ended December 31, 2018, the provision for loan losses excluded a $2.7million increase in the reserve for unfunded lending commitments. The total provision for credit losses was $46.9 million for the year ended December 31, 2018.
N/A – Not applicable.
85

Impaired Loans
The following table presents total impaired loans and leases by class segment as of December 31:
2019 2018
UnpaidPrincipalBalance
RecordedInvestment
RelatedAllowance
UnpaidPrincipalBalance
RecordedInvestment
RelatedAllowance
(in thousands)With no related allowance recorded: Real estate - commercial mortgage $ 25,005 $ 22,702 $ — $ 25,095 $ 23,481 $ —Commercial 53,533 30,208 — 33,493 26,585 —Real estate - residential mortgage 4,494 4,332 — 3,149 3,149 —Real estate - construction 6,338 2,487 — 8,980 5,083 —Equipment lease financing 19,269 16,528 — 19,269 19,268 — 108,639 76,257 89,986 77,566 With a related allowance recorded: Real estate - commercial mortgage 29,581 23,794 5,927 29,005 22,592 7,255Commercial 37,992 23,091 10,115 37,706 28,708 12,513Real estate - home equity 25,039 22,072 9,806 26,599 23,373 10,370Real estate - residential mortgage 38,483 33,894 9,209 39,972 35,621 9,394Real estate - construction 3,875 1,131 377 5,984 2,307 793Consumer 8 8 6 11 11 7 134,978 103,990 35,440 139,277 112,612 40,332Total $ 243,617 $ 180,247 $ 35,440 $ 229,263 $ 190,178 $ 40,332
As of December 31, 2019 and 2018, there were $76.3 million and $77.6 million, respectively, of impaired loans and leases that did not have a related allowance forloan loss. The estimated fair values of the collateral securing these loans and leases exceeded their carrying amount, or the loans and leases have been chargeddown to realizable collateral values. Accordingly, no specific valuation allowance was considered to be necessary.
86

The following table presents average impaired loans and leases, by class segment, for the years ended December 31:
2019 2018 2017
AverageRecorded
Investment
InterestIncome
Recognized ( 1)
AverageRecordedInvestment
InterestIncome
Recognized (1)
AverageRecordedInvestment
InterestIncome
Recognized (1)
(in thousands)With no related allowance recorded: Real estate - commercial mortgage $ 26,163 $ 368 $ 25,258 $ 368 $ 22,793 $ 281Commercial 25,777 122 33,395 259 31,357 182Real estate - residential mortgage 3,875 94 3,727 91 4,631 107Real estate - construction 3,559 — 6,943 — 7,255 12Equipment lease financing 17,814 — — — — — 77,188 584 69,323 718 66,036 582With a related allowance recorded: Real estate - commercial mortgage 25,428 351 24,300 345 27,193 338Commercial 25,717 126 24,888 185 24,112 137Real estate - home equity 23,004 845 24,426 794 21,704 534Real estate - residential mortgage 34,407 829 36,387 896 39,093 903Real estate - construction 1,573 — 2,683 — 6,160 11Consumer 9 — 16 1 33 2Equipment lease financing 83 — 3,854 — 285 — 110,221 2,151 116,554 2,221 118,580 1,925Total $ 187,409 $ 2,735 $ 185,877 $ 2,939 $ 184,616 $ 2,507
(1) All impaired loans and leases, excluding accruing TDRs, were non-accrual loans and leases. Interest income recognized for the years ended December 31, 2019, 2018 and 2017 represents amounts earned onaccruing TDRs.
Credit Quality Indicators and Non-performing Assets
The following table presents internal credit risk ratings for the indicated loan class segments as of December 31:
Pass Special Mention Substandard or Lower Total
2019 2018 2019 2018 2019 2018 2019 2018
(dollars in thousands)
Real estate - commercial mortgage $ 6,429,407 $ 6,129,463 $ 137,163 $ 170,827 $ 134,206 $ 133,995 $ 6,700,776 $ 6,434,285
Commercial - secured 3,830,847 3,902,484 171,442 193,470 195,884 129,026 4,198,173 4,224,980
Commercial -unsecured 234,987 171,589 9,665 4,016 3,876 3,963 248,528 179,568Total commercial - industrial,
financial and agricultural 4,065,834 4,074,073 181,107 197,486 199,760 132,989 4,446,701 4,404,548
Construction - commercial residential 100,808 104,079 2,897 6,912 3,461 6,881 107,166 117,872
Construction - commercial 765,562 723,030 1,322 1,163 2,676 2,533 769,560 726,726Total construction (excluding
construction - other) 866,370 827,109 4,219 8,075 6,137 9,414 876,726 844,598
Total $ 11,361,611 $ 11,030,645 $ 322,489 $ 376,388 $ 340,103 $ 276,398 $ 12,024,203 $ 11,683,431
% of Total 94.5% 94.4% 2.7% 3.2% 2.8% 2.4% 100.0% 100.0%
87

The following table presents delinquency and non-performing status for loans and leases that did not have internal credit risk ratings, by class segment, as ofDecember 31:
Performing Delinquent (1) Non-performing (2) Total
2019 2018 2019 2018 2019 2018 2019 2018
(dollars in thousands)Real estate - home equity $ 1,292,035 $ 1,431,666 $ 12,341 $ 10,702 $ 10,568 $ 9,769 $ 1,314,944 $ 1,452,137Real estate - residential mortgage 2,584,763 2,202,955 34,291 28,988 22,411 19,101 2,641,465 2,251,044Real estate - construction - other 92,649 71,511 895 — 809 490 94,353 72,001Consumer - direct 63,582 55,629 465 338 190 66 64,237 56,033Consumer - indirect 393,974 359,405 4,685 3,405 268 343 398,927 363,153
Total consumer 457,556 415,034 5,150 3,743 458 409 463,164 419,186Equipment lease financing 278,743 267,112 4,012 1,302 16,642 19,587 299,397 288,001
Total $ 4,705,746 $ 4,388,278 $ 56,689 $ 44,735 $ 50,888 $ 49,356 $ 4,813,323 $ 4,482,369
% of Total 97.8% 97.9% 1.2% 1.0% 1.0% 1.1% 100.0% 100.0%
(1) Includes all accruing loans and leases 30 days to 89 days past due.(2) Includes all accruing loans and leases 90 days or more past due and all non-accrual loans.
The following table presents total non-performing assets as of December 31:
2019 2018 (in thousands)Non-accrual loans and leases $ 125,098 $ 128,572Loans and leases 90 days or more past due and still accruing 16,057 11,106
Total non-performing loans and leases 141,155 139,678OREO 6,831 10,518
Total non-performing assets $ 147,986 $ 150,196
The following table presents past due status and non-accrual loans and leases, by portfolio segment and class segment, as of December 31:
2019
30-59Days Past
Due 60-89
Days PastDue
≥ 90 DaysPast Due
andAccruing
Non-accrual Current Total
(in thousands)
Real estate - commercial mortgage $ 10,912 $ 1,543 $ 4,113 $ 33,166 $ 6,651,042 $ 6,700,776
Commercial - secured 2,062 2,296 986 47,506 4,145,323 4,198,173
Commercial - unsecured 240 334 399 600 246,955 248,528
Total Commercial - industrial, financial and agricultural 2,302 2,630 1,385 48,106 4,392,278 4,446,701
Real estate - home equity 9,635 2,706 3,564 7,004 1,292,035 1,314,944
Real estate - residential mortgage 26,982 7,309 5,735 16,676 2,584,763 2,641,465
Construction - commercial — 900 — 19 768,641 769,560
Construction - commercial residential 820 — 64 3,414 102,868 107,166
Construction - other 895 — 624 185 92,649 94,353
Total Real estate - construction 1,715 900 688 3,618 964,158 971,079
Consumer - direct 278 187 190 — 63,582 64,237
Consumer - indirect 3,950 735 268 — 393,974 398,927
Total Consumer 4,228 922 458 — 457,556 463,164
Equipment lease financing 552 3,460 114 16,528 278,743 299,397
Total $ 56,326 $ 19,470 $ 16,057 $ 125,098 $16,620,575 $16,837,526
88

2018
30-59
Days PastDue
60-89Days Past
Due
≥ 90 DaysPast Due
andAccruing
Non-accrual Current Total
(in thousands)
Real estate - commercial mortgage $ 12,206 $ 1,500 $ 1,765 $ 30,388 $ 6,388,426 $ 6,434,285
Commercial - secured 5,227 938 1,068 49,299 4,168,448 4,224,980
Commercial - unsecured 1,598 — 51 851 177,068 179,568
Total Commercial - industrial, financial and agricultural 6,825 938 1,119 50,150 4,345,516 4,404,548
Real estate - home equity 7,144 3,558 3,061 6,708 1,431,666 1,452,137
Real estate - residential mortgage 20,796 8,192 4,433 14,668 2,202,955 2,251,044
Construction - commercial — — — 19 726,707 726,726
Construction - commercial residential 2,489 — — 6,881 108,502 117,872
Construction - other — — — 490 71,511 72,001
Total Real estate - construction 2,489 — — 7,390 906,720 916,599
Consumer - direct 267 71 66 — 55,629 56,033
Consumer - indirect 2,908 497 343 — 359,405 363,153
Total Consumer 3,175 568 409 — 415,034 419,186
Equipment lease financing 1,005 297 319 19,268 267,112 288,001
Total $ 53,640 $ 15,053 $ 11,106 $ 128,572 $ 15,957,429 $ 16,165,800
The following table presents TDRs as of December 31:
2019 2018 (in thousands)Real-estate - residential mortgage $ 21,551 $ 24,102Real estate - home equity 15,068 16,665Real-estate - commercial mortgage 13,330 15,685Commercial 5,193 5,143Consumer 8 10
Total accruing TDRs 55,150 61,605Non-accrual TDRs (1) 20,825 28,659
Total TDRs $ 75,975 $ 90,264 (1) Included within non-accrual loans in the preceding table.
The following table presents TDRs by class segment and type of concession for loans that were modified during the years ended December 31:
2019 2018 2017
Number ofLoans
Post-ModificationRecorded
Investment Number of
Loans
Post-ModificationRecorded
Investment Number of
Loans
Post-Modification
RecordedInvestment
(dollars in thousands) Commercial 16 $ 5,378 8 $ 4,226 24 $ 15,548 Real estate - commercial mortgage 2 263 6 8,261 10 2,911 Real estate - home equity 59 2,706 96 5,087 97 7,656 Real estate - residential mortgage 6 2,252 7 801 10 1,904 Real estate - construction — — — — 2 1,615 Total 83 $ 10,599 117 $ 18,375 143 $ 29,634
89

The following table presents TDRs, by class segment, that were modified during the years ended December 31, 2019, 2018 and 2017 that had a post-modificationpayment default during their respective year of modification. A payment default is defined as a single missed scheduled payment:
2019 2018 2017
Number of
Loans Recorded
Investment Number of
Loans Recorded
Investment Number of
Loans Recorded
Investment (dollars in thousands)Real estate -construction — — 2 448 4 2,152Real estate - residential mortgage 2 521 5 717 5 577Commercial 5 442 1 2,163 6 1,571Real estate - home equity 18 1,003 30 1,635 25 1,575 Total 25 $ 1,966 38 $ 4,963 40 $ 5,875
NOTE 5 – PREMISES AND EQUIPMENT
The following is a summary of premises and equipment as of December 31:
2019 2018 (in thousands)Land $ 38,836 $ 35,160Buildings and improvements 350,609 325,831Furniture and equipment 158,064 150,566Construction in progress 9,594 24,993 557,103 536,550Less: Accumulated depreciation and amortization (317,057) (302,021) Total $ 240,046 $ 234,529
NOTE 6 – GOODWILL AND INTANGIBLE ASSETS
Goodwill totaled $532.7 million and $530.6 million as of December 31, 2019 and 2018, respectively. A non-amortizing trade name intangible asset that totaled$1.0 million as of December 31, 2018 was written off during 2019 as a result of the consolidation of the Corporation's banking subsidiaries into Fulton Bank. Theincrease in total goodwill of $2.1 million was the result of acquisitions of the assets of two wealth management businesses in 2019. The Corporation’s reportingunits passed the 2019 goodwill impairment test, resulting in no goodwill impairment charges in 2019.
The estimated fair values of the Corporation’s reporting units are subject to uncertainty, including future changes in fair values of banks in general and futureoperating results of reporting units, which could differ significantly from the assumptions used in the current valuation of reporting units.
NOTE 7 – MORTGAGE SERVICING RIGHTS
The following table summarizes the changes in MSRs, which are included in other assets on the consolidated balance sheets:
2019 2018 (in thousands)Amortized cost: Balance at beginning of year $ 38,573 $ 37,663Originations of MSRs 7,546 6,756Amortization (6,852) (5,846)
Balance at end of year $ 39,267 $ 38,573
90

MSRs represent the economic value of existing contractual rights to service mortgage loans that have been sold. The total portfolio of mortgage loans serviced bythe Corporation for unrelated third parties was $4.9 billion and $4.8 billion as of December 31, 2019 and 2018, respectively. Actual and expected prepayments ofthe underlying mortgage loans can impact the value of MSRs. The Corporation accounts for MSRs at the lower of amortized cost or fair value.
The fair value of MSRs is estimated by discounting the estimated cash flows from servicing income, net of expense, over the expected life of the underlying loansat a discount rate commensurate with the risk associated with these assets. Expected life is based on the contractual terms of the loans, as adjusted for prepaymentprojections. The fair values of MSRs were $45.2 million and $50.2 million as of December 31, 2019 and 2018, respectively.
Total MSR amortization expense, recognized as a reduction to mortgage banking income in the consolidated statements of income, was $6.9 million and $5.8million in 2019 and 2018, respectively. Estimated MSR amortization expense for the next five years, based on balances as of December 31, 2019 and the estimatedremaining lives of the underlying loans, follows (in thousands):
Year
2020 $ 6,5912021 6,1442022 5,6482023 5,1012024 4,499
NOTE 8 – DEPOSITS
Deposits consisted of the following as of December 31:
2019 2018 (in thousands)Noninterest-bearing demand $ 4,453,324 $ 4,310,105Interest-bearing demand 4,720,188 4,240,974Savings and money market accounts 5,153,941 4,926,937
Total demand and savings 14,327,453 13,478,016Brokered deposits 264,531 176,239Time deposits 2,801,929 2,721,904
Total Deposits $ 17,393,913 $ 16,376,159
The scheduled maturities of time deposits as of December 31, 2019 were as follows (in thousands):
Year
2020 $ 1,636,3572021 529,3782022 436,9092023 109,0442024 43,141Thereafter 47,100 $ 2,801,929
Included in time deposits were certificates of deposit equal to or greater than $100,000 of $1.4 billion and $1.2 billion as of December 31, 2019 and 2018,respectively. Time deposits of $250,000 or more were $472.8 million and $425.1 million as of December 31, 2019 and 2018, respectively.
91

NOTE 9 – SHORT-TERM BORROWINGS AND LONG-TERM DEBT
Short-term borrowings as of December 31, 2019, 2018 and 2017 and the related maximum amounts outstanding at the end of any month in each of the three yearsthen ended are presented below. The securities underlying the repurchase agreements remain in available for sale investment securities.
December 31, Maximum Outstanding 2019 2018 2017 2019 2018 2017 (in thousands)Federal funds purchased $ — $ — $ 220,000 $ 274,998 $ 525,000 $ 387,110Short-term FHLB advances (1) 500,000 385,000 — 825,000 385,000 250,000Customer repurchase agreements 56,707 43,500 172,017 64,745 181,989 233,274Customer short-term promissory notes 326,534 326,277 225,507 339,461 365,689 237,298
Total Short-term borrowings $ 883,241 $ 754,777 $ 617,524
(1) Represents FHLB advances with an original maturity term of less than one year.
As of December 31, 2019, the Corporation had aggregate availability under federal funds lines of $1.7 billion. A combination of commercial real estate loans,commercial loans and securities were pledged to the FRB to provide access to FRB Discount Window borrowings. As of December 31, 2019 and 2018, theCorporation had $334.3 million and $505.2 million, respectively, of collateralized borrowing availability at the FRB Discount Window, and no outstandingborrowings.
The following table presents information related to customer repurchase agreements:
2019 2018 2017 (dollars in thousands)Amount outstanding as of December 31 $ 56,707 $ 43,500 $ 172,017Weighted average interest rate as of December 31 0.69% 0.25% 0.13%Average amount outstanding during the year $ 58,383 $ 138,198 $ 188,974Weighted average interest rate during the year 0.67% 0.21% 0.12%
FHLB advances with an original maturity of one year or more and long-term debt included the following as of December 31:
2019 2018 (in thousands)FHLB advances $ 491,024 $ 601,978Subordinated debt 250,000 250,000Senior notes 125,000 125,000Junior subordinated deferrable interest debentures 16,496 16,496Unamortized discounts and issuance costs (751) (1,195) $ 881,769 $ 992,279
Excluded from the preceding table is the Parent Company’s revolving line of credit with Fulton Bank. As of December 31, 2019 and 2018, there were no amountsoutstanding under this line of credit. This line of credit, with a total commitment of $75.0 million, is secured by insurance investments and bears interest at theLondon Interbank Offered Rate ("LIBOR") for maturities of one month plus 2.00%. The amount that the Corporation is permitted to borrow under thiscommitment at any given time is subject to a formula based on a percentage of the value of the collateral pledged. Although balances drawn on the line of creditand related interest income and expense are eliminated in the consolidated financial statements, this borrowing arrangement is senior to the subordinated debt andthe junior subordinated deferrable interest debentures.
FHLB advances mature through March 2027 and carry a weighted average interest rate of 1.94%. As of December 31, 2019, the Corporation had additionalborrowing capacity of approximately $3.7 billion with the FHLB. Advances from the FHLB are secured by FHLB stock, qualifying residential mortgages,investments and other assets.
92

The following table summarizes the scheduled maturities of FHLB advances with an original maturity of one year or more and long-term debt as of December 31,2019 (in thousands):
Year
2020 $ —2021 48,4412022 210,1952023 214,5362024 389,694Thereafter 18,903 $ 881,769
I n March 2017, the Corporation issued $125.0 million of senior notes, with a fixed rate of 3.60% and an effective rate of 3.95%, as a result of discounts andissuance costs, which mature on March 16, 2022. Interest is paid semi-annually in September and March. In June 2015, the Corporation issued $150.0 million ofsubordinated notes, which mature on November 15, 2024 and carry a fixed rate of 4.50% and an effective rate of 4.69% as a result of discounts and issuance costs.Interest is paid semi-annually in May and November. In November 2014, the Corporation issued $100.0 million of subordinated notes, which mature on November15, 2024 and carry a fixed rate of 4.50% and an effective rate of 4.87% as a result of discounts and issuance costs. Interest is paid semi-annually in May andNovember.
As of December 31, 2019, the Parent Company owned all of the common stock of three subsidiary trusts, which have issued TruPS in conjunction with the ParentCompany issuing junior subordinated deferrable interest debentures to the trusts. The TruPS are redeemable on specified dates, or earlier if certain events arise.
The following table provides details of the debentures as of December 31, 2019 (dollars in thousands):
Debentures Issued toFixed/
Variable Interest
Rate Amount Maturity Callable Call PriceColumbia Bancorp Statutory Trust Variable 4.59% $ 6,186 06/30/34 03/31/20 100.0Columbia Bancorp Statutory Trust II Variable 3.78% 4,124 03/15/35 03/15/20 100.0Columbia Bancorp Statutory Trust III Variable 3.66% 6,186 06/15/35 03/15/20 100.0 $ 16,496
93

NOTE 10 – DERIVATIVE FINANCIAL INSTRUMENTS
The following table presents the notional amounts and fair values of derivative financial instruments as of December 31:
2019 2018
NotionalAmount
Asset(Liability)Fair Value
NotionalAmount
Asset(Liability)Fair Value
(in thousands)Interest Rate Locks with Customers Positive fair values $ 132,260 $ 1,123 $ 101,700 $ 1,148Negative fair values 9,783 (53) 1,646 (12)Forward Commitments Positive fair values 75,000 63 1,540 3Negative fair values 180,000 (371) 83,562 (1,066)Interest Rate Swaps with Customers Positive fair values 2,903,489 143,484 1,185,144 33,258Negative fair values 376,705 (695) 1,386,046 (30,769)Interest Rate Swaps with Dealer Counterparties Positive fair values 376,705 695 1,386,046 28,143Negative fair values 2,903,489 (75,327) 1,185,144 (16,338)Foreign Exchange Contracts with Customers Positive fair values 3,373 38 5,881 105Negative fair values 7,283 (154) 9,690 (251)Foreign Exchange Contracts with Correspondent Banks Positive fair values 9,028 192 9,220 287Negative fair values 4,976 (45) 6,831 (130)
The following table presents the fair value gains (losses) on derivative financial instruments for the years ended December 31:
Statement of Income Classification 2019 2018 2017 (in thousands)Mortgage banking derivatives (1) Mortgage banking $ 689 $ (748) $ (1,926)Interest rate swaps Other expense 122 1 (89)Foreign exchange contracts Other income 20 (75) 9 Net fair value gains on derivative financial instruments $ 831 $ (822) $ (2,006)
(1) Includes interest rate locks with customers and forward commitments.
Fair Value Option
The Corporation has elected to measure mortgage loans held for sale at fair value. The following table presents a summary of mortgage loans held for sale and theimpact of the fair value election on the consolidated financial statements as of December 31,:
2019 2018 (in thousands)Amortized cost (1) $ 37,396 $ 26,407Fair value 37,828 27,099(1) Cost basis of mortgage loans held for sale represents the unpaid principal balance.
Losses related to changes in fair values of mortgage loans held for sale were $260,000 for the year ended December 31, 2019 and gains related to changes in fairvalues of mortgage loans held for sale were $231,000 and $472,000 for the years ended December 31,
94

2018 and 2017, respectively, which are recorded on the consolidated income statements as an adjustment to mortgage banking income.
Balance Sheet Offsetting
The fair values of interest rate swap agreements and foreign exchange contracts the Corporation enters into with customers and dealer counterparties may beeligible for offset on the consolidated balance sheets if they are subject to master netting arrangements or similar agreements. The Corporation elects to not offsetassets and liabilities subject to such arrangements on the consolidated financial statements. The following table presents the financial instruments that are eligiblefor offset, and the effects of offsetting, on the consolidated balance sheets as of December 31:
Gross
Amounts Gross Amounts Not Offset Recognized on the Consolidated on the Balance Sheets Consolidated Financial Cash Net
BalanceSheets Instruments (1) Collateral (2) Amount
(in thousands)2019 Interest rate swap derivative assets $ 144,179 $ (757) $ — $ 143,422Foreign exchange derivative assets with correspondentbanks 192 (45) — 147 Total $ 144,371 $ (802) $ — $ 143,569 Interest rate swap derivative liabilities $ 76,022 $ (757) $ (75,265) $ —
Foreign exchange derivative liabilities with correspondentbanks 45 (45) — —
Total $ 76,067 $ (802) $ (75,265) $ — 2018 Interest rate swap derivative assets $ 61,401 $ (12,955) $ (23,270) $ 25,176Foreign exchange derivative assets with correspondentbanks 287 (130) — 157 Total $ 61,688 $ (13,085) $ (23,270) $ 25,333 Interest rate swap derivative liabilities $ 47,107 $ (22,786) $ (22,786) $ 1,535Foreign exchange derivative liabilities with correspondentbanks 130 (130) — — Total $ 47,237 $ (22,916) $ (22,786) $ 1,535
(1) For interest rate swap assets, amounts represent any derivative liability fair values that could be offset in the event of counterparty or customer default. For interest rate swap liabilities, amounts represent anyderivative asset fair values that could be offset in the event of counterparty or customer default.
(2) Amounts represent cash collateral (pledged by the Corporation) or received from the counterparty on interest rate swap transactions and foreign exchange contracts with financial institution counterparties.Interest rate swaps with customers are collateralized by the same collateral securing the underlying loans to those borrowers. Cash collateral amounts are included in the table only to the extent of the netderivative fair values.
95
NOTE 11 – REGULATORY MATTERS
Regulatory Capital RequirementsThe Corporation and the Bank are subject to regulatory capital requirements administered by banking regulators. Failure to meet minimum capital requirements cantrigger certain mandatory – and possibly additional discretionary – actions by regulators that, if undertaken, could have a direct material effect on the Corporation’sfinancial statements. Under capital adequacy guidelines and the regulatory framework for prompt corrective action, the Bank must meet specific capital guidelinesthat involve quantitative measures of its assets, liabilities, and certain off-balance sheet items as calculated under regulatory accounting practices. The Bank'scapital amounts and classification are also subject to qualitative judgments by the regulators about components, risk weightings, and other factors.
U.S. Basel III Capital Rules
In July 2013, the FRB approved final rules (the "U.S. Basel III Capital Rules") establishing a new comprehensive capital framework for U.S. banking organizationsand implementing the Basel Committee on Banking Supervision's December 2010 framework for strengthening international capital standards. The U.S. Basel IIICapital Rules substantially revised the risk-based capital requirements applicable to bank holding companies and depository institutions.
The minimum regulatory capital requirements established by the U.S. Basel III Capital Rules became effective on January 1, 2015, and became fully phased in onJanuary 1, 2019. The U.S. Basel III Capital Rules require the Corporation and the Bank to:
• Meet a minimum Common Equity Tier 1 capital ratio of 4.50% of risk-weighted assets and a minimum Tier 1 capital of 6.00% of risk-weighted assets;
• Meet a minimum Total capital ratio of 8.00% of risk-weighted assets and a minimum Tier 1 leverage capital ratio of 4.00% of average assets;
• Maintain a "capital conservation buffer" of 2.50% above the minimum risk-based capital requirements, which must be maintained to avoid restrictions oncapital distributions and certain discretionary bonus payments; and
• Comply with a revised definition of capital to improve the ability of regulatory capital instruments to absorb losses. Certain non-qualifying capitalinstruments, including cumulative preferred stock and TruPS, are excluded as a component of Tier 1 capital for institutions of the Corporation's size.
The U.S. Basel III Capital Rules use a standardized approach for risk weightings that expand the risk-weightings for assets and off-balance sheet exposures fromthe previous 0%, 20%, 50% and 100% categories to a much larger and more risk-sensitive number of categories, depending on the nature of the assets and off-balance sheet exposures, resulting in higher risk weights for a variety of asset categories.
Effective January 1, 2019, the Corporation and the Bank were also required to maintain a "capital conservation buffer" of 2.50% above the minimum risk-basedcapital requirements. The rules provide that the failure to maintain the "capital conservation buffer" results in restrictions on capital distributions and discretionarycash bonus payments to executive officers. As a result, under the U.S. Basel III Capital Rules, if the Bank fails to maintain the required minimum capitalconservation buffer, the Corporation will be subject to limits, and possibly prohibitions, on its ability to obtain capital distributions from such subsidiaries. If theCorporation does not receive sufficient cash dividends from the Bank, it may not have sufficient funds to pay dividends on its common stock, service its debtobligations or repurchase its common stock.
As of December 31, 2019, the Corporation's capital levels met the fully phased-in minimum capital requirements, including the new capital conservation buffers,as prescribed in the U.S. Basel III Capital Rules.
As of December 31, 2019, the Bank was well capitalized under the regulatory framework for prompt corrective action based on their capital ratio calculation. As ofDecember 31, 2018, each of the Corporation’s subsidiary banks was well capitalized under the regulatory framework for prompt corrective action based on theircapital ratio calculations. To be categorized as well capitalized, these banks were required to maintain minimum total risk-based, Tier I risk-based, Common EquityTier I risk-based and Tier I leverage ratios as set forth in the following table. There are no conditions or events since December 31, 2019 that management believeshave changed the institutions’ categories.
96

The following tables present the Total risk-based, Tier I risk-based, Common Equity Tier I risk-based and Tier I leverage requirements under the U.S. Basel IIICapital Rules, as of December 31:
2019
Actual For Capital
Adequacy Purposes Well Capitalized Amount Ratio Amount Ratio Amount Ratio (dollars in thousands)Total Capital (to Risk-Weighted Assets):
Corporation $ 2,179,197 11.8% $ 1,481,425 8.0% N/A N/AFulton Bank, N.A. 2,224,505 12.1 1,473,880 8.0 $ 1,842,350 10.0%
Tier I Capital (to Risk-Weighted Assets): Corporation $ 1,796,987 9.7% $ 1,111,068 6.0% N/A N/AFulton Bank, N.A 2,058,295 11.2 1,105,410 6.0 $ 1,473,880 8.0%
Common Equity Tier I Capital (to Risk-Weighted Assets): Corporation $ 1,796,987 9.7% $ 833,301 4.5% N/A N/AFulton Bank, N.A 2,014,295 10.9 829,057 4.5 $ 1,197,527 6.5%
Tier I Leverage Capital (to Average Assets): Corporation $ 1,796,987 8.4% $ 850,727 4.0% N/A N/AFulton Bank, N.A 2,058,295 9.8 844,341 4.0 $ 1,055,426 5.0%
N/A – Not applicable as "well capitalized" applies to banks only.
97

2018
Actual For Capital
Adequacy Purposes Well Capitalized Amount Ratio Amount Ratio Amount Ratio (dollars in thousands)Total Capital (to Risk-Weighted Assets):
Corporation $ 2,200,257 12.8% $ 1,380,905 8.0% N/A N/AFulton Bank, N.A. 1,319,090 12.1 871,413 8.0 $ 1,089,267 10.0%Fulton Bank of New Jersey 418,207 13.3 250,999 8.0 313,748 10.0The Columbia Bank 266,661 12.9 165,676 8.0 207,094 10.0Lafayette Ambassador Bank 180,604 16.0 90,077 8.0 112,596 10.0
Tier I Capital (to Risk-Weighted Assets): Corporation $ 1,764,847 10.2% $ 1,035,679 6.0% N/A N/AFulton Bank, N.A 1,225,797 11.3 653,560 6.0 $ 871,413 8.0%Fulton Bank of New Jersey 378,962 12.1 188,249 6.0 250,999 8.0The Columbia Bank 242,668 11.7 124,257 6.0 165,676 8.0Lafayette Ambassador Bank 169,835 15.1 67,558 6.0 90,077 8.0
Common Equity Tier I Capital (to Risk-Weighted Assets): Corporation $ 1,764,847 10.2% $ 776,759 4.5% N/A N/AFulton Bank, N.A 1,181,797 10.8 490,170 4.5 $ 708,023 6.5%Fulton Bank of New Jersey 378,962 12.1 141,187 4.5 203,936 6.5The Columbia Bank 242,668 11.7 93,192 4.5 134,611 6.5Lafayette Ambassador Bank 169,835 15.1 50,668 4.5 73,187 6.5
Tier I Leverage Capital (to Average Assets): Corporation $ 1,764,847 9.0% $ 783,118 4.0% N/A N/AFulton Bank, N.A 1,225,797 10.0 487,992 4.0 $ 609,989 5.0%Fulton Bank of New Jersey 378,962 9.4 162,098 4.0 202,623 5.0The Columbia Bank 242,668 10.1 96,269 4.0 120,336 5.0Lafayette Ambassador Bank 169,835 10.9 62,520 4.0 78,150 5.0
N/A – Not applicable as "well capitalized" applies to banks only.
Dividend and Loan LimitationsThe dividends that may be paid by the Bank to the Parent Company are subject to certain legal and regulatory limitations. The total amount available for paymentof dividends by the Bank to the Corporation was approximately $150 million as of December 31, 2019, based on the Bank maintaining enough capital to beconsidered well capitalized under the U.S. Basel III Capital Rules.
Under current regulations, the Bank is limited in the amount it may loan to its affiliates, including the Parent Company. Loans to a single affiliate may not exceed10%, and the aggregate of loans to all affiliates may not exceed 20% of the Bank's regulatory capital.
98

NOTE 12 – INCOME TAXESThe components of the provision for income taxes are as follows:
2019 2018 2017 (in thousands)Current tax expense:
Federal $ 32,610 $ 35,783 $ 19,553State 5,204 5,352 2,617
37,814 41,135 22,170Deferred tax (benefit) expense:
Federal (1,271) (16,841) 39,885State 1,106 283 646
(165) (16,558) 40,531Total income tax expense $ 37,649 $ 24,577 $ 62,701
The differences between the effective income tax rate and the federal statutory income tax rate are as follows:
2019 2018 2017Statutory tax rate 21.0 % 21.0 % 35.0 %Tax credit investments (4.6) (6.1) (7.8)Tax-exempt income (3.9) (4.1) (6.6)Bank owned life insurance (0.4) (0.4) (0.4)State income taxes, net of federal benefit 0.2 2.0 (0.5)Change in valuation allowance 1.8 (0.1) 1.2Re-measurement of net deferred tax asset due to the Tax Act — (0.3) 6.7Executive compensation — 0.1 0.1Other, net 0.2 (1.6) (1.0)Effective income tax rate 14.3 % 10.5 % 26.7 %
99

The net deferred tax asset recorded by the Corporation is included in other assets and consists of the following tax effects of temporary differences as ofDecember 31:
2019 2018 (in thousands)Deferred tax assets:
Tax credit carryforwards $ 43,133 $ 27,615Allowance for credit losses 37,081 37,906State loss carryforwards 16,324 11,605Other accrued expenses 8,797 7,232Deferred compensation 7,752 7,064Tax credit investments 6,799 4,529Stock-based compensation 2,930 2,743Postretirement and defined benefit plans 599 5,079OTTI 462 1,803Unrealized holding losses on securities — 12,489Other 3,784 3,855
Total gross deferred tax assets 127,661 121,920Deferred tax liabilities:
Equipment lease financing 42,273 31,466MSRs 8,686 8,560Premises and equipment 6,282 3,579Acquisition premiums/discounts 5,266 5,294Unrealized holding gains on securities available for sale 4,223 —Intangible assets 1,136 1,292Other 12,387 12,178
Total gross deferred tax liabilities 80,253 62,369Net deferred tax asset, before valuation allowance 47,408 59,551Valuation allowance (16,324) (11,605)Net deferred tax asset $ 31,084 $ 47,946
In assessing the realizability of deferred tax assets, management considers whether it is more likely than not that some or all of the deferred tax assets will not berealized. The ultimate realization of deferred tax assets is dependent upon the generation of future taxable income and/or capital gain income during periods inwhich those temporary differences become deductible. Management considers the scheduled reversal of deferred tax liabilities, projected future taxable income andtax planning strategies, such as those that may be implemented to generate capital gains, in making this assessment.
The valuation allowance relates to state deferred tax assets and net operating loss carryforwards for which realizability is uncertain. As of December 31, 2019 and2018, the Corporation had state net operating loss carryforwards of approximately $392.0 million and $347.3 million, respectively, which are available to offsetfuture state taxable income, and expire at various dates through 2038.
Based on the level of historical taxable income and projections for future taxable income over the periods in which the deferred tax assets are deductible,management believes it is more likely than not that the Corporation will realize the benefits of its deferred tax assets, net of the valuation allowance, as ofDecember 31, 2019.
As of December 31, 2019, the Corporation had tax credit carryforwards related to TCIs of approximately $43 million. The corporation recorded a deferred tax assetof $43.1 million, reflecting the benefit of these tax credit carryforwards. Such deferred tax asset will begin to expire in 2038 if not yet utilized.
100

Uncertain Tax PositionsThe following table summarizes the changes in unrecognized tax benefits for the years ended December 31:
2019 2018 2017 (in thousands)Balance at beginning of year $ 2,726 $ 2,550 $ 2,438Current period tax positions 292 593 523Lapse of statute of limitations (501) (417) (411)Balance at end of year $ 2,517 $ 2,726 $ 2,550
Virtually all of the Corporation’s unrecognized tax benefits are for positions that are taken on an annual basis on state tax returns. Increases to unrecognized taxbenefits will occur as a result of accruing for the nonrecognition of the position for the current year.Decreases will occur as a result of the lapsing of the statute of limitations for the oldest outstanding year which includes the position. These offsetting increasesand decreases are likely to continue in the future, including over the next twelve months. While the net effect on total unrecognized tax benefits during this periodcannot be reasonably estimated, approximately $460,000 is expected to reverse in 2020 due to lapsing of the statute of limitations. Decreases can also occurthroughout the settlement of positions with taxing authorities.
As of December 31, 2019, if recognized, all of the Corporation’s unrecognized tax benefits would impact the effective tax rate. Not included in the table above is$549,000 of federal income tax benefit on unrecognized state tax benefits which, if recognized, would also impact the effective tax rate. Interest accrued related tounrecognized tax benefits is recorded as a component of income tax expense. Penalties, if incurred, would also be recognized in income tax expense. TheCorporation recognized approximately $22,000 and $59,000 in 2019 and 2018, respectively, for interest and penalties in income tax expense related tounrecognized tax positions. As of December 31, 2019 and 2018, total accrued interest and penalties related to unrecognized tax positions were approximately$697,000 and $675,000, respectively.
The Corporation files income tax returns in the federal and various state jurisdictions. In most cases, unrecognized tax benefits are related to tax years that remainsubject to examination by the relevant taxing authorities. With few exceptions, the Corporation is no longer subject to federal, state and local examinations by taxauthorities for years before 2016.
Tax Credit Investments ("TCIs")
The TCIs are included in other assets, with any unfunded equity commitments recorded in other liabilities on the consolidated balance sheets. Certain TCIs qualifyfor the proportional amortization method and are amortized over the period the Corporation expects to receive the tax credits, with the expense included withinincome taxes on the consolidated statements of income. Other TCIs are accounted for under the equity method of accounting, with amortization included withinnon-interest expense on the consolidated statements of income. This amortization includes equity in partnership losses and the systematic write-down ofinvestments over the period in which income tax credits are earned. All of the TCIs are evaluated for impairment at the end of each reporting period.
The following table presents the balances of the Corporation's TCIs and related unfunded commitments as of December 31:
2019 2018Included in other assets: (in thousands)Affordable housing tax credit investments, net $ 153,351 $ 170,401Other tax credit investments, net 64,354 72,584 Total TCIs, net $ 217,705 $ 242,985Included in other liabilities: Unfunded affordable housing tax credit commitments $ 16,684 $ 23,196Other tax credit liabilities 55,105 59,823 Total unfunded tax credit commitments and liabilities $ 71,789 $ 83,019
101

The following table presents other information relating to the Corporation's TCIs for the years ended December 31:
2019 2018 2017 (in thousands)Components of income taxes: Affordable housing tax credits and other tax benefits $ (30,642) $ (30,721) $ (25,642)Other tax credit investment credits and tax benefits (4,542) (6,385) (15,791)Amortization of affordable housing investments, net of tax benefit 22,184 21,569 16,958Deferred tax expense 954 1,341 6,201 Total reduction in income tax expense $ (12,046) $ (14,196) $ (18,274)Amortization of TCIs: Affordable housing tax credits investment $ 3,344 $ 3,355 $ —Other tax credit investment amortization 2,677 8,094 11,028 Total amortization of TCIs $ 6,021 $ 11,449 $ 11,028
NOTE 13 – NET INCOME PER SHARE
Basic net income per common share is calculated as net income divided by the weighted average number of shares outstanding.
Diluted net income per share is calculated as net income divided by the weighted average number of shares outstanding plus the incremental number of sharesadded as a result of converting common stock equivalents, calculated using the treasury stock method. The Corporation’s common stock equivalents consist ofoutstanding stock options, restricted stock, RSUs and PSUs. PSUs are required to be included in weighted average diluted shares outstanding if performancemeasures, as defined in each PSU award agreement, are met as of the end of the period.
A reconciliation of weighted average common shares outstanding used to calculate basic and diluted net income per share follows:
2019 2018 2017 (in thousands)Weighted average common shares outstanding (basic) 166,902 175,395 174,721Impact of common stock equivalents 890 1,148 1,211Weighted average common shares outstanding (diluted) 167,792 176,543 175,932
102

NOTE 14 – SHAREHOLDERS’ EQUITY
Accumulated Other Comprehensive Income (Loss)
The following table presents the components of other comprehensive income (loss) for the years ended December 31:
Before-Tax Amount Tax Effect Net of Tax Amount
(in thousands)
2019: Unrealized gain on AFS securities $ 73,085 $ (16,166) $ 56,919
Reclassification adjustment for available for sale securities gains included in net income (1) (4,733) 1,047 (3,686)
Amortization of net unrealized losses on available for sale securities transferred to HTM (2) (3) 8,070 (1,785) 6,285
Non-credit related unrealized loss on other-than-temporarily impaired debt securities (873) 193 (680)
Unrecognized pension and postretirement cost (1,203) 266 (937)
Amortization of net unrecognized pension and postretirement income (4) 1,316 (291) 1,025
Total Other Comprehensive Income $ 75,662 $ (16,736) $ 58,926
2018: Unrealized loss on AFS securities $ (31,235) $ 6,909 $ (24,326)
Reclassification adjustment for available for sale securities gains included in net income (1) (37) 7 (30)
Amortization of net unrealized losses on available for sale securities transferred to HTM (2) 2,694 (596) 2,098
Non-credit related unrealized loss on other-than-temporarily impaired debt securities 285 (63) 222
Unrecognized pension and postretirement income 1,798 (398) 1,400
Amortization of net unrecognized pension and postretirement income (4) 2,116 (468) 1,648
Total Other Comprehensive Loss $ (24,379) $ 5,391 $ (18,988)
2017: Unrealized gain on AFS securities $ 16,051 $ (5,619) $ 10,432
Reclassification adjustment for available for sale securities gains included in net income (1) (9,071) 3,177 (5,894)
Non-credit related unrealized loss on other-than-temporarily impaired debt securities 285 (100) 185
Unrecognized pension and postretirement cost (937) 328 (609)
Amortization of net unrecognized pension and postretirement income (4) 2,092 (731) 1,361
Total Other Comprehensive Income $ 8,420 $ (2,945) $ 5,475
(1) Amounts reclassified out of accumulated other comprehensive income (loss). Before-tax amounts included in "Investment securities gains, net" on the consolidated statements of income. See "Note 3 -Investment Securities," for additional details.
(2) Amounts reclassified out of accumulated other comprehensive income (loss). Before-tax amounts included as a reduction to "Interest Income" on the consolidated statements of income. See "Note 3, -Investment Securities," for additional details.
(3) Before-Tax amount includes a $3.7 million reclassification of unrealized loss related to the early adoption of ASU 2019-04, as disclosed in "Note 1 - Summary of Significant Accounting Policies" from"Amortization of net unrealized losses on available for sale securities transferred to HTM" to "Unrealized gain on securities."
(4) Amounts reclassified out of accumulated other comprehensive income (loss). Before-tax amounts included in "Salaries and employee benefits" on the consolidated statements of income. See "Note 13 -Employee Benefit Plans," for additional details.
103

The following table presents changes in each component of accumulated other comprehensive income (loss), net of tax, for the years ended December 31:
Unrealized Gain(Losses) on InvestmentSecurities Not Other-
Than-TemporarilyImpaired
Unrealized Non-CreditGains (Losses) on Other-
Than-TemporarilyImpaired Debt Securities
Unrecognized Pensionand Postretirement Plan
Income (Cost) Total
(in thousands)
Balance as of December 31, 2016 $ (23,047) $ 273 $ (15,675) $ (38,449)
Other comprehensive income before reclassifications 10,432 185 (609) 10,008
Amounts reclassified from accumulated other comprehensive income (loss) (5,894) — 1,361 (4,533)
Balance as of December 31, 2017 (18,509) 458 (14,923) (32,974)
Other comprehensive loss before reclassifications (24,326) 222 1,400 (22,704)
Amounts reclassified from accumulated other comprehensive income (loss) (30) — 1,648 1,618
Amortization of net unrealized losses on AFS transferred to HTM 2,098 — — 2,098
Reclassification of stranded tax effects (3,887) — (3,214) (7,101)
Balance as of December 31, 2018 (44,654) 680 (15,089) (59,063)
Other comprehensive gain before reclassifications 56,919 (680) (937) 55,302
Amounts reclassified from accumulated other comprehensive (loss) income (3,686) — 1,025 (2,661)
Amortization of net unrealized losses on AFS securities transferred to HTM 6,285 — — 6,285
Balance as of December 31, 2019 $ 14,864 $ — $ (15,001) $ (137)
Common Stock Repurchase Plans
In October 2019, the Corporation's board of directors approved a share repurchase program pursuant to which the Corporation is authorized to repurchase up to$100.0 million of its outstanding shares of common stock, or approximately 3.9% of its outstanding shares, through December 31, 2020. No shares had beenrepurchased under this program through December 31, 2019.
In March 2019, the Corporation's board of directors approved a share repurchase program pursuant to which the Corporation was authorized to repurchase up to$100.0 million of its outstanding shares of common stock, or approximately 3.5% of its outstanding shares, through December 31, 2019. During 2019, theCorporation repurchased approximately 6.1 million shares under this program for a total cost of $100.0 million, or $16.28 per share, completing this program.
In November 2018, the Corporation's board of directors approved a share repurchase program pursuant to which the Corporation was authorized to repurchase upto $75.0 million of its outstanding shares of common stock, or approximately 2.7% of its outstanding shares, through December 31, 2019. During 2019 and 2018,the Corporation repurchased approximately 706,000 and 4.1 million shares, respectively, under this program for a total cost of $75.0 million, or $15.57 per share,completing this program.
In November 2017, the Corporation's board of directors approved an extension to a share repurchase program pursuant to which the Corporation was authorized torepurchase up to $50.0 million of its outstanding shares of common stock, or approximately 2.3% of its outstanding shares, through December 31, 2018. During2018, the Corporation repurchased approximately 1.9 million shares under this program for a total cost of approximately $31.5 million, or $16.71 per share,completing this program.
NOTE 15 – STOCK-BASED COMPENSATION PLANS
The following table presents compensation expense and related tax benefits for all equity awards recognized in the consolidated statements of income:
2019 2018 2017 (in thousands)Compensation expense $ 7,413 $ 7,965 $ 5,209Tax benefit (1,610) (2,625) (3,994)Total stock-based compensation, net of tax $ 5,803 $ 5,340 $ 1,215
104

The tax benefits as a percentage of compensation expense, as shown in the preceding table, were 21.7%, 33.0% and 76.7% in 2019, 2018 and 2017, respectively.These percentages differ from the Corporation’s statutory tax rates of 21% for 2019 and 2018 and 35% for 2017 ("Tax Rates"). Tax benefits are only recognizedover the vesting period for awards that ordinarily will generate a tax deduction when exercised, in the case of non-qualified stock options, or upon vesting, in thecase of restricted stock, RSUs and PSUs. Tax benefits in excess of the Tax Rates resulted from incentive stock option exercises that triggered a tax deduction whenthey were exercised, and excess tax benefits realized on vesting RSUs and PSUs during the period.
The following table presents compensation expense and related tax benefits for restricted stock awards, RSUs and PSUs recognized in the consolidated statementsof income, and included as a component of total stock-based compensation in the preceding table:
2019 2018 2017 (in thousands)Compensation expense $ 6,621 $ 7,124 $ 4,922Tax benefit (1,509) (1,585) (1,559)Stock-based compensation, net of tax $ 5,112 $ 5,539 $ 3,363
The following table provides information about stock option activity for the year ended December 31, 2019:
Stock
Options
WeightedAverageExercise
Price
WeightedAverage
RemainingContractual
Term
AggregateIntrinsic
Value(in millions)
Outstanding and exercisable as of December 31, 2018 658,768 $ 10.75 Exercised (150,296) 9.73 Forfeited (4,128) 11.31 Expired (4,084) 5.27
Outstanding and exercisable as of December 31, 2019 500,260 $ 11.12 3.1 years $ 3.2
The following table provides information about nonvested restricted stock, RSUs and PSUs granted under the Employee Equity Plan and Directors' Plan for theyear ended December 31, 2019:
Restricted Stock/RSUs/PSUs(1)
Shares
WeightedAverage
Grant DateFair Value
Nonvested as of December 31, 2018 1,368,493 $ 15.49Granted 454,951 15.51Vested (407,872) 12.38Forfeited (43,236) 16.61
Nonvested as of December 31, 2019 1,372,336 $ 16.39
(1) There were no nonvested stock options at December 31, 2019 or 2018.
As of December 31, 2019, there was $10.1 million of total unrecognized compensation cost (pre-tax) related to restricted stock, RSUs and PSUs that will berecognized as compensation expense over a weighted average period of two years. As of December 31, 2019, the Employee Equity Plan had 10.1 million sharesreserved for future grants through 2023, and the Directors’ Plan had 260,000 shares reserved for future grants through 2021.
105
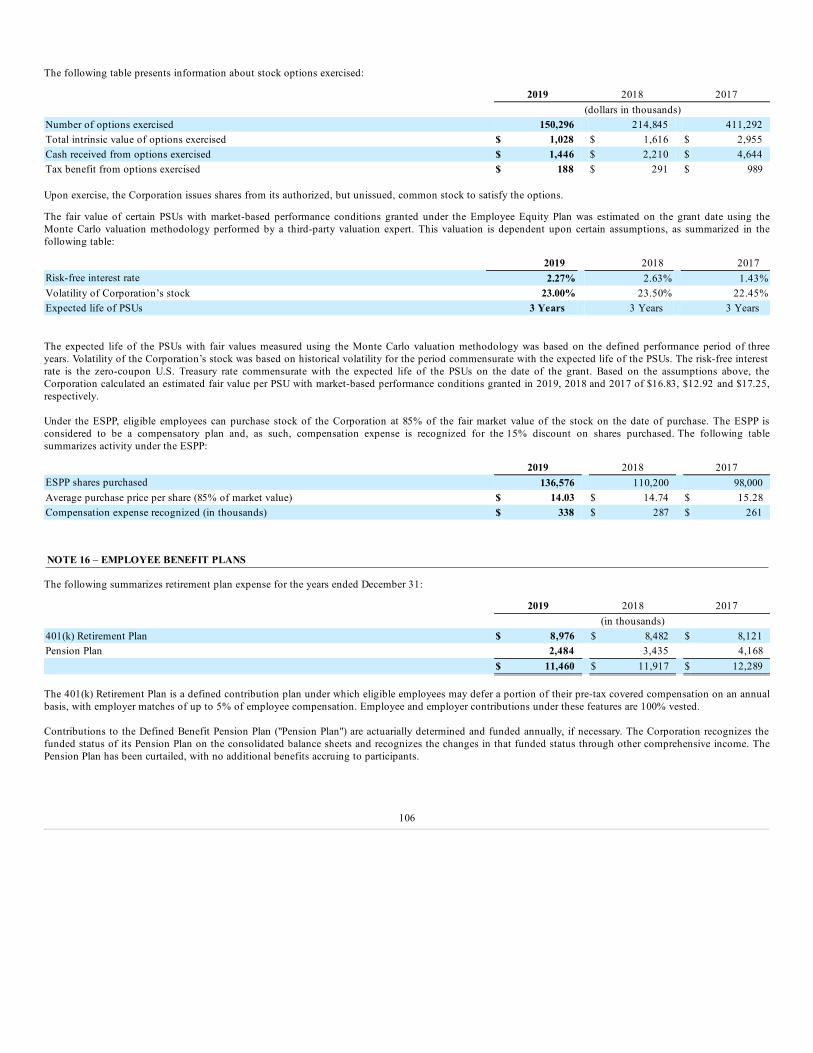
The following table presents information about stock options exercised:
2019 2018 2017 (dollars in thousands)Number of options exercised 150,296 214,845 411,292Total intrinsic value of options exercised $ 1,028 $ 1,616 $ 2,955Cash received from options exercised $ 1,446 $ 2,210 $ 4,644Tax benefit from options exercised $ 188 $ 291 $ 989
Upon exercise, the Corporation issues shares from its authorized, but unissued, common stock to satisfy the options.
The fair value of certain PSUs with market-based performance conditions granted under the Employee Equity Plan was estimated on the grant date using theMonte Carlo valuation methodology performed by a third-party valuation expert. This valuation is dependent upon certain assumptions, as summarized in thefollowing table:
2019 2018 2017Risk-free interest rate 2.27% 2.63% 1.43%Volatility of Corporation’s stock 23.00% 23.50% 22.45%Expected life of PSUs 3 Years 3 Years 3 Years
The expected life of the PSUs with fair values measured using the Monte Carlo valuation methodology was based on the defined performance period of threeyears. Volatility of the Corporation’s stock was based on historical volatility for the period commensurate with the expected life of the PSUs. The risk-free interestrate is the zero-coupon U.S. Treasury rate commensurate with the expected life of the PSUs on the date of the grant. Based on the assumptions above, theCorporation calculated an estimated fair value per PSU with market-based performance conditions granted in 2019, 2018 and 2017 of $16.83, $12.92 and $17.25,respectively.
Under the ESPP, eligible employees can purchase stock of the Corporation at 85% of the fair market value of the stock on the date of purchase. The ESPP isconsidered to be a compensatory plan and, as such, compensation expense is recognized for the 15% discount on shares purchased. The following tablesummarizes activity under the ESPP:
2019 2018 2017ESPP shares purchased 136,576 110,200 98,000Average purchase price per share (85% of market value) $ 14.03 $ 14.74 $ 15.28Compensation expense recognized (in thousands) $ 338 $ 287 $ 261
NOTE 16 – EMPLOYEE BENEFIT PLANS
The following summarizes retirement plan expense for the years ended December 31:
2019 2018 2017 (in thousands)401(k) Retirement Plan $ 8,976 $ 8,482 $ 8,121Pension Plan 2,484 3,435 4,168 $ 11,460 $ 11,917 $ 12,289
The 401(k) Retirement Plan is a defined contribution plan under which eligible employees may defer a portion of their pre-tax covered compensation on an annualbasis, with employer matches of up to 5% of employee compensation. Employee and employer contributions under these features are 100% vested.
Contributions to the Defined Benefit Pension Plan ("Pension Plan") are actuarially determined and funded annually, if necessary. The Corporation recognizes thefunded status of its Pension Plan on the consolidated balance sheets and recognizes the changes in that funded status through other comprehensive income. ThePension Plan has been curtailed, with no additional benefits accruing to participants.
106

Pension Plan
The net periodic pension cost for the Pension Plan, as determined by consulting actuaries, consisted of the following components for the years ended December31:
2019 2018 2017 (in thousands)Interest cost $ 3,257 $ 3,053 $ 3,320Expected return on assets (2,754) (2,047) (1,804)Net amortization and deferral 1,981 2,429 2,652
Net periodic pension cost $ 2,484 $ 3,435 $ 4,168
The following table summarizes the changes in the projected benefit obligation and fair value of plan assets for the plan years ended December 31:
2019 2018 (in thousands)Projected benefit obligation at beginning of year $ 79,426 $ 89,482Interest cost 3,257 3,053Benefit payments (4,114) (5,796)Change in assumptions 8,259 (8,051)Experience (loss) gain (624) 738
Projected benefit obligation at end of year $ 86,204 $ 79,426 Fair value of plan assets at beginning of year $ 57,825 $ 54,061Employer contributions (1) 20,755 13,042Actual return on plan assets 9,210 (3,482)Benefit payments (4,114) (5,796)
Fair value of plan assets at end of year $ 83,676 $ 57,825
(1) The Corporation funds at least the minimum amount required by federal law and regulations. The Corporation contributed $20.8 million and $13.0 million to the Pension Plan during 2019 and 2018,respectively.
The following table presents the funded status of the Pension Plan, included in other liabilities on the consolidated balance sheets, as of December 31:
2019 2018 (in thousands)Projected benefit obligation $ (86,204) $ (79,426)Fair value of plan assets 83,676 57,825Funded status $ (2,528) $ (21,601)
The following table summarizes the changes in the unrecognized net loss included as a component of accumulated other comprehensive income (loss):
Unrecognized Net Loss Before tax Net of tax (in thousands)Balance as of December 31, 2017 $ 28,559 $ 18,564Recognized as a component of 2018 periodic pension cost (2,429) (1,892)Unrecognized gains arising in 2018 (1,783) (1,389)Re-measurement adjustments for tax rate changes — 3,678Balance as of December 31, 2018 24,347 18,961Recognized as a component of 2019 periodic pension cost (1,981) (1,543)Unrecognized losses arising in 2019 1,180 919Balance as of December 31, 2019 $ 23,546 $ 18,337
107

The total amount of unrecognized net loss that will be amortized as a component of net periodic pension cost in 2020 is expected to be $2.1 million.
The following rates were used to calculate net periodic pension cost and the present value of benefit obligations as of December 31:
2019 2018 2017Discount rate-projected benefit obligation 3.25% 4.25% 3.50%Expected long-term rate of return on plan assets 5.00% 5.00% 5.00%
The discount rates used were determined using the Citigroup Average Life discount rate table, as adjusted based on the Pension Plan's expected benefit paymentsand rounded to the nearest 0.25%.
The 5.00% long-term rate of return on plan assets used to calculate the net periodic pension cost was based on historical returns, adjusted for expectations of long-term asset returns based on the December 31, 2019 weighted average asset allocations. The expected long-term return is considered to be appropriate based on theasset mix and the historical returns realized.
The following table presents a summary of the fair values of the Pension Plan’s assets as of December 31:
2019 2018
EstimatedFair Value
% of TotalAssets
EstimatedFair Value
% of TotalAssets
(dollars in thousands)Equity mutual funds $ 26,377 $ 18,532 Equity common trust funds 11,810 9,062
Equity securities 38,187 45.6% 27,594 47.7%Cash and money market funds 21,182 10,754 Fixed income mutual funds 14,370 11,523 Corporate debt securities 3,124 2,985 U.S. Government agency securities 3,078 —
Fixed income securities and cash 41,754 49.9% 25,262 43.7%Other alternative investment funds 3,735 4.5% 4,969 8.6%
Total $ 83,676 100.0% $ 57,825 100.0%
Investment allocation decisions are made by a retirement plan committee. The goal of the investment allocation strategy is to match certain benefit obligationswith maturities of fixed income securities. Alternative investments may include managed futures, commodities, real estate investment trusts, master limitedpartnerships, and long-short strategies with traditional stocks and bonds. All alternative investments are in the form of mutual funds, not individual contracts, toenable daily liquidity.
The fair values for all assets held by the Pension Plan, excluding equity common trust funds, are based on quoted prices for identical instruments and would becategorized as Level 1 assets under the fair value hierarchy. Equity common trust funds would be categorized as Level 2 assets under the fair value hierarchy.
Estimated future benefit payments are as follows (in thousands):
Year
2020 $ 4,2392021 4,3952022 4,4542023 4,5692024 4,6512025 – 2029 24,330 $ 46,638
108

Postretirement Benefits
The Corporation provides medical benefits and life insurance benefits under a postretirement benefits plan ("Postretirement Plan") to certain retired full-timeemployees who were employees of the Corporation prior to January 1, 1998. Prior to February 1, 2014, certain full-time employees became eligible for thesediscretionary benefits if they reached retirement age while working for the Corporation. The Corporation recognizes the funded status of the postretirement planon the consolidated balance sheets and recognizes the changes in that funded status through other comprehensive income.
The components of the net benefit for postretirement benefits other than pensions are as follows:
2019 2018 2017 (in thousands)Interest cost $ 61 $ 57 $ 68Net amortization and deferral (556) (559) (565)
Net postretirement benefit $ (495) $ (502) $ (497)
This table summarizes the changes in the accumulated postretirement benefit obligation for the years ended December 31:
2019 2018 (in thousands)Accumulated postretirement benefit obligation at beginning of year $ 1,520 $ 1,700Interest cost 61 57Benefit payments (187) (205)Experience gain 17 35Change in assumptions 39 (67)
Accumulated postretirement benefit obligation at end of year $ 1,450 $ 1,520
The fair values of the plan assets were $0 as of both December 31, 2019 and 2018. The funded status of the Postretirement Plan, included in other liabilities on theconsolidated balance sheets as of both December 31, 2019 and 2018 was $1.5 million.
The following table summarizes the changes in items recognized as a component of accumulated other comprehensive income (loss):
Before tax
UnrecognizedPrior Service
Cost Unrecognized
Net Loss (Gain) Total Net of tax (in thousands)Balance as of December 31, 2017 $ (4,404) $ (1,159) $ (5,563) $ (3,617)Recognized as a component of 2018 postretirement benefit cost 464 95 559 435Unrecognized gains arising in 2018 — (32) (32) (25)Re-measurement adjustments for tax rate changes in 2018 — — — (721)Balance as of December 31, 2018 (3,940) (1,096) (5,036) (3,928)Recognized as a component of 2019 postretirement benefit cost 464 92 556 433Unrecognized gains arising in 2019 — 56 56 44Balance as of December 31, 2019 $ (3,476) $ (948) $ (4,424) $ (3,451)
The following rates were used to calculate net periodic postretirement benefit cost and the present value of benefit obligations as of December 31:
2019 2018 2017Discount rate-projected benefit obligation 3.25% 4.25% 3.50%Expected long-term rate of return on plan assets 3.00% 3.00% 3.00%
109

The discount rates used to calculate the accumulated postretirement benefit obligation were determined using the Citigroup Average Life discount rate table, asadjusted based on the Postretirement Plan's expected benefit payments and rounded to the nearest 0.25%.
Estimated future benefit payments under the Postretirement Plan are as follows (in thousands):
Year
2020 $ 1782021 1652022 1532023 1402024 1282025 – 2029 481 $ 1,245
110

NOTE 17 – LEASES
The Corporation has operating leases for branches, corporate offices and land.
The following table presents the components of lease expense, which is included in net occupancy expense on the consolidated statements of income (inthousands):
2019Operating lease expense $ 18,852Variable lease expense 2,924Sublease income (791)
Total lease expense $ 20,985
Supplemental consolidated balance sheet information related to leases was as follows (dollars in thousands):
Operating Leases Balance Sheet Classification 2019ROU assets Other assets $ 102,779Lease liabilities Other liabilities $ 109,608Weighted average remaining lease term 8.1 yearsWeighted average discount rate 3.05%
The discount rate used in determining the lease liability for each individual lease was the FHLB fixed advance rate which corresponded with the remaining leaseterm as of January 1, 2019 for leases that existed at adoption and as of the lease commencement or modification date for leases subsequently entered into.
Supplemental cash flow information related to operating leases was as follows (in thousands):
2019Cash paid for amounts included in the measurement of lease liabilities $ 18,563ROU assets obtained in exchange for lease obligations 117,496
Lease payment obligations for each of the next five years and thereafter, with a reconciliation to the Corporation's lease liability were as follows (in thousands):
Year Operating Leases2020 $ 18,6952021 17,5822022 16,2782023 14,1062024 12,410Thereafter 42,394
Total lease payments 121,465Less: imputed interest (11,857)
Present value of lease liabilities $ 109,608
As of December 31, 2019, the Corporation had not entered into any material leases that have not yet commenced.
In 2018, under Topic 840, future minimum lease payments for operating leases having initial or remaining noncancellable lease terms in excess of one year as ofDecember 31, 2018 were $18.0 million, $17.3 million, $15.7 million, $13.7 million, $11.4 million for years 2019 through 2023, respectively, and $43.3 million inthe aggregate for all years thereafter.
111

NOTE 18 – COMMITMENTS AND CONTINGENCIES
Commitments
The Corporation is a party to financial instruments with off-balance sheet risk in the normal course of business to meet the financing needs of its customers.
Commitments to extend credit are agreements to lend to a customer as long as there is no violation of any condition established in the contract. Commitmentsgenerally have fixed expiration dates or other termination clauses and may require payment of a fee. Since a portion of the commitments is expected to expirewithout being drawn upon, the total commitment amounts do not necessarily represent future cash requirements. The Corporation evaluates each customer’screditworthiness on a case-by-case basis. The amount of collateral, if any, obtained upon extension of credit is based on management’s credit evaluation of thecustomer. Collateral held varies but may include accounts receivable, inventory, property, equipment and income producing commercial properties.
Standby letters of credit are conditional commitments issued to guarantee the financial or performance obligation of a customer to a third party. Commercialletters of credit are conditional commitments issued to facilitate foreign and domestic trade transactions for customers. The credit risk involved in issuing letters ofcredit is similar to that involved in extending loan facilities. These obligations are underwritten consistently with commercial lending standards. The maximumexposure to loss for standby and commercial letters of credit is equal to the contractual (or notional) amount of the instruments.
The Corporation records a reserve for unfunded commitments, included in other liabilities on the consolidated balance sheets, which represents management’sestimate of losses inherent in commitments to extend credit and letters of credit. See "Note 4 - Loans and Leases and Allowance for Credit Losses," for additionalinformation.
The following table presents the Corporation’s commitments to extend credit and letters of credit:
2019 2018 (in thousands)Commercial, industrial, financial and agricultural $ 3,997,401 $ 3,642,545Real estate - home equity 1,523,494 1,475,066Real estate - commercial mortgage and real estate - construction 1,168,624 1,188,972
Total commitments to extend credit $ 6,689,519 $ 6,306,583 Standby letters of credit $ 303,020 $ 309,352Commercial letters of credit 50,432 48,682
Total letters of credit $ 353,452 $ 358,034
Residential Lending
The Corporation originates and sells residential mortgages to secondary market investors. The Corporation provides customary representations and warranties tosecondary market investors that specify, among other things, that the loans have been underwritten to the standards of the secondary market investor. TheCorporation may be required to repurchase specific loans, or reimburse the investor for a credit loss incurred on a sold loan if it is determined that therepresentations and warranties have not been met. Under some agreements with secondary market investors, the Corporation may have additional credit exposurebeyond customary representations and warranties, based on the specific terms of those agreements.
The Corporation maintains a reserve for estimated credit losses related to loans sold to investors. As of December 31, 2019 and 2018, the total reserve for losses onresidential mortgage loans sold was $3.2 million and $2.1 million, respectively, including reserves for both representation and warranty and credit loss exposures.
Legal Proceedings
The Corporation is involved in various pending and threatened claims and other legal proceedings in the ordinary course of its business activities. The Corporationevaluates the possible impact of these matters, taking into consideration the most recent information available. A loss reserve is established for those matters forwhich the Corporation believes a loss is both probable and reasonably estimable. Once established, the reserve is adjusted as appropriate to reflect any subsequentdevelopments. Actual
112

losses with respect to any such matter may be more or less than the amount estimated by the Corporation. For matters where a loss is not probable, or the amountof the loss cannot be reasonably estimated by the Corporation, no loss reserve is established.
In addition, from time to time, the Corporation is involved in investigations or other forms of regulatory or governmental inquiry covering a range of possibleissues and, in some cases, these may be part of similar reviews of the specified activities of other companies. These inquiries or investigations could lead toadministrative, civil or criminal proceedings involving the Corporation, and could result in fines, penalties, restitution, other types of sanctions, or the need for theCorporation to undertake remedial actions, or to alter its business, financial or accounting practices. The Corporation’s practice is to cooperate fully withregulatory and governmental inquiries and investigations.
As of the date of this report, the Corporation believes that any liabilities, individually or in the aggregate, which may result from the final outcomes of pendinglegal proceedings, or regulatory or governmental inquiries or investigations, will not have a material adverse effect on the financial condition of the Corporation.However, legal proceedings, inquiries and investigations are often unpredictable, and it is possible that the ultimate resolution of any such matters, if unfavorable,may be material to the Corporation’s results of operations in any future period, depending, in part, upon the size of the loss or liability imposed and the operatingresults for the period, and could have a material adverse effect on the Corporation’s business. In addition, regardless of the ultimate outcome of any such legalproceeding, inquiry or investigation, any such matter could cause the Corporation to incur additional expenses, which could be significant, and possibly material,to the Corporation’s results of operations in any future period.
SEC Investigation
The Corporation is responding to an investigation by the staff of the Division of Enforcement of the SEC regarding certain accounting determinations that couldhave impacted the Corporation’s reported earnings per share. The Corporation believes that its financial statements filed with the SEC in Forms 10-K and 10-Qpresent fairly, in all material respects, its financial condition, results of operations and cash flows as of or for the periods ending on their respective dates. TheCorporation is cooperating fully with the SEC and at this time cannot predict when or how the investigation will be resolved.
Kress v. Fulton Bank, N.A.
On October 15, 2019, a former Fulton Bank teller supervisor, D. Kress filed a putative class action lawsuit on behalf of herself and other similarly situated non-exempt, hourly employees in the U.S. District Court for the District of New Jersey, D. Kress v. Fulton Bank, N.A., Case No. 1:19-cv-18985. Fulton Bank acceptedservice of process on January 20, 2020. The lawsuit alleges that Fulton Bank did not record or otherwise account for the amount of time which non-exemptemployees who are paid based on their time worked, spent conducting branch opening security procedures. The allegation is that, as a result, Fulton Bank did notproperly compensate those employees for their regular and overtime wages. The lawsuit alleges that by doing so, Fulton violated: (i) the federal Fair LaborStandards Act and seeks back overtime wages for a period of three years, liquidated damages and attorney fees and costs; (ii) the New Jersey State Wage and HourLaw and seeks back overtime wages for a period of six years, treble damages and attorney fees and costs; and (iii) the New Jersey Wage Payment Law and seeksback wages for a period of six years, treble damages and attorney fees and costs. The lawsuit also asserts New Jersey common law claims seeking compensatorydamages and interest.
113

NOTE 19 – FAIR VALUE MEASUREMENTS
The following tables present assets and liabilities measured at fair value on a recurring basis and reported on the consolidated balance sheets:
2019
Level 1 Level 2 Level 3 Total (in thousands)Loans held for sale $ — $ 37,828 $ — $ 37,828Available for sale investment securities:
State and municipal securities — 652,927 — 652,927Corporate debt securities — 374,957 2,400 377,357Collateralized mortgage obligations — 693,718 — 693,718Residential mortgage-backed securities — 177,312 — 177,312Commercial mortgage-backed securities — 494,297 — 494,297Auction rate securities — — 101,926 101,926
Total available for sale investment securities — 2,393,211 104,326 2,497,537
Other assets: Investments held in Rabbi Trust 22,213 — — 22,213Derivative assets 230 145,365 — 145,595
Total assets $ 22,443 $ 2,576,404 $ 104,326 $ 2,703,173
Other Liabilities Deferred compensation liabilities $ 22,213 $ — $ — $ 22,213
Derivative liabilities 199 76,447 — 76,646
Total liabilities $ 22,412 $ 76,447 $ — $ 98,859
2018
Level 1 Level 2 Level 3 Total (in thousands)Loans held for sale $ — $ 27,099 $ — $ 27,099Available for sale investment securities:
U.S. Government sponsored agency securities — 31,632 — 31,632State and municipal securities — 279,095 — 279,095Corporate debt securities — 106,258 3,275 109,533Collateralized mortgage obligations — 832,080 — 832,080Residential mortgage-backed securities — 463,344 — 463,344Commercial mortgage-backed securities — 261,616 — 261,616Auction rate securities — — 102,994 102,994
Total available for sale investment securities — 1,974,025 106,269 2,080,294
Other assets: Investments held in Rabbi Trust 18,415 — 18,415Derivative assets 392 62,552 — 62,944
Total assets $ 18,807 $ 2,063,676 $ 106,269 $ 2,188,752
Other Liabilities Deferred compensation liabilities $ 18,415 $ — $ — $ 18,415
Derivative liabilities 381 48,185 — 48,566
Total liabilities $ 18,796 $ 48,185 $ — $ 66,981
The valuation techniques used to measure fair value for the items in the preceding tables are as follows:
• Loans held for sale – This category includes mortgage loans held for sale that are measured at fair value. Fair values as of December 31, 2019 and 2018were measured as the price that secondary market investors were offering for loans with similar characteristics. See "Note 1 - Summary of SignificantAccounting Policies" for details related to the Corporation’s election to measure assets and liabilities at fair value.
• Available for sale investment securities – Included in this asset category are debt securities. Level 2 available for sale debt securities are valued by a third-party pricing service commonly used in the banking industry. The pricing service
114

uses pricing models that vary based on asset class and incorporate available market information, including quoted prices of investment securities withsimilar characteristics. Because many fixed income securities do not trade on a daily basis, pricing models use available information, as applicable, throughprocesses such as benchmark yield curves, benchmarking of like securities, sector groupings and matrix pricing.
Standard market inputs include: benchmark yields, reported trades, broker/dealer quotes, issuer spreads, two-sided markets, benchmark securities, bids,offers and reference data, including market research publications. For certain security types, additional inputs may be used, or some of the standard marketinputs may not be applicable.
Management tests the values provided by the pricing service by obtaining securities prices from an alternative third-party source and comparing theresults. This test is performed for approximately 95% of the securities valued by the pricing service. Generally, differences by security in excess of 5% areresearched to reconcile the difference.
• State and municipal securities/Collateralized mortgage obligations/Residential mortgage-backed securities/Commercial mortgage-backed securities– These debt securities are classified as Level 2 investments. Fair values are determined by a third-party pricing service, as detailed above.
• Corporate debt securities – This category consists of subordinated and senior debt issued by financial institutions ($362.3 million at December 31,2019 and $86.1 million at December 31, 2018), single-issuer trust preferred securities issued by financial institutions ($11.2 million atDecember 31, 2019 and $18.6 million at December 31, 2018), pooled trust preferred securities issued by financial institutions ($0 at December 31,2019 and $875,000 at December 31, 2018) and other corporate debt issued by non-financial institutions ($3.9 million at December 31, 2019 andDecember 31, 2018).
Level 2 investments include subordinated debt and senior debt, other corporate debt issued by non-financial institutions and $8.8 million and$16.3 million of single-issuer trust preferred securities held at December 31, 2019 and 2018, respectively. The fair values for these corporate debtsecurities are determined by a third-party pricing service, as detailed above.
Level 3 investments include the Corporation's investments in pooled trust preferred securities ($0 at December 31, 2019 and $875,000 atDecember 31, 2018) and certain single-issuer trust preferred securities ($2.4 million at December 31, 2019 and December 31, 2018). The fairvalues of these securities were determined based on quotes provided by third-party brokers who determined fair values based predominantly oninternal valuation models which were not indicative prices or binding offers. The Corporation’s third-party pricing service cannot derive fairvalues for these securities primarily due to inactive markets for similar investments. Level 3 values are tested by management primarily throughtrend analysis, by comparing current values to those reported at the end of the preceding calendar quarter, and determining if they are reasonablebased on price and spread movements for this asset class.
• Auction rate securities – Due to their illiquidity, ARCs are classified as Level 3 investments and are valued through the use of an expected cashflows model prepared by a third-party valuation expert. The assumptions used in preparing the expected cash flows model include estimates forcoupon rates, time to maturity and market rates of return. The most significant unobservable input to the expected cash flows model is anassumed return to market liquidity sometime within the next five years. If the assumed return to market liquidity was lengthened beyond the nextfive years, this would result in a decrease in the fair value of these ARCs. The Corporation believes that the trusts underlying the ARCs will self-liquidate as student loans are repaid. Level 3 values are tested by management through the performance of a trend analysis of the market price anddiscount rate. Changes in the price and discount rates are compared to changes in market data, including bond ratings, parity ratios, balances anddelinquency levels.
• Investments held in Rabbi Trust - This category consists of mutual funds that are held in trust for employee deferred compensation plans that theCorporation has elected to measure at fair value. Shares of mutual funds are valued based on net asset value, which represents quoted marketprices for the underlying shares held in the mutual funds, and as such, are classified as Level 1.
• Derivative assets - Fair value of foreign currency exchange contracts classified as Level 1 assets ($230,000 at December 31, 2019 and $392,000 atDecember 31, 2018). The mutual funds and foreign exchange prices used to measure these items at fair value are based on quoted prices foridentical instruments in active markets.
Level 2 assets, representing the fair value of mortgage banking derivatives in the form of interest rate locks and forward commitments withsecondary market investors ($1.2 million at December 31, 2019 and $1.2 million at December 31, 2018) and the fair value of interest rate swaps($144.2 million at December 31, 2019 and $61.4 million at December 31, 2018). The fair values of the interest rate locks, forward commitmentsand interest rate
115
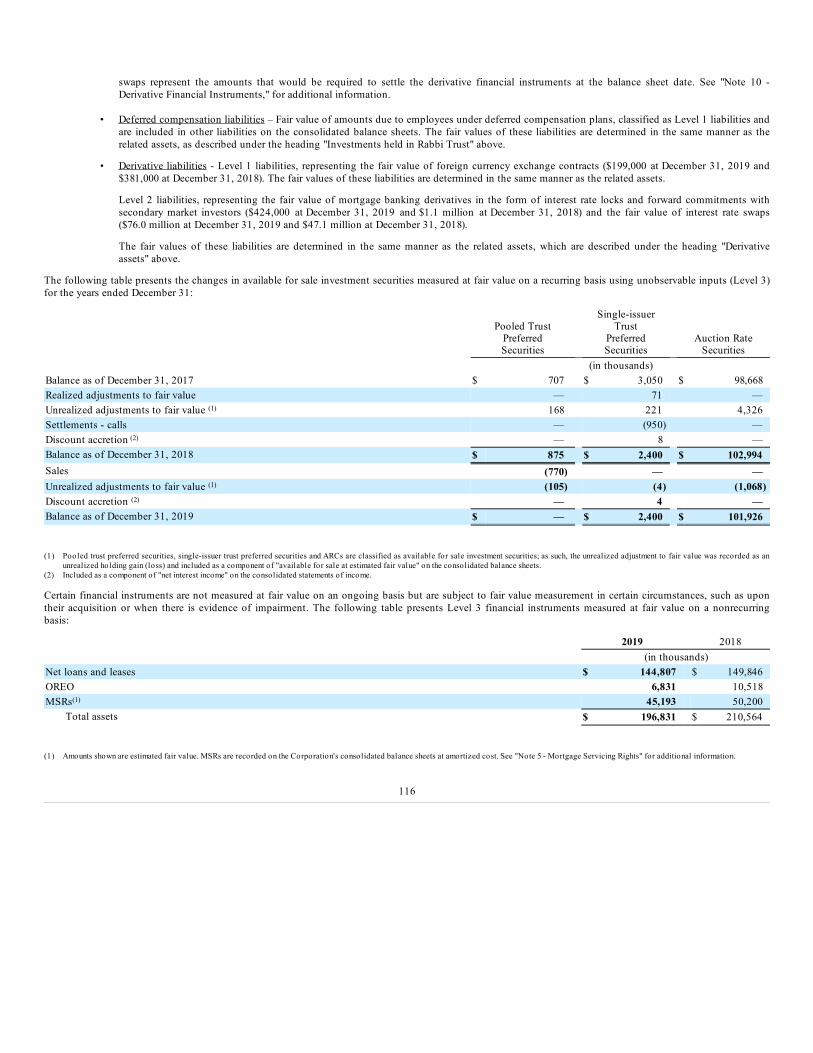
swaps represent the amounts that would be required to settle the derivative financial instruments at the balance sheet date. See "Note 10 -Derivative Financial Instruments," for additional information.
• Deferred compensation liabilities – Fair value of amounts due to employees under deferred compensation plans, classified as Level 1 liabilities andare included in other liabilities on the consolidated balance sheets. The fair values of these liabilities are determined in the same manner as therelated assets, as described under the heading "Investments held in Rabbi Trust" above.
• Derivative liabilities - Level 1 liabilities, representing the fair value of foreign currency exchange contracts ($199,000 at December 31, 2019 and$381,000 at December 31, 2018). The fair values of these liabilities are determined in the same manner as the related assets.
Level 2 liabilities, representing the fair value of mortgage banking derivatives in the form of interest rate locks and forward commitments withsecondary market investors ($424,000 at December 31, 2019 and $1.1 million at December 31, 2018) and the fair value of interest rate swaps($76.0 million at December 31, 2019 and $47.1 million at December 31, 2018).
The fair values of these liabilities are determined in the same manner as the related assets, which are described under the heading "Derivativeassets" above.
The following table presents the changes in available for sale investment securities measured at fair value on a recurring basis using unobservable inputs (Level 3)for the years ended December 31:
Pooled TrustPreferredSecurities
Single-issuerTrust
PreferredSecurities
Auction RateSecurities
(in thousands)Balance as of December 31, 2017 $ 707 $ 3,050 $ 98,668Realized adjustments to fair value — 71 —Unrealized adjustments to fair value (1) 168 221 4,326Settlements - calls — (950) —Discount accretion (2) — 8 —Balance as of December 31, 2018 $ 875 $ 2,400 $ 102,994Sales (770) — —Unrealized adjustments to fair value (1) (105) (4) (1,068)Discount accretion (2) — 4 —Balance as of December 31, 2019 $ — $ 2,400 $ 101,926
(1) Pooled trust preferred securities, single-issuer trust preferred securities and ARCs are classified as available for sale investment securities; as such, the unrealized adjustment to fair value was recorded as anunrealized holding gain (loss) and included as a component of "available for sale at estimated fair value" on the consolidated balance sheets.
(2) Included as a component of "net interest income" on the consolidated statements of income.
Certain financial instruments are not measured at fair value on an ongoing basis but are subject to fair value measurement in certain circumstances, such as upontheir acquisition or when there is evidence of impairment. The following table presents Level 3 financial instruments measured at fair value on a nonrecurringbasis:
2019 2018 (in thousands)Net loans and leases $ 144,807 $ 149,846OREO 6,831 10,518MSRs(1) 45,193 50,200
Total assets $ 196,831 $ 210,564
(1) Amounts shown are estimated fair value. MSRs are recorded on the Corporation's consolidated balance sheets at amortized cost. See "Note 5 - Mortgage Servicing Rights" for additional information.
116

The valuation techniques used to measure fair value for the items in the table above are as follows:
• Net loans and leases – This category consists of loans and leases that were individually evaluated for impairment and have been classified as Level 3assets. The amount shown is the balance of impaired loans and leases, net of the related allowance for loan losses. See "Note 4 - Loans and Leases andAllowance for Credit Losses," for additional details.
• OREO – This category consists of OREO classified as Level 3 assets, for which the fair values were based on estimated selling prices less estimated sellingcosts for similar assets in active markets.
• MSRs - This category consists of MSRs, which were initially recorded at fair value upon the sale of residential mortgage loans to secondary marketinvestors, and subsequently carried at the lower of amortized cost or fair value. MSRs are amortized as a reduction to servicing income over the estimatedlives of the underlying loans. MSRs are stratified and evaluated for impairment by comparing each stratum's carrying amount to its estimated fair value.Fair values are determined at the end of each quarter through a discounted cash flows valuation performed by a third-party valuation expert. Significantinputs to the valuation included expected net servicing income, the discount rate and the expected life of the underlying loans. Expected life is based onthe contractual terms of the loans, as adjusted for prepayment projections. The weighted average annual constant prepayment rate and the weightedaverage discount rate used in the December 31, 2019 valuation were 10.5% and 9.5%, respectively. Management tests the reasonableness of the significantinputs to the third-party valuation in comparison to market data.
117
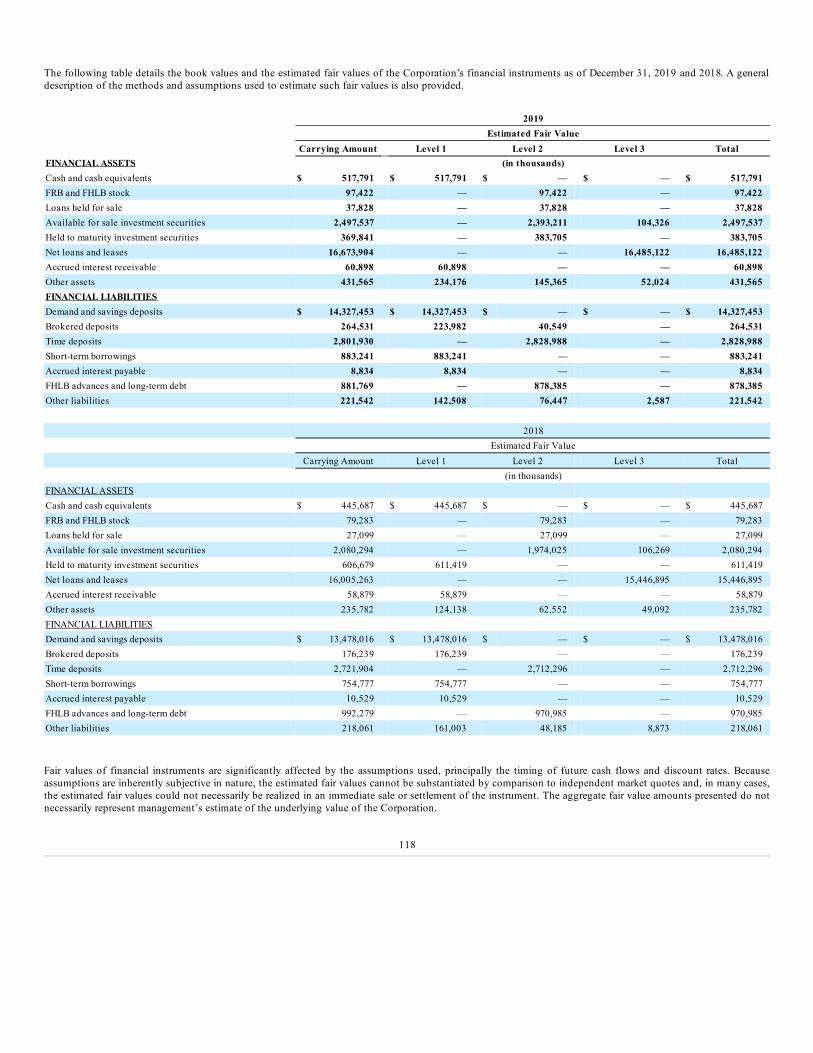
The following table details the book values and the estimated fair values of the Corporation’s financial instruments as of December 31, 2019 and 2018. A generaldescription of the methods and assumptions used to estimate such fair values is also provided.
2019 Estimated Fair Value Carrying Amount Level 1 Level 2 Level 3 TotalFINANCIAL ASSETS (in thousands)Cash and cash equivalents $ 517,791 $ 517,791 $ — $ — $ 517,791FRB and FHLB stock 97,422 — 97,422 — 97,422Loans held for sale 37,828 — 37,828 — 37,828Available for sale investment securities 2,497,537 — 2,393,211 104,326 2,497,537Held to maturity investment securities 369,841 — 383,705 — 383,705Net loans and leases 16,673,904 — — 16,485,122 16,485,122Accrued interest receivable 60,898 60,898 — — 60,898Other assets 431,565 234,176 145,365 52,024 431,565FINANCIAL LIABILITIES Demand and savings deposits $ 14,327,453 $ 14,327,453 $ — $ — $ 14,327,453Brokered deposits 264,531 223,982 40,549 — 264,531Time deposits 2,801,930 — 2,828,988 — 2,828,988Short-term borrowings 883,241 883,241 — — 883,241Accrued interest payable 8,834 8,834 — — 8,834FHLB advances and long-term debt 881,769 — 878,385 — 878,385Other liabilities 221,542 142,508 76,447 2,587 221,542 2018 Estimated Fair Value Carrying Amount Level 1 Level 2 Level 3 Total (in thousands)FINANCIAL ASSETS Cash and cash equivalents $ 445,687 $ 445,687 $ — $ — $ 445,687FRB and FHLB stock 79,283 — 79,283 — 79,283Loans held for sale 27,099 — 27,099 — 27,099Available for sale investment securities 2,080,294 — 1,974,025 106,269 2,080,294Held to maturity investment securities 606,679 611,419 — — 611,419Net loans and leases 16,005,263 — — 15,446,895 15,446,895Accrued interest receivable 58,879 58,879 — — 58,879Other assets 235,782 124,138 62,552 49,092 235,782FINANCIAL LIABILITIES Demand and savings deposits $ 13,478,016 $ 13,478,016 $ — $ — $ 13,478,016Brokered deposits 176,239 176,239 — — 176,239Time deposits 2,721,904 — 2,712,296 — 2,712,296Short-term borrowings 754,777 754,777 — — 754,777Accrued interest payable 10,529 10,529 — — 10,529FHLB advances and long-term debt 992,279 — 970,985 — 970,985Other liabilities 218,061 161,003 48,185 8,873 218,061
Fair values of financial instruments are significantly affected by the assumptions used, principally the timing of future cash flows and discount rates. Becauseassumptions are inherently subjective in nature, the estimated fair values cannot be substantiated by comparison to independent market quotes and, in many cases,the estimated fair values could not necessarily be realized in an immediate sale or settlement of the instrument. The aggregate fair value amounts presented do notnecessarily represent management’s estimate of the underlying value of the Corporation.
118

For short-term financial instruments, defined as those with remaining maturities of 90 days or less, and excluding those recorded at fair value on the Corporation’sconsolidated balance sheets, book value was considered to be a reasonable estimate of fair value.
The following instruments are predominantly short-term:
Assets LiabilitiesCash and cash equivalents Demand and savings depositsAccrued interest receivable Short-term borrowings
Accrued interest payable
FRB and FHLB stock represent restricted investments and are carried at cost on the consolidated balance sheets, which is a reasonable estimate of fair value.
As of December 31, 2019, fair values for loans and leases and time deposits were estimated by discounting future cash flows using the current rates, as adjustedfor liquidity considerations, at which similar loans and leases would be made to borrowers and similar deposits would be issued to customers for the sameremaining maturities. Fair values of loans and leases also include estimated credit losses that would be assumed in a market transaction, which represents estimatedexit prices.
Brokered deposits consists of demand and saving deposits, which are classified as level 1, and time deposits, which are classified as Level 2. The fair value of thesedeposits are determined in a manner consistent with the respective type of deposits discussed above.
NOTE 20 – CONDENSED FINANCIAL INFORMATION - PARENT COMPANY ONLY
CONDENSED BALANCE SHEETS
December 31, 2019 2018 (in thousands)ASSETS Cash and cash equivalents $ 10,841 $ 30,941Other assets 1,087 7,072Receivable from subsidiaries 78,025 51,646Investments in:
Bank subsidiary (1) 2,555,448 2,451,651Non-bank subsidiaries 419,145 425,670
Total Assets $ 3,064,546 $ 2,966,980LIABILITIES AND EQUITY Long-term debt $ 387,756 $ 386,913Payable to non-bank subsidiaries 276,768 247,801Other liabilities 57,846 84,693
Total Liabilities 722,370 719,407Shareholders’ equity 2,342,176 2,247,573
Total Liabilities and Shareholders’ Equity $ 3,064,546 $ 2,966,980(1) Consisted of one bank in 2019 and 2018 consisted of multiple banks which have been consolidated into one bank in 2019.
119
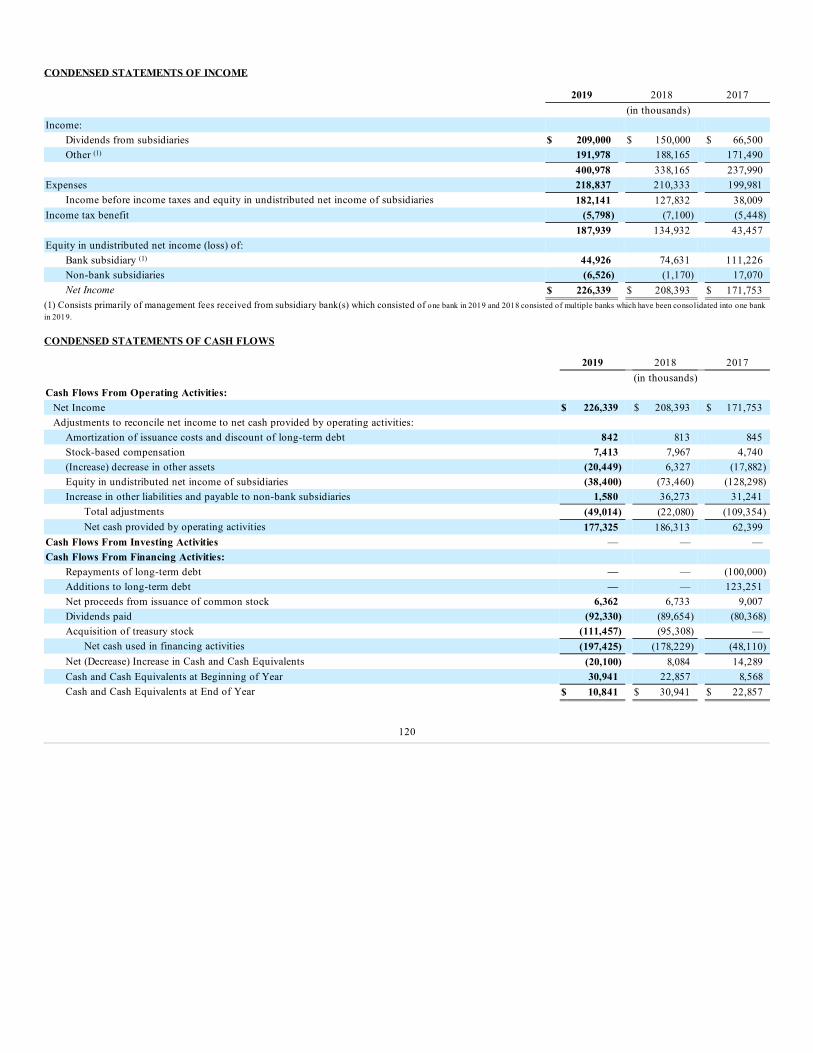
CONDENSED STATEMENTS OF INCOME
2019 2018 2017 (in thousands)Income:
Dividends from subsidiaries $ 209,000 $ 150,000 $ 66,500Other (1) 191,978 188,165 171,490
400,978 338,165 237,990Expenses 218,837 210,333 199,981
Income before income taxes and equity in undistributed net income of subsidiaries 182,141 127,832 38,009Income tax benefit (5,798) (7,100) (5,448) 187,939 134,932 43,457Equity in undistributed net income (loss) of:
Bank subsidiary (1) 44,926 74,631 111,226Non-bank subsidiaries (6,526) (1,170) 17,070Net Income $ 226,339 $ 208,393 $ 171,753
(1) Consists primarily of management fees received from subsidiary bank(s) which consisted of one bank in 2019 and 2018 consisted of multiple banks which have been consolidated into one bankin 2019.
CONDENSED STATEMENTS OF CASH FLOWS
2019 2018 2017 (in thousands)Cash Flows From Operating Activities:
Net Income $ 226,339 $ 208,393 $ 171,753Adjustments to reconcile net income to net cash provided by operating activities:
Amortization of issuance costs and discount of long-term debt 842 813 845Stock-based compensation 7,413 7,967 4,740(Increase) decrease in other assets (20,449) 6,327 (17,882)Equity in undistributed net income of subsidiaries (38,400) (73,460) (128,298)Increase in other liabilities and payable to non-bank subsidiaries 1,580 36,273 31,241
Total adjustments (49,014) (22,080) (109,354)Net cash provided by operating activities 177,325 186,313 62,399
Cash Flows From Investing Activities — — —Cash Flows From Financing Activities:
Repayments of long-term debt — — (100,000)Additions to long-term debt — — 123,251Net proceeds from issuance of common stock 6,362 6,733 9,007Dividends paid (92,330) (89,654) (80,368)Acquisition of treasury stock (111,457) (95,308) —
Net cash used in financing activities (197,425) (178,229) (48,110)Net (Decrease) Increase in Cash and Cash Equivalents (20,100) 8,084 14,289Cash and Cash Equivalents at Beginning of Year 30,941 22,857 8,568Cash and Cash Equivalents at End of Year $ 10,841 $ 30,941 $ 22,857
120

Management Report on Internal Control Over Financial Reporting
The management of Fulton Financial Corporation is responsible for establishing and maintaining adequate internal control over financial reporting. FultonFinancial Corporation’s internal control system is designed to provide reasonable assurance regarding the reliability of financial reporting and the preparation offinancial statements for external purposes in accordance with U.S. generally accepted accounting principles.
Because of its inherent limitations, internal control over financial reporting may not prevent or detect misstatements. Also, projections of any evaluation ofeffectiveness to future periods are subject to the risk that controls may become inadequate because of changes in conditions, or that the degree of compliance withthe policies or procedures may deteriorate.
Management assessed the effectiveness of the Corporation’s internal control over financial reporting as of December 31, 2019, using the criteria set forth by theCommittee of Sponsoring Organizations of the Treadway Commission (COSO) in Internal Control – Integrated Framework (2013). Based on this assessment,management concluded that, as of December 31, 2019, the Corporation’s internal control over financial reporting is effective based on those criteria.
/s/ E. PHILIP WENGER E. Philip WengerChairman and Chief Executive Officer
/s/ MARK R. MCCOLLOM
Mark R. McCollomSenior Executive Vice Presidentand Chief Financial Officer
121

Report of Independent Registered Public Accounting Firm
To the Shareholders and Board of DirectorsFulton Financial Corporation:
Opinions on the Consolidated Financial Statements and Internal Control Over Financial Reporting
We have audited the accompanying consolidated balance sheets of Fulton Financial Corporation and subsidiaries (the Company) as of December 31, 2019 and2018, the related consolidated statements of income, comprehensive income, shareholders’ equity, and cash flows for each of the years in the three-year periodended December 31, 2019, and the related notes (collectively, the consolidated financial statements). We also have audited the Company’s internal control overfinancial reporting as of December 31, 2019, based on criteria established in Internal Control - Integrated Framework (2013) issued by the Committee ofSponsoring Organizations of the Treadway Commission.
In our opinion, the consolidated financial statements referred to above present fairly, in all material respects, the financial position of the Company as ofDecember 31, 2019 and 2018, and the results of its operations and its cash flows for each of the years in the three-year period ended December 31, 2019, inconformity with U.S. generally accepted accounting principles. Also in our opinion, the Company maintained, in all material respects, effective internal controlover financial reporting as of December 31, 2019 based on criteria established in Internal Control - Integrated Framework (2013) issued by the Committee ofSponsoring Organizations of the Treadway Commission.
Basis for Opinions
The Company’s management is responsible for these consolidated financial statements, for maintaining effective internal control over financial reporting, and forits assessment of the effectiveness of internal control over financial reporting, included in the accompanying Management Report on Internal Control OverFinancial Reporting. Our responsibility is to express an opinion on the Company’s consolidated financial statements and an opinion on the Company’s internalcontrol over financial reporting based on our audits. We are a public accounting firm registered with the Public Company Accounting Oversight Board (UnitedStates) (PCAOB) and are required to be independent with respect to the Company in accordance with the U.S. federal securities laws and the applicable rules andregulations of the Securities and Exchange Commission and the PCAOB.
We conducted our audits in accordance with the standards of the PCAOB. Those standards require that we plan and perform the audits to obtain reasonableassurance about whether the consolidated financial statements are free of material misstatement, whether due to error or fraud, and whether effective internalcontrol over financial reporting was maintained in all material respects.
Our audits of the consolidated financial statements included performing procedures to assess the risks of material misstatement of the consolidated financialstatements, whether due to error or fraud, and performing procedures that respond to those risks. Such procedures included examining, on a test basis, evidenceregarding the amounts and disclosures in the consolidated financial statements. Our audits also included evaluating the accounting principles used and significantestimates made by management, as well as evaluating the overall presentation of the consolidated financial statements. Our audit of internal control over financialreporting included obtaining an understanding of internal control over financial reporting, assessing the risk that a material weakness exists, and testing andevaluating the design and operating effectiveness of internal control based on the assessed risk. Our audits also included performing such other procedures as weconsidered necessary in the circumstances. We believe that our audits provide a reasonable basis for our opinions.
Definition and Limitations of Internal Control Over Financial Reporting
A company’s internal control over financial reporting is a process designed to provide reasonable assurance regarding the reliability of financial reporting and thepreparation of financial statements for external purposes in accordance with generally accepted accounting principles. A company’s internal control over financialreporting includes those policies and procedures that (1) pertain to the maintenance of records that, in reasonable detail, accurately and fairly reflect thetransactions and dispositions of the assets of the company; (2) provide reasonable assurance that transactions are recorded as necessary to permit preparation offinancial statements in accordance with generally accepted accounting principles, and that receipts and expenditures of the company are being made only inaccordance with authorizations of management and directors of the company; and (3) provide reasonable assurance regarding prevention or timely detection ofunauthorized acquisition, use, or disposition of the company’s assets that could have a material effect on the financial statements.
122

Because of its inherent limitations, internal control over financial reporting may not prevent or detect misstatements. Also, projections of any evaluation ofeffectiveness to future periods are subject to the risk that controls may become inadequate because of changes in conditions, or that the degree of compliancewith the policies or procedures may deteriorate.
Critical Audit Matter
The critical audit matter communicated below is a matter arising from the current period audit of the consolidated financial statements that was communicated orrequired to be communicated to the audit committee and that: (1) relates to accounts or disclosures that are material to the consolidated financial statements and(2) involved our especially challenging, subjective, or complex judgment. The communication of a critical audit matter does not alter in any way our opinion onthe consolidated financial statements, taken as a whole, and we are not, by communicating the critical audit matter below, providing a separate opinion on thecritical audit matter or on the accounts or disclosures to which it relates.
Assessment of the allowance for loan losses related to loans collectively evaluated for impairment
As discussed in Notes 1 and 4 to the consolidated financial statements, the Company’s allowance for loan losses related to non-impaired and impaired loanscollectively evaluated for impairment (ALL) was $128.2 million and $35.4 million, respectively, of a total allowance for loan losses of $163.6 million as ofDecember 31, 2019. Impaired loans with total outstanding commitments of less than $1.0 million, and non-impaired loans are pooled and evaluated forimpairment collectively based on historical losses. The Company estimated the ALL using a historical loss methodology that calculates a loss rate for eachpool of loans, segmented by loan type, based on a probability of default (PD) and loss given default (LGD). The PD is based on the historical migration ofloans through risk rating categories for commercial loans, commercial mortgages and construction loans, and based on historical migration of loans throughdelinquency categories for residential mortgages, home equity loans, consumer loans and leases. The LGD is based on historical losses. Such amounts areadjusted for certain qualitative factors.
We identified the assessment of the ALL as a critical audit matter because it involved significant measurement uncertainty requiring complex auditorjudgment, and knowledge and experience in the industry. This assessment encompassed the evaluation of the ALL methodology, inclusive of themethodologies used to estimate (1) the PD and LGD and their key factors and assumptions, including the risk ratings for commercial loans, commercialmortgages, and construction loans, (2) how loans with similar characteristics are pooled, and (3) the assumptions and methodologies used to estimate theallocation for qualitative factors.
The primary procedures we performed to address the critical audit matter included the following. We tested certain internal controls over the development andapproval of the ALL methodology, and determination of the key factors and assumptions used to estimate historical losses and qualitative factors. We testedthe Company’s process to develop the ALL estimate. Specifically, we tested the sources of data, factors, and assumptions used by considering the relevanceand reliability, and considering additional factors and alternative assumptions. We involved credit risk professionals with industry knowledge and experiencewho assisted in:
• Evaluating the Company’s ALL methodology for compliance with U.S. generally accepted accounting principles,• Evaluating the assumptions and methodologies used in calculating the PD and LGD,• Determining whether loans are pooled by similar risk characteristics, and• Evaluating the methodology used to develop the resulting qualitative factors and the effect of those factors on the ALL compared with relevant credit risk
factors and consistency with credit trends.
In addition, we tested individual loan risk ratings for a selection of commercial loans, commercial mortgages and construction loans by involving credit riskprofessionals with industry knowledge and experience.
/s/ KPMG LLP
We have served as the Company’s auditor since 2002.
Philadelphia, PennsylvaniaFebruary 21, 2020
123

QUARTERLY CONSOLIDATED RESULTS OF OPERATIONS (UNAUDITED)(in thousands, except per-share data)
Three Months Ended March 31 June 30 September 30 December 312019 Interest income $ 204,700 $ 210,034 $ 208,414 $ 202,159Interest expense 41,385 45,490 47,153 42,889Net interest income 163,315 164,544 161,261 159,270Provision for credit losses 5,100 5,025 2,170 20,530Non-interest income 46,751 54,315 59,813 55,281Non-interest expenses 137,824 144,168 146,770 138,974Income before income taxes 67,142 69,666 72,133 55,047Income tax expense 10,479 9,887 10,025 7,258Net income $ 56,663 $ 59,779 $ 62,108 $ 47,789Per share data:
Net income (basic) $ 0.33 $ 0.36 $ 0.38 $ 0.29Net income (diluted) 0.33 0.35 0.37 0.29Cash dividends 0.13 0.13 0.13 0.17
2018 Interest income $ 177,687 $ 186,170 $ 194,048 $ 200,609Interest expense 26,369 30,103 33,921 37,665Net interest income 151,318 156,067 160,127 162,944Provision for credit losses 3,970 33,117 1,620 8,200Non-interest income 45,875 49,094 51,033 49,523Non-interest expenses 136,661 133,345 135,413 140,685Income before income taxes 56,562 38,699 74,127 63,582Income tax expense 7,082 3,502 8,494 5,499Net income $ 49,480 $ 35,197 $ 65,633 $ 58,083Per share data:
Net income (basic) $ 0.28 $ 0.20 $ 0.37 $ 0.33Net income (diluted) 0.28 0.20 0.37 0.33Cash dividends 0.12 0.12 0.12 0.16
124

Item 9. Changes in and Disagreements with Accountants on Accounting and Financial DisclosureNot applicable.
Item 9A. Controls and Procedures
Disclosure Controls and ProceduresThe Corporation carried out an evaluation, under the supervision and with the participation of the Corporation’s management, including the Corporation’s ChiefExecutive Officer and Chief Financial Officer, of the effectiveness of its disclosure controls and procedures, as defined in Exchange Act Rules 13a-15(e) and 15d-15(e). Based upon the evaluation, the Corporation’s Chief Executive Officer and Chief Financial Officer concluded that, as of December 31, 2019, theCorporation’s disclosure controls and procedures are effective. Disclosure controls and procedures are controls and procedures that are designed to ensure thatinformation required to be disclosed in the Corporation’s reports filed or submitted under the Exchange Act is recorded, processed, summarized and reportedwithin the time periods specified in the Securities and Exchange Commission’s rules and forms.
The "Management Report on Internal Control over Financial Reporting" and the "Report of Independent Registered Public Accounting Firm" may be found inItem 8, "Financial Statements and Supplementary Data" of this document.
Changes in Internal ControlsThere was no change in the Corporation’s "internal control over financial reporting" (as such term is defined in Rule 13a-15(f) under the Exchange Act) thatoccurred during the last fiscal quarter that has materially affected, or is reasonably likely to materially affect, the Corporation’s internal control over financialreporting.
Item 9B. Other Information
Not applicable.
125

PART III
Item 10. Directors, Executive Officers and Corporate GovernanceIncorporated by reference herein is the information appearing under the headings "Information about Nominees, Directors and Independence Standards," "RelatedPerson Transactions," "Section 16(a) Beneficial Ownership Reporting Compliance," "Code of Conduct," "Procedure for Shareholder Nominations," and "OtherBoard Committees" within the Corporation’s 2020 Proxy Statement. The information concerning executive officers required by this Item is provided under thecaption "Executive Officers" within Item 1, Part I, "Business" in this Annual Report.
The Corporation has adopted a code of ethics (Code of Conduct) that applies to all directors, officers and employees, including the Chief Executive Officer, theChief Financial Officer and the Corporate Controller. A copy of the Code of Conduct may be obtained free of charge by writing to the Corporate Secretary atFulton Financial Corporation, P.O. Box 4887, Lancaster, Pennsylvania 17604-4887, and is also available via the Internet at www.fult.com.
Item 11. Executive CompensationIncorporated by reference herein is the information appearing under the headings "Information Concerning Executive Compensation" and "Human ResourcesCommittee Interlocks and Insider Participation" within the Corporation’s 2020 Proxy Statement.
Item 12. Security Ownership of Certain Beneficial Owners and Management and Related Stockholder MattersIncorporated by reference herein is the information appearing under the heading "Security Ownership of Directors, Nominees, Management and Certain BeneficialOwners" within the Corporation’s 2020 Proxy Statement, and information appearing under the heading "Securities Authorized for Issuance under EquityCompensation Plans" within Item 5, "Market for Registrant’s Common Equity, Related Shareholder Matters and Issuer Purchases of Equity Securities" in thisAnnual Report.
Item 13. Certain Relationships and Related Transactions, and Director IndependenceIncorporated by reference herein is the information appearing under the headings "Related Person Transactions" and "Information about Nominees, Directors andIndependence Standards" within the Corporation’s 2020 Proxy Statement, and the information appearing in "Note 4 - Loans and Leases and Allowance for CreditLosses," of the Notes to Consolidated Financial Statements in Item 8, "Financial Statements and Supplementary Data" in this Annual Report.
Item 14. Principal Accounting Fees and ServicesIncorporated by reference herein is the information appearing under the heading "Relationship With Independent Public Accountants" within the Corporation’s2020 Proxy Statement.
126

PART IV
Item 15. Exhibits and Financial Statement Schedules(a) The following documents are filed as part of this report:
1. Financial Statements — The following consolidated financial statements of Fulton Financial Corporation and subsidiaries are incorporated herein byreference in response to Item 8 above:
(i) Consolidated Balance Sheets - December 31, 2019 and 2018. (ii) Consolidated Statements of Income - Years ended December 31, 2019, 2018 and 2017. (iii) Consolidated Statements of Comprehensive Income - Years ended December 31, 2019, 2018 and 2017. (iii) Consolidated Statements of Shareholders’ Equity - Years ended December 31, 2019, 2018 and 2017. (iv) Consolidated Statements of Cash Flows - Years ended December 31, 2019, 2018 and 2017. (v) Notes to Consolidated Financial Statements. (vi) Report of Independent Registered Public Accounting Firm.
2. Financial Statement Schedules — All financial statement schedules for which provision is made in the applicable accounting regulations of theSecurities and Exchange Commission are not required under the related instructions or are inapplicable and have therefore been omitted.
3.1
Articles of Incorporation, as amended and restated, of Fulton Financial Corporation as amended – Incorporated by reference to Exhibit 3.1 of theFulton Financial Corporation Current Report Form 8-K filed June 24, 2011.
3.2
Bylaws of Fulton Financial Corporation as amended – Incorporated by reference to Exhibit 3.1 of the Fulton Financial Corporation Current Reporton Form 8-K/A filed September 23, 2014.
4.1
An Indenture entered into on November 17, 2014 between Fulton Financial Corporation and Wilmington Trust, National Association as trustee,relating to the issuance by Fulton Financial Corporation of $250 million aggregate principal amount of 4.50% subordinated notes due November15, 2024 – Incorporated by reference to Exhibit 4.1 of the Fulton Financial Corporation Current Report on Form 8-K filed November 17, 2014.
4.2
First Supplemental Indenture entered into on November 17, 2014 between Fulton Financial Corporation and Wilmington Trust, NationalAssociation as trustee, relating to the issuance by Fulton Financial Corporation of $250 million aggregate principal amount of 4.50%subordinated notes due November 15, 2024 - Incorporated by reference to Exhibit 4.2 of the Fulton Financial Corporation Current Report onForm 8-K filed November 17, 2014.
4.3 Form of Note (Included in Exhibit 4.2).4.4
An Indenture entered into on March 16, 2017 between Fulton Financial Corporation and Wilmington Trust, National Association as trustee,relating to the issuance by Fulton Financial Corporation of $125 million aggregate principal amount of 3.60% senior notes due March 16, 2022 -Incorporated by reference to Exhibit 4.1 of the Fulton Financial Corporation Current Report on Form 8-K filed March 16, 2017.
4.5
First Supplemental Indenture entered into on March 16, 2017 between Fulton Financial Corporation and Wilmington Trust Company as trustee,relating to the issuance by Fulton Financial Corporation of $125 million aggregate principal amount of 3.60% senior notes due March 16, 2022 -Incorporated by reference to Exhibit 4.2 of the Fulton Financial Corporation Current Report on Form 8-K filed March 16, 2017.
4.6 Form of Note (Included in Exhibit 4.2).4.7 Description of Fulton Financial Corporation Securities - filed herewith.
10.1
Amended Employment Agreement between Fulton Financial Corporation and E. Philip Wenger dated November 12, 2008 – Incorporated byreference to Exhibit 10.5 of the Fulton Financial Corporation Current Report on Form 8-K filed November 14, 2008.
10.2
Form of Executive Employment Agreement between Fulton Financial Corporation and certain Executive Officers of Fulton Financial Corporation- Incorporated by reference to Exhibit 10.1 of the Fulton Financial Corporation Current Report on Form 8-K filed January 4, 2018.
10.2.1
Schedule of Executive Employment Agreements between Fulton Financial Corporation and certain Executive Officers of Fulton FinancialCorporation - Incorporated by reference to Exhibit 10.4.1 of the Fulton Financial Corporation Annual Report on Form 10-K for the fiscal yearended December 31, 2017.
10.3
Form of Key Employee Change in Control Agreement between Fulton Financial Corporation and certain Executive Officers of Fulton FinancialCorporation, Incorporated by reference to Exhibit 10.2 of the Fulton Financial Corporation Current Report on Form 8-K filed January 4, 2018.
127

10.3.1
Schedule of Key Employee Change in Control Agreements between Fulton Financial Corporation and certain Executive Officers of FultonFinancial Corporation - Incorporated by reference to Exhibit 10.5.1 of the Fulton Financial Corporation Annual Report on Form 10-K for thefiscal year ended December 31, 2017.
10.4
Form of Death Benefit Only Agreement to Senior Management - Incorporated by reference to Exhibit 10.9 of the Fulton Financial CorporationAnnual Report on Form 10-K for the fiscal year ended December 31, 2006.
10.5
Fulton Financial Corporation Amended and Restated Equity and Cash Incentive Compensation Plan – Incorporated by reference to Exhibit 10.1of the Fulton Financial Corporation Current Report on Form 8-K filed May 3, 2013.
10.6
Amendment No. 1 to Fulton Financial Corporation Amended and Restated Equity and Cash Incentive Compensation Plan - Incorporated byreference to Exhibit 10.1 of the Fulton Financial Corporation Quarterly Report on Form 10-Q for the quarterly period ended June 30, 2016.
10.7
Amendment No. 2 to Fulton Financial Corporation Amended and Restated Equity and Cash Incentive Compensation Plan - Incorporated byreference to Exhibit 10.9 of the Fulton Financial Corporation Annual Report on Form 10-K for the fiscal year ended December 31, 2017.
10.8
Form of Option Award and Form of Restricted Stock Award under the Fulton Financial Corporation Amended and Restated Equity and CashIncentive Compensation Plan between Fulton Financial Corporation and Officers of the Corporation – Incorporated by reference to Exhibits 10.1and 10.2, respectively, of the Fulton Financial Corporation Current Report on Form 8-K filed June 19, 2013.
10.9
Amended and Restated Fulton Financial Corporation Employee Stock Purchase Plan – Incorporated by reference to Exhibit A to Fulton FinancialCorporation’s definitive proxy statement, filed March 26, 2014.
10.10 Amendment No. 1 to the Amended and Restated Fulton Financial Corporation Employee Stock Purchase Plan - filed herewith.10.11
Fulton Financial Corporation Deferred Compensation Plan, as amended and restated effective December 1, 2015 – Incorporated by reference toExhibit 10.12 of the Fulton Financial Corporation Annual Report on Form 10-K for the fiscal year ended December 31, 2015.
10.12
First Amendment effective January 1, 2019 to the Fulton Financial Corporation Deferred Compensation Plan -Incorporated by reference toExhibit 10.1 of the Fulton Financial Corporation Quarterly Report on Form 10-Q for the quarterly period ended March 31, 2019.
10.13
Agreement between Fulton Financial Corporation and Fiserv Solutions, Inc. dated July 11, 2016 - Incorporated by reference to Exhibit 10.1 of theFulton Financial Corporation Quarterly Report on Form 10-Q for the quarterly period ended September 30, 2016. Portions of this exhibit havebeen redacted and are subject to a confidential treatment request filed with the Securities and Exchange Commission pursuant to Rule 24b-2under the Securities Exchange Act of 1934, as amended. The redacted material was filed separately with the Securities and ExchangeCommission.
10.14
Fulton Financial Corporation Amended and Restated Directors' Equity Participation Plan – Incorporated by reference to Exhibit 10.1 of FultonFinancial Corporation’s Current Report on Form 8-K filed May 23, 2019.
10.15 Fulton Financial Corporation Non-Employee Director Compensation - filed herewith.10.16
Form of Director Stock Unit Award Agreement under the Directors' Equity Participation Plan, as amended - Incorporated by reference to Exhibit10.15 of the Fulton Financial Corporation Annual Report on Form 10-K for the fiscal year ended December 31, 2018.
10.17
Form of Restricted Stock Award Agreement between Fulton Financial Corporation and Directors of the Corporation as of July 1, 2011 –Incorporated by reference to Exhibit 10.2 of the Fulton Financial Corporation Quarterly Report on Form 10-Q for quarterly period ended June 30,2011.
10.18
Forms of Time-Vested Restricted Stock Unit Award Agreement and Performance Share Restricted Stock Unit Award Agreement between FultonFinancial Corporation and Certain Employees of the Corporation as of March 18, 2014 – Incorporated by reference to Exhibits 10.1 and 10.2,respectively, of the Fulton Financial Corporation Current Report on Form 8-K filed March 24, 2014.
10.19
Form of Master Confirmation between Fulton Financial Corporation and Goldman, Sachs & Co. - Incorporated by reference to Exhibit 10.1 of theFulton Financial Corporation Current Report on Form 8-K filed November 17, 2014.
21 Subsidiaries of the Registrant.23 Consent of Independent Registered Public Accounting Firm.
31.1 Certification of Chief Executive Officer pursuant to Section 302 of the Sarbanes-Oxley Act of 2002.31.2 Certification of Chief Financial Officer pursuant to Section 302 of the Sarbanes-Oxley Act of 2002.32.1 Certification of Chief Executive Officer pursuant to Section 906 of the Sarbanes-Oxley Act of 2002.32.2 Certification of Chief Financial Officer pursuant to Section 906 of the Sarbanes-Oxley Act of 2002.101
Interactive data files pursuant to Rule 405 of Regulation S-T (i) Consolidated Balance Sheets, (ii) Consolidated Statements of Income, (iii)Consolidated Statements of Comprehensive Income, (iv) Consolidated Statements of Shareholders’ Equity, (v) Consolidated Statements of CashFlows, and (vi) Notes to Consolidated Financial Statements.
104 Cover page interactive data file (formatted as inline XBRL and contained in Exhibit 101)
128

Item 16. Form 10-K Summary
Not applicable.
129
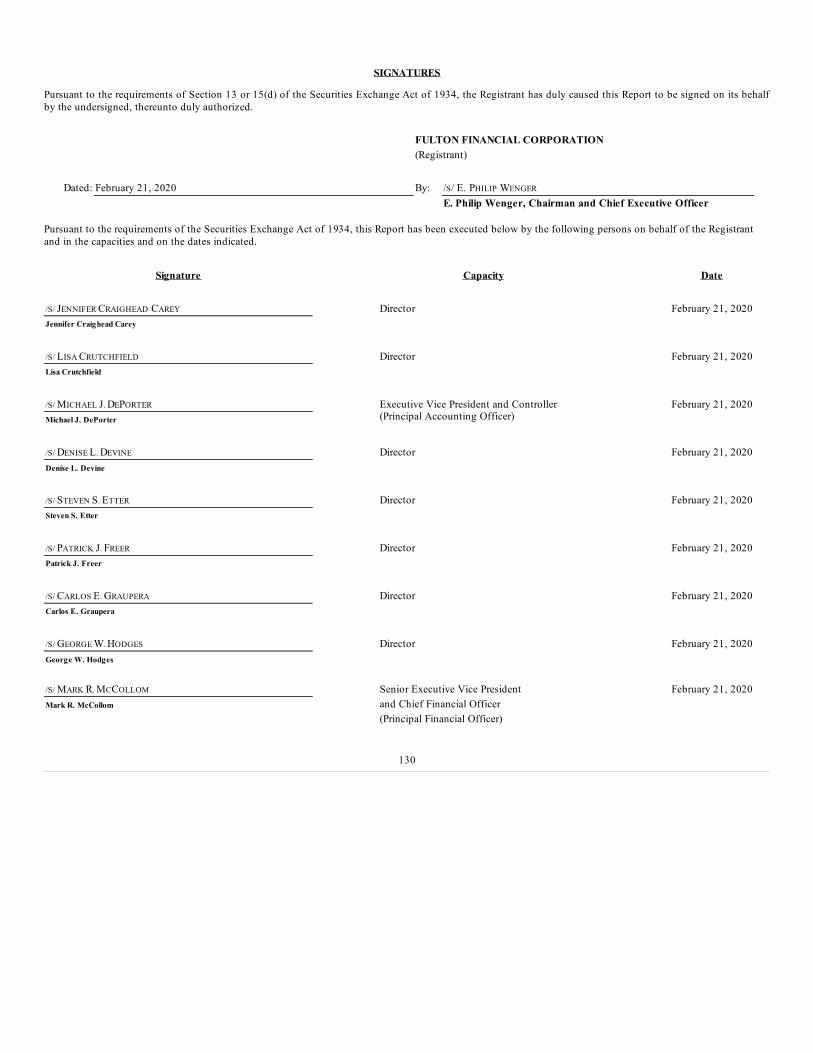
SIGNATURES
Pursuant to the requirements of Section 13 or 15(d) of the Securities Exchange Act of 1934, the Registrant has duly caused this Report to be signed on its behalfby the undersigned, thereunto duly authorized.
FULTON FINANCIAL CORPORATION (Registrant)
Dated: February 21, 2020 By: /S/ E. PHILIP WENGER E. Philip Wenger, Chairman and Chief Executive Officer
Pursuant to the requirements of the Securities Exchange Act of 1934, this Report has been executed below by the following persons on behalf of the Registrantand in the capacities and on the dates indicated.
Signature Capacity Date
/S/ JENNIFER CRAIGHEAD CAREY Director February 21, 2020Jennifer Craighead Carey
/S/ LISA CRUTCHFIELD Director February 21, 2020Lisa Crutchfield
/S/ MICHAEL J. DEPORTER Executive Vice President and Controller(Principal Accounting Officer)
February 21, 2020Michael J. DePorter
/S/ DENISE L. DEVINE Director February 21, 2020Denise L. Devine
/S/ STEVEN S. ETTER Director February 21, 2020Steven S. Etter
/S/ PATRICK J. FREER Director February 21, 2020Patrick J. Freer
/S/ CARLOS E. GRAUPERA Director February 21, 2020Carlos E. Graupera
/S/ GEORGE W. HODGES Director February 21, 2020George W. Hodges /S/ MARK R. MCCOLLOM Senior Executive Vice President February 21, 2020Mark R. McCollom and Chief Financial Officer (Principal Financial Officer)
130

Signature Capacity Date
/S/ JAMES R. MOXLEY, III Director February 21, 2020James R. Moxley, III
/S/ CURTIS J. MYERS Director, President and Chief February 21, 2020Curtis J. Myers Operating Officer
/S/ SCOTT A. SNYDER Director February 21, 2020Scott A. Snyder
/S/ RONALD H. SPAIR Director February 21, 2020Ronald H. Spair
/S/ MARK F. STRAUSS Director February 21, 2020Mark F. Strauss
/S/ ERNEST J. WATERS Director February 21, 2020Ernest J. Waters
/S/ E. PHILIP WENGER Chairman and Chief Executive Officer(Principal Executive Officer)
February 21, 2020E. Philip Wenger
131

EXHIBIT INDEX
Exhibits Required Pursuant to Item 601 of Regulation S-K
3.1
Articles of Incorporation, as amended and restated, of Fulton Financial Corporation as amended – Incorporated by reference to Exhibit 3.1 of theFulton Financial Corporation Current Report Form 8-K filed June 24, 2011.
3.2
Bylaws of Fulton Financial Corporation as amended – Incorporated by reference to Exhibit 3.1 of the Fulton Financial Corporation Current Report onForm 8-K/A filed September 23, 2014.
4.1
An Indenture entered into on November 17, 2014 between Fulton Financial Corporation and Wilmington Trust, National Association as trustee,relating to the issuance by Fulton Financial Corporation of $250 million aggregate principal amount of 4.50% subordinated notes due November 15,2024 – Incorporated by reference to Exhibit 4.1 of the Fulton Financial Corporation Current Report on Form 8-K filed November 17, 2014.
4.2
First Supplemental Indenture entered into on November 17, 2014 between Fulton Financial Corporation and Wilmington Trust, National Associationas trustee, relating to the issuance by Fulton Financial Corporation of $250 million aggregate principal amount of 4.50% subordinated notes dueNovember 15, 2024 - Incorporated by reference to Exhibit 4.2 of the Fulton Financial Corporation Current Report on Form 8-K filed November 17,2014.
4.3 Form of Note (Included in Exhibit 4.2).4.4
An Indenture entered into on March 16, 2017 between Fulton Financial Corporation and Wilmington Trust, National Association as trustee, relating tothe issuance by Fulton Financial Corporation of $125 million aggregate principal amount of 3.60% senior notes due March 16, 2022 - Incorporated byreference to Exhibit 4.1 of the Fulton Financial Corporation Current Report on Form 8-K filed March 16, 2017.
4.5
First Supplemental Indenture entered into on March 16, 2017 between Fulton Financial Corporation and Wilmington Trust Company as trustee,relating to the issuance by Fulton Financial Corporation of $125 million aggregate principal amount of 3.60% senior notes due March 16, 2022 -Incorporated by reference to Exhibit 4.2 of the Fulton Financial Corporation Current Report on Form 8-K filed March 16, 2017.
4.6 Form of Note (Included in Exhibit 4.2).4.7 Description of Fulton Financial Corporation Securities - filed herewith.
10.1
Amended Employment Agreement between Fulton Financial Corporation and E. Philip Wenger dated November 12, 2008 – Incorporated by referenceto Exhibit 10.5 of the Fulton Financial Corporation Current Report on Form 8-K filed November 14, 2008.
10.2
Form of Executive Employment Agreement between Fulton Financial Corporation and certain Executive Officers of Fulton Financial Corporation -Incorporated by reference to Exhibit 10.1 of the Fulton Financial Corporation Current Report on Form 8-K filed January 4, 2018.
10.2.1
Schedule of Executive Employment Agreements between Fulton Financial Corporation and certain Executive Officers of Fulton Financial Corporation- Incorporated by reference to Exhibit 10.4.1 of the Fulton Financial Corporation Annual Report on Form 10-K for the fiscal year ended December 31,2017.
10.3
Form of Key Employee Change in Control Agreement between Fulton Financial Corporation and certain Executive Officers of Fulton FinancialCorporation, Incorporated by reference to Exhibit 10.2 of the Fulton Financial Corporation Current Report on Form 8-K filed January 4, 2018.
132

10.3.1
Schedule of Key Employee Change in Control Agreements between Fulton Financial Corporation and certain Executive Officers of Fulton FinancialCorporation - Incorporated by reference to Exhibit 10.5.1 of the Fulton Financial Corporation Annual Report on Form 10-K for the fiscal year endedDecember 31, 2017.
10.4
Form of Death Benefit Only Agreement to Senior Management - Incorporated by reference to Exhibit 10.9 of the Fulton Financial Corporation AnnualReport on Form 10-K for the fiscal year ended December 31, 2006.
10.5
Fulton Financial Corporation Amended and Restated Equity and Cash Incentive Compensation Plan – Incorporated by reference to Exhibit 10.1 of theFulton Financial Corporation Current Report on Form 8-K filed May 3, 2013.
10.6
Amendment No. 1 to Fulton Financial Corporation Amended and Restated Equity and Cash Incentive Compensation Plan - Incorporated by referenceto Exhibit 10.1 of the Fulton Financial Corporation Quarterly Report on Form 10-Q for the quarterly period ended June 30, 2016.
10.7
Amendment No. 2 to Fulton Financial Corporation Amended and Restated Equity and Cash Incentive Compensation Plan - Incorporated by referenceto Exhibit 10.9 of the Fulton Financial Corporation Annual Report on Form 10-K for the fiscal year ended December 31, 2017.
10.8
Form of Option Award and Form of Restricted Stock Award under the Fulton Financial Corporation Amended and Restated Equity and Cash IncentiveCompensation Plan between Fulton Financial Corporation and Officers of the Corporation – Incorporated by reference to Exhibits 10.1 and 10.2,respectively, of the Fulton Financial Corporation Current Report on Form 8-K filed June 19, 2013.
10.9
Amended and Restated Fulton Financial Corporation Employee Stock Purchase Plan – Incorporated by reference to Exhibit A to Fulton FinancialCorporation’s definitive proxy statement, filed March 26, 2014.
10.10 Amendment No. 1 to the Amended and Restated Fulton Financial Corporation Employee Stock Purchase Plan - filed herewith.10.11
Fulton Financial Corporation Deferred Compensation Plan, as amended and restated effective December 1, 2015 – Incorporated by reference to Exhibit10.12 of the Fulton Financial Corporation Annual Report on Form 10-K for the fiscal year ended December 31, 2015.
10.12
First Amendment effective January 1, 2019 to the Fulton Financial Corporation Deferred Compensation Plan -Incorporated by reference to Exhibit10.1 of the Fulton Financial Corporation Quarterly Report on Form 10-Q for the quarterly period ended March 31, 2019.
10.13
Agreement between Fulton Financial Corporation and Fiserv Solutions, Inc. dated July 11, 2016 - Incorporated by reference to Exhibit 10.1 of theFulton Financial Corporation Quarterly Report on Form 10-Q for the quarterly period ended September 30, 2016. Portions of this exhibit have beenredacted and are subject to a confidential treatment request filed with the Securities and Exchange Commission pursuant to Rule 24b-2 under theSecurities Exchange Act of 1934, as amended. The redacted material was filed separately with the Securities and Exchange Commission.
10.14
Fulton Financial Corporation Amended and Restated Directors' Equity Participation Plan – Incorporated by reference to Exhibit 10.1 of FultonFinancial Corporation’s Current Report on Form 8-K filed May 23, 2019.
10.15 Fulton Financial Corporation Non-Employee Director Compensation - filed herewith.10.16
Form of Director Stock Unit Award Agreement under the Directors' Equity Participation Plan, as amended - Incorporated by reference to Exhibit 10.15of the Fulton Financial Corporation Annual Report on Form 10-K for the fiscal year ended December 31, 2018.
10.17
Form of Restricted Stock Award Agreement between Fulton Financial Corporation and Directors of the Corporation as of July 1, 2011 – Incorporatedby reference to Exhibit 10.2 of the Fulton Financial Corporation Quarterly Report on Form 10-Q for quarterly period ended June 30, 2011.
10.18
Forms of Time-Vested Restricted Stock Unit Award Agreement and Performance Share Restricted Stock Unit Award Agreement between FultonFinancial Corporation and Certain Employees of the Corporation as of March 18, 2014 – Incorporated by reference to Exhibits 10.1 and 10.2,respectively, of the Fulton Financial Corporation Current Report on Form 8-K filed March 24, 2014.
10.19
Form of Master Confirmation between Fulton Financial Corporation and Goldman, Sachs & Co. - Incorporated by reference to Exhibit 10.1 of theFulton Financial Corporation Current Report on Form 8-K filed November 17, 2014.
21 Subsidiaries of the Registrant.23 Consent of Independent Registered Public Accounting Firm.
31.1 Certification of Chief Executive Officer pursuant to Section 302 of the Sarbanes-Oxley Act of 2002.31.2 Certification of Chief Financial Officer pursuant to Section 302 of the Sarbanes-Oxley Act of 2002.32.1 Certification of Chief Executive Officer pursuant to Section 906 of the Sarbanes-Oxley Act of 2002.32.2 Certification of Chief Financial Officer pursuant to Section 906 of the Sarbanes-Oxley Act of 2002.101
Interactive data files pursuant to Rule 405 of Regulation S-T (i) Consolidated Balance Sheets, (ii) Consolidated Statements of Income, (iii)Consolidated Statements of Comprehensive Income, (iv) Consolidated Statements of Shareholders’ Equity, (v) Consolidated Statements of CashFlows, and (vi) Notes to Consolidated Financial Statements.
104 Cover page interactive data file (formatted as inline XBRL and contained in Exhibit 101)
133