full year results - drax.com · sustainable and growing dividend with return of capital to ......
TRANSCRIPT
Full Year Results12 Months Ended 31 December 2017
27 February 2018

Agenda
2
Operations and business review
Will Gardiner, CEO
Financial review
Den Jones, Interim CFO
Delivering the strategy
Will Gardiner, CEO

2017 Summary
3
Excellent progress in delivering the strategy: continuing to transform the Group into an integrated low-carbon energy company
Strong financial and operational performance
Sustainable and growing dividend with return of capital to shareholders

Milestones
4
Financial
Strategic
64% increase in Group EBITDA and strong cash generation
Refinancing complete, supporting strategy
Net debt below target level
Sustainable and growing dividend
Initiating share buy back programme
Acquisition and on-boarding of Opus Energy
Acquisition and commissioning of LaSalle Bioenergy
Government support for fourth biomass unit
Development of options for new gas generation

B2B Energy SupplyLeading UK energy supplier
EBITDA >£80m(1)
Pellet ProductionAt least 30% self-supply
EBITDA >£75m(1)
Power GenerationKey part of UK infrastructure
EBITDA >£300m(1)
Drax Group 2025 EBITDA in Excess of £425m
5
High quality growing earnings across all areas of operation
Underpinned by safety, sustainability, operational excellence and expertise in our markets
(1) Excludes central costs

B2B Energy SupplyLeading UK energy supplier
EBITDA £29m
Power GenerationKey part of UK infrastructure
EBITDA £238m
Pellet ProductionAt least 30% self-supply
EBITDA £6m
Excellent Progress in 2017
6
Underpinned by safety, sustainability, operational excellence and expertise in our markets
Group EBITDA £229m, investment in strategy and shareholder returns
Group EBITDA£229m
Net debt£367m
Total Dividend12.3p/share (£50m)
Net cash from operating activities£315m
Share buyback£50m
(1) Excludes central costs and consolidation £44m

Operations and Business Review

Safety and Sustainability
8
Safety
Strong Group performance
Sustainability
Biomass sustainability
– Proven carbon abatement(1)
– 86% saving versus coal
– 64% saving versus gas
– Well established governance and audit process
Strong corporate governance
– Member of UN Global Compact (UNGC)
(1) Calculated using UK Solid & Gaseous Biomass Carbon Calculator, Ofgem
(2) 2017 average biomass supply chain GHG emissions
0
0.1
0.2
0.3
0.4
2015 2016 2017
Total Recordable Injury Rate
0
20
40
60
80
100
2015 2016 2017
Carbon Life Cycle Emissions - CO2-eq/MJ(2)
UK target 2015-2020

Pellet ProductionFocus on good quality pellets at lowest cost
9
US operations performing well
£12m increase in EBITDA
35% growth in pellet production to 0.8m tonnes
– Producing nameplate capacity on consistent basis
Low cost expansion of Amite and Morehouse complete
– Increase capacity by c.150k tonnes
– Greater utilisation of lower cost residues
Optimise locational benefits of assets
Provide supply chain flexibility
LaSalle Bioenergy
Commenced commissioning November 2017
Increase production through 2018
Evaluating opportunities for further capacity
Self-supply target
0.0
0.5
1.0
1.5
2.0
2.5
3.0
2016 2017 2018
LaSalle Capacity Incremental capacity
Amite & Morehouse capacity Production
Target
Pellets capacity, production and self-supply target (mt)
EBITDA
£6m(2016: £(6)m)

Power GenerationLarge scale renewable and optimisation of generation assets
10
Strong financial performance
£64m increase in EBITDA
– Majority of revenues from long-term renewable power generation
– 9% of Group revenues from coal power sales
– Fuel hedging supports cost stability
– Long-term fuel contracts
– Strong FX hedge to 2022
– £88m from system support and flexibility(1)
– Capacity payments – £90m secured for 2017-2022
Strong operations
Reliable and responsive generation
Major planned outage on CfD unit successfully completed
Good response to unplanned outage in December 2017
– Optimised generation and supply chain to minimise impact
Biomass Generation
65% of total generation
(2016: 65%)
Biomass Generation
13.0TWh(2016: 12.7TWh)
Total Generation
20.0TWh(2016: 19.6TWh)
EBITDA
£238m(2016: £174m)
(1) Trading optimisation, balancing market, ancillary services and advantaged coals

B2B Energy SupplyProfitable business with growth in sales and customer meters
11
Good operational and financial performance
£33m increase in EBITDA
12% growth in customer meter points(1)
46% of sales renewable(2)
Continued investment in next generation IT systems
– Platform for future growth, competitive advantage and efficiencies
Opus Energy
Delivering in line with plan
Haven Power
Exceeded EBITDA breakeven target
EBITDA
£29m(2016: £(4)m)
Opus Energy
Utilities provider of the year(3)
Power Sales
18.1TWh(2016: 14.6TWh)
Gas Sales
2.0TWh(2016: N/A)
(1) Underlying growth in customer meters adjusted to reflect Opus Energy and Haven Power
(2) Sold as renewable power
(3) British Small Business Awards
Customer Meters
375,000 (2016: 335,000)

Financial Review

Financial HighlightsDen Jones – Interim CFO
13
EBITDA
£229m (2016: £140m)
Underlying EPS(1)
0.7p(2016: 5.0p)
(1) 2017 underlying earnings exclude unrealised losses on derivative contracts of £156m and material one-off items that do not reflect the underlying
performance of the business (transaction and on-boarding costs of £8m and finance costs of £24m) (2016: unrealised gains of £177m)
(2) Cash and short-term investments of £222m less borrowings of £589m
Net Cash From Operating Activities
£315m(2016: £191m)
Net Debt December 2017(2)
£367m(December 2016: £93m)
Total Dividend
12.3p (£50m)(2016 : 2.5p, £11m)
Net Debt to EBITDA
1.6x(December 2016: 0.7x)
Share Buy Back
£50m
Final Dividend
7.4p (£30m)(2016 : 0.4p, £2m)

Financial Review
14
Income statement 2017 £m 2016 £m
Revenue 3,685 2,950
EBITDA 229 140
Depreciation, amortisation and disposals (182) (113)
EBIT 47 27
Net finance cost(1) (42) (6)
Tax (2) -
Underlying profit after tax(2) 3 21
Cash and balance sheet 2017 £m 2016 £m
Net cash from operating activities 315 191
Net debt (367) (93)
(1) 2017 net finance charge for underlying earnings excludes £24m of one-off finance costs associated with refinancing
(2) 2017 underlying earnings exclude unrealised losses on derivative contracts of £156m and material one-off items that do not reflect the underlying
performance of the business (transaction and on-boarding costs of £8m and finance costs of £24m) (2016: unrealised gains of £177m)

EBITDA Bridge 2016 – 2017Strong improvement in EBITDA in all areas of operation
15
140
22933
12
64
(20)
0
50
100
150
200
250
2016 EBITDA Power Generation B2B Energy Supply Pellet Production Other 2017 EBITDA
£m

Increasing Earnings VisibilityReducing commodity exposure
16
Renewable power sales and support mechanisms
CfD revenues to 2027
ROC revenues to 2027
Associated power sales
Optimisation and system support
Balancing market, commercial buy-backs, ancillary services
Capacity payments 2017-2022
Development of gas options
Underpinned by 15-year capacity agreement
Predictable and growing energy supply sales
Power, gas and value added services

Net Cash FlowStrong cash generation
17
In £m 2017 2016
EBITDA 229 140
Working capital / other 147 63
Debt service (47) (21)
Tax (14) 9
Net cash from operating activities 315 191
Capital investment – maintenance and
improvement(127) (93)
Strategic investment
- Acquisition of Opus Energy (361) -
- Acquisition and commissioning of
LaSalle Bioenergy(48) -
- Acquisition of OCGT options (19) -
Net refinancing 257 -
Dividend (22) (11)
Other (1) 8
Net cash flow (6) 95
Working capital movement – £147m
ROCs – £112m
– Reduction in ROCs generated and held on balance sheet – transition from ROC to CfDsupport
Receivables – £61m
– Haven Power facility
– Lower power sales Dec-16 to Dec-17
Other - (£26m)
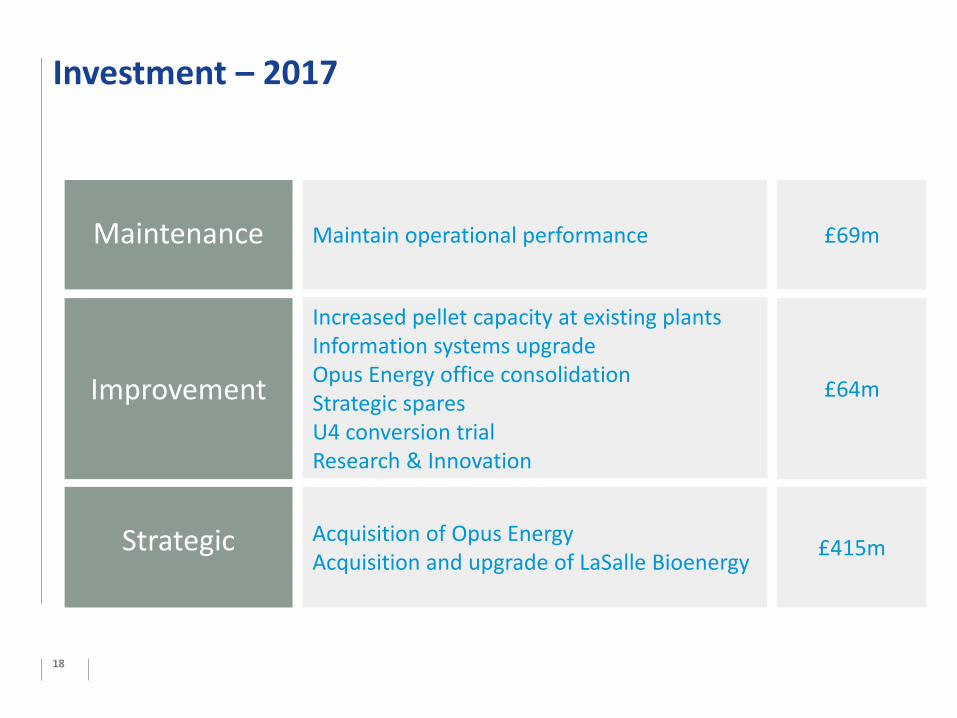
Investment – 2017
18
Maintenance Maintain operational performance
Improvement
Increased pellet capacity at existing plantsInformation systems upgradeOpus Energy office consolidation Strategic sparesU4 conversion trialResearch & Innovation
£69m
Acquisition of Opus EnergyAcquisition and upgrade of LaSalle Bioenergy
£415mStrategic
£64m

Financial Structures in Place to Support Growth
19
Refinancing completed
Maintain credit rating
Supportive of trading strategy
Robust to low points in business cycle
Rating reiterated by S&P and Fitch
Working capital management
Commitment to capital discipline
2017 net debt / EBITDA 1.6x
£550m high yield bond
-£350m fixed-£200m floating-Five-year term
£350m RCF

2017 SummaryStrong financial performance
20
Growth in EBITDA and cash generation
Strong cost and cash management
Financial structure in place to support growth
Investment in strategy
Sustainable and growing dividend
Return of capital to shareholders

Delivering the Strategy

Changing UK Energy System
22
UK energy revolution
Transition to a low-carbon economy
First step is low-carbon power generation
Requires a more flexible electricity system
Ultimately low-carbon power will need to be economic without support
Beyond power, the low-carbon economy will require new energy solutions for transport and heating

Changing UK Energy SystemIncreasing need for ancillary services and system support
23
Change in generation mix
Coal, older gas and nuclear approaching end of operational life
Increase in intermittent renewables – wind and solar
Reduction in system support capability
Ancillary services traditionally provided by thermal plant
– Frequency, voltage control, back-up power and inertia
Capacity market
Favours low capex, low load factor
No significant new thermal plant
Increase in system volatility
Within five years corrective action may be required up to 60% of time(1)
(1) System Needs and Product Strategy, National Grid
(2) Digest of UK Energy Statistics and Future Energy Scenarios and National Grid
Generation System support
Type Power Renewable Balancing Prompt Ancillaryservices
Biomass
Wind Some
Solar
Coal
Gas
Nuclear
Service capability by asset type
(35)
(25)
(15)
(5)
5
15
25
35
45
55
Thermal2012-2018
Renewable2012-2018
Thermal2012-2025
Renewable2012-2025
GW
Change in Generation Capacity 2012 – 2025(2)

Development of Options for a Coal-free FutureFlexible, low-carbon generation and system support
24
Fourth biomass unit
Supportive of Government energy policy
Low capital cost
Optimise generation across all ROC units
Open Cycle Gas Turbine
Four x 299MW developments
Two sites with permits – participation in next T-4 auction
Investment options progressed during 2017
Investment subject to 15-year capacity agreements
Coal-to-gas repowering
Option to convert two coal units to gas
– Aligned with coal closure by 2025
Investment subject to 15-year capacity agreements

B2B Energy SupplyGrowing to become the leading B2B supplier, differentiated from incumbents
25
2017 2018 2019 2020 2021 2022 2023 2024 2025 2026 2027
2017 EBITDA
Benefit of 12 months of OpusIn-sourcing power and gas
Growth
Time
Grow Transform Innovate

Clear Capital Allocation PolicyCommitment to capital discipline
26
Maintain credit rating
Invest in core business activities
Pay a sustainable and growing dividend
Commitment to return capital to shareholders
2017 net debt / EBITDA 1.6x
2017 full year dividend of £50m
£50m share buy back

Outlook2018 priorities and outlook
27
Pellet Production- Commissioning of LaSalle Bioenergy
- Development of options for optimisation and
efficiencies
- Consistent production and quality of pellet
B2B Energy Supply- Continued growth in customer meters
- Operational efficiencies and customer service
- Investment in systems to support growth and
Smart compliance
- Development of value added services
Power Generation- Reliable biomass generation
- Development of fourth biomass unit
- System support services
- Development of OCGT options
- Development of coal-to-gas option
Outlook- Continued EBITDA growth
- Investment in strategy
- Commitment to capital and cost discipline
- Return of capital to shareholders

Appendices
28
1. Definitions
2. Strategy and Competitive Advantage
3. Drax Model Summary
4. Financial Assumptions
5. IAS 39 Treatment
6. Group Income Statement
7. Group Underlying Earnings
8. Group Cash Flow Statement
9. Power Generation – Gross Profit
10. B2B Energy Supply – Gross Profit
11. Pellet Production – Gross Profit
12. Consolidated EBITDA
13. ROC Reporting
14. Tax Reconciliation
15. Group Balance Sheet
16. Contracted Power Sales
17. Commodity Price Movements
18. Forward Spread Movements 1
19. Forward Spread Movements 2
20. Coal Capacity and IED

Appendix 1: Definitions
29
Abbreviation Name Description
API2/4/6
API2 is the main reference price (including cost, freight and insurance) for steam coal to be delivered to
Amsterdam, Rotterdam and Antwerp. API4 is the reference price for steam coal to be delivered free on board
(“FOB”) to Richards Bay, South Africa. API6 is the reference price for steam coal to be delivered FOB to
Newcastle, Australia.
BM BALANCING MECHANISM
The mechanism through which the System Operator can call upon additional generation/consumption or
reduce generation / consumption, through market participants’ bids and offers, in order to balance the system
minute by minute.
EBITDAEarnings before interest, tax, depreciation, amortisation and material one-off items that do not reflect the
underlying trading performance of the business.
ELV EMISSION LIMIT VALUESOne of the mechanisms available to implement the LCPD. This sets annual limits on the emissions of NOX,
SO2 and particulate which will be incorporated into the forthcoming PPC permit.
EUA EU ALLOWANCE European Union Allowances, the tradable unit under the EU ETS. Equals 1 tonne of CO2.
EU ETS EU EMISSIONS TRADING SCHEMETrading Scheme within the European Union. The first compliance phase ran from 2005-07, the second
compliance phase continued from 2008-12 and the third phase is proposed to run from 2013-2020.
IED INDUSTRIAL EMISSIONS DIRECTIVEEuropean Parliament and the Council directive on industrial emissions is the main EU instrument regulating
pollutant emissions from industrial installations.
NOx Nitrogen oxides, emissions of which are regulated under the LCPD.
RO RENEWABLES OBLIGATIONThe obligation placed on licensed electricity suppliers to deliver a specified amount of their electricity from
eligible renewable sources.
ROC RENEWABLES OBLIGATION CERTIFICATE
The obligation requires licensed electricity suppliers to ensure that specified and increasing amounts of the
electricity they supply are from renewable sources. Eligible generators of electricity using renewable energy
sources receive a pre-specified number of ROCs per MWh of renewable power generation dependant on
date of commission and technology. These certificates can then be traded.
TRIR TOTAL RECORDABLE INJURY RATETRIR is calculated on the following basis (lost time injuries + worse than first aid injuries) /
hours worked * 100,000.

Appendix 2: Strategy and Competitive Advantage
30
Area Strategy Competitive Advantage
Pellet Production• Target at least 30% self-supply• Low cost good quality pellets
• Expertise in US markets and logistics
Power Generation• Expand to support low carbon future and
provide system support• World leader in flexible renewable energy• Expertise in optimisation of power
generation and commodity management
B2B Energy Supply
• Leading challenger brands• Innovative energy products• Grow to become leading B2B provider
• Expertise in B2B markets• Platforms to support growth, innovation and
flexibility• Renewable products and expertise
Drax Group
• Underlying growth in core business and cash generation
• Attractive investment opportunities• Increasing earnings visibility, reducing
commodity exposure• Strong balance sheet and clear capital
allocation plan
• Engineering and operational expertise• Integrated value chain – source, procure and
manufacture biomass wood pellets; make renewable electricity and support UKelectricity grid; sales to UK business customers
• Logistics, operations and commodity risk management

31
Strategic ObjectiveHigher quality earnings, reducing commodity exposureTargeted long-term growth opportunities across the Group
Current Drax 2025 Other
Mar
kets
Pellet Production c.20% self-supply >30% self-supply target >£75m*New markets
Further optimisation
Generation
1 baseload CfD unit1 baseload CfD unit4 x 300MW OCGT
>£300m*
Coal-to-gas repowering
Further biomass generation
Supply chain optimisation
Research and Innovation
2 x ROC unitsSystem support services
3 x ROC unitsSystem support services
3 x coal unitsCapacity payments
Energy Supply Opus and Haven Opus and Haven >£80m* Products, services, markets
Strategy underpinned by strong financial structure and capital allocation plan
Capital allocation- Maintain credit rating- Investment in core business- Sustainable and growing dividend- Investment in value or distribution to shareholders
Strong balance sheet- £550m bonds (fixed and floating)- £350m RCF
Balance sheet objectives- 2017 target c.2x net debt/EBITDA- Maintain credit rating
Capital investment- Core - £50m pa- OCGT - £320-£360m- Increase pellet self-supply- Coal-to-gas repowering
Dividend policy- £50m in 2017, expected to grow over time- Affordable and sustainable - Return surplus capital to shareholders
* Excludes Central Costs
Appendix 3: Drax Model SummaryHigher quality earnings, cash generation and growth
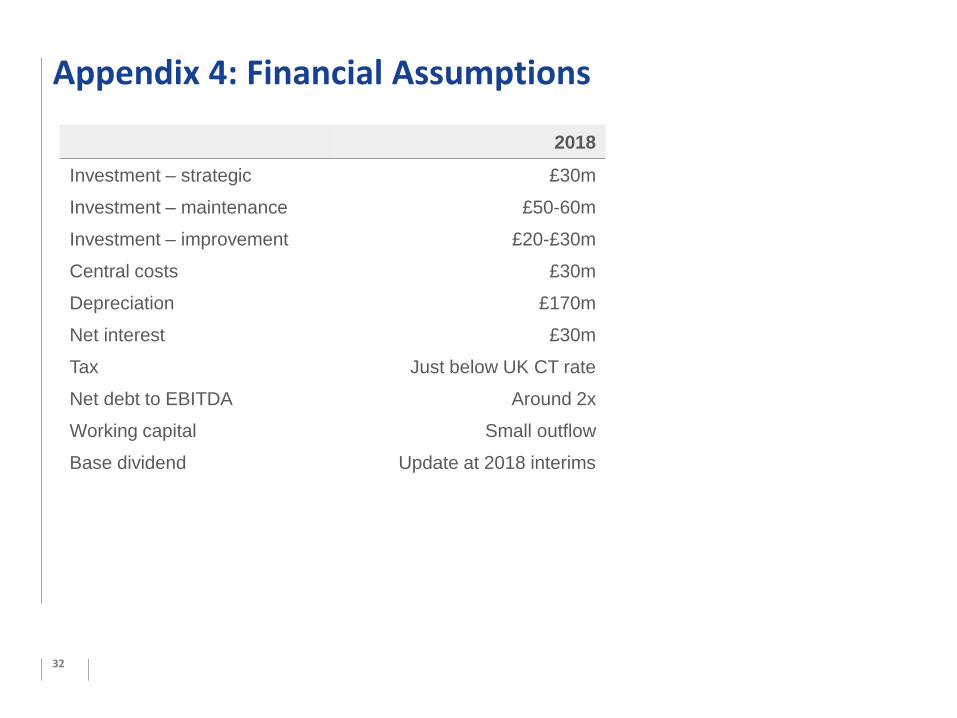
Appendix 4: Financial Assumptions
32
2018
Investment – strategic £30m
Investment – maintenance £50-60m
Investment – improvement £20-£30m
Central costs £30m
Depreciation £170m
Net interest £30m
Tax Just below UK CT rate
Net debt to EBITDA Around 2x
Working capital Small outflow
Base dividend Update at 2018 interims

Appendix 5: IAS 39 Treatment
33
Financial Instrument Location of gains and losses in the annual report
Power Hedge Reserve
International coal Income Statement
Financial coal Hedge Reserve and Income Statement
Foreign exchange Hedge Reserve and Income Statement
Carbon Hedge Reserve
Gas Income Statement
Oil Income Statement
Freight Income Statement
Wind Income Statement

Appendix 6: Group Income Statement
34
In £m 2017 2016 ▲%
Revenue 3,685 2,950
Cost of sales (3,140) (2,574)
Gross profit 545 376
Operating costs (316) (236)
EBITDA 229 140 64%
Unrealised (losses) / gains on derivative contracts (156) 177
Depreciation, amortisation and disposals (182) (113)
Other items (8) -
Operating (loss) / profit (117) 204
Net finance (cost) / credit (66) (7)
(Loss) / profit before tax (183) 197
Tax credit / (charge) 32 (3)
Reported (loss) / earnings (151) 194
Underlying earnings 3 21 (85)%
Reported basic (loss) / earnings per share (pence) (37) 48
Underlying basic earnings per share (pence) 0.7 5.0 (86)%
Total dividend per share (pence) 12.3 2.5

Appendix 7: Group Underlying Earnings
35
In £m 2017 2016 ▲%
Reported (loss) / earnings (151) 194
Unrealised losses / (gains) on derivative contracts 156 (177)
Other items 8 -
Cost of refinancing 24 -
Tax impact of above adjustments (34) 4
Underlying earnings 3 21 (86)%

Appendix 8: Group Cash Flow Statement
36
In £m 2017 2016 ▲%
EBITDA 229 140
Working capital / other 147 63
Debt service (47) (21)
Tax (14) 9
Net cash from operating activities 315 191 65%
Capital investment – maintenance and improvement (127) (93)
Capital investment – strategic
- Acquisition of Opus Energy (361) -
- Acquisition and commissioning of LaSalle Bioenergy (48) -
- Acquisition of OCGT options (19) -
Net refinancing 257 -
Dividend (22) (11)
Other (1) 8
Net cash flow (6) 95
Cash and cash equivalents at the beginning of the period 228 134
Net cash flow (6) 94
Cash and cash equivalents at the end of the period 222 228

Appendix 9: Power Generation – Gross Profit
37
In £m 2017 2016 ▲%
Revenue(1)
Power sales 1,789 1,876
ROC sales 627 548
CfD income 248 10
Ancillary services income 31 47
Fuel sales 8 4
Other income 17 6
2,720 2,491 9%
Cost of sales
Generation fuel costs (1,100) (1,012)
Fuel sold (7) (4)
ROC support 424 526
Carbon tax (101) (104)
Cost of carbon allowances (33) (38)
ROCs sold or utilised (590) (548)
Cost of power purchases (852) (905)
Grid charges (63) (69)
(2,322) (2,154) 8%
Gross profit 398 337 18%
(1) Includes sales to B2B Energy Supply of £950m (2016: £867m)

Appendix 10: B2B Energy Supply – Gross Profit
38
In £m 2017 2016 ▲%
Revenue 1,999 1,326 51%
Cost of sales
Cost of power and gas purchases (884) (689)
Grid charges (436) (310)
Other costs (562) (304)
(1,882) (1,303) 44%
Gross profit 117 23 409%

Appendix 11: Pellet Production – Gross Profit
39
In £m 2017 2016 ▲%
Revenue 136 74 84%
Cost of sales (97) (56) 73%
Gross profit 39 18 217%

Appendix 12: Consolidated EBITDA
40
In £mPower
Generation
B2B Energy
Supply
Pellet
ProductionAdjustments Consolidated
Segment EBITDA 238 29 6 (10) 263
Central costs (34)
Consolidated EBITDA 229
In £mPower
Generation
B2B Energy
Supply
Pellet
ProductionAdjustments Consolidated
Segment EBITDA 174 (4) (6) (2) 161
Central costs (21)
Consolidated EBITDA 140
Consolidated EBITDA 2017
Consolidated EBITDA 2016

Appendix 13: ROC Reporting
41
ROC assets In £m
At 1 January 2017 258
Generated 481
Utilised or sold (624)
At 31 December 2017 146
Balance sheet reconciliation
Generated – estimated benefit of generating electricity with biomass
Utilised or sold – original estimated balance sheet value charged to cost of sales on subsequent sale of ROC
Value at balance sheet date – estimate of cumulative ROC value generated not sold

Appendix 14: Tax Reconciliation
42
In £mReported Underlying
2017 2016 2017 2016
Profit / (loss) before tax (183) 197 3 21
Tax at UK CT rate 35 (39) (1) (4)
Adjustment to prior year
taxes and other Items(3) 36 (1) 4
Tax (charge) / credit 32 (3) (2) -
Effective tax rate 18% 2% 40% -
UK corporation tax (CT) rates
19.25% for 2017 and 20% for 2016
2017 underlying tax rate
Underlying rate excludes after tax impact of unrealised gains and losses on derivative and material one-off items
Adjustments to prior year taxes and other items
One-off non-cash charge (£16m) from the reduction in US federal tax rates from 35% to 21% following revaluation our deferred tax balances
Cash tax credit (£13m) from UK Patent Box tax regime, which rewards Drax patented innovation in biomass generation
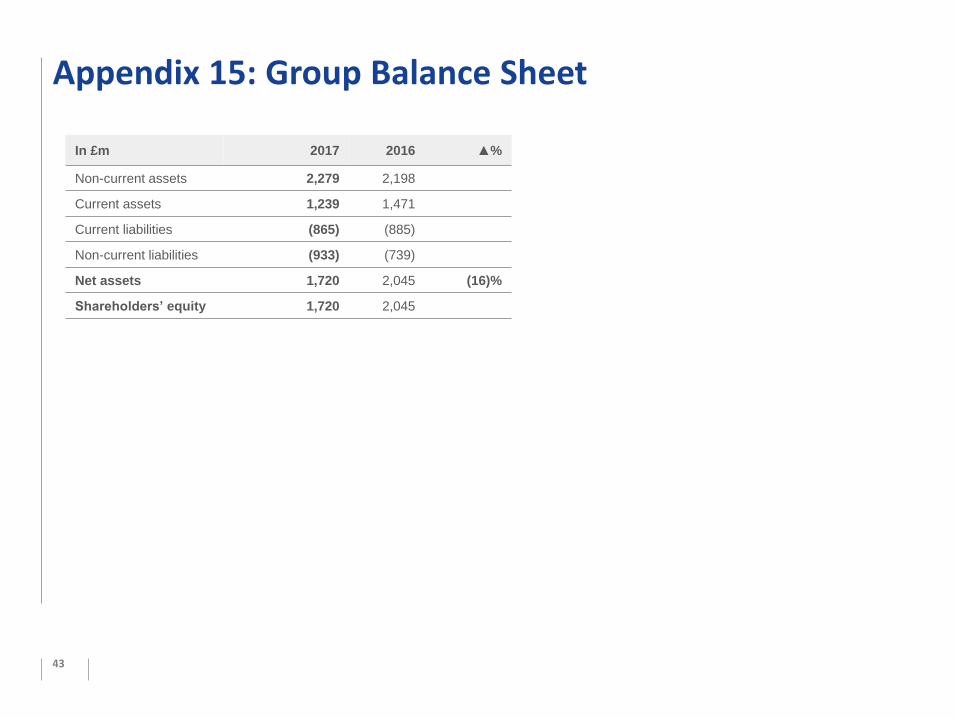
Appendix 15: Group Balance Sheet
43
In £m 2017 2016 ▲%
Non-current assets 2,279 2,198
Current assets 1,239 1,471
Current liabilities (865) (885)
Non-current liabilities (933) (739)
Net assets 1,720 2,045 (16)%
Shareholders’ equity 1,720 2,045

Appendix 16: Contracted Power Sales
44
Contracted at 20 February 2018 2018 2019 2020
Power sales (TWh) 16.6 7.3 3.0
- Fixed price power sales (TWh) 15.9 6.0 2.2
At an average achieved price (per MWh) £43.8 £43.1 £42.0
- Gas hedges (TWh) 0.6 1.4 0.8
At an achieved price per therm 41.3p 45.0p 48.0p

Appendix 17: Commodity Price Movements
45
3
4
5
6
7
8
9
Jan-16 Jul-16 Jan-17 Jul-17
€/t
EUA Carbon Price
Dec-17 Dec-18 Dec-19 Dec-2025
30
35
40
45
50
55
Jan-16 Jul-16 Feb-17 Aug-17 Mar-18
£/M
Wh
Power Price (UK)
Sum-17 Win-17 Sum-18 Win-18 Sum-19 Win-19
30
40
50
60
70
80
90
100
Jan-16 Jul-16 Feb-17 Aug-17 Mar-18
$/t
Coal Prices (API#2)
Cal-17 Cal-18 Cal-19 Cal-20
25
30
35
40
45
50
55
Jan-16 Jul-16 Feb-17 Aug-17 Mar-18
p/t
h
Gas Prices (NBP)
Sum-17 Win-17 Sum-18 Win-18 Sum-19 Win-19

Appendix 18: Forward Spread Movements 1
46
Source: Drax. Assumed typical efficiencies: Dark Green Spread – 36%, Clean Spark Spread – 53%, as at February 2018
(10)
(5)
0
5
10
Jan-16 Jul-16 Feb-17 Aug-17 Mar-18
£/M
Wh
Dark Green Spread
Sum-17 Win-17 Sum-18
Win-18 Sum-19 Win-19
-10
-5
0
5
10
Jan-16 Jul-16 Feb-17 Aug-17 Mar-18
£/M
Wh
Clean Spark Spread
Sum-17 Win-17 Sum-18
Win-18 Sum-19 Win-19

Appendix 19: Forward Spread Movements 2
47
0
5
10
15
20
25
30
35
40
Jan-16 Jul-16 Feb-17 Aug-17 Mar-18
£/M
Wh
Peak RO Bark Spread
Win-17 Win-18
0
5
10
15
20
25
30
35
40
Jan-16 Jul-16 Feb-17 Aug-17 Mar-18
£/M
Wh
Baseload RO Bark Spread
Sum-17 Win-17
Sum-18 Win-18
Sum-19 Win-19

Appendix 20: Coal Capacity and IED
48
Installation Operator Fuel Capacity (GWe) IED(1)
Decision 17/18 CM(4) 18/19 CM(4) 19/20 CM(4) 20/21 CM(4) 21/22 CM(4)
Fiddlers Ferry SSE Coal 2.0 TNP(2) Yes Yes No No No
Eggborough EPH Coal 1.9 LLD(3) Yes No No No No
Cottam EDF Energy Coal 2.0 TNP(2) Yes Yes No No No
West Burton EDF Energy Coal 2.0 TNP(2) Yes Yes(5) No Yes(5) No(5)
Aberthaw RWE npower Coal 1.6 TNP(2) Yes Yes Yes Yes No
Drax Drax Power Coal 2.0 TNP(2) Yes(6) Yes(6) Yes(6) Yes(6) Yes(6)
Ratcliffe E.ON UK Coal 2.0 TNP(2) Yes Yes Yes Yes Yes
Total GWe 13.5
(1) Industrial Emissions Directive
(2) Transitional National Plan
(3) Limited Life Derogation
(4) Capacity Market
(5) Three units 2018/19 and 2020/21
(6) Two coal units and three gas turbines at Drax Power Station

Full Year Results12 Months Ended 31 December 2017
27 February 2018