frontier corporation
TRANSCRIPT
1
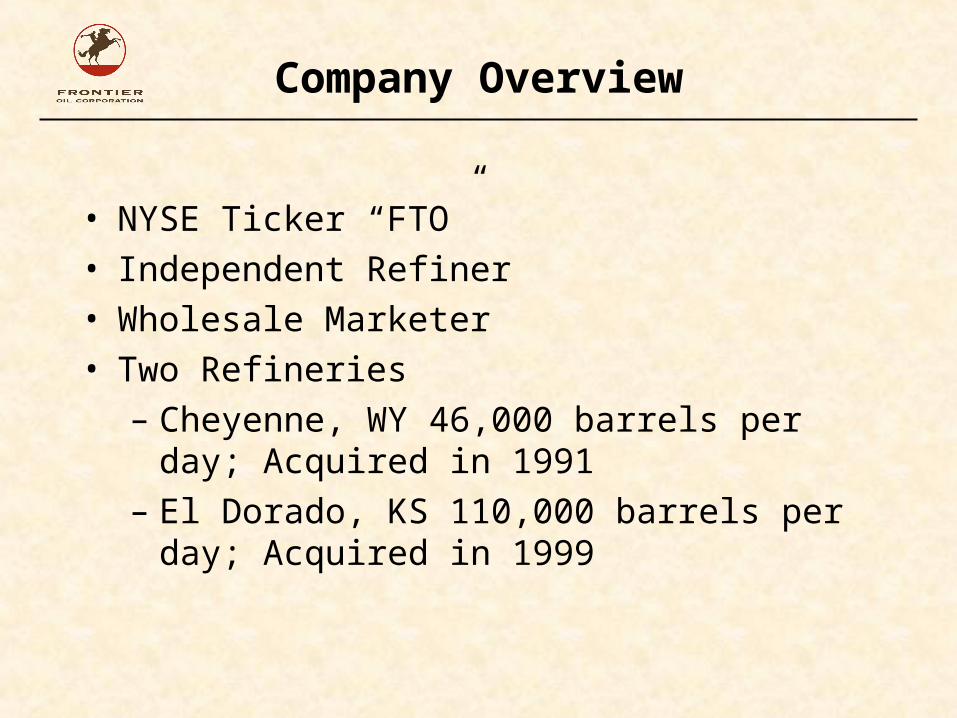
Company Overview
• NYSE Ticker “FTO”
• Independent Refiner
• Wholesale Marketer
• Two Refineries
– Cheyenne, WY 46,000 barrels per day; Acquired in 1991
– El Dorado, KS 110,000 barrels per day; Acquired in 1999
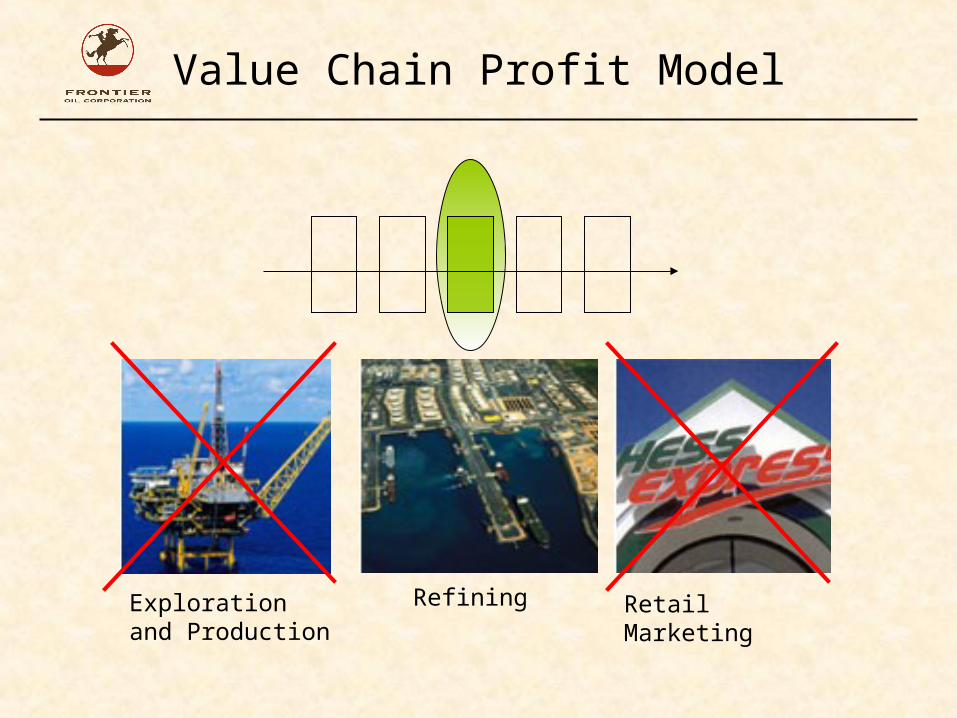
Value Chain Profit Model
Refining Retail MarketingExploration and Production
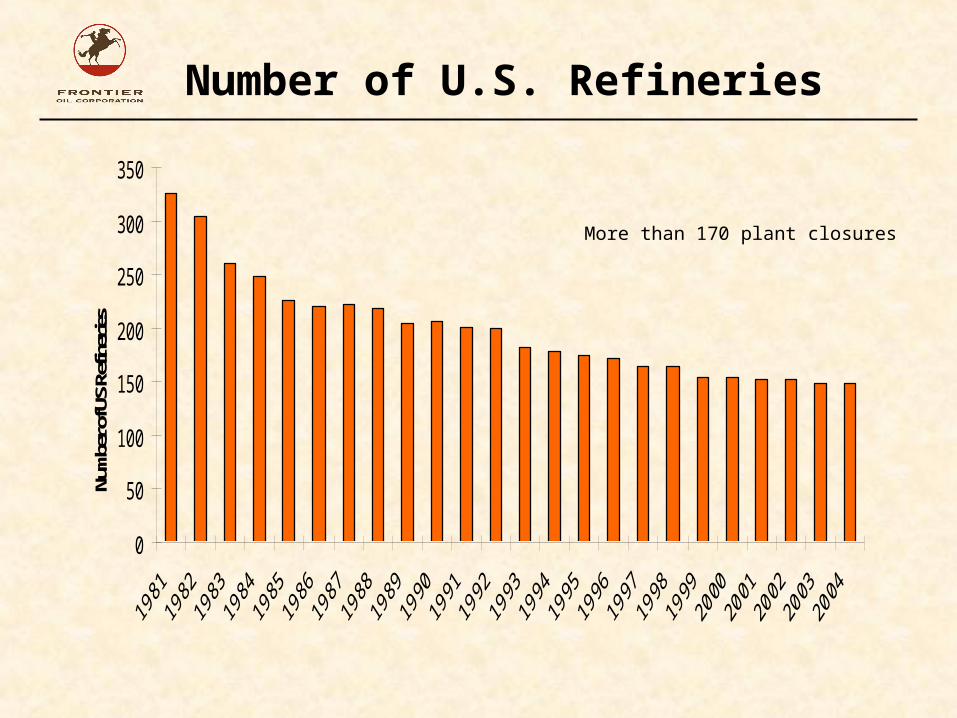
Number of U.S. Refineries
0
50
100
150
200
250
300
350
Num
ber o
f US R
efine
ries
More than 170 plant closures
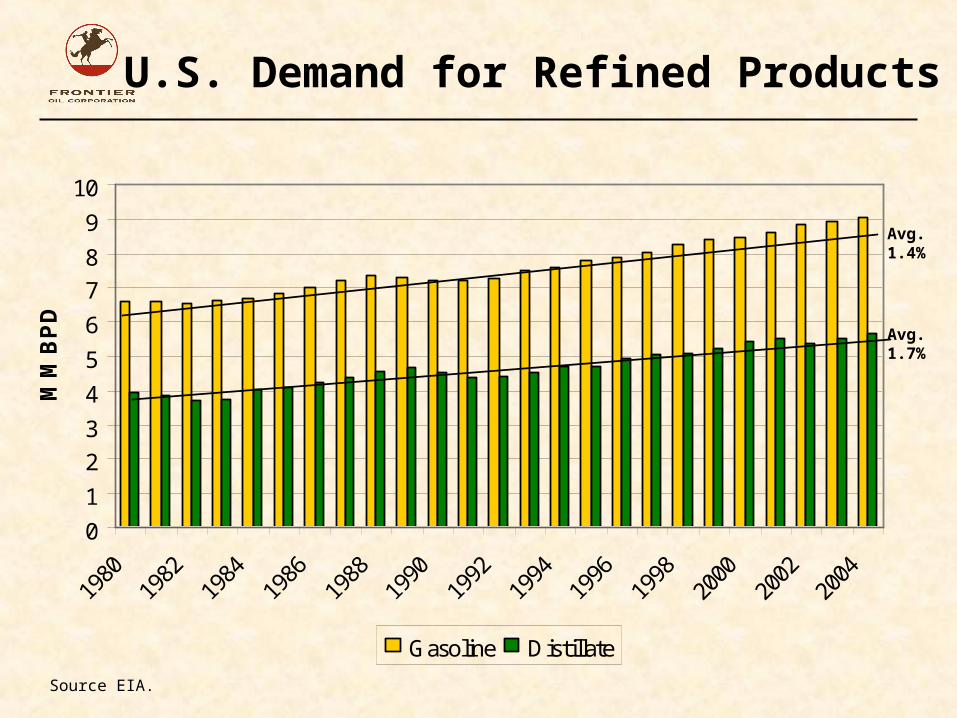
0
1
2
3
4
5
6
7
8
9
10
MM
BP
D
Gasoline Distillate
U.S. Demand for Refined Products
Avg. 1.4%
Avg. 1.7%
Source EIA.
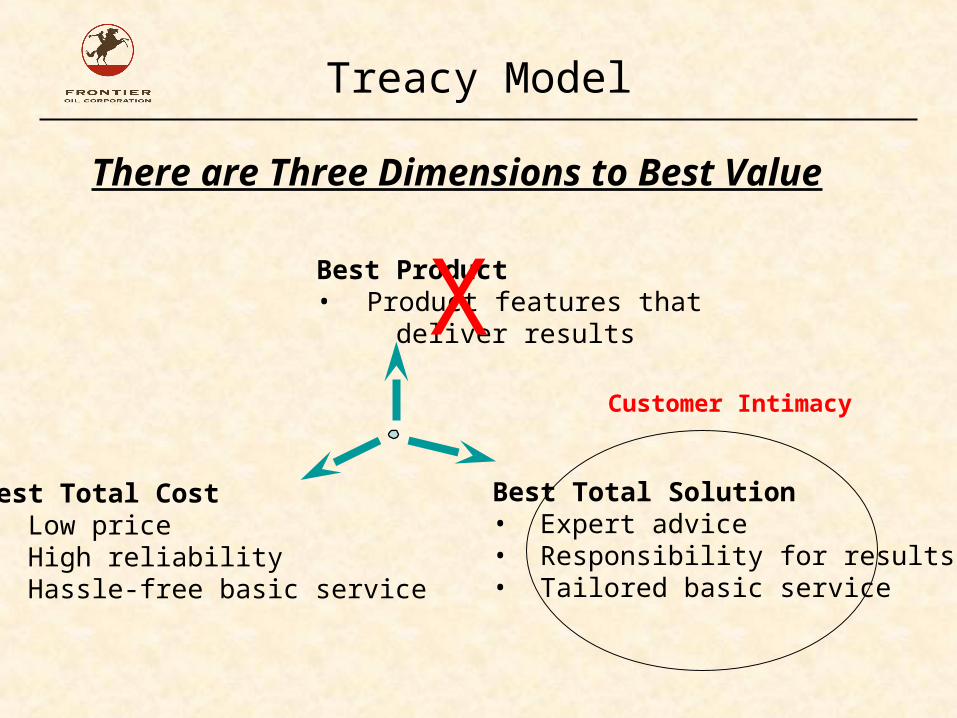
There are Three Dimensions to Best Value
Best Product• Product features that deliver results
Best Total Cost • Low price • High reliability• Hassle-free basic service
Best Total Solution• Expert advice• Responsibility for results• Tailored basic service
Treacy Model
XCustomer Intimacy
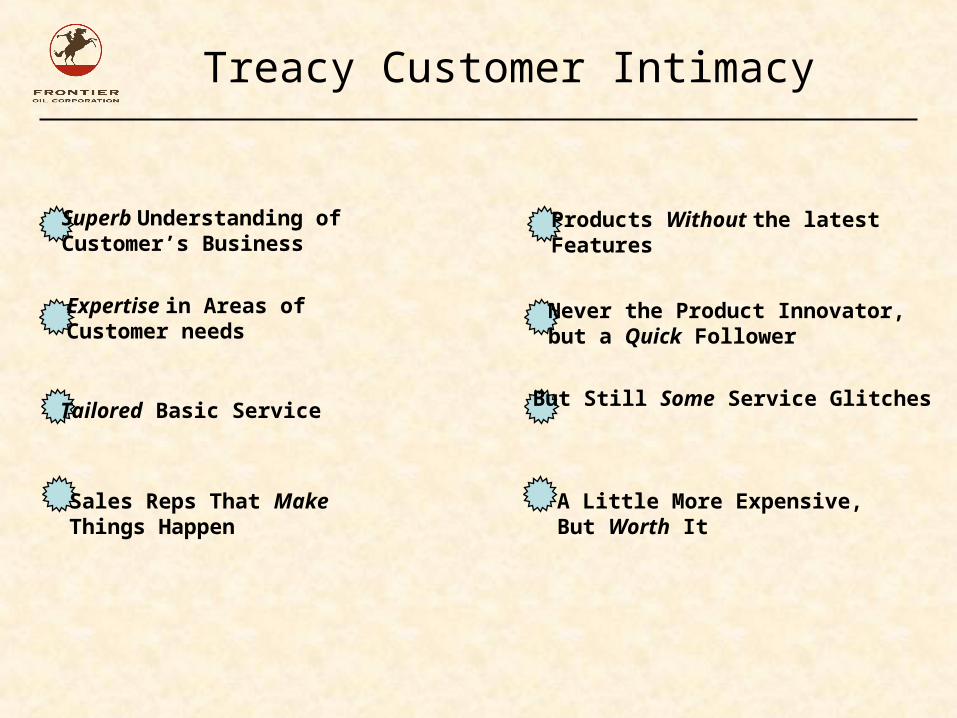
Treacy Customer Intimacy
Never the Product Innovator,but a Quick Follower
Tailored Basic Service But Still Some Service Glitches
Superb Understanding of Customer’s Business
Products Without the latestFeatures
Expertise in Areas of Customer needs
Sales Reps That Make Things Happen
A Little More Expensive, But Worth It
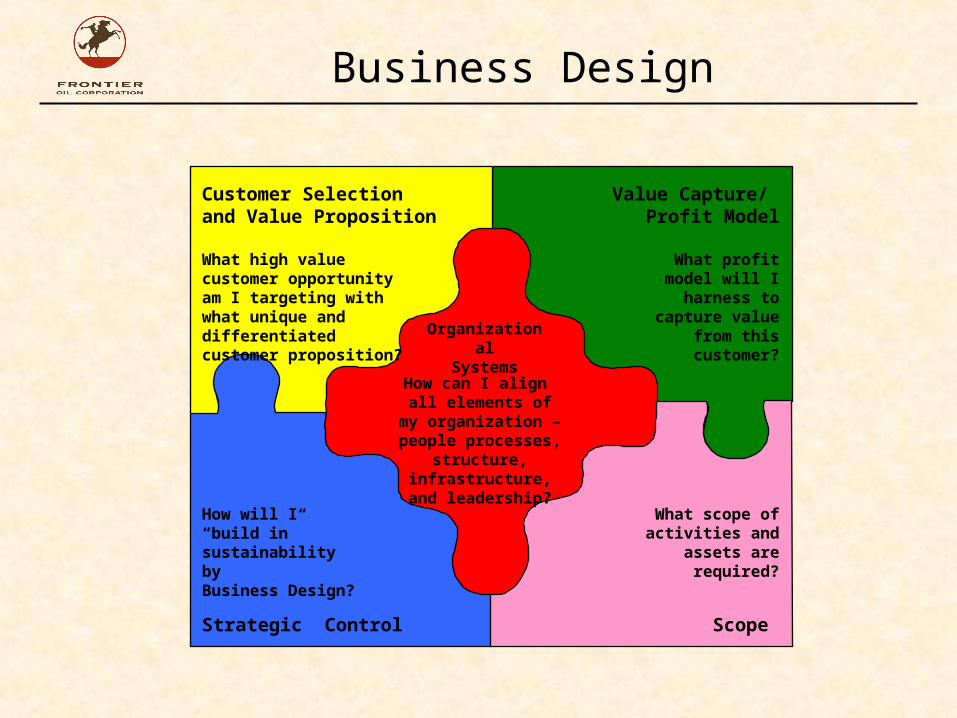
Strategic Control
Value Capture/ Profit Model
Scope
Customer Selectionand Value Proposition
OrganizationalSystems
How can I align all elements of my
organization – people processes, structure,
infrastructure, and leadership?
What high value customer opportunity am I targeting with what unique and differentiated customer proposition?
What profit model will I harness to
capture value from this customer?
How will I “build in”sustainability byBusiness Design?
What scope of activities and
assets are required?
Business Design
1. Serve the market only as a wholesaler.2. Eliminates the competition with your customer. (i.e. Exxon, BP, etc.)3. Sell to customers that can’t buy elsewhere. (i.e. Costco, King Soopers)4. Always have product available for your customers, even if you buy
additional barrels in the market.
CustomerSelection andValue Proposition
Customer Selection and Value Proposition
1. Profit is largely a function of commodity price.2. Profit from the value chain profit model by staying focused.3. Make projections based on 5-years averages.4. Maintain adequate liquidity to meet minimum capital expenditures for down
years that don’t meet profit expectations.
Value Capture/Profit Model
Value Capture / Profit Model
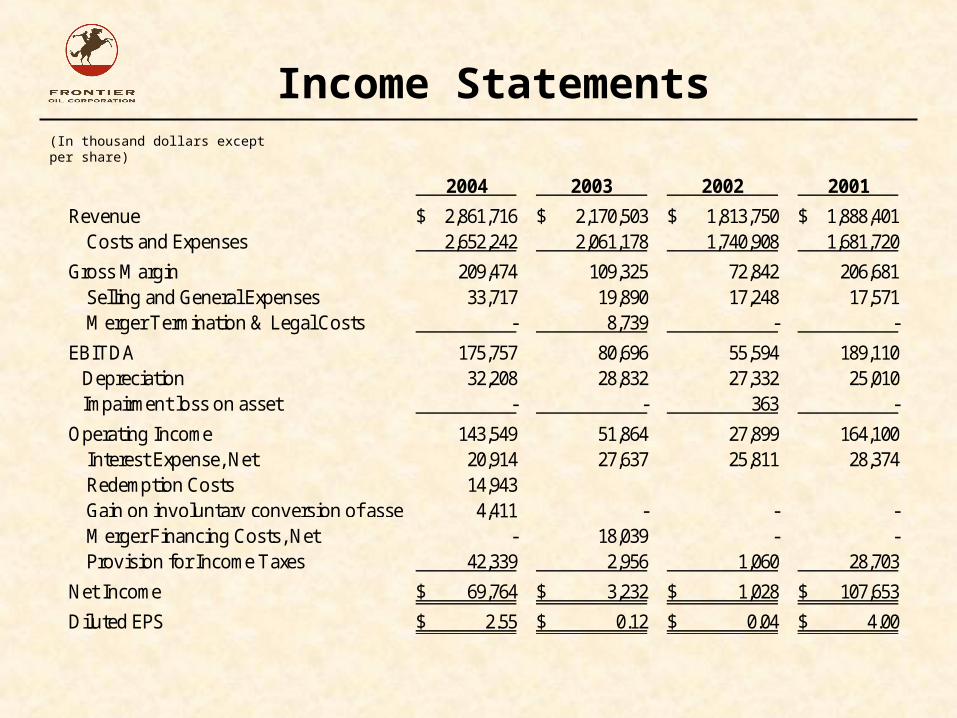
Income Statements(In thousand dollars except per share)
2004 2003 2002 2001
Revenue 2,861,716$ 2,170,503$ 1,813,750$ 1,888,401$ Costs and Expenses 2,652,242 2,061,178 1,740,908 1,681,720
Gross Margin 209,474 109,325 72,842 206,681 Selling and General Expenses 33,717 19,890 17,248 17,571 Merger Termination & Legal Costs - 8,739 - -
EBITDA 175,757 80,696 55,594 189,110 Depreciation 32,208 28,832 27,332 25,010 Impairment loss on asset - - 363 -
Operating Income 143,549 51,864 27,899 164,100 Interes t Expense, Net 20,914 27,637 25,811 28,374 Redemption Costs 14,943 Gain on involuntary convers ion of assets 4,411 - - - Merger Financing Costs , Net - 18,039 - - Provis ion for Income Taxes 42,339 2,956 1,060 28,703
Net Income 69,764$ 3,232$ 1,028$ 107,653$
Diluted EPS 2.55$ 0.12$ 0.04$ 4.00$
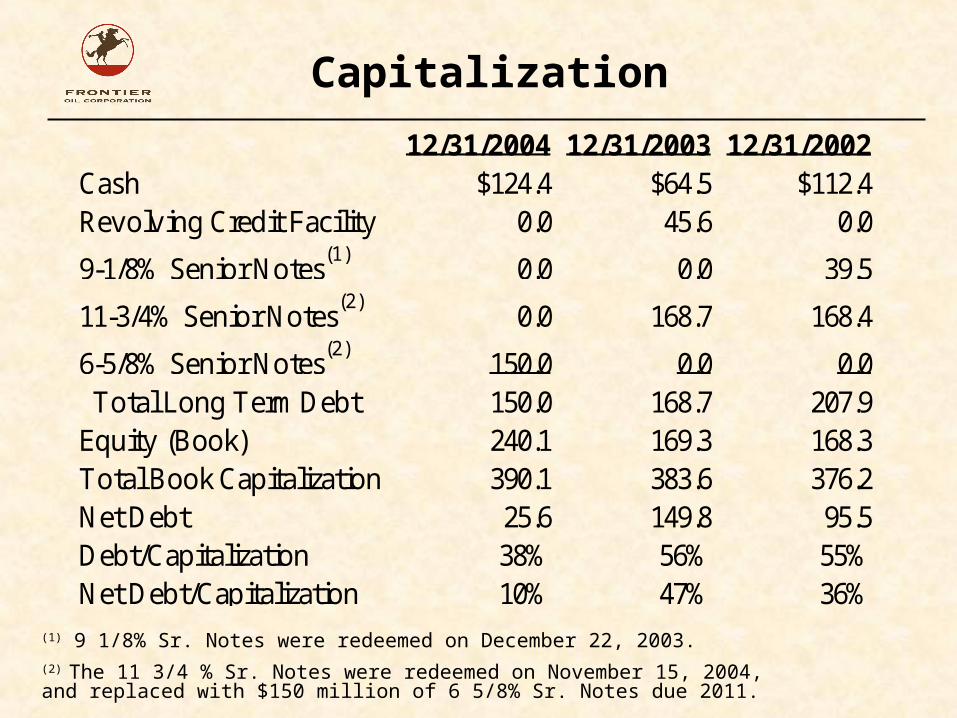
Capitalization
(1) 9 1/8% Sr. Notes were redeemed on December 22, 2003.(2) The 11 3/4 % Sr. Notes were redeemed on November 15, 2004, and replaced with $150 million of 6 5/8% Sr. Notes due 2011.
12/31/2004 12/31/2003 12/31/2002Cash $124.4 $64.5 $112.4Revolving Credit Facility 0.0 45.6 0.0
9-1/8% Senior Notes(1)
0.0 0.0 39.5
11-3/4% Senior Notes(2)
0.0 168.7 168.4
6-5/8% Senior Notes(2)
150.0 0.0 0.0 Total Long Term Debt 150.0 168.7 207.9Equity (Book) 240.1 169.3 168.3Total Book Capitalization 390.1 383.6 376.2Net Debt 25.6 149.8 95.5Debt/Capitalization 38% 56% 55%Net Debt/Capitalization 10% 47% 36%
1. Protect profits by buying cheaper feedstock.2. Valero can process heavy/sour crude as well, but they don’t sell a significant number of barrels in our markets.3. Customers buy from me because I am reliable source of product.4. No new refineries have been built since 1976 proving barriers to entry are very high.
Strategic Control
Strategic Control
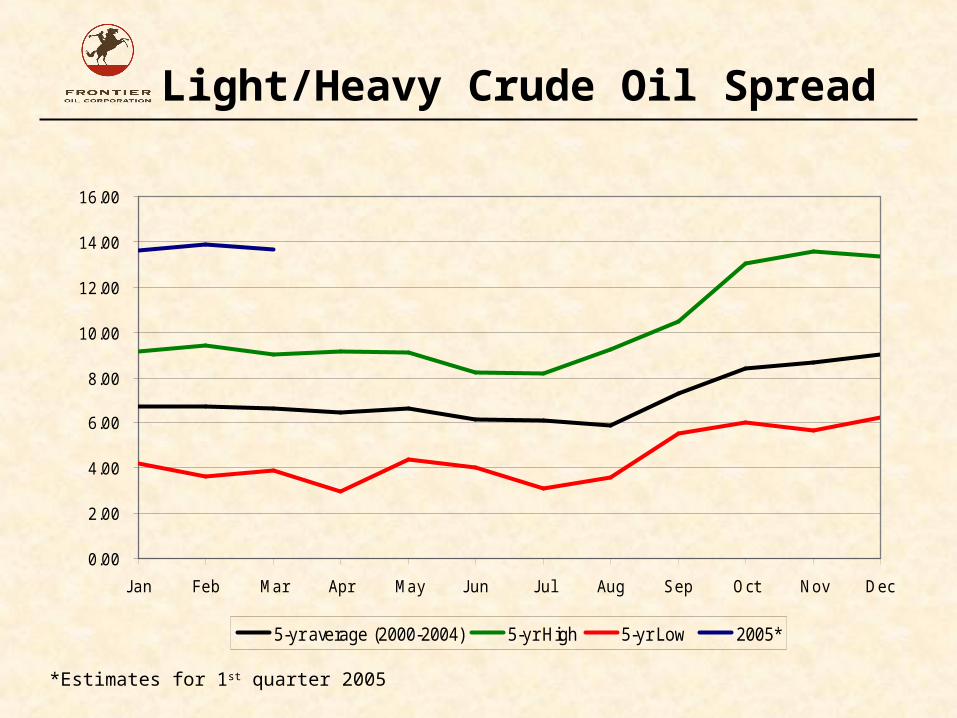
Light/Heavy Crude Oil Spread
0.00
2.00
4.00
6.00
8.00
10.00
12.00
14.00
16.00
Jan Feb Mar Apr May Jun Jul Aug Sep Oct Nov Dec
5-yr average (2000-2004) 5-yr High 5-yr Low 2005*
*Estimates for 1st quarter 2005
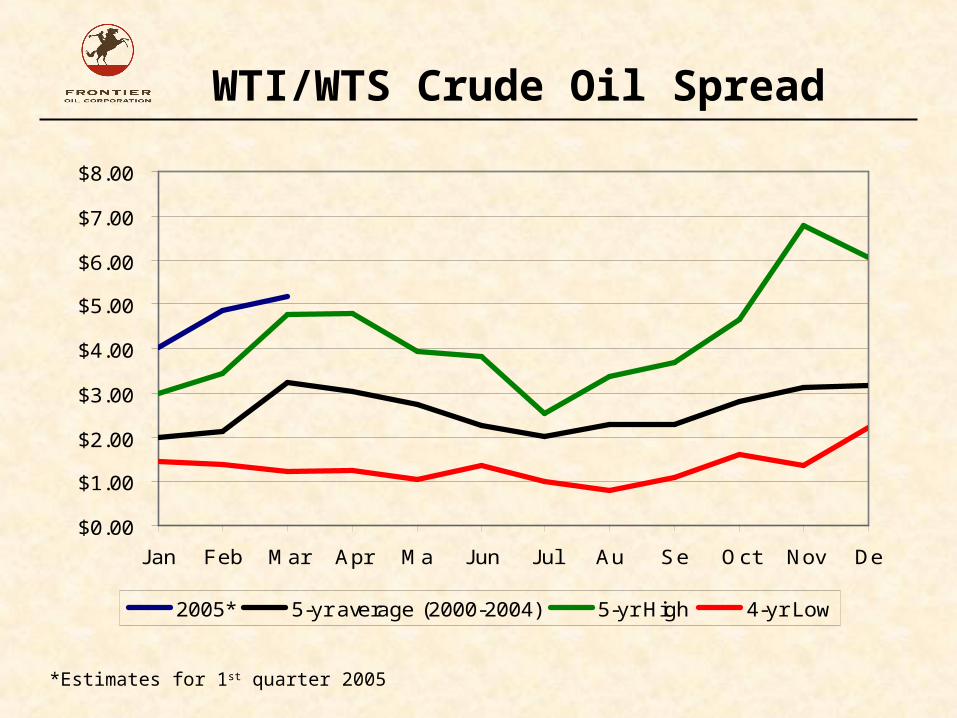
WTI/WTS Crude Oil Spread
$0.00
$1.00
$2.00
$3.00
$4.00
$5.00
$6.00
$7.00
$8.00
Jan Feb Mar Apr Ma Jun Jul Au Se Oct Nov De
2005* 5-yr average (2000-2004) 5-yr High 4-yr Low
*Estimates for 1st quarter 2005
1. We are an independent refiner and wholesale marketer….nothing else!!2. We sell gasoline, distillate, asphalt and a few other byproducts.3. Strategic partners for crude supply arrangements and product off-take
agreements can help reduce volatility.
Scope
Scope
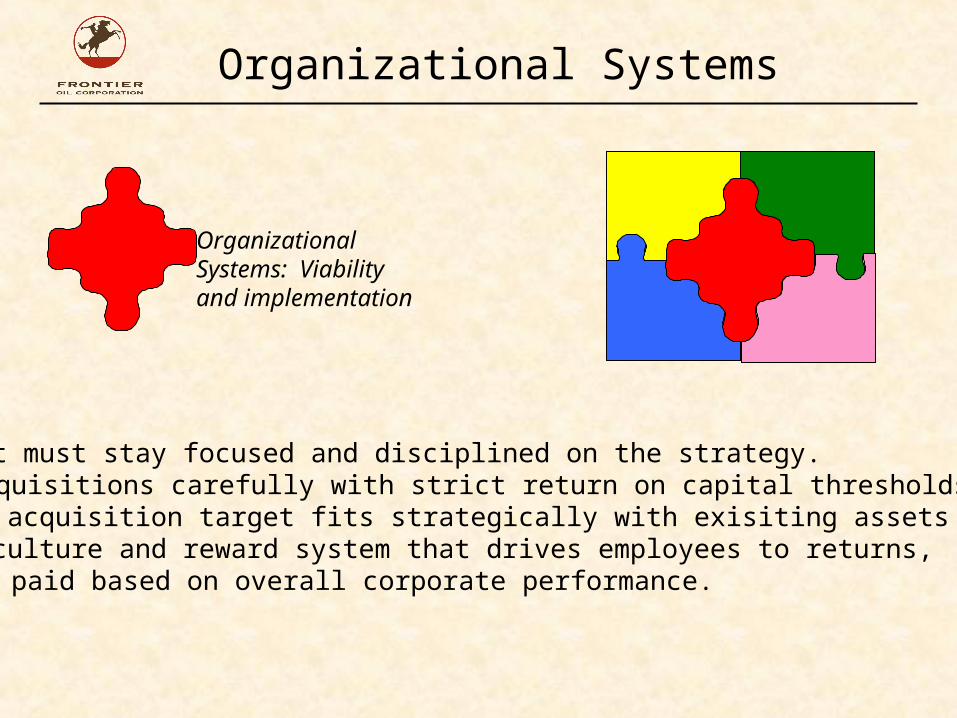
1. Management must stay focused and disciplined on the strategy.2. Evaluate acquisitions carefully with strict return on capital thresholds3. Make sure acquisition target fits strategically with exisiting assets and 4. Create a culture and reward system that drives employees to returns,
bonuses are paid based on overall corporate performance.
OrganizationalSystems: Viability and implementation
Organizational Systems
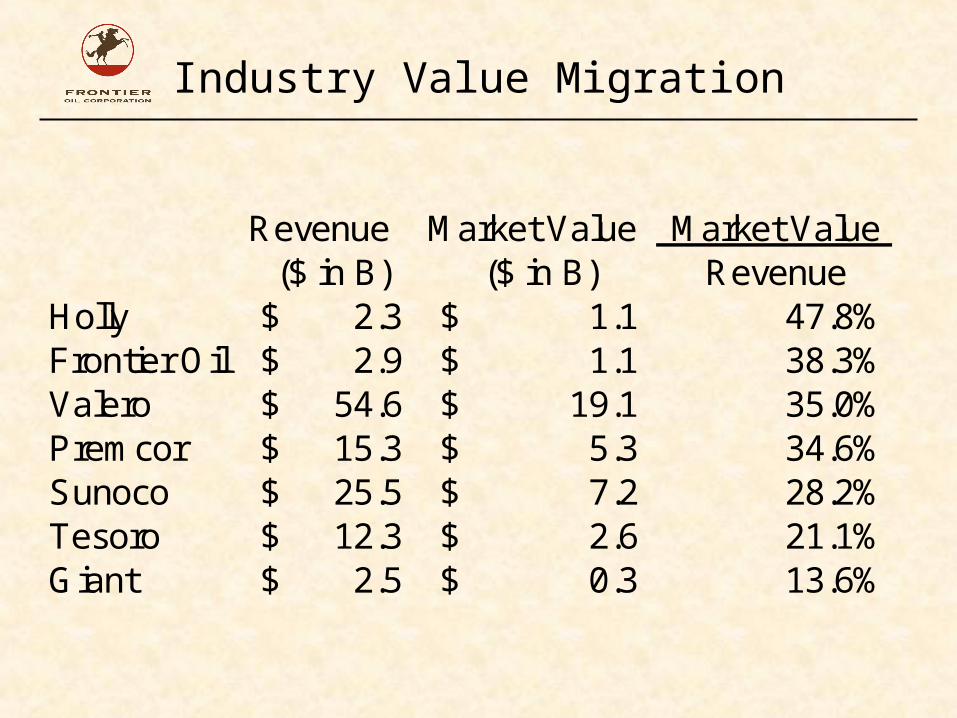
Revenue Market Value Market Value($ in B) ($ in B) Revenue
Holly 2.3$ 1.1$ 47.8%Frontier Oil 2.9$ 1.1$ 38.3%Valero 54.6$ 19.1$ 35.0%Premcor 15.3$ 5.3$ 34.6%Sunoco 25.5$ 7.2$ 28.2%Tesoro 12.3$ 2.6$ 21.1%Giant 2.5$ 0.3$ 13.6%
Industry Value Migration
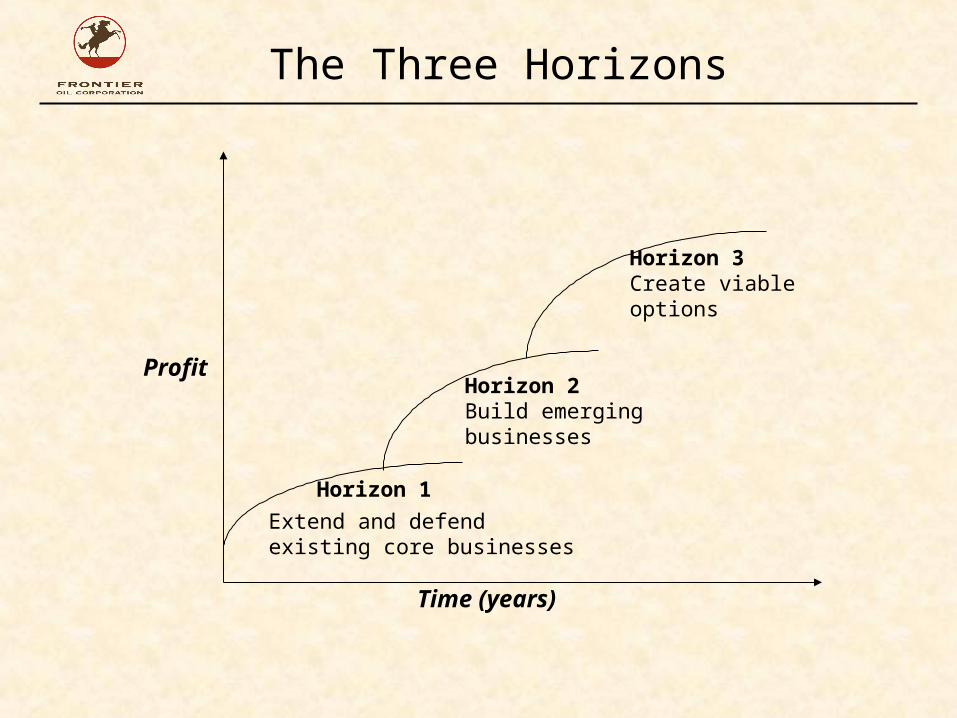
Time (years)
Profit
Extend and defendexisting core businesses
Horizon 2Build emergingbusinesses
Horizon 3Create viableoptions
Horizon 1
The Three Horizons
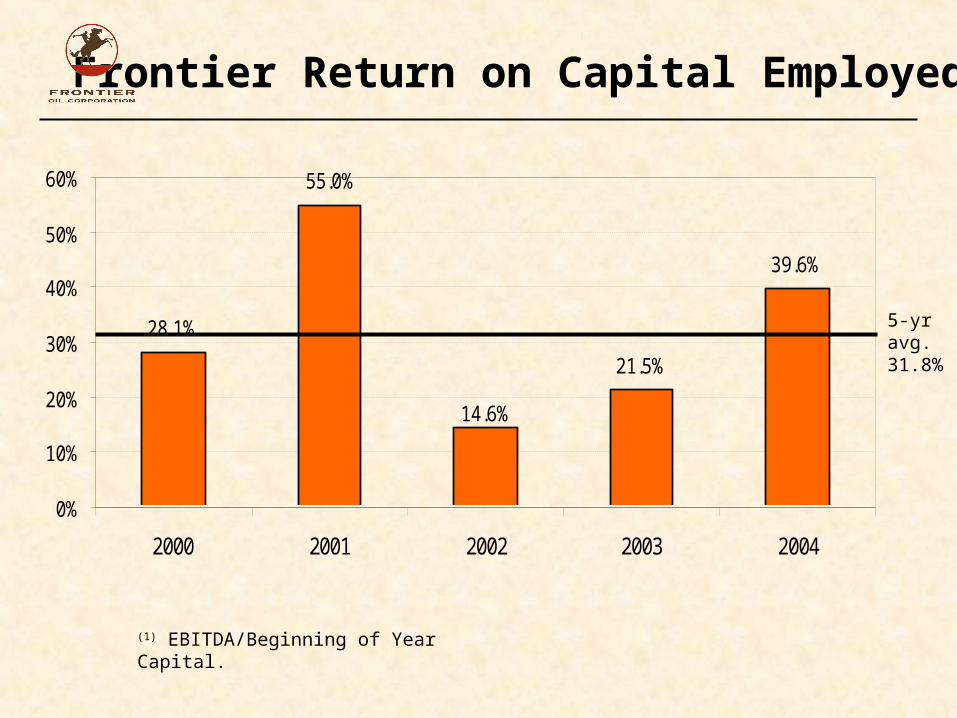
Frontier Return on Capital Employed(1)
(1) EBITDA/Beginning of Year Capital.
28.1%
39.6%
21.5%
14.6%
55.0%
0%
10%
20%
30%
40%
50%
60%
2000 2001 2002 2003 2004
5-yr avg. 31.8%
Strategy for the Future
Reduce/Refinance existing senior notesIncrease quarterly dividend • Repurchase Company stock / Pay special
dividends• Seek accretive high return acquisition• Explore Canadian crude supply
partnerships• Consider being acquired instead of being
an acquirer