fp solutions manual - cch solutions user guide.pdf · 3 introduction to fp solutions fp solutions...
TRANSCRIPT

FP Solutions Manual
1
Table of Contents
Introduction to FP Solutions 3 Working in FP Solutions............................................................................ 3 Navigating in the FP Solutions interface .................................................... 4 Using the Menubar ................................................................................... 4 Using the Toolbar...................................................................................... 5 Working in the Document View of Client Plans.......................................... 7 Working in the Variables and Spreadsheet Views of the Client Plans......... 7 Finding out More Information ................................................................... 8 Using the Sample Files.............................................................................. 8 Using the Manual and the On-line Help. ................................................... 9 The FP Solutions Workflow ..................................................................... 10
Managing Client Files 11 What is Stored in Client Information Files? ............................................. 11 Working with the Fact Finder.................................................................. 11 Creating new Client Files ........................................................................ 12 Opening Existing Client Files .................................................................. 13 Working with Scenarios .......................................................................... 13 Saving Client Files .................................................................................. 14 Creating a Custom Default File ............................................................... 15 Default Settings to Review....................................................................... 15 Importing Data from Other Programs ...................................................... 17
Working With Client Data 20 Using the FP Assistant ............................................................................ 20 Creating a new Financial Plan................................................................. 21 Using the Concept, Single Needs or Total Needs Plans for Pre-determined Planning ................................................................................................. 22 Using the Fact-Finding Interview............................................................. 23 Entering Business Information................................................................ 24 Reviewing and Editing Client Data .......................................................... 26 Updating a client data module ................................................................ 26 Adding a Module ..................................................................................... 26
Working with Financial Plans 28 Viewing a Financial Plan ......................................................................... 28 Using the Optimize Cash Flow tool.......................................................... 28 Using the Solve Tool................................................................................ 33 Applying a Common Planning Strategy.................................................... 34 Using a Planning Concept ....................................................................... 35 Setting up, Previewing and Printing Reports............................................ 36 Printing to an Excel spreadsheet ............................................................. 37 Reviewing Assumptions........................................................................... 37
Working with Simulations 39 Using Monte Carlo Simulations............................................................... 39 Using Historical Simulations................................................................... 39 Using Variance Simulations .................................................................... 39 Running Simulations .............................................................................. 40
2
Settings for Simulations.......................................................................... 42 Viewing the Simulation Results............................................................... 44 Sorting Results ....................................................................................... 44 Saving Results ........................................................................................ 45 Setting the chart range ........................................................................... 45
Working with Investments 46 Setting Return Assumptions for Investments .......................................... 46 Setting Management Expense Ratios....................................................... 47 Creating Investment Profiles ................................................................... 48
Developing Portfolios 50 Creating an Investment Database ........................................................... 50 Working with Investment Databases ....................................................... 51 Developing an Investment Portfolio ......................................................... 52 Selecting Investments in a Logical Sequence ........................................... 53 Editing Investments in the Portfolio ........................................................ 54 Using Disclaimers ................................................................................... 55 Creating Custom Investments ................................................................. 55 Working with Investment Variables......................................................... 56 Exporting Portfolios................................................................................. 56
3
Introduction to FP Solutions FP Solutions is designed to meet your financial planning needs and to simplify the gathering and analysis of your clients’ financial information. Developed to meet a wide range of financial planning needs, there are 4 levels of program access to choose from:
• FP Solutions Basic—the essential, everyday financial planning tool for single needs planning.
• FP Solutions Plus—the tool for total needs planning
• FP Solutions Advanced—a financial modeling tool cash flow-based with planning strategies and recommendations
• FP Solutions Business—a sophisticated tool that includes all aspects of business planning
Each successive level builds on the features of the previous level, and all levels were designed to meet your planning needs, from basic needs at point-of-sale, to fully integrated, comprehensive planning.
Working in FP Solutions FP Solutions has been designed to be easy to navigate through and to work in. Using FP Solutions you can develop financial plans ranging from the most basic to the very complex. All you have to do is open the related modules—Excel worksheets that use the FP Solutions interface—to expand the scope of the plan. FP Solutions has been designed to be simple to use, with many tools to help guide you through gathering information and creating a plan.

4
Navigating in the FP Solutions interface The FP Solutions user interface has been designed so that you can easily access tasks, enter information, and work with that information.
The Main Workspace You can access most of the FP Solutions tasks from the Main workspace.
The work space includes:
• Task buttons to open commonly used tasks
• A Menubar to access all FP Solutions functions
• A Toolbar to quickly access common tasks
Using the Task buttons The Task buttons make it easy to start several common activates in FP Solutions—just click the Task button for the activity.
Using the Menubar
The Menubar is located across the top of the Main workspace, and lists the features in FP Solutions. The Menubar is always available, so you can easily move to other activities within the program.
You can use the File menu to access common features like Save, Import, and Print.
The Data menu opens the detailed Data Entry dialog box for different modules in the client plan.
The Goto menu opens the different modules in the client plan and displays the documents in that module.
5
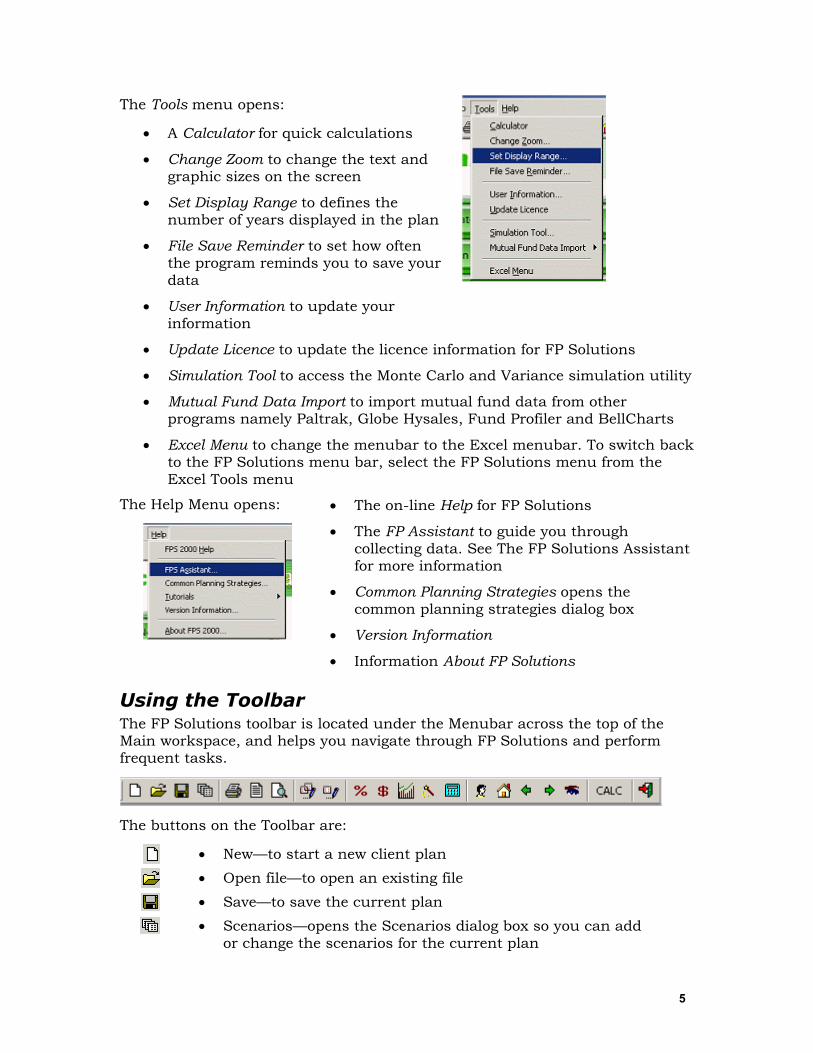
The Tools menu opens:
• A Calculator for quick calculations
• Change Zoom to change the text and graphic sizes on the screen
• Set Display Range to defines the number of years displayed in the plan
• File Save Reminder to set how often the program reminds you to save your data
• User Information to update your information
• Update Licence to update the licence information for FP Solutions
• Simulation Tool to access the Monte Carlo and Variance simulation utility
• Mutual Fund Data Import to import mutual fund data from other programs namely Paltrak, Globe Hysales, Fund Profiler and BellCharts
• Excel Menu to change the menubar to the Excel menubar. To switch back to the FP Solutions menu bar, select the FP Solutions menu from the Excel Tools menu
The Help Menu opens:
• The on-line Help for FP Solutions
• The FP Assistant to guide you through collecting data. See The FP Solutions Assistant for more information
• Common Planning Strategies opens the common planning strategies dialog box
• Version Information
• Information About FP Solutions
Using the Toolbar The FP Solutions toolbar is located under the Menubar across the top of the Main workspace, and helps you navigate through FP Solutions and perform frequent tasks.
The buttons on the Toolbar are:
• New—to start a new client plan
• Open file—to open an existing file
• Save—to save the current plan
• Scenarios—opens the Scenarios dialog box so you can add or change the scenarios for the current plan
6
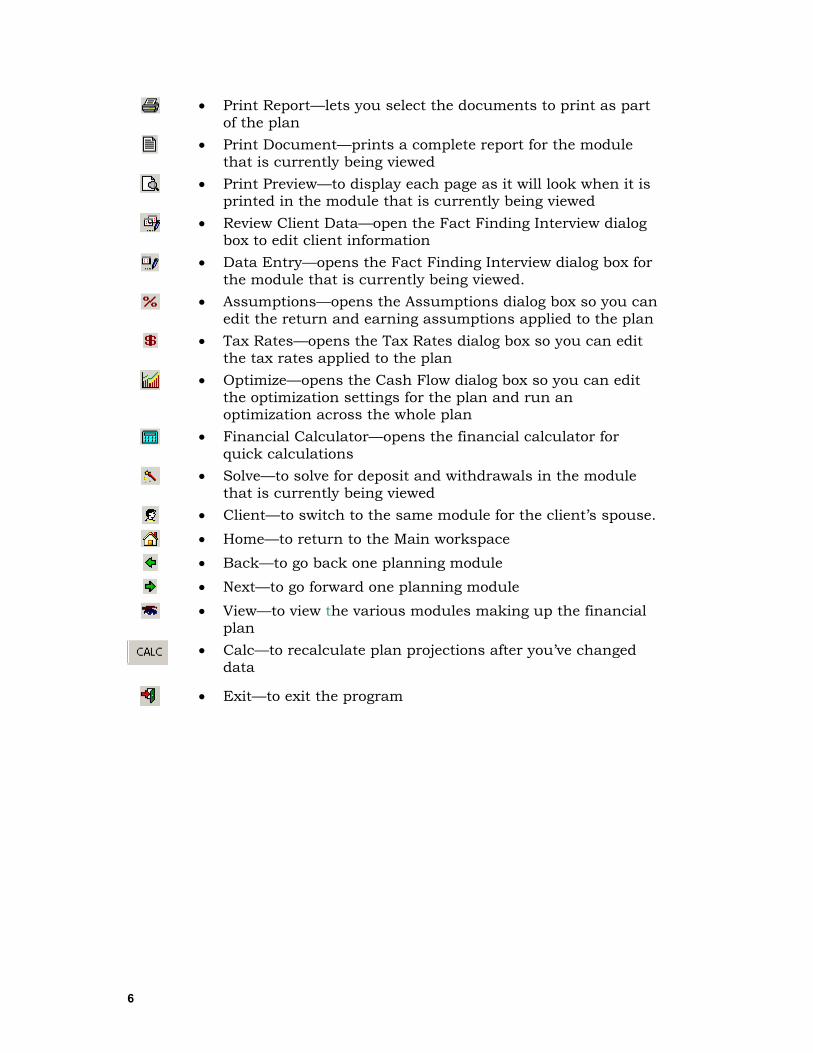
• Print Report—lets you select the documents to print as part of the plan
• Print Document—prints a complete report for the module that is currently being viewed
• Print Preview—to display each page as it will look when it is printed in the module that is currently being viewed
• Review Client Data—open the Fact Finding Interview dialog box to edit client information
• Data Entry—opens the Fact Finding Interview dialog box for the module that is currently being viewed.
• Assumptions—opens the Assumptions dialog box so you can edit the return and earning assumptions applied to the plan
• Tax Rates—opens the Tax Rates dialog box so you can edit the tax rates applied to the plan
• Optimize—opens the Cash Flow dialog box so you can edit the optimization settings for the plan and run an optimization across the whole plan
• Financial Calculator—opens the financial calculator for quick calculations
• Solve—to solve for deposit and withdrawals in the module that is currently being viewed
• Client—to switch to the same module for the client’s spouse.
• Home—to return to the Main workspace
• Back—to go back one planning module
• Next—to go forward one planning module
• View—to view the various modules making up the financial plan
• Calc—to recalculate plan projections after you’ve changed data
• Exit—to exit the program
7
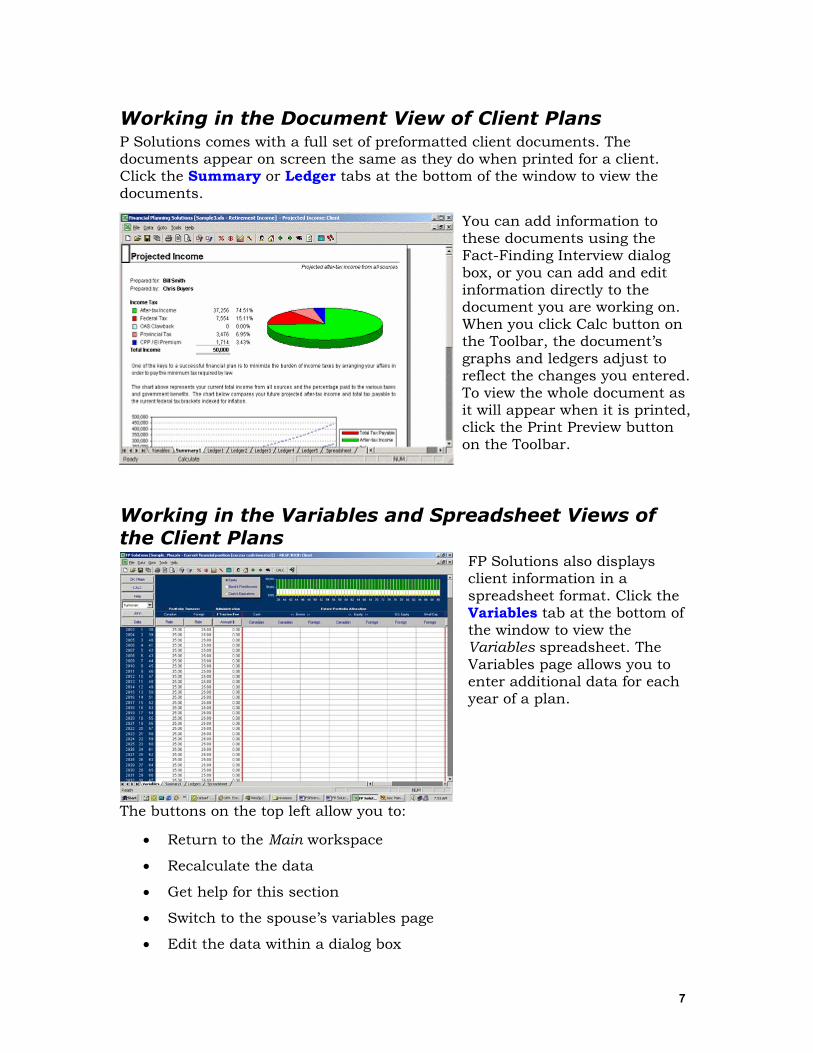
Working in the Document View of Client Plans P Solutions comes with a full set of preformatted client documents. The documents appear on screen the same as they do when printed for a client. Click the Summary or Ledger tabs at the bottom of the window to view the documents.
You can add information to these documents using the Fact-Finding Interview dialog box, or you can add and edit information directly to the document you are working on. When you click Calc button on the Toolbar, the document’s graphs and ledgers adjust to reflect the changes you entered. To view the whole document as it will appear when it is printed, click the Print Preview button on the Toolbar.
Working in the Variables and Spreadsheet Views of the Client Plans
FP Solutions also displays client information in a spreadsheet format. Click the Variables tab at the bottom of the window to view the Variables spreadsheet. The Variables page allows you to enter additional data for each year of a plan.
The buttons on the top left allow you to:
• Return to the Main workspace
• Recalculate the data
• Get help for this section
• Switch to the spouse’s variables page
• Edit the data within a dialog box
8
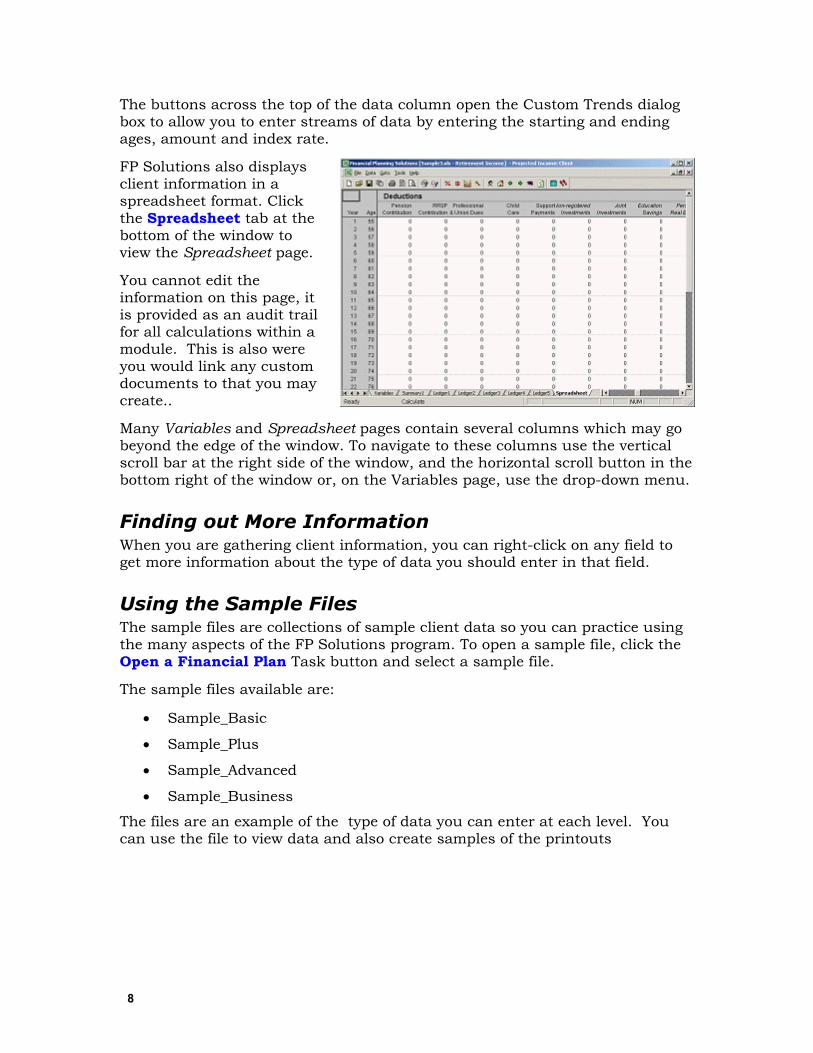
The buttons across the top of the data column open the Custom Trends dialog box to allow you to enter streams of data by entering the starting and ending ages, amount and index rate.
FP Solutions also displays client information in a spreadsheet format. Click the Spreadsheet tab at the bottom of the window to view the Spreadsheet page.
You cannot edit the information on this page, it is provided as an audit trail for all calculations within a module. This is also were you would link any custom documents to that you may create..
Many Variables and Spreadsheet pages contain several columns which may go beyond the edge of the window. To navigate to these columns use the vertical scroll bar at the right side of the window, and the horizontal scroll button in the bottom right of the window or, on the Variables page, use the drop-down menu.
Finding out More Information When you are gathering client information, you can right-click on any field to get more information about the type of data you should enter in that field.
Using the Sample Files The sample files are collections of sample client data so you can practice using the many aspects of the FP Solutions program. To open a sample file, click the Open a Financial Plan Task button and select a sample file.
The sample files available are:
• Sample_Basic
• Sample_Plus
• Sample_Advanced
• Sample_Business
The files are an example of the type of data you can enter at each level. You can use the file to view data and also create samples of the printouts
9
Using the Manual and the On-line Help. The manual and the on-line help have been designed to help you complete your work in FP Solutions, and organized generally in the order that you will use FP Solutions. The manual has a table of contents listing the topic headings and an index that lists words and phrases.
The on-line help has a table of contents and you can also use the index and the search feature to find specific information. To use the on-line help, from the Tools menu, click FP Solutions Help. Then you can click on:
• the Contents tab, and click on items in the table of contest to view more information about that topic.
• the Index tab to search for words or phrases
• the Search tab to search for words within the help
There are a few typographical conventions used in this on-line help guide:
• Bullet lists are used to provide information
1. Numbered lists are used for procedures
Items in bold blue indicate the name of an item or button to click in a procedure. Items in italics indicate the title of a window, pane, or field.
10
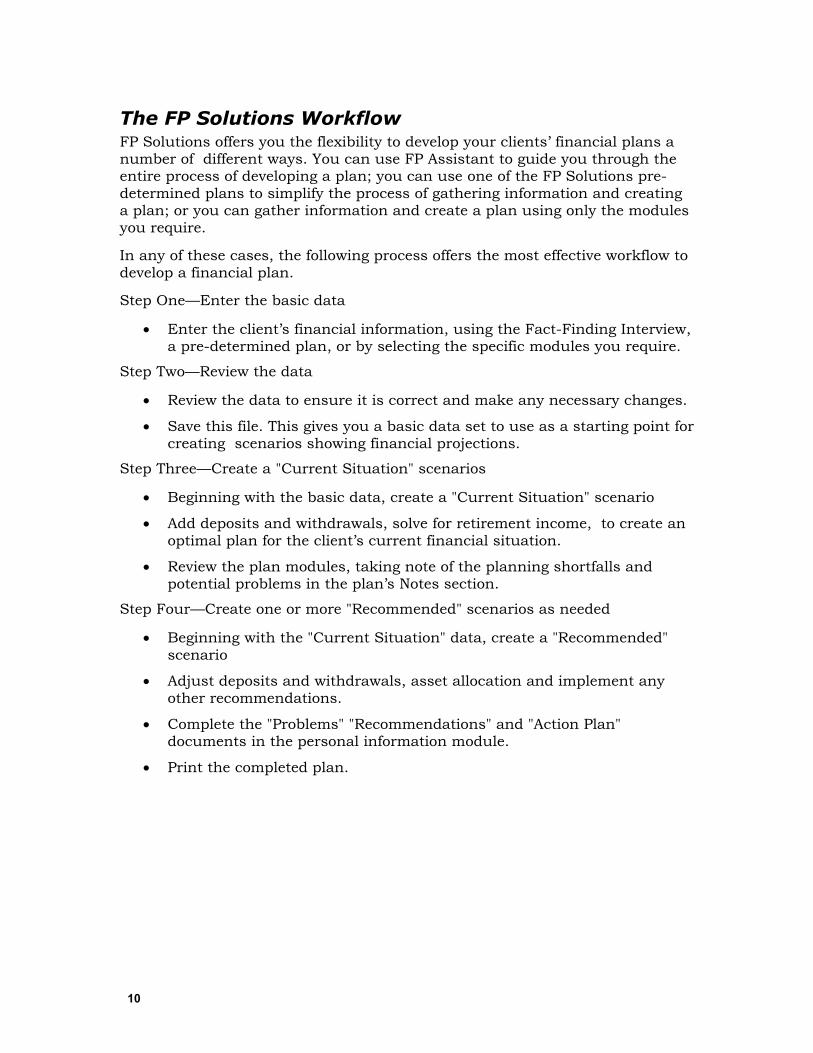
The FP Solutions Workflow FP Solutions offers you the flexibility to develop your clients’ financial plans a number of different ways. You can use FP Assistant to guide you through the entire process of developing a plan; you can use one of the FP Solutions pre-determined plans to simplify the process of gathering information and creating a plan; or you can gather information and create a plan using only the modules you require.
In any of these cases, the following process offers the most effective workflow to develop a financial plan.
Step One—Enter the basic data
• Enter the client’s financial information, using the Fact-Finding Interview, a pre-determined plan, or by selecting the specific modules you require.
Step Two—Review the data
• Review the data to ensure it is correct and make any necessary changes.
• Save this file. This gives you a basic data set to use as a starting point for creating scenarios showing financial projections.
Step Three—Create a "Current Situation" scenarios
• Beginning with the basic data, create a "Current Situation" scenario
• Add deposits and withdrawals, solve for retirement income, to create an optimal plan for the client’s current financial situation.
• Review the plan modules, taking note of the planning shortfalls and potential problems in the plan’s Notes section.
Step Four—Create one or more "Recommended" scenarios as needed
• Beginning with the "Current Situation" data, create a "Recommended" scenario
• Adjust deposits and withdrawals, asset allocation and implement any other recommendations.
• Complete the "Problems" "Recommendations" and "Action Plan" documents in the personal information module.
• Print the completed plan.
11
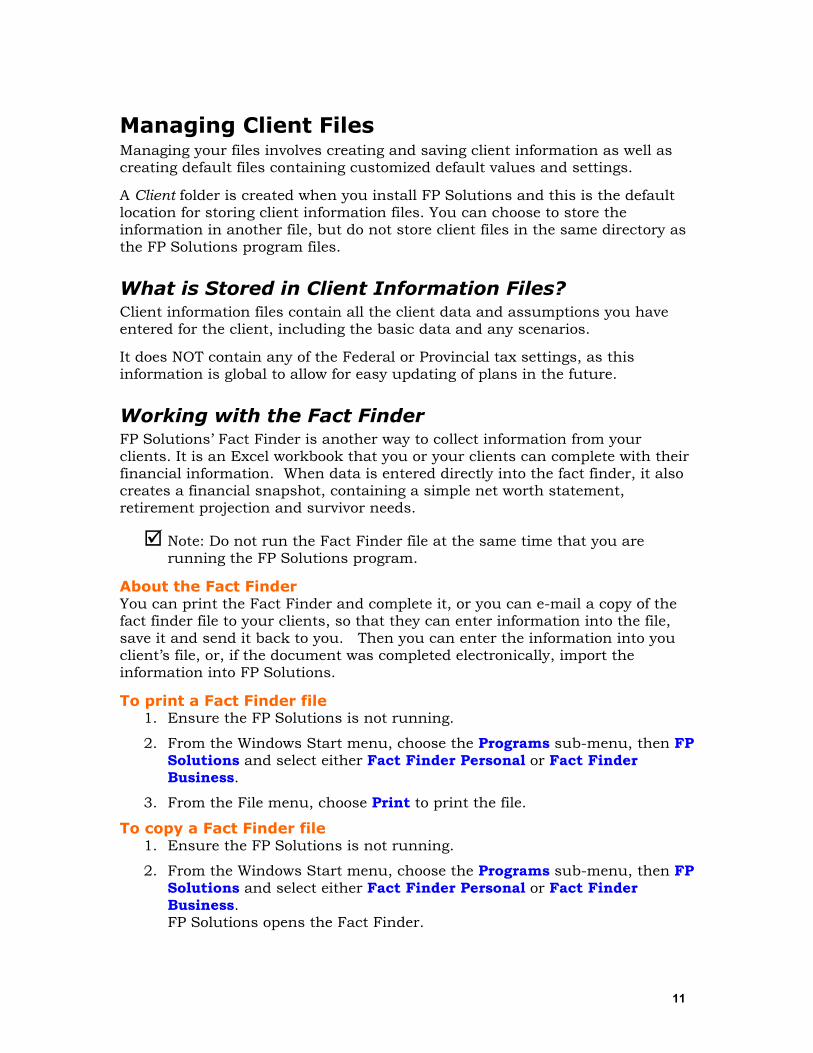
Managing Client Files Managing your files involves creating and saving client information as well as creating default files containing customized default values and settings.
A Client folder is created when you install FP Solutions and this is the default location for storing client information files. You can choose to store the information in another file, but do not store client files in the same directory as the FP Solutions program files.
What is Stored in Client Information Files? Client information files contain all the client data and assumptions you have entered for the client, including the basic data and any scenarios.
It does NOT contain any of the Federal or Provincial tax settings, as this information is global to allow for easy updating of plans in the future.
Working with the Fact Finder FP Solutions’ Fact Finder is another way to collect information from your clients. It is an Excel workbook that you or your clients can complete with their financial information. When data is entered directly into the fact finder, it also creates a financial snapshot, containing a simple net worth statement, retirement projection and survivor needs.
Note: Do not run the Fact Finder file at the same time that you are running the FP Solutions program.
About the Fact Finder You can print the Fact Finder and complete it, or you can e-mail a copy of the fact finder file to your clients, so that they can enter information into the file, save it and send it back to you. Then you can enter the information into you client’s file, or, if the document was completed electronically, import the information into FP Solutions.
To print a Fact Finder file 1. Ensure the FP Solutions is not running.
2. From the Windows Start menu, choose the Programs sub-menu, then FP Solutions and select either Fact Finder Personal or Fact Finder Business.
3. From the File menu, choose Print to print the file.
To copy a Fact Finder file 1. Ensure the FP Solutions is not running.
2. From the Windows Start menu, choose the Programs sub-menu, then FP Solutions and select either Fact Finder Personal or Fact Finder Business. FP Solutions opens the Fact Finder.
12
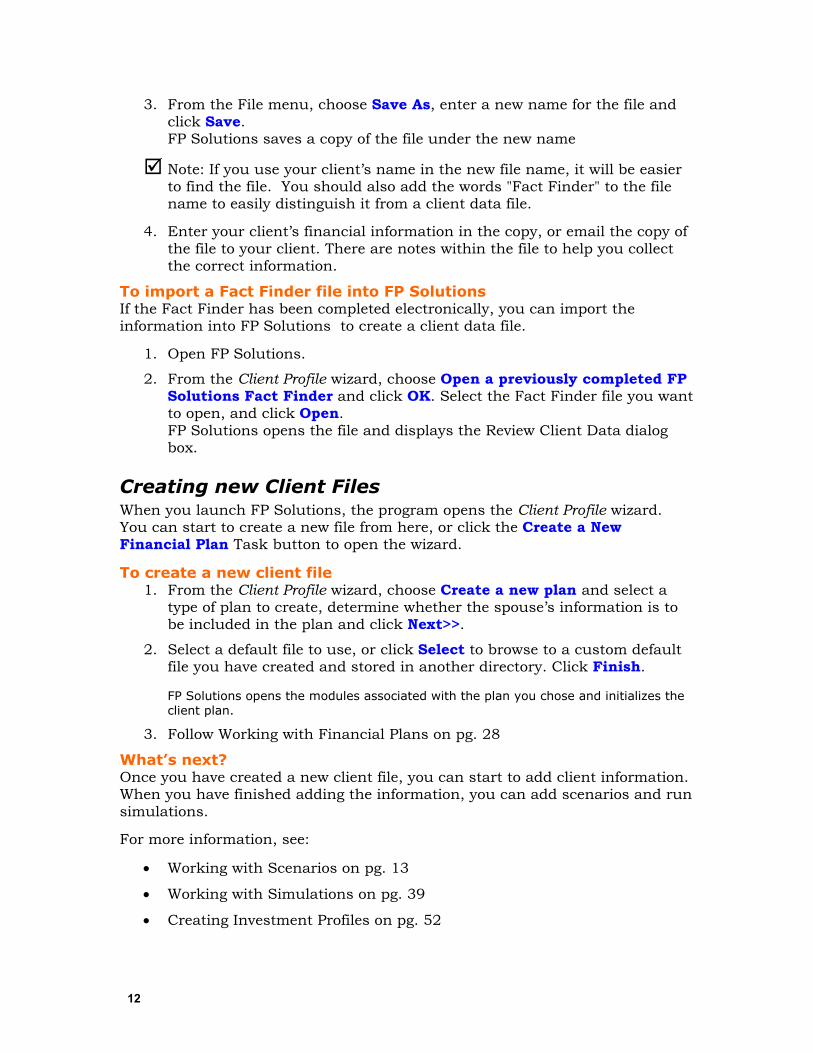
3. From the File menu, choose Save As, enter a new name for the file and click Save. FP Solutions saves a copy of the file under the new name
Note: If you use your client’s name in the new file name, it will be easier to find the file. You should also add the words "Fact Finder" to the file name to easily distinguish it from a client data file.
4. Enter your client’s financial information in the copy, or email the copy of the file to your client. There are notes within the file to help you collect the correct information.
To import a Fact Finder file into FP Solutions If the Fact Finder has been completed electronically, you can import the information into FP Solutions to create a client data file.
1. Open FP Solutions.
2. From the Client Profile wizard, choose Open a previously completed FP Solutions Fact Finder and click OK. Select the Fact Finder file you want to open, and click Open. FP Solutions opens the file and displays the Review Client Data dialog box.
Creating new Client Files When you launch FP Solutions, the program opens the Client Profile wizard. You can start to create a new file from here, or click the Create a New Financial Plan Task button to open the wizard.
To create a new client file 1. From the Client Profile wizard, choose Create a new plan and select a
type of plan to create, determine whether the spouse’s information is to be included in the plan and click Next>>.
2. Select a default file to use, or click Select to browse to a custom default file you have created and stored in another directory. Click Finish.
FP Solutions opens the modules associated with the plan you chose and initializes the client plan.
3. Follow Working with Financial Plans on pg. 28
What’s next? Once you have created a new client file, you can start to add client information. When you have finished adding the information, you can add scenarios and run simulations.
For more information, see:
• Working with Scenarios on pg. 13
• Working with Simulations on pg. 39
• Creating Investment Profiles on pg. 52
13
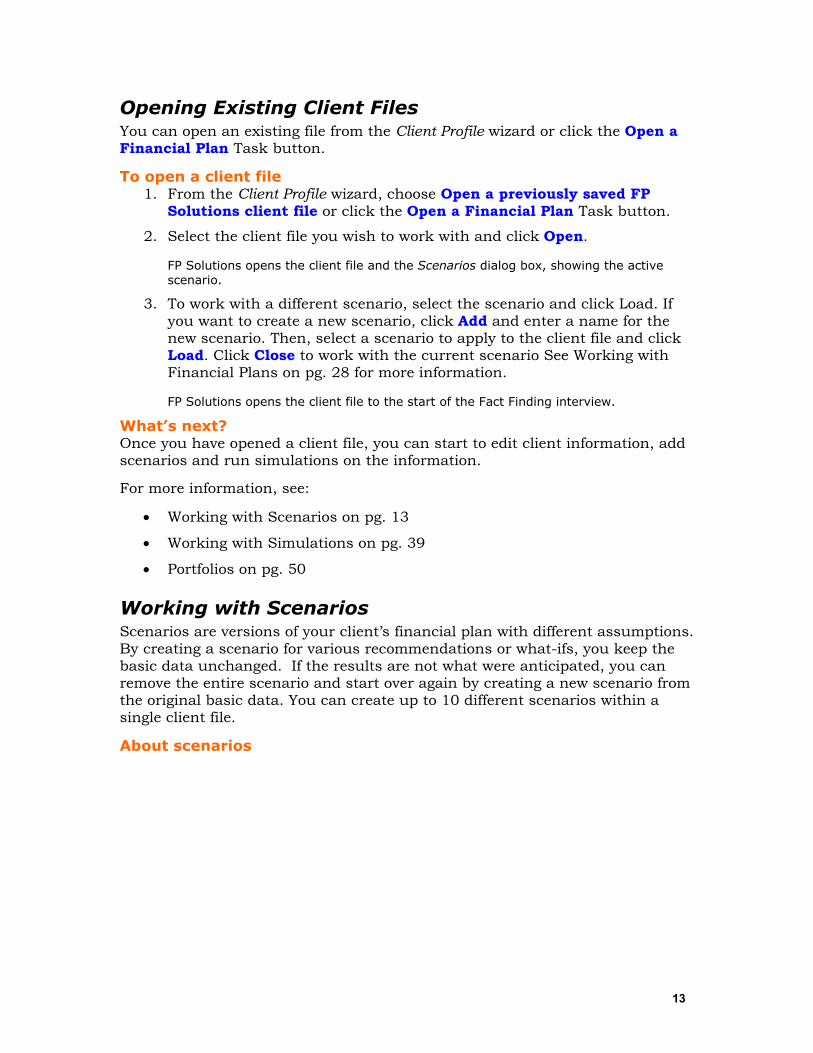
Opening Existing Client Files You can open an existing file from the Client Profile wizard or click the Open a Financial Plan Task button.
To open a client file 1. From the Client Profile wizard, choose Open a previously saved FP
Solutions client file or click the Open a Financial Plan Task button.
2. Select the client file you wish to work with and click Open.
FP Solutions opens the client file and the Scenarios dialog box, showing the active scenario.
3. To work with a different scenario, select the scenario and click Load. If you want to create a new scenario, click Add and enter a name for the new scenario. Then, select a scenario to apply to the client file and click Load. Click Close to work with the current scenario See Working with Financial Plans on pg. 28 for more information.
FP Solutions opens the client file to the start of the Fact Finding interview.
What’s next? Once you have opened a client file, you can start to edit client information, add scenarios and run simulations on the information.
For more information, see:
• Working with Scenarios on pg. 13
• Working with Simulations on pg. 39
• Portfolios on pg. 50
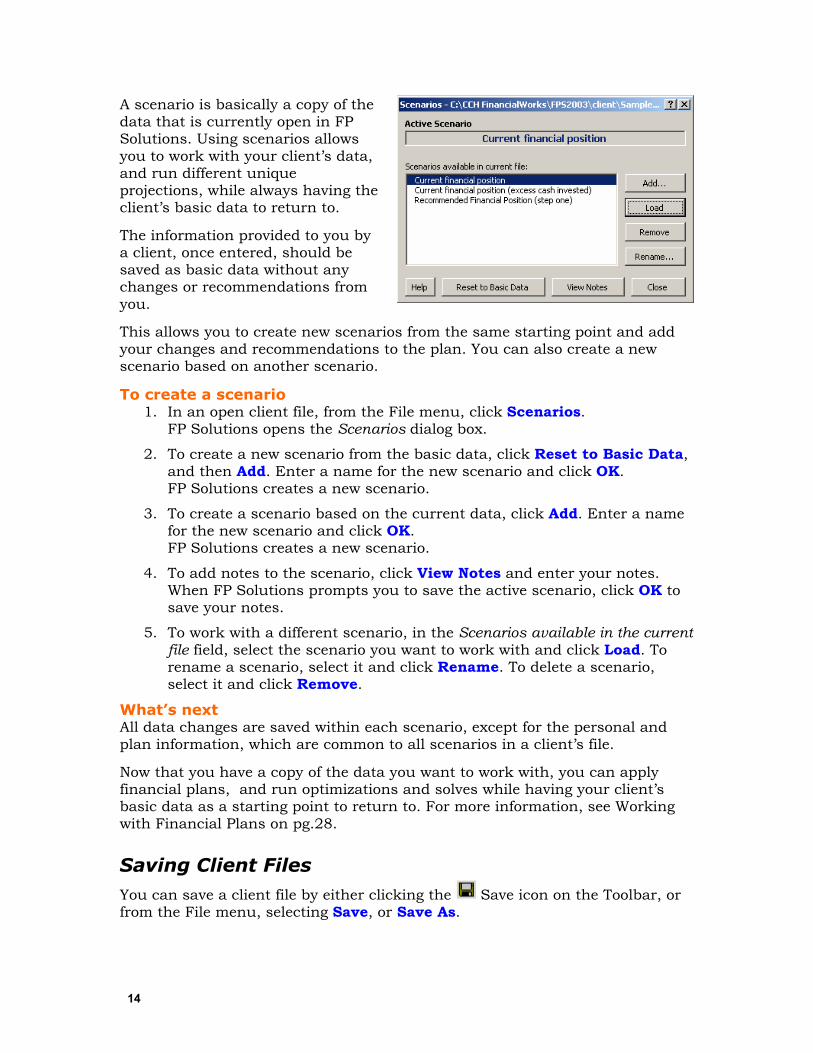
Working with Scenarios Scenarios are versions of your client’s financial plan with different assumptions. By creating a scenario for various recommendations or what-ifs, you keep the basic data unchanged. If the results are not what were anticipated, you can remove the entire scenario and start over again by creating a new scenario from the original basic data. You can create up to 10 different scenarios within a single client file.
About scenarios
14
A scenario is basically a copy of the data that is currently open in FP Solutions. Using scenarios allows you to work with your client’s data, and run different unique projections, while always having the client’s basic data to return to.
The information provided to you by a client, once entered, should be saved as basic data without any changes or recommendations from you.
This allows you to create new scenarios from the same starting point and add your changes and recommendations to the plan. You can also create a new scenario based on another scenario.
To create a scenario 1. In an open client file, from the File menu, click Scenarios.
FP Solutions opens the Scenarios dialog box.
2. To create a new scenario from the basic data, click Reset to Basic Data, and then Add. Enter a name for the new scenario and click OK. FP Solutions creates a new scenario.
3. To create a scenario based on the current data, click Add. Enter a name for the new scenario and click OK. FP Solutions creates a new scenario.
4. To add notes to the scenario, click View Notes and enter your notes. When FP Solutions prompts you to save the active scenario, click OK to save your notes.
5. To work with a different scenario, in the Scenarios available in the current file field, select the scenario you want to work with and click Load. To rename a scenario, select it and click Rename. To delete a scenario, select it and click Remove.
What’s next All data changes are saved within each scenario, except for the personal and plan information, which are common to all scenarios in a client’s file.
Now that you have a copy of the data you want to work with, you can apply financial plans, and run optimizations and solves while having your client’s basic data as a starting point to return to. For more information, see Working with Financial Plans on pg.28.
Saving Client Files You can save a client file by either clicking the Save icon on the Toolbar, or from the File menu, selecting Save, or Save As.
15
Selecting Save or the Save icon saves the file to a previously designated folder. Selecting Save As allows you to save the file to a different location or with a different name.
Creating a Custom Default File With FP Solutions you can create and save a custom default file with all the values modified to meet your specific needs, saving you from having to adjust these values every time you create a new plan.
You can create and save as many custom default files as you need. However, if the program’s defaults meet your needs, there is no need to create custom default files.
To create custom default file 1. From the Client Profile wizard, choose Create a new plan and select a
type of plan to create, determine whether the spouse’s information is to be included in the plan and click Next>>.
2. Choose FP Solutions Standard Default as the default plan to use, and click Finish.
3. FP Solutions opens the modules associated with the plan you chose and initializes the client plan.
4. Go through the Fact-Finding Interview, entering any values you would like to have available for every client plan. See Default Settings to Review for more information. To move between the sub-steps and tabs in the sub-step, click the Next> and <Back buttons at the bottom of the dialog box. To move between steps, click the Next>> and <<Back buttons.
Note: You should only enter general information that would apply to every client.
Note: You can also use the Data menu to go to specific areas of the default plan. Create a new plan, and click Finish at the first step. Then from the Data menu, select the areas of the plan you want to customize.
5. When you have finished entering default information, click Finish. FP Solutions saves the entered information and closes the dialog box.
6. From the File menu, choose Save User Defaults.
7. Enter a name for the default file and click OK. If you are creating more than one default file, name each file so it can be easily identified. FP Solutions saves the default file.
What’s Next Next, you should review the default settings for the file. The default file you just created will now be available when you are creating a new client file.
Default Settings to Review There are many default values throughout the client file. The following are some of the default values you may which to modify.
16
• Assumptions—you may wish to customize all of the default assumption settings,. To access the Assumptions dialog box, from the Data menu, choose Assumptions. You should check the assumption settings for:
• Return Index
• Management Expense Ratio—enter 0 in all MER fields to exclude MERs
• Earnings Allocations
• Realized Capital Gains
• Fund Return Details—the categories have been allocated as proposed by the Investment Funds Standards Committee
• Inflation
• Investment portfolio—there are five non-registered and five registered model portfolios, based on the results of the Risk Tolerance Questionnaire. You can enter the allocation for each portfolio.
• Non-registered Investments—click the Taxation tab to set:
• Annual portfolio turnover—enter the default assumption for the annual rate of portfolio turnover. This is the rate of turnover based on the buying and selling of investments, as opposed to the rate of realized gains, which should reflect distributions.
• Marginal tax rate
• RRSP—click the Taxation tab to set the rate of portfolio turnover for Canadian and foreign content
• Locked-In RRSPs—click the Taxation tab to set the rate of portfolio turnover for Canadian and foreign content
• Pensions—If you are working with a group of people who all have the same pension, you may wish to enter pension factors and joint survivor defaults for this pension.
• Projected Cash Flow—although the Optimized Cash Flow settings will be adjusted for each client, you can enter standard defaults for the initial optimization.
• Net Worth—you can include Deferred Taxes and Living Values and Estate Values on a Net Worth Statement
• Needs—the needs analysis calculations are based on three different investment strategies ranging from conservative to aggressive. On the Return Assumption tab, enter the default portfolios and labels for each of the strategies of the following user needs forms:
• Retirement Capital Needs
• Survivor Capital Needs—for each spouse
17
• Disability Income Needs
• You can also enter default Executor/Trustee fees in the Estate Needs user form
Note: The Return Assumption settings in each Needs form are independent of each other and must be set on each form.
• User-defined investment categories in the IFSC Fund Category—the IFSC Fund Category.xud uses all seven investment categories and has two user-definable categories--U.S. Equity and Small Cap (Equity Foreign). The corresponding fund categories are linked to these two user-definable fields. If you change the user–definable categories in this default file, you must also modify the Return Allocation settings—click Fund Return Detail on the Assumptions user form to change the settings. This file also has all deposits set to annual at the end of the year and withdrawals set at monthly, at the beginning of the period as this is often the case in a Current scenario. When using this default file timing adjustments are normally included in a Recommended scenario. Registered deposits can be reset to start of year, while the non-registered deposit timing may or may not be changed. The long-term impact of beginning of the period deposits versus end of period deposits is significant when selected period is annual, but there is very little impact when the selected period is monthly.
Importing Data from Other Programs You can easily import other client data files and insurance policies into the current client plan. You can also import data from:
• Probability Analyst
• Cantax
• Taxprep
• Workbench
• Portfolio Analysis
• Q-plan
• RetireWise
To import data When you import data, the majority of the data is converted, however because of differences between FP Solutions and the programs being imported from, tax rates and assumptions are not included in the import. Any deposits or withdrawals are also not usually included in the import.
You should check all imported files for required adjustments.

18
1. From the File menu, choose Import, and the type of file you are going to import.
2. Enter the name of the file you are importing, or browse to find the file.
3. Enter a new name for the imported file and click Import. Do not use the same name as the original file.
4. Open the new client file in FP Solutions, click the Optimize toolbar button.
5. On the Cash Flow dialog box, click Reset Optimization.
6. Check the new file to ensure the data was imported correctly and to add information that was not imported, and save the file
Areas to review The following are the areas of the client file you should check to ensure the imported data is correct:
• Asset Allocation—FP Solutions includes seven investment categories. Bonds and Equities are separated into Canadian and foreign and there are two user-definable categories. Future portfolio allocations entered in the other products do not transfer into FP Solutions. Portfolio realignments can be entered without restrictions
• Education and child care expenses—these are included in the RESP module.
• Bequests—You can enter tax-deductible and non-deductible bequests separately. Bequests that occur at second death are entered in the Estate Capital Needs module; bequests that occur at first death are entered in the Survivor Capital Needs module. Final Expenses and an amount for the Emergency Fund are entered separately for each spouse.
• Other income—enter other income amounts on the Income Variables page. The Defined Benefits calculations allow you to include two different index rates.
• Annuity calculations—Annuity calculations are based on life expectancy and an assumed interest rate. An annuity factor is not used.
• Leveraged investments—enter leveraged investments in the Debts Liabilities module.
• Portfolio turnover and realized capital gains—you can assign a different rate of realized gains for each of the seven investment categories.
What’s next?

19
Now that you have imported the file, checked it and made any necessary corrections, you can use the file like any other in FP Solutions. For more information, see:
• Working with Financial Plans on pg.28
• Working with Scenarios on pg.13
• Working with Simulations on pg.39
20
Working With Client Data The first step in developing any financial plan is to collect the financial data from your client. To help you with this process, FP Solutions has developed the Fact-Finding Interview to help you gather the necessary client data, and the FP Solutions Assistant to guide you through the entire process of collecting data and creating a financial plan from that data.
Using the FP Assistant The FP Assistant is an excellent way to familiarize yourself with the FP Solutions program and to make best use of the program.
About the FP Solutions Assistant The FP Assistant has been designed to help you make the best use of FP Solutions. The FP Solutions Assistant guides you through collecting information and creating a financial plan. It explains each step of the process, and opens the necessary modules to complete the type of plan you are creating.
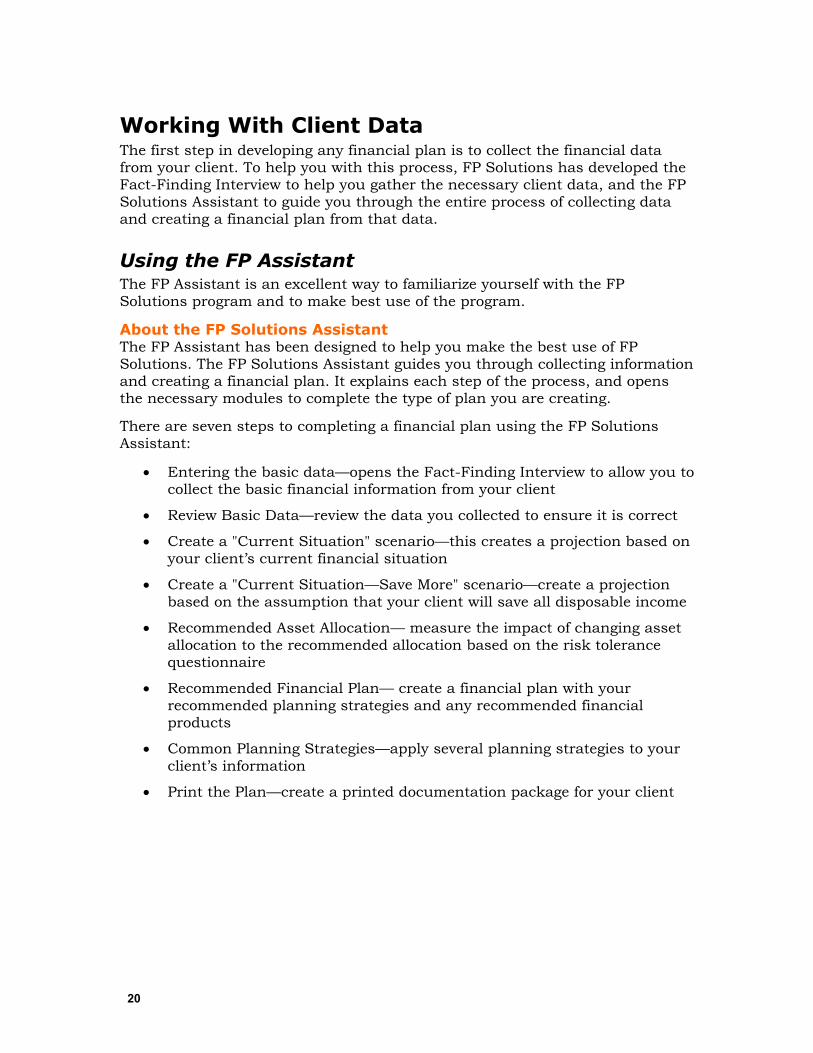
There are seven steps to completing a financial plan using the FP Solutions Assistant:
• Entering the basic data—opens the Fact-Finding Interview to allow you to collect the basic financial information from your client
• Review Basic Data—review the data you collected to ensure it is correct
• Create a "Current Situation" scenario—this creates a projection based on your client’s current financial situation
• Create a "Current Situation—Save More" scenario—create a projection based on the assumption that your client will save all disposable income
• Recommended Asset Allocation— measure the impact of changing asset allocation to the recommended allocation based on the risk tolerance questionnaire
• Recommended Financial Plan— create a financial plan with your recommended planning strategies and any recommended financial products
• Common Planning Strategies—apply several planning strategies to your client’s information
• Print the Plan—create a printed documentation package for your client
21
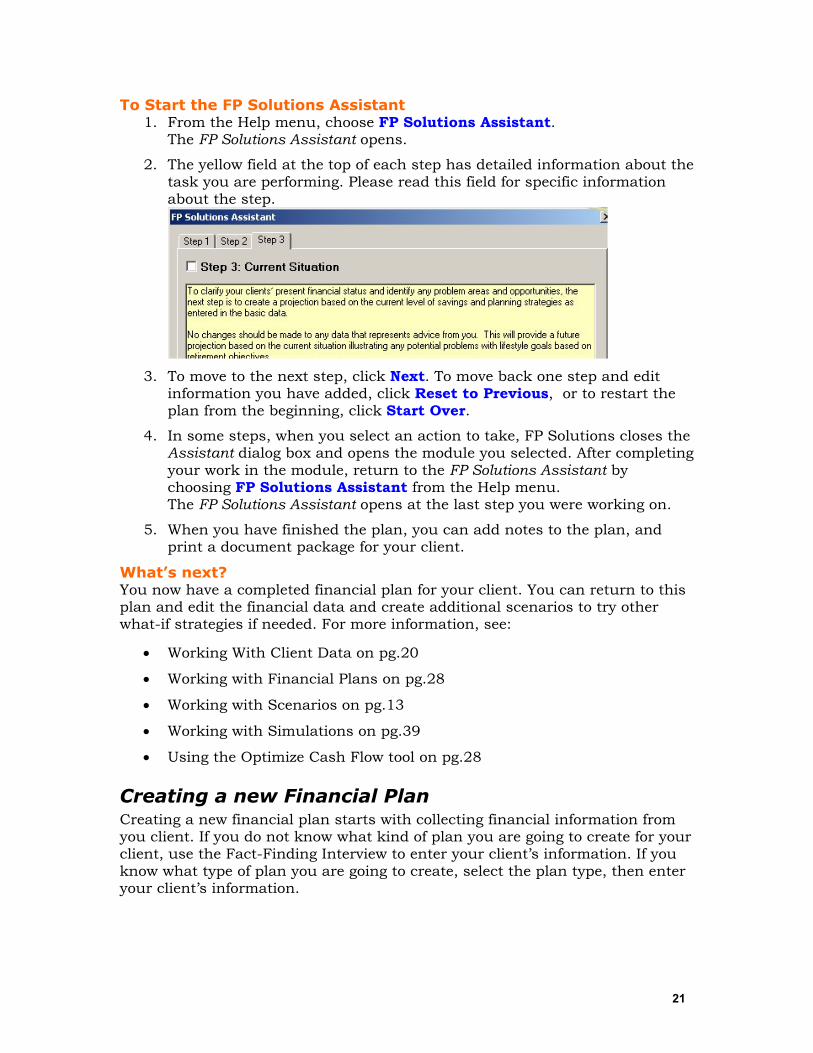
To Start the FP Solutions Assistant 1. From the Help menu, choose FP Solutions Assistant.
The FP Solutions Assistant opens.
2. The yellow field at the top of each step has detailed information about the task you are performing. Please read this field for specific information about the step.
3. To move to the next step, click Next. To move back one step and edit
information you have added, click Reset to Previous, or to restart the plan from the beginning, click Start Over.
4. In some steps, when you select an action to take, FP Solutions closes the Assistant dialog box and opens the module you selected. After completing your work in the module, return to the FP Solutions Assistant by choosing FP Solutions Assistant from the Help menu. The FP Solutions Assistant opens at the last step you were working on.
5. When you have finished the plan, you can add notes to the plan, and print a document package for your client.
What’s next? You now have a completed financial plan for your client. You can return to this plan and edit the financial data and create additional scenarios to try other what-if strategies if needed. For more information, see:
• Working With Client Data on pg.20
• Working with Financial Plans on pg.28
• Working with Scenarios on pg.13
• Working with Simulations on pg.39
• Using the Optimize Cash Flow tool on pg.28
Creating a new Financial Plan Creating a new financial plan starts with collecting financial information from you client. If you do not know what kind of plan you are going to create for your client, use the Fact-Finding Interview to enter your client’s information. If you know what type of plan you are going to create, select the plan type, then enter your client’s information.
22
Using the Concept, Single Needs or Total Needs Plans for Pre-determined Planning FP Solutions includes pre-determined plans that are designed to only open the modules that are necessary to complete that plan. If you know what kind of plan you will be developing you can use one of the pre- determined plans to simplify the information-gathering.
About the pre-determined plans The types of pre-determined plans available are
• Concept—this lets you create a sales concept such as Investment Leverage and Tax Funding Alternatives. New concepts are made available periodically—check the CCH web site regularly.
• Single Needs—this opens all the modules required to complete a plan for one specific need such as an RRSP illustration or education savings
• Total needs—this opens all the modules required to complete a plan that covers multiple needs such as retirement income planning or survivor life insurance needs
To gather information with a pre-determined plan 1. Click the Create a new Financial Plan task button.
FP Solutions opens the new plan dialog box.
2. Select the pre-defined plan you wish to use and click Next >>.
3. Select a default file to use, either:
• FP Solutions standard default
• IFCS Fund Category
4. Click Finish. FP Solutions opens the pre-determined plan modules and the Fact-Finding dialog box.
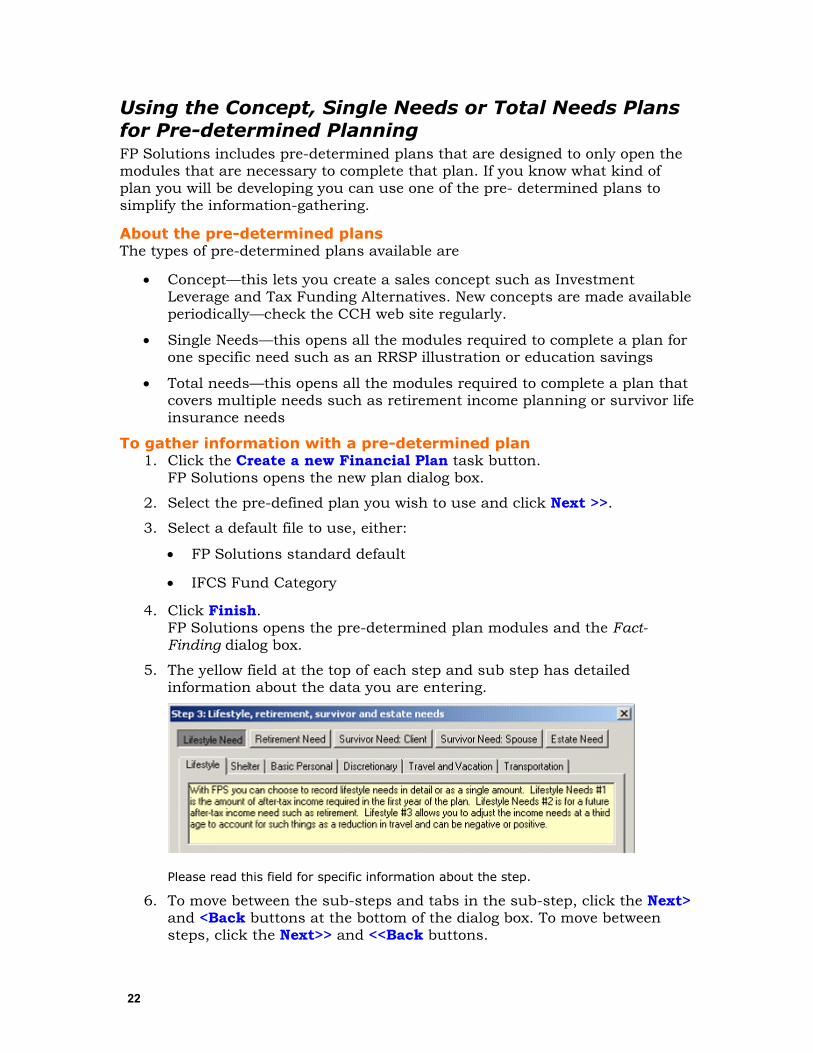
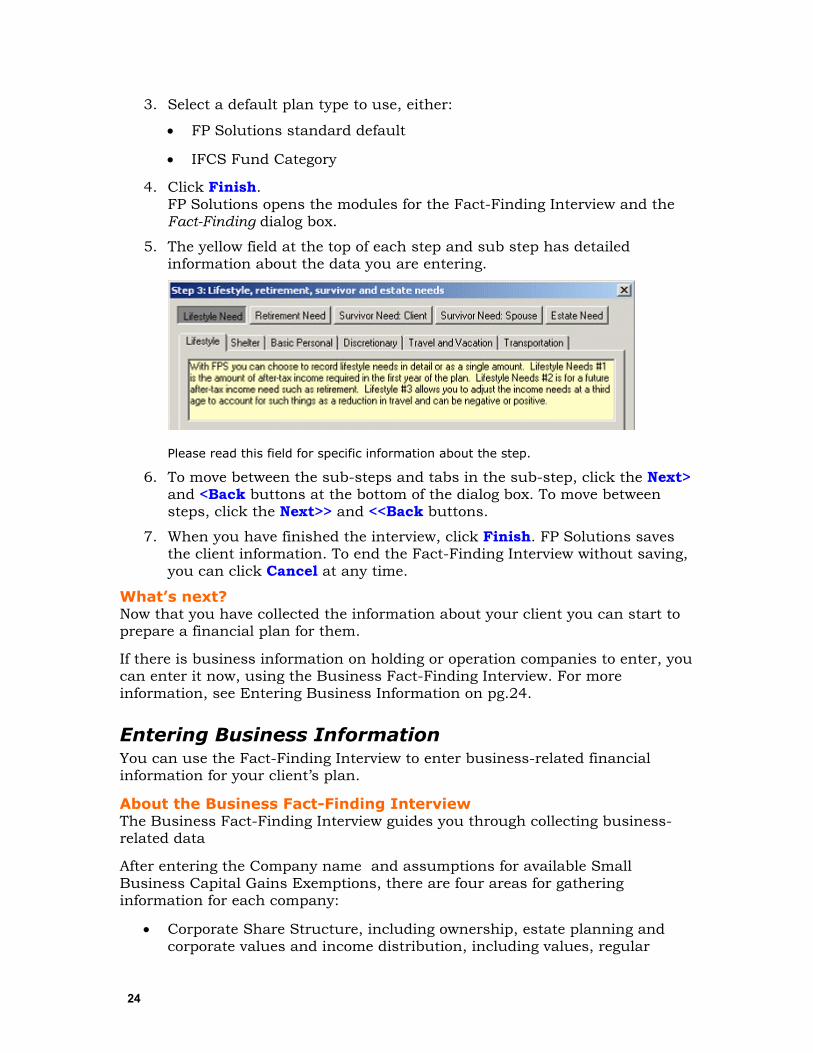
5. The yellow field at the top of each step and sub step has detailed information about the data you are entering.
Please read this field for specific information about the step.
6. To move between the sub-steps and tabs in the sub-step, click the Next> and <Back buttons at the bottom of the dialog box. To move between steps, click the Next>> and <<Back buttons.
23
7. When you have finished the interview, click Finish. FP Solutions saves the client information. To end the Fact-Finding Interview without saving, you can click Cancel at any time.
What’s next? Now that you have collected the information about your client you can start to prepare a financial plan for them.
If there is business information for holding and operating companies, you can enter it now, using the Business Fact-Finding Interview. For more information, see Entering Business Information on pg.24.
Using the Fact-Finding Interview The Fact-Finding Interview is a structured way to gather information from your client that you will need to develop a financial plan. It is useful if you do not know what type of plan you will be developing for your client, as it collects the widest range of information.
About the Fact-Finding Interview The Fact-Finding Interview leads you through gathering the initial data for a new financial plan. There are 11 main steps in the Fact Finding interview to collect information for:
• Personal information about the client, including the goals and objectives for the plan
• Risk Tolerance and areas of concern
• Lifestyle, retirement, survivor and estate needs
• Sources of income
• Non-registered investment and savings
• RRSPs and RRIFs
• Defined benefit pension plans
• Real estate
• Personal use assets and liabilities
• Life and disability insurance
There are also sub-steps within each step to gather detailed information relating to that step. You only need to complete the relevant steps in the interview, and you can return to the Fact-Finding interview to add or edit the information.
To gather information in the fact-finding interview: 1. Click the Create a new Financial Plan task button.
FP Solutions opens the new plan dialog box. Create a new plan and Initial Fact-Finding Interview should be selected. If they are not, click to select them.
2. Click Next >>.
24
3. Select a default plan type to use, either:
• FP Solutions standard default
• IFCS Fund Category
4. Click Finish. FP Solutions opens the modules for the Fact-Finding Interview and the Fact-Finding dialog box.
5. The yellow field at the top of each step and sub step has detailed information about the data you are entering.
Please read this field for specific information about the step.
6. To move between the sub-steps and tabs in the sub-step, click the Next> and <Back buttons at the bottom of the dialog box. To move between steps, click the Next>> and <<Back buttons.
7. When you have finished the interview, click Finish. FP Solutions saves the client information. To end the Fact-Finding Interview without saving, you can click Cancel at any time.
What’s next? Now that you have collected the information about your client you can start to prepare a financial plan for them.
If there is business information on holding or operation companies to enter, you can enter it now, using the Business Fact-Finding Interview. For more information, see Entering Business Information on pg.24.
Entering Business Information You can use the Fact-Finding Interview to enter business-related financial information for your client’s plan.
About the Business Fact-Finding Interview The Business Fact-Finding Interview guides you through collecting business-related data
After entering the Company name and assumptions for available Small Business Capital Gains Exemptions, there are four areas for gathering information for each company:
• Corporate Share Structure, including ownership, estate planning and corporate values and income distribution, including values, regular
25
dividends, investment dividends, investment distributions, shareholder bonuses
• Corporate investments including assets values and deposits and withdrawals and corporate real estate information for up to five properties
• Corporate debt information for up to five debts, and corporate loan information for up to five loans
• Corporate life insurance for your client and spouse, joint first , joint last insurance and other non-related shareholders
To collect business information using the Fact-Finding Interview: 1. Start the Business Fact-Finding Interview by either:
• If you have just completed the Fact-Finding interview for personal information—FP Solutions asks if the current plan requires data entry for business. Click Yes.
• If you have previously completed the Fact-Finding interview for personal information—clicking the Review Client Data task button, choosing the Business Data tab, and clicking Begin Data Entry
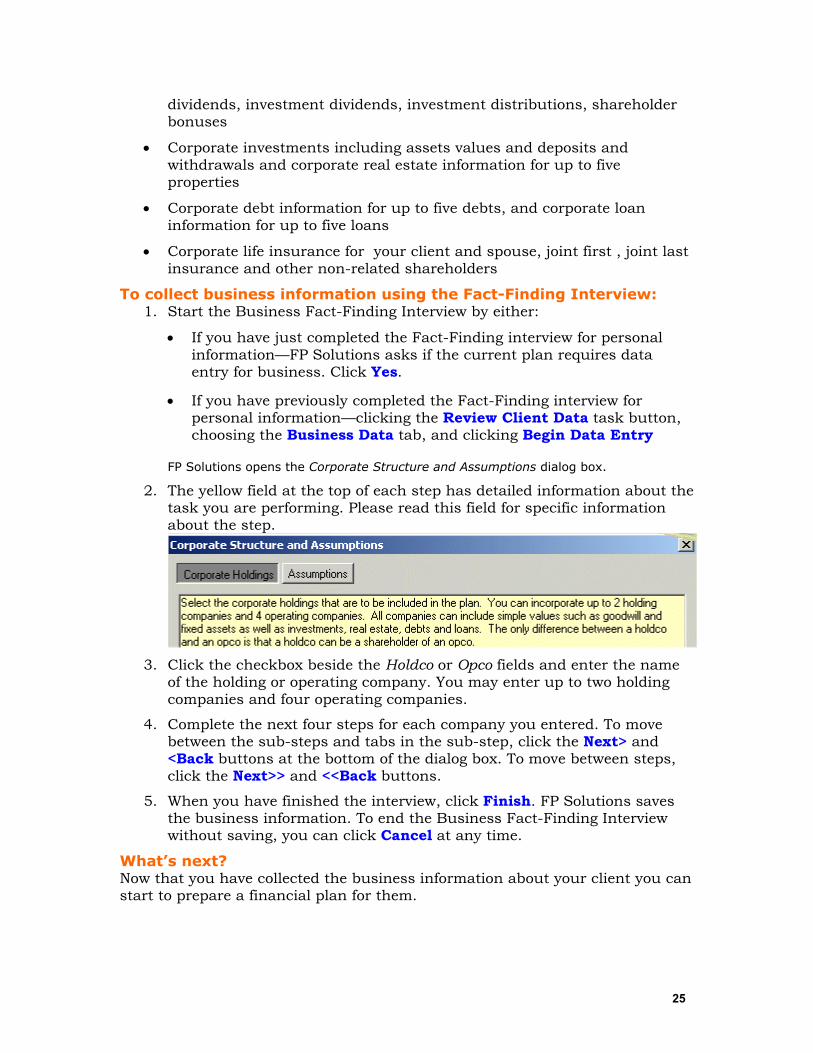
FP Solutions opens the Corporate Structure and Assumptions dialog box.
2. The yellow field at the top of each step has detailed information about the task you are performing. Please read this field for specific information about the step.
3. Click the checkbox beside the Holdco or Opco fields and enter the name
of the holding or operating company. You may enter up to two holding companies and four operating companies.
4. Complete the next four steps for each company you entered. To move between the sub-steps and tabs in the sub-step, click the Next> and <Back buttons at the bottom of the dialog box. To move between steps, click the Next>> and <<Back buttons.
5. When you have finished the interview, click Finish. FP Solutions saves the business information. To end the Business Fact-Finding Interview without saving, you can click Cancel at any time.
What’s next? Now that you have collected the business information about your client you can start to prepare a financial plan for them.
26
Reviewing and Editing Client Data Once you have entered the client data you should review the data to ensure it is correct. Also, after entering client data you may need to update data that was missed, or to add data or add modules to a client plan.
To review and edit existing client data 1. Ensure the client plan that you wish to review is open.
2. Click the Review Client Data task button. FP Solutions opens the Review Client Data dialog box.
3. Select either
• To review all data for this client—Review Existing Client Data
• To review a specific step—click Manually select the data entry step to complete and select the step to review
4. Click Begin data entry. FP Solutions opens the client data to either the beginning of the Fact-Finding Interview or the selected step.
5. If you are:
• reviewing the entire plan—review and enter corrected data for the plan, and click Finish. FP Solutions updates the information and returns to the Main workspace.
• reviewing individual steps—review and enter corrected data in the step, and click Finish. FP Solutions updates the information for that step and returns to the Review Client Data dialog box where you can select another step to review
Updating a client data module If you know which modules you want to review, you can go directly to that information.
To update a module 1. From the Data menu, select the module you want to update.
FP Solutions opens the dialog box for that module.
Adding a Module You can add modules and the related information, if you wish to expand the original financial plan.
To add a module 1. From the Data menu, select the module you wish to add. FP Solutions
confirms that you would like to add the module.

27
2. Click Yes. FP Solutions adds the module to the plan and opens the module dialog box.
3. Follow the directions in the dialog box to enter the client data for the module.
28
Working with Financial Plans Now that you have collected your client’s financial information, you can start to create a financial plan for them.
Viewing a Financial Plan Once you have entered the client information and reviewed it to ensure it is correct, you can now view the documents for the financial plan you have started.
About the financial plan With the client’s financial information in place, you can now start to create scenarios, run projections and develop a financial plan for your clients. Viewing the financial plan lets you work directly in the documents you are creating for you clients
To view a financial plan 1. Ensure that the client’s financial plan is open.
2. Click the View Financial Plan task button. FP Solutions opens the Please select a module dialog box.
3. Select the section and module you would like to view, and click Go. FP Solutions opens the documents for this module.
If this module is not currently part of the plan, FP Solutions asks if you would like to add it to the plan. Click Yes to add the module and begin working with it, or No to return to the Please select a module dialog box.
4. You can open the Fact-Finding Interview dialog box for a module by selecting the module and clicking Data Entry. To close the Please select a module dialog box without opening a module, click Done.
What’s next? You can now start to apply planning strategies, optimizations, and solves to your client’s financial plan.
Using the Optimize Cash Flow tool The Optimize Cash Flow tool manages a projected cash flow according to the sets of rules you define.
About Optimizing Cash Flow The object of optimizing cash flow is to manage the amounts projected to be available in excess of your client’s needs and to solve projected deficiencies using accumulated assets. The result matches the cash flow to the lifestyle need to show how long the assets are likely to last. These results help you asses the likelihood of success for the plan, as well as determine the appropriate course of action required to make the plan successful.
29
Optimizing cash flow is based on two series of logic setting that you adjust according to your client’s particular position.
The first series allows you to set parameters for the management of amounts projected to be available in excess of your client’s lifestyle needs. This includes allocating amounts to be contributed to RRSPs, invested in non-registered accounts, or applied to outstanding debts. Excess cash flow can also be allocated to consumption beyond lifestyle needs.
The second series allows you to set parameters for projected deficiencies. This includes sourcing income from RRSPs and non-registered accounts. Deficiencies can also be managed by borrowing the necessary funds, and you can show your clients the less-desirable option of reducing expectations for income in retirement.
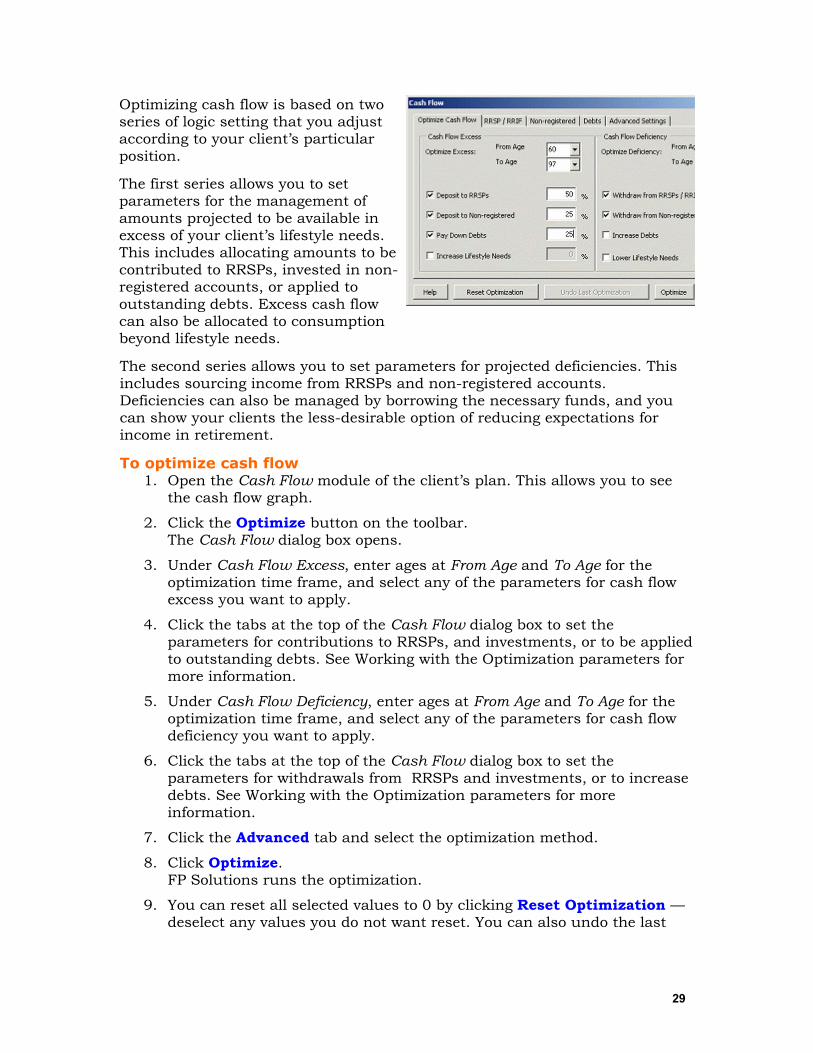
To optimize cash flow 1. Open the Cash Flow module of the client’s plan. This allows you to see
the cash flow graph.
2. Click the Optimize button on the toolbar. The Cash Flow dialog box opens.
3. Under Cash Flow Excess, enter ages at From Age and To Age for the optimization time frame, and select any of the parameters for cash flow excess you want to apply.
4. Click the tabs at the top of the Cash Flow dialog box to set the parameters for contributions to RRSPs, and investments, or to be applied to outstanding debts. See Working with the Optimization parameters for more information.
5. Under Cash Flow Deficiency, enter ages at From Age and To Age for the optimization time frame, and select any of the parameters for cash flow deficiency you want to apply.
6. Click the tabs at the top of the Cash Flow dialog box to set the parameters for withdrawals from RRSPs and investments, or to increase debts. See Working with the Optimization parameters for more information.
7. Click the Advanced tab and select the optimization method.
8. Click Optimize. FP Solutions runs the optimization.
9. You can reset all selected values to 0 by clicking Reset Optimization —deselect any values you do not want reset. You can also undo the last
30
optimization and reset the values to what they were prior to the last optimization, by clicking Undo Last Optimization.
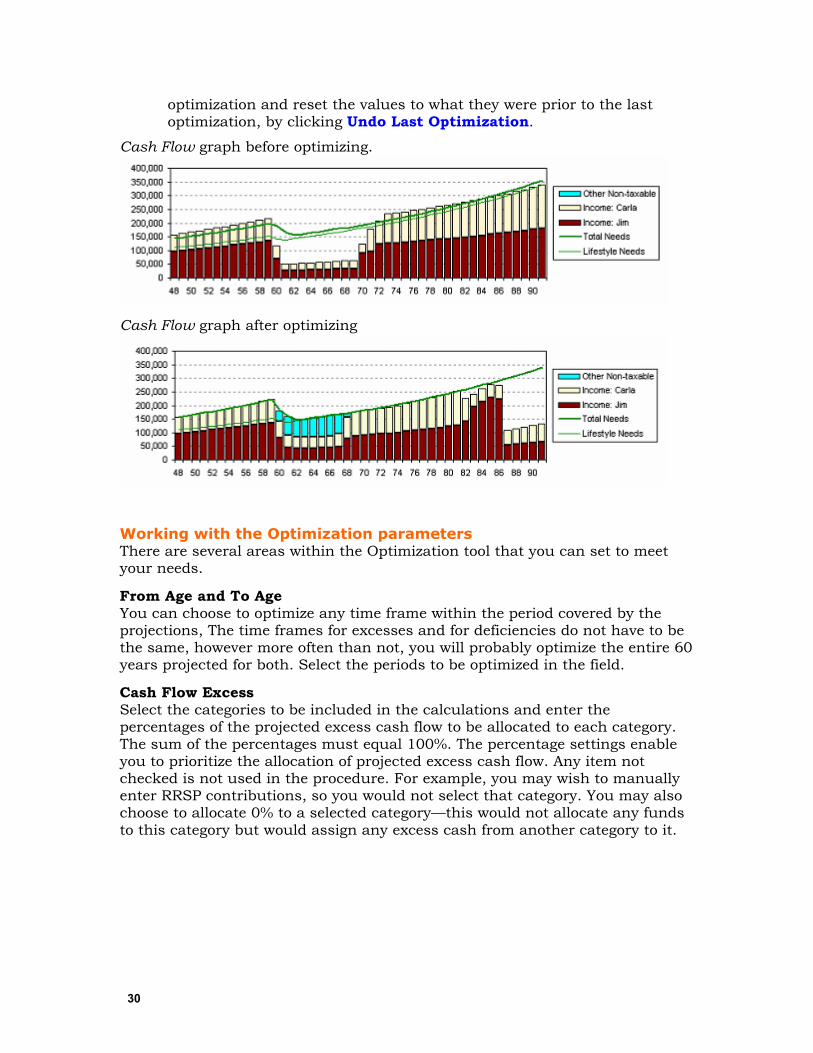
Cash Flow graph before optimizing.
Cash Flow graph after optimizing
Working with the Optimization parameters There are several areas within the Optimization tool that you can set to meet your needs.
From Age and To Age You can choose to optimize any time frame within the period covered by the projections, The time frames for excesses and for deficiencies do not have to be the same, however more often than not, you will probably optimize the entire 60 years projected for both. Select the periods to be optimized in the field.
Cash Flow Excess Select the categories to be included in the calculations and enter the percentages of the projected excess cash flow to be allocated to each category. The sum of the percentages must equal 100%. The percentage settings enable you to prioritize the allocation of projected excess cash flow. Any item not checked is not used in the procedure. For example, you may wish to manually enter RRSP contributions, so you would not select that category. You may also choose to allocate 0% to a selected category—this would not allocate any funds to this category but would assign any excess cash from another category to it.
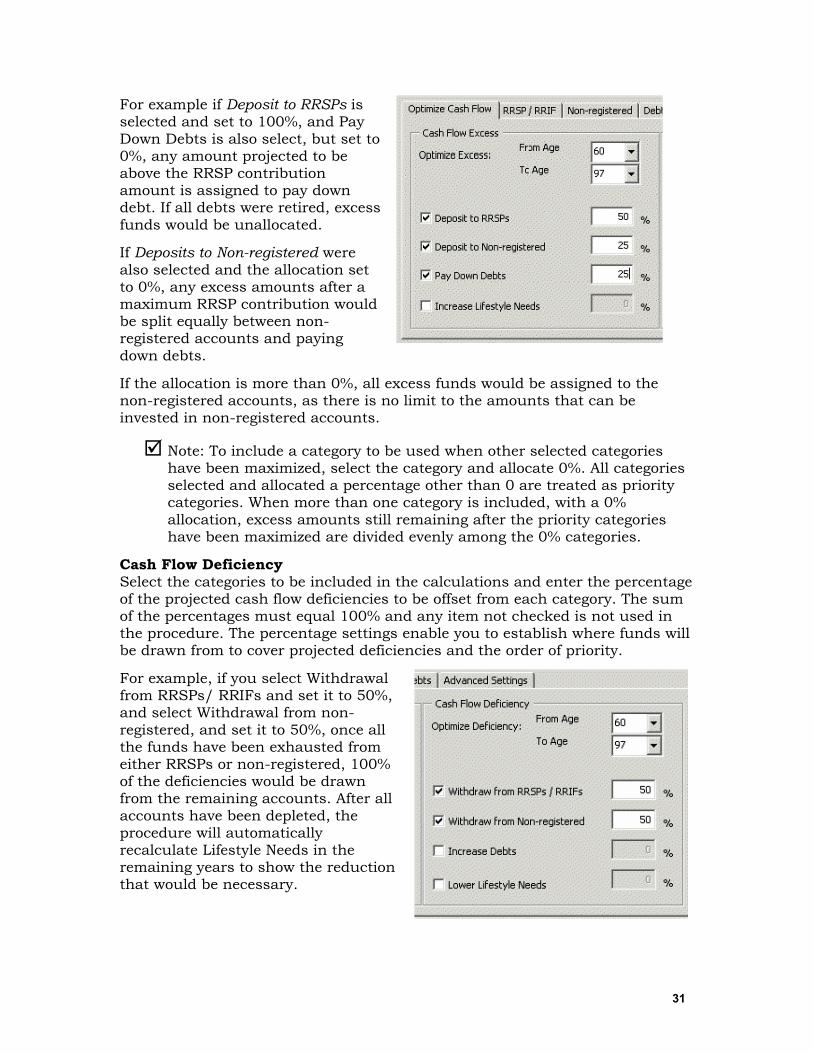
31
For example if Deposit to RRSPs is selected and set to 100%, and Pay Down Debts is also select, but set to 0%, any amount projected to be above the RRSP contribution amount is assigned to pay down debt. If all debts were retired, excess funds would be unallocated.
If Deposits to Non-registered were also selected and the allocation set to 0%, any excess amounts after a maximum RRSP contribution would be split equally between non-registered accounts and paying down debts.
If the allocation is more than 0%, all excess funds would be assigned to the non-registered accounts, as there is no limit to the amounts that can be invested in non-registered accounts.
Note: To include a category to be used when other selected categories have been maximized, select the category and allocate 0%. All categories selected and allocated a percentage other than 0 are treated as priority categories. When more than one category is included, with a 0% allocation, excess amounts still remaining after the priority categories have been maximized are divided evenly among the 0% categories.
Cash Flow Deficiency Select the categories to be included in the calculations and enter the percentage of the projected cash flow deficiencies to be offset from each category. The sum of the percentages must equal 100% and any item not checked is not used in the procedure. The percentage settings enable you to establish where funds will be drawn from to cover projected deficiencies and the order of priority.
For example, if you select Withdrawal from RRSPs/ RRIFs and set it to 50%, and select Withdrawal from non-registered, and set it to 50%, once all the funds have been exhausted from either RRSPs or non-registered, 100% of the deficiencies would be drawn from the remaining accounts. After all accounts have been depleted, the procedure will automatically recalculate Lifestyle Needs in the remaining years to show the reduction that would be necessary.
32
RRSP/RRIF If you choose to include RRSPs in the optimization, set the allocation priorities for the percentage of excess cash flow to be contributed to RRSPs and the priorities for offsetting projected deficiencies on the RRPS/RRIF tab.
You can choose to have contributions made on behalf of either spouse or both. If only one spouse is selected, contributions will only be made for that spouse, If both are selected, contributions are made for both according to the percentage allocation entered.
In many cases, you will want to maximize the spouse in the higher tax bracket’s contribution room before any contributions are made on behalf of the other spouse. To do this, enter 100% for the spouse in the higher tax bracket. The procedure then allocates all excess cash flow to that spouse’s RRSP first. Only excess amounts still remaining would be contributed on behalf of the other spouse. For the amounts to be contributed, enter the percentage to be allocated to Personal and Spousal accounts for each selected spouse.
Select the accounts that projected deficiencies should be offset from. If one of the RRSP accounts is not selected, it only means that the Optimize procedure will not use that spouses account. RRIF minimum is automatic. You may also select a spouse’s account and enter 0%, in which case the procedure will use that spouse’s account, but not until the other spouse’s RRIF account has been depleted. The No RRSP withdrawals pre-retirement option prevents the Optimize from drawing on RRSPs to offset projected deficiencies in the pre-retirement years.
Non-registered If you choose to include non-registered accounts in the optimization, set the allocation priorities for the percentage of excess cash flow to be invested in non-registered accounts and priorities for offsetting projected deficiencies on the Non-registered tab.
You can have deposits made to either spouses’ account or the joint account, Deposits are made according to the percentage allocation entered for the selected accounts. As there are no limits to amounts that can be deposited to non-registered accounts, you must enter a percentage other than 0 for a selected account to b recognized by the optimization.
Select the accounts that projected deficiencies should be offset from and the percentage of each projected deficiency to be drawn from the selected account. You can choose to enter 0% for selected account, in which case, the account will be used by the procedure, but not until the other selected accounts have been depleted.
Debts If you have chosen to include debts, set the allocation priorities for the percentage of excess cash flow to be allocated to the pay-down of debts on the Debts tab.
Select the debts to be paid down using excess cash flow on the order of priority that they should be retired, If your client is managing high interest consumer debt—Household—that should be the first priority. In the subsequent fields

33
select the debts that excess cash should be applied to, as higher priority debts are retired.
Select the category of debt to borrow necessary funds from. The selected category should normally be the same. The selected category is normally the same category as the first priority debt to be reduced by excess cash flow.
Advanced Settings There are four different optimization methods available. The method you select depends on the degree of control you want to have over the process, and the degree of accuracy you require:
• Basic—the basic optimization performs 5 pre-RRIF iterations, then three more complete iterations. Basic usually achieves the desired result, however you may with to run an additional iteration in some case, for fine tuning, using the Manual setting.
• Extended—the extended optimization performs 8 pre-RRIF iterations, then 4 more complete iterations. Extended takes longer to execute, however it achieves a higher degree of convergence than Basic.
• Custom—the custom optimization allows you to set the number of iterations you desire, using the Custom Setting controls.
• Manual—the manual optimization gives you the highest degree of control, executing a single iteration at a time
• Optimization to Recommended Settings—sets the excess and deficiency parameters to the most optimum for income splitting based on the client’s individual circumstance.
• Optimization to Default Settings—restores the optimize settings to their defaults.:
• All deposits are made to the non-registered investments
• All withdrawals are made from registered and non-registered in equal percentages
• The settings between the client and spouse are defaulted to a 50-50 allocation
Using the Solve Tool The Solve tool is used to show the effect of deposits or withdrawals on an account over a specified period.
Before you use the Solve tool, you must have all the data entered for the account you are working with. To open the modules you are working on, from the Data menu, select the module, complete the fields on the dialog box for that account.
About the Solve tool
34
The Solve tool shows the accumulated effect of withdrawals or deposits of a specified amount, over a specified period. Solves can be run on client and spouse RRSPs and non-registered investments, as well as education accounts.
To run a solve 1. From the Goto menu, select the module you want to work with, and
ensure that all necessary data for the account you are running the solve on has been entered.
2. From the toolbar, click the Solve button. FP Solutions opens the Solve for Value dialog box.
3. Follow the instructions in the yellow fields in the dialog box to set the parameters for the solve, and click Finish when you have completed all five steps of the dialog box. FP Solutions runs the solve and shows the results on the graph on the document page for that module.
What’s next? Once you have solved a module, you can use the graphs on the Summary page to show the effects of the solve.
Applying a Common Planning Strategy There are several planning strategies that you can apply to your client’s plan to show the effect of financial strategies other than investment and insurance solutions. Using a planning strategy automatically applies financial changes to your client’s plan, saving you from manually entering the information for these strategies.
About common planning strategies Common planning strategies use non-product-specific industry standard planning strategies and concepts. The effectiveness of each strategy depends on your client’s individual circumstances, but the cumulative effect can be quite significant.
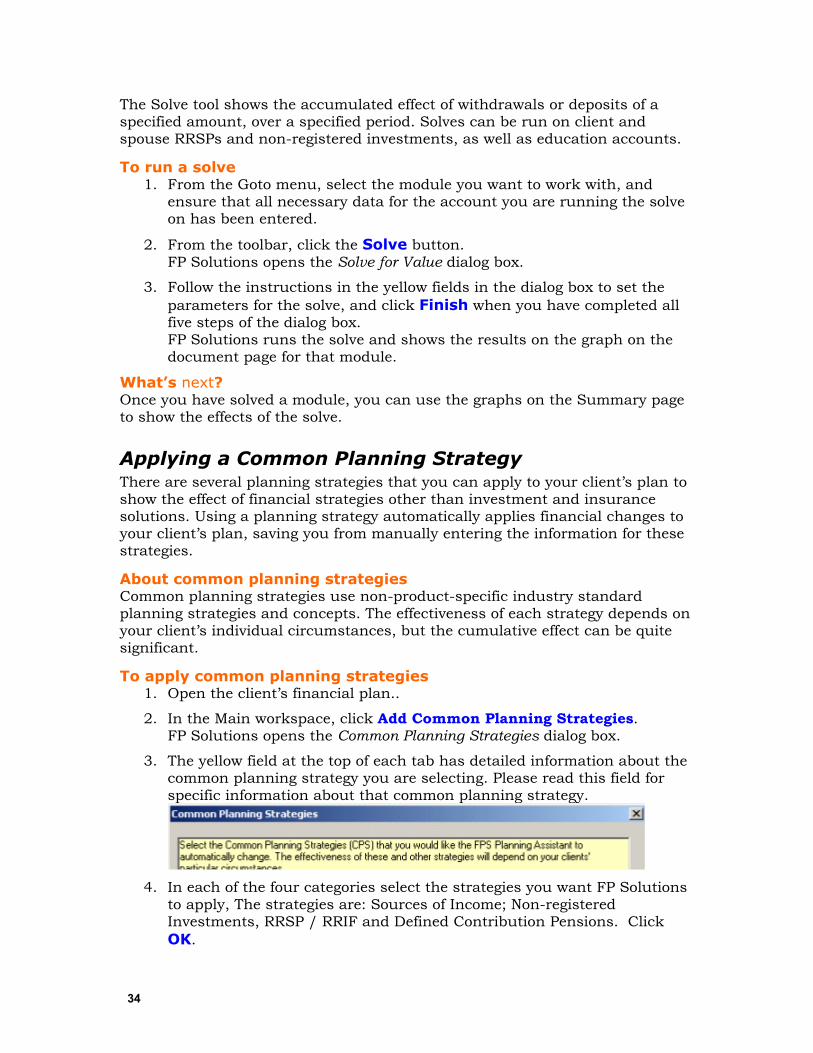
To apply common planning strategies 1. Open the client’s financial plan..
2. In the Main workspace, click Add Common Planning Strategies. FP Solutions opens the Common Planning Strategies dialog box.
3. The yellow field at the top of each tab has detailed information about the common planning strategy you are selecting. Please read this field for specific information about that common planning strategy.
4. In each of the four categories select the strategies you want FP Solutions
to apply, The strategies are: Sources of Income; Non-registered Investments, RRSP / RRIF and Defined Contribution Pensions. Click OK.
35
What’s next? After you have applied the common planning strategies, you may want to re-optimize your client’s cash flow.
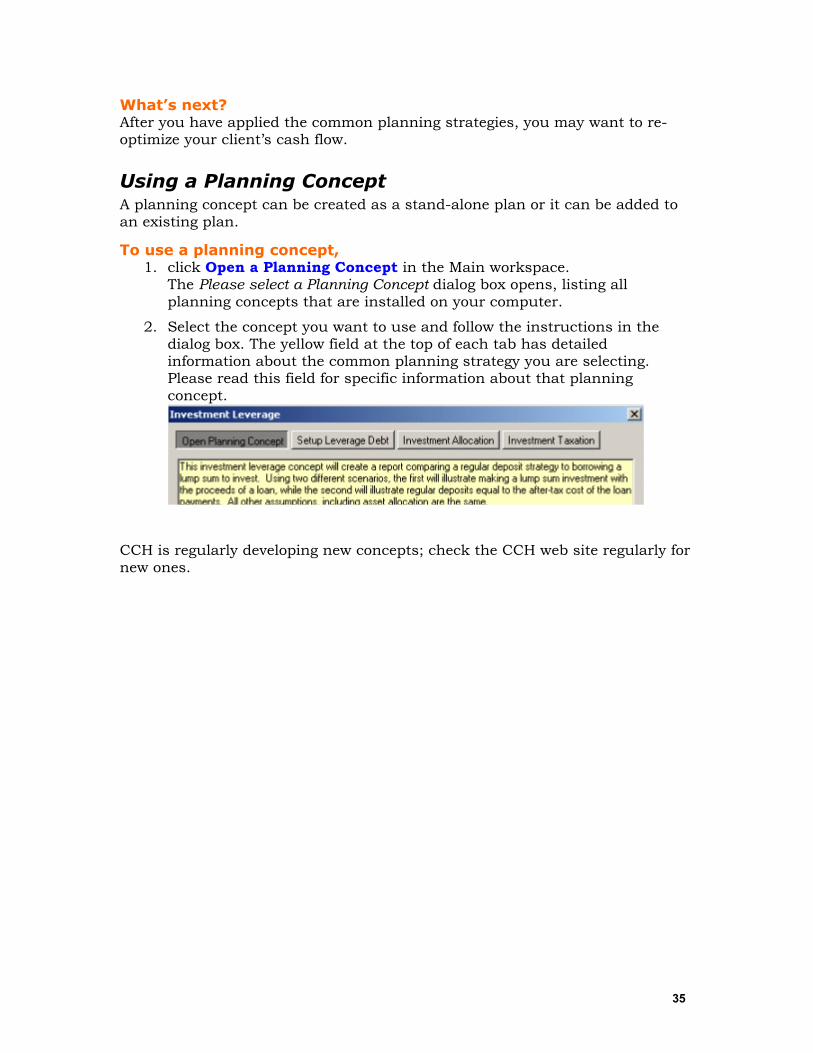
Using a Planning Concept A planning concept can be created as a stand-alone plan or it can be added to an existing plan.
To use a planning concept, 1. click Open a Planning Concept in the Main workspace.
The Please select a Planning Concept dialog box opens, listing all planning concepts that are installed on your computer.
2. Select the concept you want to use and follow the instructions in the dialog box. The yellow field at the top of each tab has detailed information about the common planning strategy you are selecting. Please read this field for specific information about that planning concept.
CCH is regularly developing new concepts; check the CCH web site regularly for new ones.

36
Setting up, Previewing and Printing Reports When you have finished a financial plan for a client, you may wish to print it for review, or to give it to your client.
About printing documents You can select any of the documents in the financial plan to print, as well as set page margins and breaks, and create headers and footers for the documents. You can select which pages to print or choose a print package that will print the necessary pages for the plan you are working with.
To set up the page for printing 1. From the File menu, select Page Setup.
2. Select your page settings, and click OK. FP Solutions saves the page settings.
To preview print documents 1. From the File menu, select Print Preview.
2. Select the page of the document you want to preview and click Print Preview. FP Solutions opens the preview view of the document, showing it the way it will look when it is printed.
3. To close the preview, click Close.
To print documents 1. From the File menu, select Print.
FP Solutions opens the Full Print dialog box.
2. Select a print package to print, or from the Available documents field, select the documents you want to print, then click the right arrow button to move the documents to the Documents to be printed field. You can use the Shift key and Ctrl key to select multiple documents. Use the left arrow key to remove any documents you don not want to print from the Documents to be printed field.

37
3. By changing the Module Type dropdown you can also select business documents and concept/custom documents to be included in the report.
4. If you haven’t already do so, to set up the page for printing, click the Print Settings tab and edit the settings. To add headers and footers to the document, click the Headers/Footers tab, select a type of header and footer, and enter the text—there is limited space available for headers and footers, so header and footer text should be brief.
5. Click Print. FP Solutions prints the report.
Printing to an Excel spreadsheet You can print to an Excel spreadsheet, which saves the selected documents as an Excel file.
To print to an Excel spreadsheet 1. From the File menu, select Print.
FP Solutions opens the Full Print dialog box.
2. Select a print package to print, or from the Available documents field, select the documents you want to print, then click the right arrow button to move the documents to the Documents to be printed field. You can use the Shift key and Ctrl key to select multiple documents. Use the left arrow key to remove any documents you don not want to print from the Documents to be printed field.
3. Click Print to Excel and enter a name for the file. FP Solutions saves the selected documents as an Excel file.
Reviewing Assumptions Assumptions are the backbone of all financial plans and are what drive all of the calculations within the financial plan. financial plan. You should review the default assumption settings to ensure that they meet your needs, and make any necessary adjustments. See Creating a Custom Default File on pg.15 for more information. This will save you from changing the rate of return and other assumptions every time you begin a plan.
About reviewing assumptions Assumption settings to check including:
• Return Index
• Management Expense Ratio—enter 0 in all MER fields to exclude MERs
• Earnings Allocations
• Realized Capital Gains
• Fund Return Details—the categories have been allocated as proposed by the Investment Funds Standards Committee
• Inflation
38
To review assumptions 1. From the Data menu, choose Assumptions.
FP Solutions opens the Assumptions dialog box.
2. Review and edit the assumptions, and click OK. To review and edit return allocations, click Fund Return Details. To work with the assumptions on a worksheet, click Edit Variables. To close the dialog box without making changes, click Cancel.
What’s next Now that the default assumptions meet your needs, you can run solves and optimizes on your client’s plan.
39
Working with Simulations FP Solutions contains a sophisticated modeling environment for comprehensive financial planning, with in-depth tax calculations and the extensive flexibility to allow you to illustrate the global impact of virtually any planning strategy. This framework, is built around a single set of return assumptions that are conservative or historically probable—expected returns—to ensure that the recommendations are sound. FP Solutions’ Simulation tool, however, does not rely on a single set of assumptions. It allows you to assess the projected results of an entire financial plan or individual investment portfolios by taking in to account the realities of the market volatility.
Simulation is the process of calculating projections over and over, each time with changes to the variable assumptions. With Monte Carlo simulations, the changes are random, while with the Variance simulation procedure, the changes to the parameters are controlled.
Using Monte Carlo Simulations Monte Carlo simulations are used in finance, but its use has been limited by the fact that the calculations can be very intensive, taking from several minutes to several hours to solve a problem. The technique repeatedly samples random values to calculate multiple scenarios of a model, producing multiple possible outcomes. The random selection of values is much like a roll of the dice, which is where the Monte Carlo simulation gets its name.
The Simulation tool allows you to perform Monte Carlo simulations using a random sampling of values within the standard deviation of the various asset classes. You can also include deviation of the rate of inflation, as well as the rate of realized gains on equity investments. Within the context of a comprehensive financial plan, Monte Carlo simulations create an analytical model that enables you to assess the potential effects of the volatility of financial markets. The report details and organizes the different outcomes, depending on the number of simulations you wish to run.
Monte Carlo simulations open up new discussion of risk vs. reward and the realities of market volatility. The simulation results effectively validate the benefits of acting on your recommendations and enable you to focus on the probability of success.
Using Historical Simulations Historical simulations are not yet available with this release.
Using Variance Simulations The Variance simulation performs a series of what-if trials, adjusting the return assumptions within a user-specified range to test the results of a financial plan assuming returns are somewhat lower, as well as somewhat higher than those used as the basic assumptions. This effectively tests the margin of error on your plan assumptions. You can also perform a simplified Variance test from the Assumptions dialog box.
40
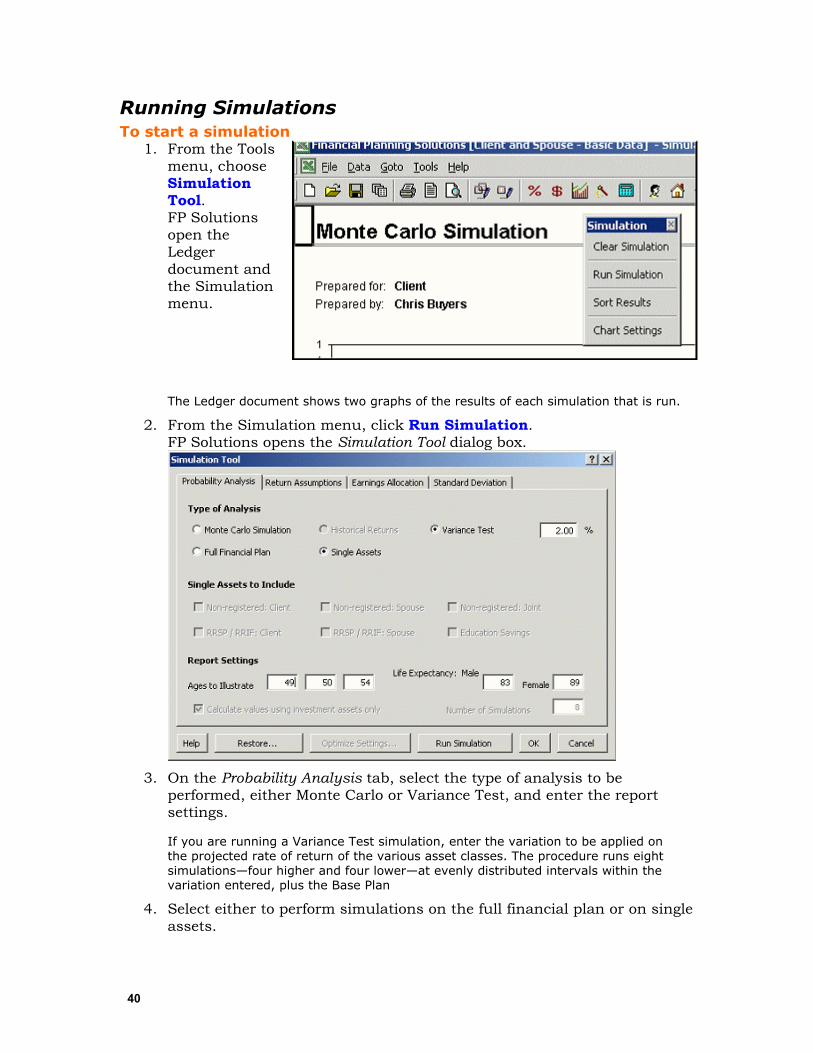
Running Simulations To start a simulation
1. From the Tools menu, choose Simulation Tool. FP Solutions open the Ledger document and the Simulation menu.
The Ledger document shows two graphs of the results of each simulation that is run.
2. From the Simulation menu, click Run Simulation. FP Solutions opens the Simulation Tool dialog box.
3. On the Probability Analysis tab, select the type of analysis to be
performed, either Monte Carlo or Variance Test, and enter the report settings.
If you are running a Variance Test simulation, enter the variation to be applied on the projected rate of return of the various asset classes. The procedure runs eight simulations—four higher and four lower—at evenly distributed intervals within the variation entered, plus the Base Plan
4. Select either to perform simulations on the full financial plan or on single assets.
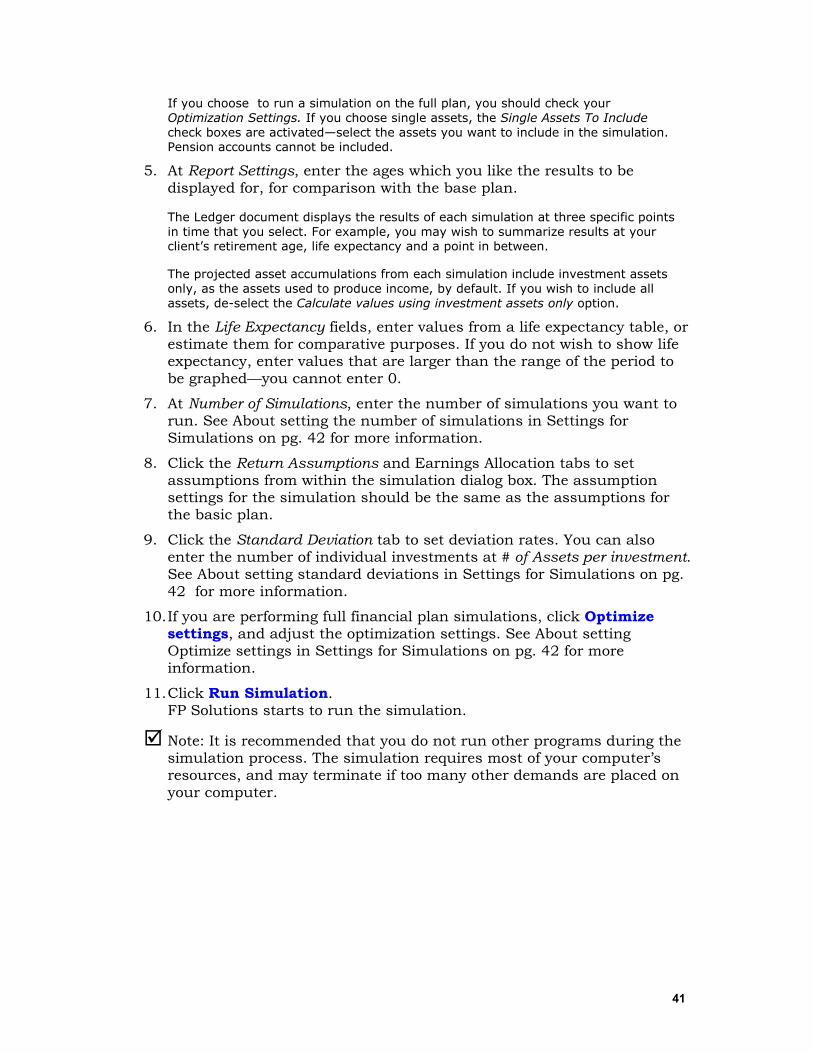
41
If you choose to run a simulation on the full plan, you should check your Optimization Settings. If you choose single assets, the Single Assets To Include check boxes are activated—select the assets you want to include in the simulation. Pension accounts cannot be included.
5. At Report Settings, enter the ages which you like the results to be displayed for, for comparison with the base plan.
The Ledger document displays the results of each simulation at three specific points in time that you select. For example, you may wish to summarize results at your client’s retirement age, life expectancy and a point in between.
The projected asset accumulations from each simulation include investment assets only, as the assets used to produce income, by default. If you wish to include all assets, de-select the Calculate values using investment assets only option.
6. In the Life Expectancy fields, enter values from a life expectancy table, or estimate them for comparative purposes. If you do not wish to show life expectancy, enter values that are larger than the range of the period to be graphed—you cannot enter 0.
7. At Number of Simulations, enter the number of simulations you want to run. See About setting the number of simulations in Settings for Simulations on pg. 42 for more information.
8. Click the Return Assumptions and Earnings Allocation tabs to set assumptions from within the simulation dialog box. The assumption settings for the simulation should be the same as the assumptions for the basic plan.
9. Click the Standard Deviation tab to set deviation rates. You can also enter the number of individual investments at # of Assets per investment. See About setting standard deviations in Settings for Simulations on pg. 42 for more information.
10. If you are performing full financial plan simulations, click Optimize settings, and adjust the optimization settings. See About setting Optimize settings in Settings for Simulations on pg. 42 for more information.
11. Click Run Simulation. FP Solutions starts to run the simulation.
Note: It is recommended that you do not run other programs during the simulation process. The simulation requires most of your computer’s resources, and may terminate if too many other demands are placed on your computer.

42
The Simulation Status window displays an estimate of the time remaining to complete after the first simulation. You may wish to change the number of simulations to be performed, depending on the amount of time you are will to allow the process to continue.
12. To change the number of simulations, click Pause after Current Simulation. FP Solutions pauses when the current simulation is complete.
13. You can either:
• change the number of simulations to be performed and click Resume.
• If you want to cancel the simulations and view the values from the simulations run until that point, click Abort. The Base plan does not appear on the document, as it is the last simulation run
• If you want to cancel the simulations, but want to view the Base plan values, change the number of simulations to be performed to the same number as have been performed and click Resume.
Settings for Simulations There are several settings for simulations that effect the outcome. This section provides the reference information to help you understand these settings.
About setting the number of simulations At step seven in Starting a simulation, you set the number of simulations to be run. The number of simulations you choose depends on the type of analysis, the degree of accuracy required and the time available to perform the simulations. Single asset calculations do not use many computer resources and do not take long—you should set the Simulation too to perform at least 250 simulations to get an adequate sampling, however you can perform as many as 1,000.
Monte Carlo simulations on a full financial plan use far more computer resources, as the simulation re-optimizes the plan with every simulation. You can perform as few as 10, however to get a wider sampling, you should run 100 or more. This can take a few minutes to several hours, depending on the optimization settings.
43
To reduce the time required to perform the simulations, you can use the Custom feature in the Optimize tool’s Cash Flow dialog box to perform as few as two iterations, for example, two total one pre-RRIF iterations. Excesses and deficiencies that are not optimized are credited and charged respectively as the Cash rate, For most cases, these settings are adequate to produce dependable results for analysis. For cases where more analysis is required, you may wish to run the simulations at the Basic or Extended setting while you are at lunch or overnight. Your system resources can be diminished after intensive simulations, so it is recommended that you save your results and then restart your computer.
Although the Variance simulation procedure also re-optimizes with each simulation, it does not take as long, as only eight simulations are run.
About setting standard deviations At step nine in Starting a simulation, you set the standard deviations for the simulation. The Monte Carlo procedure uses random values in each simulation, for each year projected, based on:
• The Return Index for each asset class as entered on the Return Assumptions tab
• The Standard Deviation of each asset class
• The Rate of realized gains as entered on the Earned Allocation tab
• The deviation rate to be applied on the Rate of Realized Gains for each asset class
• The inflation assumption
• The deviation rate to be applied to Inflation
With the range of variables involved in the deviation rates, there are literally millions of possible outcomes.
You can further widen the sampling by entering multiple assets for each asset class. For example, if you were working with stock portfolios, you could enter the number of individual stocks from each asset class. Although this increases the number of variables for a potentially wider sampling, standard deviation effectively reduces as the number of investments in an asset class increases.
About setting Optimize settings At step ten in Starting a simulation, you set the Optimize settings for the simulation. You may wish to use the Custom control to minimize the number of iterations with each optimization, in the interest of saving time. In general, most of the other optimizations settings should be the same for your simulations as for the basic plan. However, if your plan was optimized over different time periods, or you manually entered deposits, for example, you may wish to adjust the time frame to be optimized in the simulations.
What’s next? Once the simulation is complete, you can view the results on the Results document. See Viewing the Simulation Results on pg.44 for more information.
44
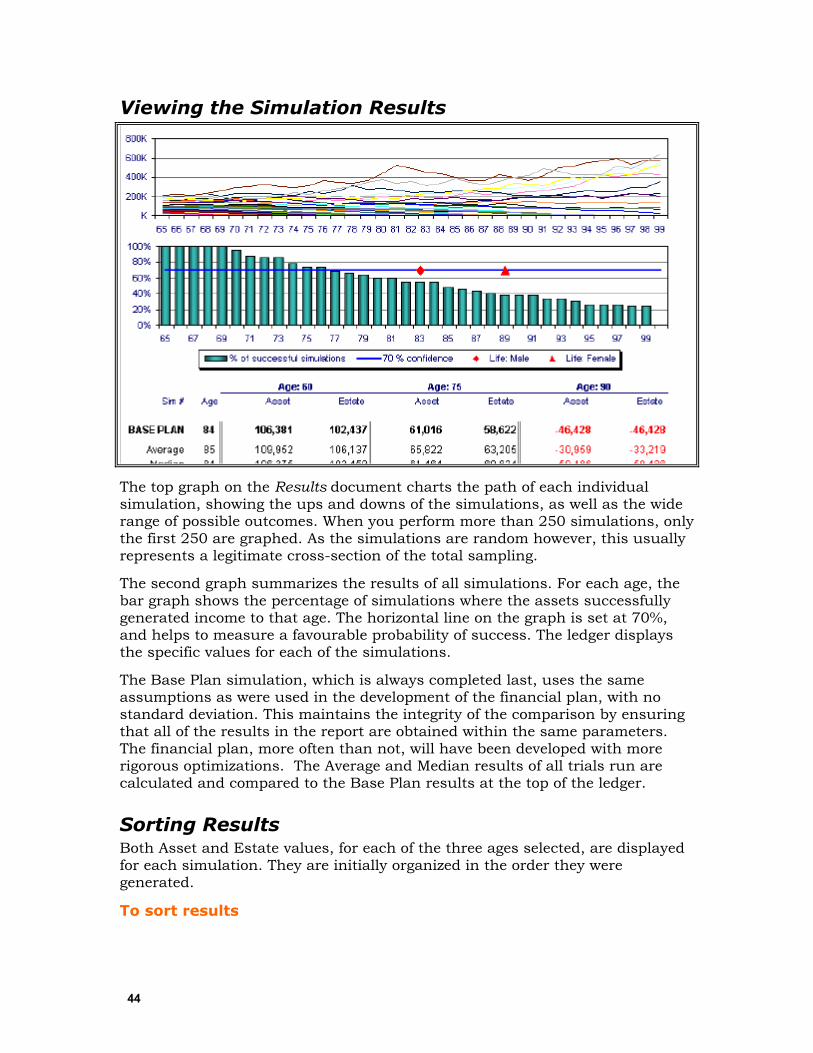
Viewing the Simulation Results
The top graph on the Results document charts the path of each individual simulation, showing the ups and downs of the simulations, as well as the wide range of possible outcomes. When you perform more than 250 simulations, only the first 250 are graphed. As the simulations are random however, this usually represents a legitimate cross-section of the total sampling.
The second graph summarizes the results of all simulations. For each age, the bar graph shows the percentage of simulations where the assets successfully generated income to that age. The horizontal line on the graph is set at 70%, and helps to measure a favourable probability of success. The ledger displays the specific values for each of the simulations.
The Base Plan simulation, which is always completed last, uses the same assumptions as were used in the development of the financial plan, with no standard deviation. This maintains the integrity of the comparison by ensuring that all of the results in the report are obtained within the same parameters. The financial plan, more often than not, will have been developed with more rigorous optimizations. The Average and Median results of all trials run are calculated and compared to the Base Plan results at the top of the ledger.
Sorting Results Both Asset and Estate values, for each of the three ages selected, are displayed for each simulation. They are initially organized in the order they were generated.
To sort results
45
1. Click the Sort Results button. FP Solutions opens a dialog box that lets you to sort the results in any of the eight columns in ascending or descending order.
2. You can click the Clear button to clear all values from a Results page. All values are automatically cleared when you run a new simulation over existing results.
Saving Results Do not use Save from the File menu or the toolbar to save the Results pages, as simulation results are not saved in the client file.
To save results 1. From the File menu, click Print. 2. Select the documents to be saved and click Print to Excel. See Printing
to an Excel spreadsheet on pg.37 for more information.
Although there are only three Report pages, enabling you to only show three simulations in FP Solutions at the same time, you can save as many simulation reports as you like by printing to Excel. After adding the Report documents to your new workbook, simply run new simulations in FP Solutions over the existing results.
Setting the chart range You can also adjust the range of ages to be displayed on the graphs.
To set the age range on the graphs 1. Click Chart Settings.
FP Solutions opens the Chart Settings dialog box.
2. Select the range of ages to be displayed from the drop-down menus and click OK.
46
Working with Investments All FP Solutions programs allow you to project several investment portfolios, including:
• Non-registered for Client, Spouse, Joint owned
• Trust Investments
• RRSP for Client, Spouse
• RESPs
• Defined Benefit Pensions (LIRA) for Client, Spouse
• Corporate accounts
In all programs, each portfolio is allocated among the asset classes—Cash, Bonds, Equity—within a seven investment categories:
• Cash & Equivalents
• Bonds: Canadian
• Bonds: Foreign
• Equities: Canadian
• Equities: Foreign
• two user-definable categories
The projected returns for each portfolio are calculated based on the return assumptions set for each of the seven investment categories, and the earnings allocation of each category—for example, distribution of interest, dividends, and capital gains.
Projected returns are also influenced by the rate of Realized Gains assumed for each category and the rate of portfolio turnover—for example, investor style. This enables FP Solutions to automatically track ACB, and calculate current and deferred taxes based on distributions and withdrawals.
Setting Return Assumptions for Investments To calculate returns accurately, you can set Return Assumptions for investment portfolios.
About the Return Assumptions The Return Assumption settings are global and apply to all investment portfolios so the return assumptions, including the two user-definable categories, should be set up before you begin working on a client file.
To set return rates and user-definable investment categories 1. From the Data menu, choose Assumptions.
FP Solutions opens the Assumptions dialog box. The user-defined categories are the two rows of fields towards the bottom of the box.
47
2. Select the asset class for each of the two user-definable investment categories from the drop-down menus—either Bonds or Equities, and whether the category is Canadian or Foreign.
3. In the text fields, enter a name for each of the categories. The names you choose are applied as labels throughout the program.
4. Enter a rate of return for each of the seven investment categories in the Assumptions user form. The rate entered for each category is assumed to remain the same over the course of the projections.
5. If you wish to show varying rates of return, click Edit Variables on the Assumptions dialog box and enter the rates on the Variables page, either directly in-cell, or using the Custom Trend/Random Number Generator tools by clicking the button at the top of each column.
If varying rates of return have been entered for an investment category, that category's control in the Assumptions user form is disabled. Whenever any control is disabled, you must go to the corresponding Variables page to adjust values.
6. Click OK. FP Solutions saves the return assumptions in the client file. These changes to the default assumptions are not automatically saved as program defaults.
Setting Management Expense Ratios You can include MERs in the calculations to show the effect on long term returns or for full disclosure. The Index document shows the return assumptions for all seven investment categories, net of the management expense ratios.
The earnings allocations entered dictates the tax treatment of non-registered investments. FP Solutions 2000 also calculates and tracks foreign content, ACB, distributions, and portfolio turnover, as well as realized and unrealized gains.
About setting MERs The net return for each investment category is calculated as the Return Index minus the MER. To exclude MERs from your projections, simply enter 0 in all Management Expense Ratio fields.
To set MERs 1. From the Data menu, choose Assumptions.
FP Solutions opens the Assumptions dialog box.
2. Click the Earnings Allocation tab.
3. Enter allocations of interest, dividends, and capital gains for each of the seven investment categories. You can enter a different rate of realized gains for each category to project the results of varying degrees of tax efficiency.
48
Creating Investment Profiles You can develop portfolios for your clients in the Investment Profile module, using FP Solutions’ investment database. The documents list the individual investments in each portfolio and graph the portfolios by investment category, and can also include investment details such as rank, MER, standard deviation, and historical returns. You can populate the investment database directly from the fund database programs. Import utilities are included for Bell Charts ® , Fund Profiler ® , Pal Trak ® , and Globe HySales ® . You can also enter investments manually.
About investment profiles You can generate graphs to illustrate your clients' current portfolios as well as illustrate recommended portfolios. To assist you in determining the appropriate asset mix to recommend, FP Solutions includes a Risk Tolerance questionnaire as part of the Fact-Finding Interview. The questionnaire is a set of 18 questions to evaluate investor profile and risk tolerance. The questions are designed to assess your clients' current financial position, their goals, investment knowledge, investor style, and whether they are active or passive investors, as well as their attitudes toward issues such as safety, volatility, and the need for liquidity.
The FP Solutions Risk Tolerance assessment is very unique. It enables you to save time by assessing tolerance for non-registered and registered portfolios for both Client and Spouse, all at the same time. In FP Solutions, the lifetime assessment goes beyond today's suggested asset mix, providing time- and age-weighted future balancing.
To complete the risk tolerance questionnaire 1. From the Data menu, and the Client Information sub-menu, choose
Investment Profile. FP Solutions opens the Risk Tolerance dialog box.
2. Select the type of question questionnaire to complete, either:
• Combine Client/Spouse Assessment—to complete the questionnaire for a couple, with a single set of responses. The two spouses' risk tolerance is treated as being the same.
• Separate Client/Spouse Assessments—to complete a separate questionnaire for each spouse. Two sets of response fields allow you to complete both simultaneously.
• Manually select risk tolerance—to set the risk tolerance on the four portfolios without completing the questionnaire.
3. Select a response to each question from the drop-down menus and click Next when you have finished each section. You can click Back to return to a previous section. Click Finish when you completed the questionnaire. FP Solutions creates a recommended portfolio based on the answers in the questionnaire.
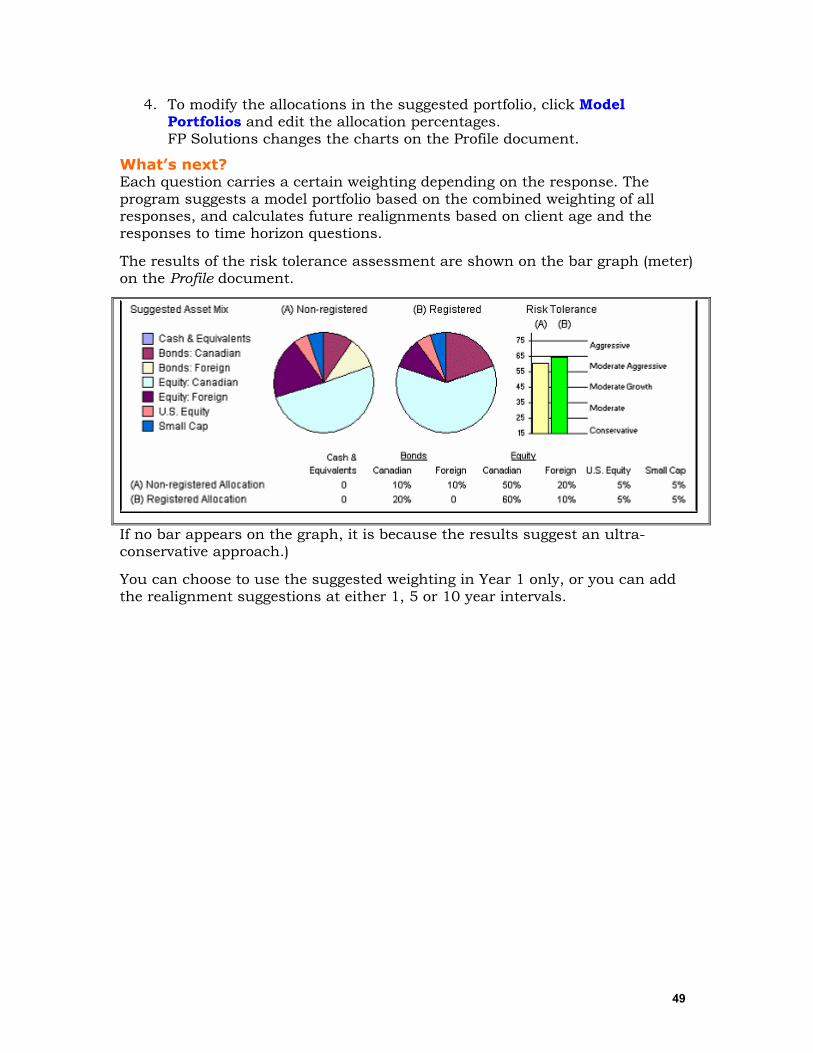
49
4. To modify the allocations in the suggested portfolio, click Model Portfolios and edit the allocation percentages. FP Solutions changes the charts on the Profile document.
What’s next? Each question carries a certain weighting depending on the response. The program suggests a model portfolio based on the combined weighting of all responses, and calculates future realignments based on client age and the responses to time horizon questions.
The results of the risk tolerance assessment are shown on the bar graph (meter) on the Profile document.
If no bar appears on the graph, it is because the results suggest an ultra-conservative approach.)
You can choose to use the suggested weighting in Year 1 only, or you can add the realignment suggestions at either 1, 5 or 10 year intervals.
50
Developing Portfolios
Creating an Investment Database You can import information already in an existing database program into the FP Solutions Investment Database, as well as creating your own custom investment entries.
The mutual fund database programs that can be used for importing information are:
• Bell Charts ®
• Fund Profiler ® ,
• Pal Trak ®
• Globe HySales ® .
There are also five user-definable other investment categories available so you can add your own investments. See Creating Custom Investments on pg.55 for more information.
FP Solutions uses the 33 standard mutual fund categories as proposed by the Investment Funds Standards Committee.
About importing data to the database Before you can create a database in FP Solutions, you must save the information you are going to import in the program you are importing from.
FP Solutions uses that information from your mutual fund database program to create a file that includes all funds and their category, rank, MER, standard deviation, and 1, 3, 5, and 10 year historical returns, when available. 1, 3, 5, and 10 year historical returns are used per IFIC's guidelines for the use of marketing materials.
The four programs you can import information from do not all rank the funds the same way, and they may not calculate Standard Deviation in the same way, so there can be minor discrepancies in the data from one program to the next.
To populate the database the file 1. In the program you are importing from, save the information to import.
2. In FP Solutions, from the Tools menu, choose Mutual Fund Data Import and select the program you are importing data from.
3. Browse for the file and click OK. FP Solutions imports the information and creates a database.
4. To update the data in the FP Solutions database from the same mutual fund database program, repeat steps 1 to 3.
Note: If you import information from another database program, FP Solutions warns you that it will delete all investments imported using the
51
original program—custom entries are not deleted. You continue with the import, or cancel the import.
What’s next? You can view the database information on the Database tab of the Investment Details dialog box. See Working with Investment Databases on pg.51 for more information.
Working with Investment Databases When you have created an investment database in FP Solutions, you can now view and work with the data.
To work with the investment database 1. From the Data menu, and Client Information sub-menu, choose
Investment Details. FP Solutions opens the Investment Details dialog box.
2. Click the Database tab.
3. To view the funds from a specific category, click the Investment type drop-down menu and select the investments to view.
4. To sort the funds, click the Sort by drop-down menu and select the primary sort criteria, then click the Then by drop-down menu and select secondary sort criteria. Click the Refresh button to update the database display. FP Solutions displays the funds in the order you selected.
5. You can mark a fund you work with frequently as a favourite by highlighting the investment and clicking Details. On the Mutual Fund Data user form, check the Marked as favourite option and click OK.
6. To create a custom fund, click Create, then enter the necessary information for the investment.
7. You can use the two option buttons at the bottom of the Investment Detail dialog box to sort the investments to show favourites and show custom funds.
8. To view details on a specific fund, highlight it and click Details.
9. To remove a fund from the database, highlight it and click Remove.
10. To add an investment in the data base to an investment portfolio, click Transfer to Investment Details.
What’s next? You can now start to develop an investment portfolio for your client. See Developing an Investment Portfolio on pg.52 for more information.
52
Developing an Investment Portfolio You can develop an investment portfolio from within any of the investment modules, or from within the Investment Profile module.
About developing investment portfolios Working from the Investment Details dialog box allows you to enter all of the investments in all the portfolios without having to go to each module.
To enter investment information to a portfolio 1. Click the Investment Details button to open the dialog box. The Portfolio
selection drop-down menu enables you to enter all of the investments in all of the portfolios, without having to go to each respective workbook.
2. When you access Investment Details from within an investment module, you can choose to update that specific portfolio with the investment details entered. Although you may have entered details for more than one portfolio, only the active portfolio is automatically updated. Select the Apply Investment Details to active module option. You can only update all portfolios at once using the Export feature from within the Investment Profile module.
To develop an investment portfolio 1. From the Data menu, and Client Information sub-menu, choose
Investment Details. FP Solutions opens the Investment Details dialog box.
2. In the Portfolio field, select the investments in all of the portfolios
When you access investment details from within an investment module, you can choose to update that specific portfolio with the investment details entered. Although you may have entered details for more than one portfolio, only the active portfolio is automatically updated. Choose Apply Investment Details to update the active module. You can update all portfolios at once using the Export feature in Investment Profile.
About adding investment information to a client file manually You can enter investments manually by entering information in the fields on the Investment Details dialog box. Investments entered manually are saved with the client file, but not the database. To enter an investment in the database, use Create on the Database tab.
To add investment information manually 1. Click New to enable the edit fields.
2. From the Portfolio field, select the portfolio the investment is to be included in.
3. Enter the value as of January 1st of the current year, or the projected value as of January 1st of the coming year, depending on the plan year entered in the Personal Information user form.
4. Enter the name of the investment.
5. Select the category of the investment from the drop-down menu.
53
6. Enter Rank, MER, Standard Deviation, and Return values to appear on the Ratings document if they are known, otherwise leave the fields blank.
7. Click Update to accept the investment. FP Solutions adds the investment information to the client file.
8. To enter more investments, repeat steps 1-7.
To add database investment information to the client file 1. Click New to enable the edit fields.
2. From the Portfolio field, select the portfolio the investment is to be included in.
3. Click the Database tab.
4. Highlight the desired investment in the database window and click Transfer to Investment Details. FP Solutions adds the investment information to the client file. All fields with data available are populated.
5. Enter the value as of January 1st of the current year, or the projected value as of January 1st of the coming year, depending on the plan year entered in the Personal Information user form.
6. Click Update. FP Solutions adds the investment to the portfolio.
To adjust the allocation of categories You can only adjust the allocation of categories from the Assumptions dialog box. You can also name five user-definable Other Investments from Assumptions.
1. From the Data Menu, choose Assumptions.
2. Click Fund Return Detail and select an Investment category.
3. Click Edit and enter the name you wish to use for the category and the desired allocation. FP Solutions updates the allocation of categories.
Selecting Investments in a Logical Sequence You can use the database and its filters to select investments from the data base in a logical sequence. However, you do not have to select investments from the database—you can also develop a portfolio entirely with custom entries to be saved in that client file only.
About selecting investments in a logical sequence Although you can select investments in any sequence you wish, you may find that the quickest and easiest way to develop a portfolio is to select investments in order of asset class. The filter in the database makes it easy to select investments in a logical sequence.
54
To select investments in a logical sequence 1. From the Data menu, and Client Information sub-menu, choose
Investment Details. FP Solutions opens the Investment Details dialog box.
2. Select a category from the Investment type drop-down menu.
3. Select Type from the Sort by drop-down menu. Choose any desired secondary criteria from the Then by menu.
4. Click Refresh.
5. Choose all investments from that category, then select the next category.
6. Repeat steps 1-3 to select other investments.
Note: The section on the right-hand side of the Investment Details tab is provided for user feedback. The amounts invested in each portfolio are displayed and updated as you proceed with your investment selections. This is particularly helpful if you are developing several different portfolios at the same time.
Note: All investment data is saved whether you choose to immediately update the portfolios or not. Also, the individual investments selected are saved in the client file. Even if a selected investment is subsequently removed from the database, it will still appear whenever you load that client file.
Editing Investments in the Portfolio At some point, you may need to change or delete an investment you have added to the client portfolio.
To edit or delete an investment in the portfolio 1. From the Data menu, and Client Information sub-menu, choose
Investment Details. FP Solutions opens the Investment Details dialog box.
2. On the Investment Details tab, use the scroll bar to find the investment you wish to edit and highlight the investment.
3. To edit the investment information, click Edit, then either enter the updated information in the fields, or click the Database tab and select another investment to replace it with.
4. To delete the investment, click Delete.
FP Solutions updates the investment information.
What’s next? You can present the summary of investment details to your client with the Portfolio and Ratings documents. The Portfolio document summarizes the portfolios with their specific investments, while the Ratings document includes full details of each investment including Rank, MER, Standard Deviation, and 1, 3, 5, and 10 year historical returns when available.
55
Using Disclaimers Because of the nature of the information provided on these documents, a disclaimer appears at the bottom of each document. You can edit the disclaimers to meet your needs.
1. From the Data menu, and Client Information sub-menu, choose Investment Details. FP Solutions opens the Investment Details dialog box.
2. On the Investment Details tab, click Disclaimer. FP Solutions opens the disclaimer so you can edit it.
3. When you have completed the editing, click OK. FP Solutions saves the changes to the disclaimer
Note: You can choose not to include the disclaimers, however, if you are using these documents to sell a recommended portfolio, the documents are considered to be a sales communication and the Disclaimer should be there.
Creating Custom Investments As well as importing investment information from a database, you can also add investments to the investment database manually.
About custom investments You only enter custom investments into the database if you intend to use them again. If you don't need them in your database you can simply enter them in the client's portfolio, in which case they are saved with the client file, but not in the database.
To add custom investments 1. From the Data menu, and Client Information sub-menu, choose
Investment Details. FP Solutions opens the Investment Details dialog box.
2. On the Database tab, click Create. FP Solutions opens the Create an Investment dialog box.
3. Enter the Company and Name of the investment to be added.
4. From the Type field, select the category it belongs to, to establish the return allocation.
5. If you know the Rank, MER, Standard Deviation, and historical returns, enter them in the edit fields. If the values are not known, leave the fields blank and no values will be shown on the Ratings document for that particular investment.
6. If you want the investment to be included in the database as a favourite, check Marked as favourite.
7. Click Save to save the investment and return to the database.
56
Working with Investment Variables As well as entering information with the Investment Variables dialog box, you can also enter investment details on the Investment Profile Variables page as an alternative to the user form.
To enter investment variables on the Investment Profile Variables page
1. From the Goto menu, and Client Information sub-menu, choose Investment Details. FP Solutions opens the Investment Details dialog box.
2. Click the Variables tab at the bottom of the window.
3. Click on a cell in the Portfolio column to display the Portfolio selection drop-down menu.
4. Select the portfolio, then enter the name of the investment in the next field.
5. Enter the values, then scroll to the right to the Category column. Click on a cell to display the Category selection drop-down menu. You can enter investments for as many portfolios as you wish in any sequence. See About investment categories below for more information.
6. Click Sort to arrange the investments by portfolio.
Note: The changes you make are only applied to the current client file.
About investment categories The Category drop-down menu offers the choice of the 33 standard mutual fund categories as proposed by the Investment Funds Standards Committee. Also included are 5 user-definable Other Investment categories. Each category is allocated among the seven Asset Class categories according to the weightings suggested in the committee's document "A Proposed Standard to Canadian Mutual Fund Classification".
You can modify the default settings in the Return Allocation dialog box accessed by clicking the Fund Return Details button on the Assumptions dialog box.
The Return Allocation of the five Other Investment categories is defaulted to 50% user-definable asset class 1, and 50% user-definable asset class 2. You should set the desired allocation at the same time as you enter a name for the category. The name you enter should be generic rather than investment specific (e.g. Stocks, not Bell Canada), so that the category can be broadly used in all portfolios. Also, you cannot repeatedly rename each Other Investment category within a single client file.
Exporting Portfolios You may wish to develop all portfolios at the same time. Although you can do so from within any investment module, you can only update them all at the same time from within Investment Profile, using the Export utility.
57
To export a portfolio 1. Once you have finished entering the investments for one or more
portfolios, click Export. FP Solutions opens the Export to Investment Modules dialog box and enables all of the portfolios detected to have been modified.
If a portfolio from an investment module not currently available in the file has been modified, the procedure will open and add that module to the plan. This form also points out errors, such as entering investments in the wrong portfolio, or forgetting a portfolio entirely.
2. De-select any portfolio you do not want to update, and click OK. FP Solutions updates all the portfolios.