fourth quarter and full year 2020 financial results
TRANSCRIPT

Fourth Quarter and Full Year 2020 Financial Results Conference Call
February 9, 2021

© 2021 Fiserv, Inc. or its affiliates. FORTUNE Magazine World's Most Admired Companies ®
2014 | 2015 | 2016 | 2017 | 2018 | 2019 | 2020 | 2021
Forward-Looking StatementsThis presentation contains forward-looking statements within the meaning of the Private Securities Litigation Reform Act of 1995, including statements regarding anticipated internal revenue growth, adjusted earnings per share, adjusted earnings per share growth, free cash flow conversion, adjusted operating margin, adjusted operating margin expansion and other statements regarding our future financial performance. Statements can generally be identified as forward-looking because they include words such as “believes,” “anticipates,” “expects,” “could,” “should,” or words of similar meaning. Statements that describe the company’s future plans, objectives or goals are also forward-looking statements. Forward-looking statements are subject to assumptions, risks and uncertainties that may cause actual results to differ materially from those contemplated by such forward-looking statements. The factors that could cause the company’s actual results to differ materially include, among others, the following, many of which are, and will be, amplified by the COVID-19 pandemic: the duration and intensity of the COVID-19 pandemic including whether the global economy generally recovers from the impact of the COVID-19 pandemic in the first half of 2021; governmental and private sector responses to the COVID-19 pandemic and the impact of such responses on the company; the impact of the COVID-19 pandemic on the company's employees, clients, vendors, operations and sales; the possibility that the company may be unable to achieve expected synergies and operating efficiencies from the acquisition of First Data Corporation ("First Data") within the expected time frames or at all or to successfully integrate the operations of First Data into the company's operations; such integration may be more difficult, time-consuming or costly than expected; profitability following the transaction may be lower than expected, including due to unexpected costs, charges or expenses resulting from the transaction; operating costs, customer loss and business disruption (including, without limitation, difficulties in maintaining relationships with employees, customers, clients or suppliers) may be greater than expected following the transaction; unforeseen risks relating to the company's liabilities or those of First Data may exist; the company's ability to meet expectations regarding the accounting and tax treatments of the transaction; the company's ability to compete effectively against new and existing competitors and to continue to introduce competitive new products and services on a timely, cost-effective basis; changes in customer demand for the company's products and services; the ability of the company's technology to keep pace with a rapidly evolving marketplace; the successful management of the company's merchant alliance program which involves several alliances not under its sole control; the impact of a security breach or operational failure on the company's business including disruptions caused by other participants in the global financial system; the failure of the company's vendors and merchants to satisfy their obligations; the successful management of credit and fraud risks in the company's business and merchant alliances; changes in local, regional, national and international economic or political conditions and the impact they may have on the company and its customers; the effect of proposed and enacted legislative and regulatory actions affecting the company or the financial services industry as a whole; the company's ability to comply with government regulations and applicable card association and network rules; the protection and validity of intellectual property rights; the outcome of pending and future litigation and governmental proceedings; the company's ability to successfully identify, complete and integrate acquisitions, and to realize the anticipated benefits associated with the same; the impact of the company’s strategic initiatives; the company’s ability to attract and retain key personnel; volatility and disruptions in financial markets that may impact the company's ability to access preferred sources of financing and the terms on which the company is able to obtain financing or increase its cost of borrowing; adverse impacts from currency exchange rates or currency controls; changes in corporate tax and interest rates; and other factors included in “Risk Factors” in the company's Quarterly Report on Form 10-Q for the quarter ended September 30, 2020, Annual Report on Form 10-K for the year ended December 31, 2019 and in other documents that the company files with the SEC, which are available at http://www.sec.gov. You should consider these factors carefully in evaluating forward-looking statements and are cautioned not to place undue reliance on such statements. The company assumes no obligation to update any forward-looking statements, which speak only as of the date of this presentation.
Use of Non-GAAP Financial Measures This presentation includes non-GAAP financial measures. Additional information about these measures, reconciliations to the nearest GAAP financial measures and additional information about the basis of the presentation of our fourth quarter and full year financial results are provided in the appendix to this presentation.
2
Forward-Looking Statements and Non-GAAP Financial Measures

© 2021 Fiserv, Inc. or its affiliates. FORTUNE Magazine World's Most Admired Companies ®
2014 | 2015 | 2016 | 2017 | 2018 | 2019 | 2020 | 2021
4Q-20 Key Financial Metrics
3
Adjusted Revenue
InternalRevenue
Adjusted EPS
4Q-20 $3,620 $3,514 $1.30
4Q-19 $3,712 $3,493 $1.12
Change (2)% 1% 16%
$ in millions, except per share amounts.
See appendix for information regarding non-GAAP measures.
© 2021 Fiserv, Inc. or its affiliates. FORTUNE Magazine World's Most Admired Companies ®
2014 | 2015 | 2016 | 2017 | 2018 | 2019 | 2020 | 2021
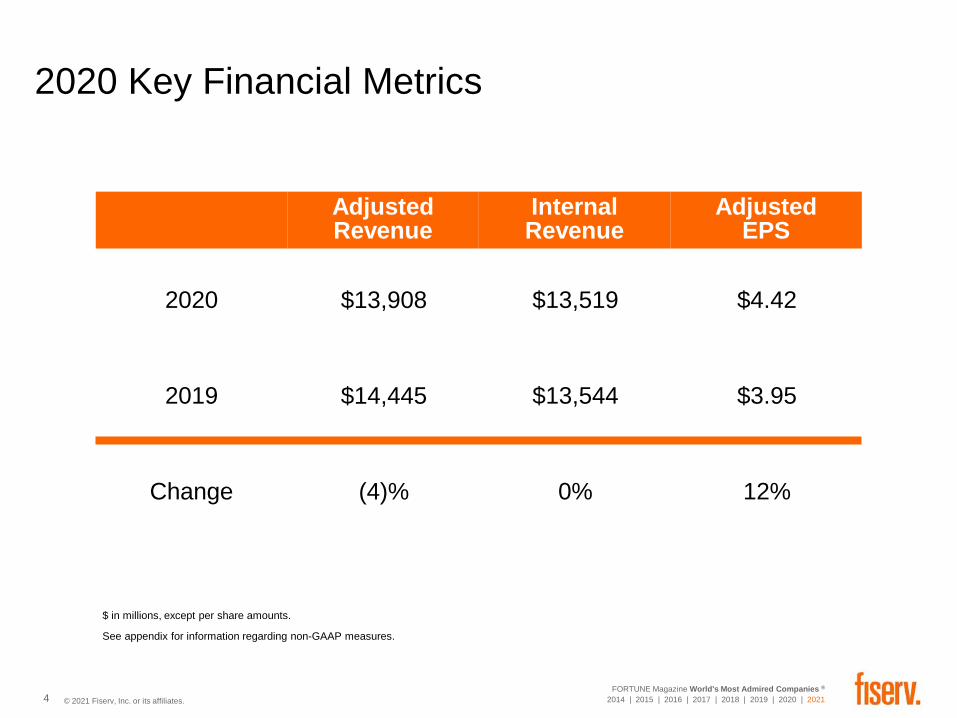
2020 Key Financial Metrics
4
Adjusted Revenue
InternalRevenue
Adjusted EPS
2020 $13,908 $13,519 $4.42
2019 $14,445 $13,544 $3.95
Change (4)% 0% 12%
$ in millions, except per share amounts.
See appendix for information regarding non-GAAP measures.

© 2021 Fiserv, Inc. or its affiliates. FORTUNE Magazine World's Most Admired Companies ®
2014 | 2015 | 2016 | 2017 | 2018 | 2019 | 2020 | 20215
Free Cash Flow Conversion
Adjusted Operating Margin
2020 121% 31.4%
2019 118% 29.7%
Change 1 3% 170 bps
Other Financial Metrics
1 Free cash flow conversion change represents the change in percentage points.
See appendix for information regarding non-GAAP measures.

© 2021 Fiserv, Inc. or its affiliates. FORTUNE Magazine World's Most Admired Companies ®
2014 | 2015 | 2016 | 2017 | 2018 | 2019 | 2020 | 2021
Internal Revenue Growth by Segment
6
Segment 4Q-20 2020
Acceptance 3% 0%
Fintech (1)% 0%
Payments (1)% 0%
Total Company 1% 0%
See appendix for information regarding non-GAAP measures.

© 2021 Fiserv, Inc. or its affiliates. FORTUNE Magazine World's Most Admired Companies ®
2014 | 2015 | 2016 | 2017 | 2018 | 2019 | 2020 | 2021
4Q-20 Adjusted Operating Margin
7
Segment 4Q-20 4Q-19 Change (bps)
Acceptance 30.7% 27.9% 280
Fintech 36.5% 31.6% 490
Payments 46.4% 43.4% 300
Total Company 35.6% 31.4% 420
See appendix for information regarding non-GAAP measures.

© 2021 Fiserv, Inc. or its affiliates. FORTUNE Magazine World's Most Admired Companies ®
2014 | 2015 | 2016 | 2017 | 2018 | 2019 | 2020 | 2021
2020 Adjusted Operating Margin
8
Segment 2020 2019 Change (bps)
Acceptance 25.4% 27.4% (200)
Fintech 34.2% 30.1% 410
Payments 43.3% 40.5% 280
Total Company 31.4% 29.7% 170
See appendix for information regarding non-GAAP measures.

© 2021 Fiserv, Inc. or its affiliates. FORTUNE Magazine World's Most Admired Companies ®
2014 | 2015 | 2016 | 2017 | 2018 | 2019 | 2020 | 2021
2021 Performance Outlook
9
Key Financial Metrics
Internal Revenue Growth 8% - 12%
Adjusted EPS $5.30 to $5.50(20% to 24% growth)
Other Financial Metrics Target
Free Cash Flow Conversion > 108%
Adjusted Operating Margin Expansion > 250 bps

© 2021 Fiserv, Inc. or its affiliates. FORTUNE Magazine World's Most Admired Companies ®
2014 | 2015 | 2016 | 2017 | 2018 | 2019 | 2020 | 2021
Appendix
10

© 2021 Fiserv, Inc. or its affiliates. FORTUNE Magazine World's Most Admired Companies ®
2014 | 2015 | 2016 | 2017 | 2018 | 2019 | 2020 | 2021
Use of Non-GAAP Financial Measures
Due to the financial impact of the First Data acquisition, the company's full year 2019 unaudited non-GAAP financial performance measures have been recalculated in this presentation on a combined company basis reflecting its reportable segments as realigned during the first quarter of 2020. The full year 2019 combined financial information has been prepared by making certain adjustments to the sum of historical First Data financial information determined in accordance with generally accepted accounting principles ("GAAP") and historical Fiserv financial information determined in accordance with GAAP. The full year 2019 combined financial information includes various estimates and is not necessarily indicative of the operating results of the combined companies had the transaction been completed at the assumed date or of the combined companies in the future. The full year 2019 combined financial information does not reflect any cost savings or other synergies anticipated as a result of the acquisition. In addition, the full year 2019 combined financial information does not reflect the impact of any purchase accounting adjustments that arose from the acquisition as those impacts would be excluded in the preparation of the combined financial information. The unaudited combined financial information is not pro forma information prepared in accordance with Article 11 of Regulation S-X of the Securities and Exchange Commission, and the preparation of information in accordance with Article 11 would result in a significantly different presentation.
This presentation includes the following unaudited non-GAAP financial measures: "combined revenue," "adjusted revenue," "internal revenue," "internal revenue growth," "combined operating income," "adjusted operating income," "adjusted operating margin," "adjusted operating margin expansion," "combined net income attributable to Fiserv," "adjusted net income," "combined earnings per share," "adjusted earnings per share," "combined net cash provided by operating activities," "free cash flow," and "free cash flow conversion." Management believes that providing combined full year 2019 financial information and making adjustments for certain non-cash or other items and excluding certain pass-through revenue and expenses should enhance shareholders' ability to evaluate the company's performance, including providing additional insights into the factors and trends affecting the company's business and, with respect to combined financial information, providing a reasonable basis of comparison with its post-acquisition results. Additional information about these measures and reconciliations to the nearest GAAP financial measures are provided in this appendix.
Forward-looking Non-GAAP Financial MeasuresReconciliations of unaudited non-GAAP financial measures to the most comparable GAAP measures are included in this presentation, except for forward-looking measures where a reconciliation to the corresponding GAAP measures is not available due to the variability, complexity and limited visibility of these items that are excluded from the non-GAAP outlook measures. The company's forward-looking non-GAAP financial measures for 2021, including internal revenue growth, adjusted earnings per share, adjusted operating margin, and free cash flow conversion, are designed to enhance shareholders' ability to evaluate the company's performance by excluding certain items to focus on factors and trends affecting its business. The company's internal revenue growth outlook includes deferred revenue purchase accounting adjustments and excludes the impact of foreign currency fluctuations, acquisitions, dispositions and the company's Output Solutions postage reimbursements. The company's adjusted earnings per share and adjusted operating margin outlooks include non-cash deferred revenue purchase accounting adjustments and exclude non-cash intangible asset amortization expense associated with acquisitions, non-cash impairment charges, merger and integration costs, severance and restructuring costs, and gains or losses from the sale of businesses. In addition, the adjusted earnings per share outlook excludes certain discrete tax benefits and expenses and the adjusted operating margin outlook excludes the impact of the company’s Output Solutions postage reimbursements. The company’s free cash flow outlook and free cash flow conversion outlook includes, but is not limited to, capital expenditures, distributions paid to noncontrolling interests, and distributions from unconsolidated affiliates and excludes severance, restructuring, merger and integration payments. The company estimates that amortization expense in 2021 with respect to acquired intangible assets will approximate the amount incurred in 2020. Other adjustments to the company's financial measures that were incurred in 2020 are presented on the subsequent pages of this presentation; however, they are not necessarily indicative of adjustments that may be incurred in 2021 or beyond. Estimates of these impacts and adjustments on a forward-looking basis are not available due to the variability, complexity and limited visibility of these items.
11
Non-GAAP Financial Measures

© 2021 Fiserv, Inc. or its affiliates. FORTUNE Magazine World's Most Admired Companies ®
2014 | 2015 | 2016 | 2017 | 2018 | 2019 | 2020 | 2021
Internal Revenue Growth
12
Three Months Ended December 31, Year Ended December 31,2020 2019 Growth 2020 2019 Growth
Total CompanyAdjusted revenue $ 3,620 $ 3,712 $ 13,908 $ 14,445Currency impact 15 — 133 —Acquisition adjustments — — (6) —Divestiture adjustments (121) (219) (516) (901)Internal revenue $ 3,514 $ 3,493 1% $ 13,519 $ 13,544 0%
AcceptanceAdjusted revenue $ 1,444 $ 1,464 $ 5,402 $ 5,702Currency impact 18 — 111 —Acquisition adjustments — — (6) —Divestiture adjustments (113) (152) (450) (631)Internal revenue $ 1,349 $ 1,312 3% $ 5,057 $ 5,071 0%
FintechAdjusted revenue $ 742 $ 751 $ 2,901 $ 2,942Currency impact (3) — (1) —Divestiture adjustments — (6) — (35)Internal revenue $ 739 $ 745 (1)% $ 2,900 $ 2,907 0%
PaymentsAdjusted revenue $ 1,423 $ 1,453 $ 5,544 $ 5,607Currency impact — — 23 —Divestiture adjustments — (18) (8) (46)Internal revenue $ 1,423 $ 1,435 (1)% $ 5,559 $ 5,561 0%
Corporate and OtherAdjusted revenue $ 11 $ 44 $ 61 $ 194Divestiture adjustments (8) (43) (58) (189)Internal revenue $ 3 $ 1 $ 3 $ 5
$ in millions. Internal revenue growth is calculated using actual, unrounded amounts. See page 11 for information regarding non-GAAP financial measures.
Internal revenue growth is measured as the change in adjusted revenue (see pages 18-22) for the current period excluding the impact of foreign currency fluctuations and revenue attributable to acquisitions (except for full year 2019 revenue attributable to First Data which is presented on a combined company basis) and dispositions, divided by adjusted revenue from the prior period excluding revenue attributable to dispositions. Revenue attributable to dispositions also includes current and prior period revenue associated with merchants retained by the company from the Banc of America Merchant Services joint venture, which was dissolved effective July 1, 2020, transition services revenue within Corporate and Other, and, in the Payments segment, certain adjustments to conform prior period amounts to be consistent with the combined company's presentation. Currency impact is measured as the increase or decrease in adjusted revenue for the current period by applying prior period foreign currency exchange rates to present a constant currency comparison to prior periods.

© 2021 Fiserv, Inc. or its affiliates. FORTUNE Magazine World's Most Admired Companies ®
2014 | 2015 | 2016 | 2017 | 2018 | 2019 | 2020 | 202113
Earnings per share is calculated using actual, unrounded amounts.
See page 11 for information regarding non-GAAP financial measures.1 GAAP earnings per share is computed by dividing GAAP net income by the weighted average common shares outstanding - diluted during the period. Combined
earnings per share is computed by dividing combined net income attributable to Fiserv by the combined weighted average common shares outstanding - diluted during the period. The full year 2019 combined weighted average common shares outstanding - diluted is computed based on the historical Fiserv weighted average shares outstanding - diluted determined in accordance with GAAP, adjusted to include the Fiserv shares issued as merger consideration and shares subject to First Data equity awards assumed by Fiserv in connection with the First Data acquisition.
2 Represents acquisition and related integration costs incurred as a result of the company's various acquisitions. Merger and integration costs include $250 million and $128 million in the fourth quarter of 2020 and 2019, respectively, and $865 million and $408 million in full year 2020 and 2019, respectively, related to the First Data acquisition. First Data integration-related costs in the fourth quarter and full year 2020 primarily include $70 million and $224 million, respectively, of third party professional service fees associated with integration-related activities; $39 million and $165 million, respectively, of incremental share-based compensation, including the fair value of stock awards assumed by Fiserv; $3 million and $118 million, respectively, of accelerated depreciation and amortization associated with the termination of certain vendor contracts; $32 million and $137 million, respectively, of other integration-related compensation costs; and $80 million and $124 million, respectively, of non-cash impairment charges associated with the early exit of certain leased facilities. Merger and integration costs related to the First Data acquisition in the fourth quarter and full year 2019 include $37 million and $199 million, respectively, of legal and other professional service fees, primarily consisting of transaction costs, as well as $51 million and $108 million, respectively, of incremental share-based compensation, including the fair value of stock awards assumed by Fiserv.
4Q-20 4Q-19 2020 2019GAAP EPS 1 $ 0.44 $ 0.36 $ 1.40 $ 1.71Combined EPS 1 $ 0.44 $ 0.36 $ 1.40 $ 1.72Combined adjustments - net of income taxes:
Merger and integration costs 2 0.29 0.16 1.02 0.52Severance and restructuring costs 3 0.02 0.08 0.12 0.17Amortization of acquisition-related intangible assets 4 0.57 0.59 2.28 1.36Debt financing activities 5 — — — 0.32Impact of divestitures 6 — (0.01) — (0.05)Non wholly-owned entity activities 7 0.05 (0.04) 0.11 (0.06)Gain on sale of businesses 6 — (0.01) (0.50) (0.01)Discrete tax items 8 (0.06) (0.02) (0.01) (0.01)
Adjusted EPS $ 1.30 $ 1.12 $ 4.42 $ 3.95
Adjusted EPS
© 2021 Fiserv, Inc. or its affiliates. FORTUNE Magazine World's Most Admired Companies ®
2014 | 2015 | 2016 | 2017 | 2018 | 2019 | 2020 | 2021
Adjusted EPS (cont.)
14
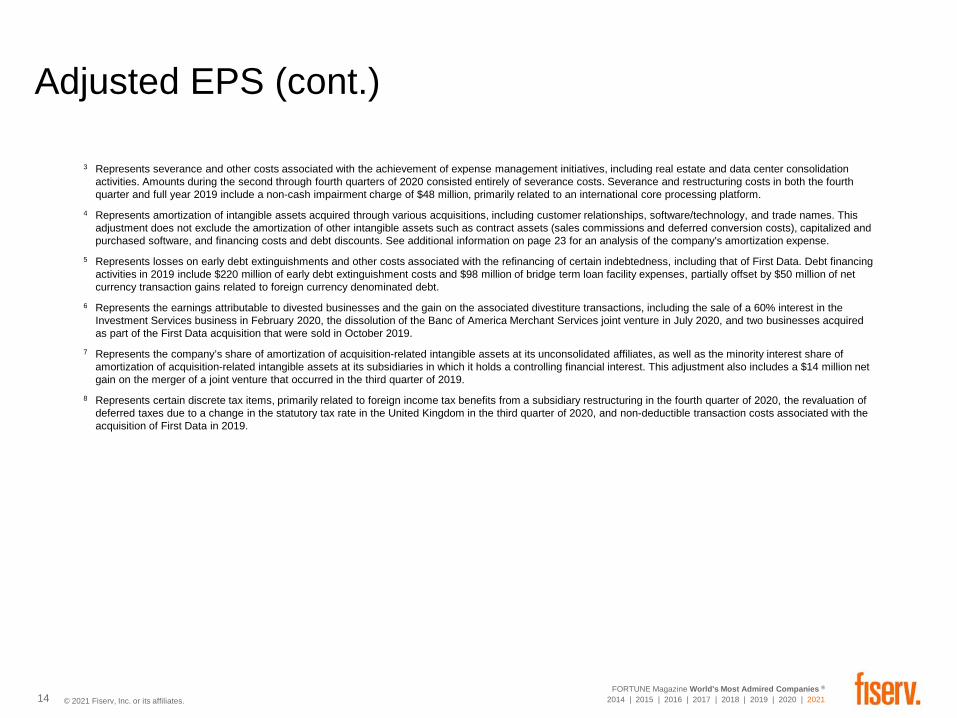
3 Represents severance and other costs associated with the achievement of expense management initiatives, including real estate and data center consolidation activities. Amounts during the second through fourth quarters of 2020 consisted entirely of severance costs. Severance and restructuring costs in both the fourth quarter and full year 2019 include a non-cash impairment charge of $48 million, primarily related to an international core processing platform.
4 Represents amortization of intangible assets acquired through various acquisitions, including customer relationships, software/technology, and trade names. This adjustment does not exclude the amortization of other intangible assets such as contract assets (sales commissions and deferred conversion costs), capitalized and purchased software, and financing costs and debt discounts. See additional information on page 23 for an analysis of the company's amortization expense.
5 Represents losses on early debt extinguishments and other costs associated with the refinancing of certain indebtedness, including that of First Data. Debt financing activities in 2019 include $220 million of early debt extinguishment costs and $98 million of bridge term loan facility expenses, partially offset by $50 million of net currency transaction gains related to foreign currency denominated debt.
6 Represents the earnings attributable to divested businesses and the gain on the associated divestiture transactions, including the sale of a 60% interest in the Investment Services business in February 2020, the dissolution of the Banc of America Merchant Services joint venture in July 2020, and two businesses acquired as part of the First Data acquisition that were sold in October 2019.
7 Represents the company’s share of amortization of acquisition-related intangible assets at its unconsolidated affiliates, as well as the minority interest share of amortization of acquisition-related intangible assets at its subsidiaries in which it holds a controlling financial interest. This adjustment also includes a $14 million net gain on the merger of a joint venture that occurred in the third quarter of 2019.
8 Represents certain discrete tax items, primarily related to foreign income tax benefits from a subsidiary restructuring in the fourth quarter of 2020, the revaluation of deferred taxes due to a change in the statutory tax rate in the United Kingdom in the third quarter of 2020, and non-deductible transaction costs associated with the acquisition of First Data in 2019.

© 2021 Fiserv, Inc. or its affiliates. FORTUNE Magazine World's Most Admired Companies ®
2014 | 2015 | 2016 | 2017 | 2018 | 2019 | 2020 | 2021
Adjusted Net Income
15
$ in millions, except per share amounts. See page 11 for information regarding non-GAAP financial measures.
4Q-20 4Q-19 2020 2019GAAP net income $ 300 $ 247 $ 958 $ 893GAAP net income attributable to First Data 1 — — — 303Combined net income attributable to Fiserv 300 247 958 1,196Combined adjustments:
Merger and integration costs 2 254 148 902 467Severance and restructuring costs 3 16 75 108 150Amortization of acquisition-related intangible assets 4 501 533 2,024 1,222Debt financing activities 5 — — — 287Non wholly-owned entity activities 7 41 (33) 94 (53)Tax impact of adjustments 8 (187) (169) (719) (480)Gain on sale of businesses 6 — (5) (464) (12)Tax impact on gain on sale of businesses 8 — 1 124 3Discrete tax items 9 (39) (13) (7) (5)
Adjusted net income, before impact of divestitures 886 784 3,020 2,775Impact of divestitures 6 — (5) — (46)Tax on impact of divestitures 8 — — — 10
Adjusted net income $ 886 $ 779 $ 3,020 $ 2,739Weighted average common shares outstanding - diluted 681.2 694.7 683.4 522.6Issuance of shares for combination — — — 167.0Dilutive impact of exchanged equity awards — — — 4.5Combined weighted average common shares outstanding -diluted 10 681.2 694.7 683.4 694.1GAAP earnings per share 10 $ 0.44 $ 0.36 $ 1.40 $ 1.71Combined earnings per share 10 $ 0.44 $ 0.36 $ 1.40 $ 1.72

© 2021 Fiserv, Inc. or its affiliates. FORTUNE Magazine World's Most Admired Companies ®
2014 | 2015 | 2016 | 2017 | 2018 | 2019 | 2020 | 2021
Adjusted Net Income (cont.)
16
1 Represents the financial results of First Data prior to the date of acquisition. For the year ended December 31, 2019, this includes the results of First Data from January 1, 2019 through July 28, 2019.
2 Represents acquisition and related integration costs incurred as a result of the company's various acquisitions. Merger and integration costs include $250 million and $128 million in the fourth quarter of 2020 and 2019, respectively, and $865 million and $408 million in full year 2020 and 2019, respectively, related to the First Data acquisition. First Data integration-related costs in the fourth quarter and full year 2020 primarily include $70 million and $224 million, respectively, of third party professional service fees associated with integration-related activities; $39 million and $165 million, respectively, of incremental share-based compensation, including the fair value of stock awards assumed by Fiserv; $3 million and $118 million, respectively, of accelerated depreciation and amortization associated with the termination of certain vendor contracts; $32 million and $137 million, respectively, of other integration-related compensation costs; and $80 million and $124 million, respectively, of non-cash impairment charges associated with the early exit of certain leased facilities. Merger and integration costs related to the First Data acquisition in the fourth quarter and full year 2019 include $37 million and $199 million, respectively, of legal and other professional service fees, primarily consisting of transaction costs, as well as $51 million and $108 million, respectively, of incremental share-based compensation, including the fair value of stock awards assumed by Fiserv.
3 Represents severance and other costs associated with the achievement of expense management initiatives, including real estate and data center consolidation activities. Amounts during the second through fourth quarters of 2020 consisted entirely of severance costs. Severance and restructuring costs in both the fourth quarter and full year 2019 include a non-cash impairment charge of $48 million, primarily related to an international core processing platform.
4 Represents amortization of intangible assets acquired through various acquisitions, including customer relationships, software/technology, and trade names. This adjustment does not exclude the amortization of other intangible assets such as contract assets (sales commissions and deferred conversion costs), capitalized and purchased software, and financing costs and debt discounts. See additional information on page 23 for an analysis of the company's amortization expense.
5 Represents losses on early debt extinguishments and other costs associated with the refinancing of certain indebtedness, including that of First Data. Debt financing activities in 2019 include $220 million of early debt extinguishment costs and $98 million of bridge term loan facility expenses, partially offset by $50 million of net currency transaction gains related to foreign currency denominated debt.
6 Represents the earnings attributable to divested businesses and the gain on the associated divestiture transactions, including the sale of a 60% interest in the Investment Services business in February 2020, the dissolution of the Banc of America Merchant Services joint venture in July 2020, and two businesses acquired as part of the First Data acquisition that were sold in October 2019.
7 Represents the company’s share of amortization of acquisition-related intangible assets at its unconsolidated affiliates, as well as the minority interest share of amortization of acquisition-related intangible assets at its subsidiaries in which it holds a controlling financial interest. This adjustment also includes a $14 million net gain on the merger of a joint venture that occurred in the third quarter of 2019.
8 The tax impact of adjustments is calculated using a tax rate of 23%, which approximates the combined company's annual effective tax rate, exclusive of the actual tax impacts associated with the gain on sale of businesses.
9 Represents certain discrete tax items, primarily related to foreign income tax benefits from a subsidiary restructuring in the fourth quarter of 2020, the revaluation of deferred taxes due to a change in the statutory tax rate in the United Kingdom in the third quarter of 2020, and non-deductible transaction costs associated with the acquisition of First Data in 2019.
10 GAAP earnings per share is computed by dividing GAAP net income by the weighted average common shares outstanding - diluted during the period. Combined earnings per share is computed by dividing combined net income attributable to Fiserv by the combined weighted average common shares outstanding - diluted during the period. The full year 2019 combined weighted average common shares outstanding - diluted is computed based on the historical Fiserv weighted average shares outstanding - diluted determined in accordance with GAAP, adjusted to include the Fiserv shares issued as merger consideration and shares subject to First Data equity awards assumed by Fiserv in connection with the First Data acquisition.

© 2021 Fiserv, Inc. or its affiliates. FORTUNE Magazine World's Most Admired Companies ®
2014 | 2015 | 2016 | 2017 | 2018 | 2019 | 2020 | 2021
$ in millions. Free cash flow conversion is defined as free cash flow divided by adjusted net income before the impact of divestitures.
See page 11 for information regarding non-GAAP financial measures. See pages 15-16 for adjusted net income reconciliation.1 Represents the financial results of First Data prior to the date of acquisition. For the year ended December 31, 2019, this includes the results of First Data from January 1, 2019
through July 28, 2019. 2 Represents the conformity of First Data's historical classification of payments for contract assets to be consistent with the company's classification and treatment.3 Distributions from unconsolidated affiliates totaled $45 million and $44 million for the fourth quarter of 2020 and 2019, of which $30 million and $16 million are recorded within net
cash provided by operating activities, respectively. Distributions from unconsolidated affiliates totaled $151 million in 2020, of which $42 million are recorded within net cash provided by operating activities. Distributions from unconsolidated affiliates totaled $234 million in 2019, of which $121 million are recorded within First Data net cash provided by operating activities.
Free Cash Flow Conversion
17
4Q-20 4Q-19 2020 2019Net cash provided by operating activities $ 1,186 $ 1,178 $ 4,147 $ 2,795First Data net cash provided by operating activities 1 — — — 1,370First Data payments for contract assets 2 — — — (51)Combined net cash provided by operating activities 1,186 1,178 4,147 4,114Combined capital expenditures (211) (290) (900) (1,118)Combined adjustments:
Distributions paid to noncontrolling interests and redeemable noncontrolling interests (43) (72) (104) (271)
Distributions from unconsolidated affiliates 3 15 28 109 113Severance, restructuring, merger and integration payments 137 173 505 375Settlement of interest rate hedge contracts — — — 183Tax payments on adjustments and debt financing (30) (33) (109) (105)Other — — — (4)
Free cash flow $ 1,054 $ 984 $ 3,648 $ 3,287
Adjusted net income, before impact of divestitures $ 886 $ 784 $ 3,020 $ 2,775Free cash flow conversion 119 % 126 % 121 % 118 %
GAAP net income attributable to Fiserv, Inc. $ 300 $ 247 $ 958 $ 893Ratio of net cash provided by operating activities to GAAP net income 395 % 477 % 433 % 313 %

© 2021 Fiserv, Inc. or its affiliates. FORTUNE Magazine World's Most Admired Companies ®
2014 | 2015 | 2016 | 2017 | 2018 | 2019 | 2020 | 202118
Total Company
Adjusted Revenue and Adjusted Operating Income
4Q-20 4Q-19 2020 2019Revenue $ 3,832 $ 4,045 $ 14,852 $ 10,187First Data revenue 1 — — — 5,609Combined revenue 3,832 4,045 14,852 15,796Combined adjustments:
Intercompany eliminations 2 — — — (4)Output Solutions postage reimbursements (224) (248) (864) (978)Deferred revenue purchase accounting adjustments 12 12 46 18Merchant Services adjustment 3 — (97) (126) (387)
Adjusted revenue $ 3,620 $ 3,712 $ 13,908 $ 14,445
Operating income $ 516 $ 478 $ 1,852 $ 1,609First Data operating income 1 — — — 1,088Combined operating income 516 478 1,852 2,697Combined adjustments:
Merger and integration costs 254 148 902 467Severance and restructuring costs 16 75 108 150Amortization of acquisition-related intangible assets 501 533 2,024 1,222Merchant Services adjustment 3 — (61) (59) (230)Gain on sale of businesses — (5) (464) (12)
Adjusted operating income $ 1,287 $ 1,168 $ 4,363 $ 4,294
Operating margin 13.5 % 11.8 % 12.5 % 15.8 %Adjusted operating margin 35.6 % 31.4 % 31.4 % 29.7 %
$ in millions. Operating margin percentages are calculated using actual, unrounded amounts.See page 11 for information regarding non-GAAP financial measures.

© 2021 Fiserv, Inc. or its affiliates. FORTUNE Magazine World's Most Admired Companies ®
2014 | 2015 | 2016 | 2017 | 2018 | 2019 | 2020 | 2021
Adjusted Revenue and Adjusted Operating Income (cont.)
1 Represents the financial results of First Data prior to the date of acquisition. For the year ended December 31, 2019, this includes the results of First Data from January 1, 2019 through July 28, 2019.
2 Represents the elimination of intercompany revenue and expense between First Data and the company.3 Represents an adjustment primarily related to the company's joint venture with Bank of America. The Banc of America Merchant Services joint venture (BAMS) was
dissolved effective July 1, 2020. The company owned 51% of BAMS and, through June 30, 2020, BAMS' financial results were 100% consolidated into the company's financial statements for GAAP reporting purposes. In connection with the dissolution of the joint venture, the company received a 51% share of the joint venture's value via an agreed upon contractual separation. In addition, the company will continue providing merchant processing and related services to Bank of America for its merchant clients. The non-GAAP adjustment reduces adjusted revenue and adjusted operating income by the joint venture revenue and expense that was not expected to be retained by the company upon dissolution and is partially offset by an increase to processing and services revenue.
19

© 2021 Fiserv, Inc. or its affiliates. FORTUNE Magazine World's Most Admired Companies ®
2014 | 2015 | 2016 | 2017 | 2018 | 2019 | 2020 | 2021
Adjusted Revenue and Adjusted Operating Income by Segment
Acceptance Segment
4Q-20 4Q-19 2020 2019Revenue $ 1,444 $ 1,559 $ 5,522 $ 2,571First Data revenue 1 — — — 3,514Combined revenue 1,444 1,559 5,522 6,085Combined adjustments:
Deferred revenue purchase accounting adjustments — 2 6 4Merchant Services adjustment 2 — (97) (126) (387)
Adjusted revenue $ 1,444 $ 1,464 $ 5,402 $ 5,702Operating income $ 442 $ 468 $ 1,427 $ 764First Data operating income 1 — — — 1,026Combined operating income 442 468 1,427 1,790Combined adjustments:
Merger and integration costs 1 2 6 4Merchant Services adjustment 2 — (61) (59) (230)
Adjusted operating income $ 443 $ 409 $ 1,374 $ 1,564Operating margin 30.7 % 30.1 % 25.9 % 29.7 %Adjusted operating margin 30.7 % 27.9 % 25.4 % 27.4 %
$ in millions. Operating margin percentages are calculated using actual, unrounded amounts.See page 11 for information regarding non-GAAP financial measures.1 Represents the financial results of First Data prior to the date of acquisition. For the year ended December 31, 2019, this includes the results of First Data from January 1,
2019 through July 28, 2019. 2 Represents an adjustment primarily related to the company's joint venture with Bank of America. The Banc of America Merchant Services joint venture (BAMS) was dissolved
effective July 1, 2020. The company owned 51% of BAMS and, through June 30, 2020, BAMS' financial results were 100% consolidated into the company's financial statements for GAAP reporting purposes. In connection with the dissolution of the joint venture, the company received a 51% share of the joint venture's value via an agreed upon contractual separation. In addition, the company will continue providing merchant processing and related services to Bank of America for its merchant clients. The non-GAAP adjustment reduces adjusted revenue and adjusted operating income by the joint venture revenue and expense that was not expected to be retained by the company upon dissolution and is partially offset by an increase to processing and services revenue.
20

© 2021 Fiserv, Inc. or its affiliates. FORTUNE Magazine World's Most Admired Companies ®
2014 | 2015 | 2016 | 2017 | 2018 | 2019 | 2020 | 202121
Fintech Segment
4Q-20 4Q-19 2020 2019
Revenue $ 742 $ 751 $ 2,901 $ 2,942
Operating income $ 271 $ 238 $ 992 $ 885
Operating margin 36.5 % 31.6 % 34.2 % 30.1 %
$ in millions. Operating margin percentages are calculated using actual, unrounded amounts.
For all periods presented in the Fintech Segment, there were no adjustments to GAAP measures presented and thus the adjusted measures are equal to the GAAP measures presented.
See page 11 for information regarding non-GAAP financial measures.
Adjusted Revenue and Adjusted Operating Income by Segment

© 2021 Fiserv, Inc. or its affiliates. FORTUNE Magazine World's Most Admired Companies ®
2014 | 2015 | 2016 | 2017 | 2018 | 2019 | 2020 | 2021
Adjusted Revenue and Adjusted Operating Income by Segment
22
Payments Segment
4Q-20 4Q-19 2020 2019Revenue $ 1,411 $ 1,443 $ 5,504 $ 3,909First Data revenue 1 — — — 1,688Combined revenue 1,411 1,443 5,504 5,597Combined adjustments:Intercompany eliminations 2 — — — (4)Deferred revenue purchase accounting adjustments 12 10 40 14
Adjusted revenue $ 1,423 $ 1,453 $ 5,544 $ 5,607
Operating income $ 649 $ 620 $ 2,361 $ 1,658First Data operating income 1 — — — 600Combined operating income 649 620 2,361 2,258Combined adjustments: Merger and integration costs 11 10 40 14
Adjusted operating income $ 660 $ 630 $ 2,401 $ 2,272
Operating margin 46.0 % 43.0 % 42.9 % 42.4 %Adjusted operating margin 46.4 % 43.4 % 43.3 % 40.5 %
$ in millions. Operating margin percentages are calculated using actual, unrounded amounts.
See page 11 for information regarding non-GAAP financial measures.1 Represents the financial results of First Data prior to the date of acquisition. For the year ended December 31, 2019, this includes the results of First Data from January 1,
2019 through July 28, 2019. 2 Represents the elimination of intercompany revenue and expense between First Data and the company.

© 2021 Fiserv, Inc. or its affiliates. FORTUNE Magazine World's Most Admired Companies ®
2014 | 2015 | 2016 | 2017 | 2018 | 2019 | 2020 | 202123
Total Amortization 1Three Months Ended
December 31,Year Ended
December 31,2020 2019 2020 2019
Acquisition-related intangible assets $ 530 $ 560 $ 2,133 $ 1,036Capitalized software and other intangibles 42 43 161 160Purchased software 57 46 269 103Financing costs, debt discounts and other 11 11 47 127Sales commissions 23 22 90 83Deferred conversion costs 12 6 34 22
Total amortization $ 675 $ 688 $ 2,734 $ 1,531
First Data acquisition-related intangible assets $ — $ — $ — $ 233First Data capitalized software and other intangibles — — — 62First Data purchased software — — — 72First Data financing costs, debt discounts and other — — — 7First Data sales commissions — — — —First Data deferred conversion costs — — — 22
Total First Data amortization 2 $ — $ — $ — $ 396
Combined acquisition-related intangible assets $ 530 $ 560 $ 2,133 $ 1,269Combined capitalized software and other intangibles 42 43 161 222Combined purchased software 57 46 269 175Combined financing costs, debt discounts and other 11 11 47 134Combined sales commissions 23 22 90 83Combined deferred conversion costs 12 6 34 44
Total combined amortization $ 675 $ 688 $ 2,734 $ 1,927
Additional Information – Amortization Expense
$ in millions.
1 The company adjusts its non-GAAP results to exclude amortization of acquisition-related intangible assets as such amounts are inconsistent in amount and frequency and are significantly impacted by the timing and/or size of acquisitions (see corresponding adjustment on pages 13-16). The adjustment for acquired First Data software/technology excludes only the incremental amortization related to the fair value purchase accounting allocation. Management believes that the adjustment of acquisition-related intangible asset amortization supplements the GAAP information with a measure that can be used to assess the comparability of operating performance. Although the company excludes amortization from acquisition-related intangible assets from its unaudited non-GAAP expenses, management believes that it is important for investors to understand that such intangible assets were recorded as part of purchase accounting and contribute to revenue generation. Amortization of intangible assets that relate to past acquisitions will recur in future periods until such intangible assets have been fully amortized. Any future acquisitions may result in the amortization of additional intangible assets.
2 Represents the financial results of First Data prior to the date of acquisition. For the year ended December 31, 2019, this includes the results of First Data from January 1, 2019 through July 28, 2019.