fourth quarter & full year 2020 results - pae
TRANSCRIPT

Fourth Quarter & Full Year 2020 ResultsMarch 11, 2021

FORWARD-LOOKING STATEMENTS AND NON-GAAP FINANCIAL MEASURES
2 |
This presentation may contain a number of “forward-looking statements” as defined in the Private Securities Litigation Reform Act of 1995. These forward-looking statements include, but are not limited to, statements about PAE’s possible or assumed future results of operations, financial results, business strategies, debt levels, competitive position, industry environment, potential growth opportunities, potential impact of COVID-19, effects of regulation, backlog, estimation of resources for contracts, risks related to IDIQ contracts, strategy for and management of growth, needs for additional capital, risks related to U.S. government contracting generally, including congressional approval of appropriations, risks related to integrating acquisitions, including the acquisitions of CENTRA Technology, Inc. and Metis Solutions Corporation, and bid protests. These forward-looking statements are based on PAE’s management’s current expectations, estimates, projections and beliefs, as well as a number of assumptions concerning future events. When used in this presentation, the words “estimates,” “projected,” “expects,” “anticipates,” “forecasts,” “plans,” “intends,” “believes,” “seeks,” “may,” “will,” “should,” “future,” “propose” and variations of these words or similar expressions (or the negative versions of such words or expressions) are intended to identify forward-looking statements.
These forward-looking statements are not guarantees of future performance, conditions or results, and involve a number of known and unknown risks, uncertainties, assumptions and other important factors, many of which are outside PAE’s management’s control, that could cause actual results to differ materially from the results discussed in the forward-looking statements.
Forward-looking statements included in this presentation speak only as of the date of this presentation. PAE does not undertake any obligation to update its forward-looking statements to reflect events or circumstances after the date of this presentation except as may be required by the federal securities laws.
This presentation contains non-GAAP financial measures. For more information about our use of non-GAAP financial measures see the appendix.
In this presentation, unless the context indicates otherwise, the terms “PAE”, “company, “we”, “our” and the “Company” refer to PAE Incorporated and its consolidated subsidiaries taken as a whole. Unless otherwise noted, the source for figures is PAE management.
PAE PROPRIETARY

3 | 3 | 3 |
Providing mission critical operational services to solve the complex challenges of our customers
Strong Execution in the fourth quarter• Record PAE standalone revenue• PAE standalone Adjusted EBITDA exceeded
expectations• Key contract wins (GSS, MEGA V)
Integration of CENTRA and Metis is on track
Strong financial performance against revised guidance• Free Cash Flow negatively impacted by ~$15 million
of Accounts Receivable collected in January
1 Adjusted EBITDA and Adjusted EBITDA margin are non-GAAP financial measures. For a reconciliation of these non-GAAP financial measures, see the appendix.
2 Free Cash Flow defined as Cash Flow provided by operating activities less capital expenditures (“Capex”).
Q4 2020 REVENUE
$788 million; PAE standalone = $749 million
Q4 ADJUSTED EBITDA 1
$44 million (5.6% margin); PAE standalone - $41 million (5.5% margin) 1
SOLID BACKLOG
$7.9 billion; PAE standalone = $6.8 billion
FOCUSED ON STRENGTHENING THE BALANCE SHEET
Delivered $97 million of Free Cash Flow 2
NEGLIGIBLE IMPACT FROM COVID-19 ON PROFITABILITY
CLOSED CENTRA AND METIS ACQUISITIONS
Q4 & FULL-YEAR 2020 KEY HIGHLIGHTS
FY 2020 Actuals
PAE Standalone
Pre-acquisitions
Revised Fiscal
2020 Guidance
(issued November 5, 2020)
Revenue $2,675M $2,625M – $2,675M
Adjusted EBITDA 1 $178M $172M – $178M
Free Cash Flow 2 $97M At least $110M

4 |
$3.9M
CENTRA & METIS INTEGRATION EFFORTS ARE ON TRACKPrioritized customer facing integration efforts including joint pipeline and revenue synergy identification
Source: PAE management
COST SYNERGIES
FY21 expected net
cost synergies
Full Run-Rate expected
net cost synergies
Customer
Facing
1Q21
Backoffice
2Q21
Supply
Chain/Real
Estate
4Q21
1Q21 2Q21 3Q21 4Q21 1Q22 2Q224Q20
4 |
$6.9M

DELIVERING MISSION ESSENTIAL MANAGED SOLUTIONS TO THE CUSTOMER
5 | CAPABILITIES
Infrastructure & Engineering
Mission Readiness
BusinessSolutions
Test and Training
Intelligence &Technology Services
CAPABILITIES
2013 2021 AND BEYOND
Strategic Focus: Operations and Maintenance
Geography: OCONUS; Middle East focus
Contract Mix: Cost Plus
Customer Diversification: Dept of State, DoD
Contract Diversification: Largest Contract >10%
IDIQ Portfolio: Contracts 3-5
Workforce: Technical Services
Modernize
Global and 63% U.S. focused
Fixed Price, T&M and Cost Plus
DoD 30%, Intel 20% and FedCiv 50%
No Contract > than 7%
IDIQ Portfolio: Contracts 100+
Workforce: Subject Matter Expertise, Highly Trained Workforce
2013 MARGIN PROFILE
4.5%
2021 MARGIN PROFILE
6.8%
8.0%
LONG-TERM TARGET
Source: PAE management

STRATEGIC GROWTH AREASProtect, Extend, Expand & Grow
Source: PAE Management1 Based on the company’s FY 2020 financial results and adjusted Pro Forma for CENTRA and Metis revenue2 Based on the company’s FY 2021 plan
STRATEGICFOCUS
INFRASTUCTURE & ENGINEERING
MISSION READINESS
TEST & TRAINING SOLUTIONS
BUSINESS SOLUTIONS
INTELLIGENCE & TECHNOLOGY SERVICES
27%
29%
13%
15%
16%
FY20 PF REVENUE MIX % 1
PROTECT & EXTEND
EXPAND & GROW
FY21 Est. REVENUE MIX % 2
FY21 Est. REVENUE MIX % 2
25%
25% 17%
12%
21%
6 |
Global, full-spectrum
infrastructure operations
and engineering
Logistics and platform
readiness support
service
Data processing,
litigation services,
and other business
services for “citizen-
based” customers Training services, test and
range operations,
international development
services
Intelligence analysis and
operations, mission
technology services
PROTECT & EXTEND
EXPAND & GROW
EXPAND & GROW
TARGET MARKET
TARGET MARKET
FY20 PF REVENUE MIX % 1
Margin Profile % 2
Margin Profile % 2
6% - 8%
50% of Total
FY21 Revenue
Source: PAE management

$4.1 $4.6 $4.6$5.4
$1.5$1.5 $1.8
$1.4
$1.1
2017 2018 2019 2020
Global Mission Services National Security Solutions
CENTRA + Metis
BACKLOG AND BOOK TO BILL
TOTAL BACKLOG ($billions) TTM BOOK-TO-BILL RATIO
7 |
Robust backlog supports long-term visibility into recurring and growing revenue base
$5.6$6.1
$6.41.3x
1.4x
1.0x1.1x
0.9x 1.0x1.1x
1.2x
Q1 19 Q2 19 Q3 19 Q4 19 Q1 20 Q2 20 Q3 20 Q4 20
$7.9

8 |
PAE PIPELINEPOSITIONED TO CONTINUE CAPITALIZING ON ATTRACTIVE GROWTH PROSPECTS
Robust Pipeline of Opportunities
$39BQUALIFIED PIPELINE 1
$17BPROPOSAL PLANNING
$11BPROPOSAL DEVELOPMENT
$7B 2
EVALUATION
December 2020
KEY METRICS Qualified Pipeline - $39B 1
Pending Awards @ 12/31/2020 - $7B 2
In Proposal - $1B
Backlog @ 12/31/2020 - $7.9B
2020 Win Rates:New Business: 35%Recompete: 93%
1 Includes CENTRA and Metis 2 Includes $1.3 billion CBP award that was awarded to a PAE competitor on January 28, 2021

9%
20%
10%
4%
8%
11%
11%
8%
19%
9 |
STABILITYDIVERSIICATION FINANCIALPRECISION
DIVERSE BUSINESS PORTFOLIOCREATES A UNIQUE COMPETITIVE ADVANTAGE
CUSTOMER BREAKOUT (% of 2021 plan revenue)
20%
9%
GEOGRAPHIC DIVERSITY (% of 2021 plan revenue)
63%U.S.
37%INTERNATIONAL
CONTRACT DIVERSITY (% of 2021 plan revenue)
Source: PAE management; based on 2021 revenue
1 Intelligence includes national intelligence as well as INSCOM, SOCOM, DIA, DTRA and others 2 Other includes NOAA, USPS, Commercial and others
61%
2%3%3%
3%4%
4%
4%
4%
5%
7%
40+ Years DOS
AIR FORCE
ARMY
15+ Years DHS
NAVY
40+ Year DOJ
35+ Years NASA
50+ Years INTELLIGENCE 1
OTHER 2
DoD Combined 60+ Years
ALL OTHER CONTRACTS

-$13.2
$7.5
$107.2$97.0
4Q20 FY 2019 FY 2020
Fourth-quarter and full year revenue at the high end of expectations, driven by increases in contract volume, new business and COVID-19 relief opportunities, partially offset by the negative impact of COVID-19
Fourth-quarter and full year Adjusted EBITDA at high end of expectations, driven primarily by improved program performance
Fourth-quarter Free Cash Flow negatively impacted by $15 million in receivables collected in January 2021; FY2021 guidance reflects this shift
FOURTH-QUARTER AND FULL YEAR 2020 FINANCIAL HIGHLIGHTS
10 |
Amidst a challenging environment, PAE delivered strong revenue and adjusted EBITDA margins
1 Free Cash Flow defined as Cash Flow provided by operating activities less Capex
Revenue (in millions)
PAE CENTRA + Metis
Adjusted EBITDA (in millions)
$177.7
Free Cash Flow 1 (in millions)
$697.1 $748.6
$2,763.9 $2,675.4
$39.2
$39.2
4Q19 4Q20 FY 2019 FY 2020
$787.8
$2,714.6
PAE CENTRA + Metis
$37.5 $41.3
$166.7 $177.6
$2.7
$2.7
4Q19 4Q20 FY 2019 FY 2020
$44.0
$180.2
4Q19 4Q20 FY 2019 FY 2020

11 |
$33.5 $28.2
$126.1 $128.7
4Q19 4Q20 FY 2019 FY 2020
$533.6 $593.8
$2,099.7 $2,080.5
4Q19 4Q20 FY 2019 FY 2020
$3.9
$13.1
$40.6
$48.9
$2.7
$2.7
4Q19 4Q20 FY 2019 FY 2020
$163.5 $154.8
$664.2$594.9
$39.2
$39.2
4Q19 4Q20 FY 2019 FY 2020
Global Mission Services
Strong fourth quarter revenue driven by an approximate $116 million increase in contract volume, partially offset by about $56 million of COVID-19 impacts
Full Year revenue was only down $19 million, despite a $147 million impact from COVID-19, driven by increases in contract volume, new business and COVID relief opportunities
Full Year Adjusted operating income margin of 6.2% driven by strong program performance
National Security Solutions
Fourth quarter pre-acquisition revenue impacted by ~$7 million from COVID-19 and a $2 million decrease from small business set aside recompete losses, net of new business
Full Year pre-acquisition revenue impacted by a $40 million COVID-19 impact and a $29 million decrease from small business set aside recompete losses, net of new business. Excluding these contract losses, revenue grew 13 percent organically year over year. 2
Strong fourth quarter and full year Adjusted operating income margin expansion driven by improved program performance
FOURTH-QUARTER & FULL-YEAR 2020 BUSINESS SEGMENT HIGHLIGHTS
1 GMS adjusted operating income and NSS adjusted operating income are non-GAAP financial measures. For a reconciliation of these non-GAAP financial measures, see the appendix2 NSS lost three small business set-aside contracts in the fourth quarter of 2019 and decided to not bid on a fourth contract in 2020 due to its low margins. Excluding these four contracts which represented $157 million in 2019 revenue, NSS grew
13 percent organically year over year
Revenue (in millions) Adj. Operating Income (in millions) 1 Revenue (in millions) Adj. Operating Income (in millions) 1
$15.7
$51.6$634.2
$194.0
PAE CENTRA + MetisPAE CENTRA + Metis

Guidance contemplates COVID-19 impact through 1H 2021; consistent financial impact with 2H 2020
Mid-Point Adjusted EBITDA margin (6.8%) is 20 basis point improvement over FY20 actuals.
CENTRA and Metis cost synergies of $3.9M included in Adjusted EBITDA guidance (at the mid-point)
Cash flow guidance includes approximate $18.5M repayment of deferred payroll taxes (FY20 CARES Act benefit).
1 The company is not providing a quantitative reconciliation of adjusted EBITDA in reliance on the “unreasonable efforts” exception for forward-looking non-GAAP measures set forth in SEC rules because certain financial information, the probable significance of which cannot be determined, is not available and cannot be reasonably estimated without unreasonable effort and expense. In this regard, the company does not provide a reconciliation of forward-looking adjusted EBITDA to GAAP net income, due to the inherent difficulty in forecasting and quantifying certain amounts that are necessary for such reconciliation. Because certain deductions for non-GAAP exclusions used to calculate projected net income may vary significantly based on actual events, the company is not able to forecast on a GAAP basis with reasonable certainty all deductions needed in order to provide a GAAP calculation of projected net income at this time. The amounts of these deductions may be material and, therefore, could result in projected GAAP net income being materially less than is indicated by estimated adjusted EBITDA and pro forma adjusted EBITDA.
2021 FINANCIAL GUIDANCE
12 |
Fiscal 2021 Guidance 1
Revenue $3,050M – $3,150M
Adjusted EBITDA 1 $205M – $215M
Cash Flow from
OperationsAt least $120M

Strong cash flow performance in FY20 driven by growth in Adjusted EBITDA, debt structure and CARES Act payroll tax benefit
In FY21, the company will repay 50% of CARES Act payroll tax benefit
Assuming neutral working capital in FY21; shift of receivables from December 2020 to January 2021 partially offset by organic growth driving higher Accounts Receivable
1 The company is not providing a quantitative reconciliation of adjusted EBITDA in reliance on the “unreasonable efforts” exception for forward-looking non-GAAP measures set forth in SEC rules because certain financial information, the probable significance of which cannot be determined, is not available and cannot be reasonably estimated without unreasonable effort and expense. In this regard, the company does not provide a reconciliation of forward-looking adjusted EBITDA to GAAP net income, due to the inherent difficulty in forecasting and quantifying certain amounts that are necessary for such reconciliation. Because certain deductions for non-GAAP exclusions used to calculate projected net income may vary significantly based on actual events, the company is not able to forecast on a GAAP basis with reasonable certainty all deductions needed in order to provide a GAAP calculation of projected net income at this time. The amounts of these deductions may be material and, therefore, could result in projected GAAP net income being materially less than is indicated by estimated adjusted EBITDA and pro forma adjusted EBITDA.
Cash Flow Overview
13 |
2019A 2020A 2021E
Adjusted EBITDA 1 $167 180 210
M&A & Integration Expenses (13) (27) (7)
Cash Interest (78) (45) (48)
Cash Taxes (10) (11) (17)
Deferred Payroll Taxes - 37 (19)
Other Working Capital & cash
expenses51 (33) 1
Cash Flow from Ops 117 101 120
Capex (9) (4) (5)
Free Cash Flow 1 107 97 115

14 |
PAE’s successful debt refinancing enabled CENTRA and Metis acquisitions
CAPITALIZATION 12/31/2020 1 12/31/2021 Est. COMMENTS
1st Term Loan $890 $881October 2027 Maturity; LIBOR2 + 450
bps; $9 million mandatory debt amortization
Net Debt $804 $689
FY20 Pro Forma Adjusted EBITDA 3 $200 $210 FY21 mid-point guidance
Net Debt / Pro Forma Adjusted EBITDA 3,4 4.0x 3.3x
1 In millions2 LIBOR is .75%3 12/31/20 based on FY2020 PAE standalone financial results plus Pro Forma CENTRA and Metis results4 Adjusting for accounts receivable delay, FY20 Pro Forma net leverage ratio would be 3.9xNote: Company does not expect to have any borrowings on its senior secured revolver at year-end 2021; the revolver is priced at LIBOR + 175 to 225 bps
PAE PRO FORMA CAPITAL STRUCTURE

2021 fully diluted share count of approximately 93.5 million shares1 (average for the year)
Effective tax rate of approximately 24% including State taxes; approximately $17M in 2021 total cash taxes
Full-year 2021 depreciation and amortization expected to be approximately $57 million
Full-year 2021 cash interest payments expected to be about $48 million
Full-year 2021 Capex expected to be about $5 million
1 Basic share count excludes warrants, earn-out shares and unvested management incentive shares
ADDITIONAL 2021 GUIDANCE ASSUMPTIONS
15 |

16 |
Well-established platform and
brand with a 65+ year history of
success
End-markets provide resiliency
and stability largely immune to business
distribution
Significant customer and contract
diversification creates a unique competitive
advantage
Strong financial profile, delivering acquisition
capacity and rapid deleveraging
History of delivering exceptional
performance and garnering high
customer satisfaction ratings
Growth story driven by strategic
transformation and M&A execution
THIS IS PAE DIVERSIFICATION STABILITY
INVESTMENT HIGHLIGHTS
GROWTH PRECISION FINANCIAL

Appendix
18 |
NON-GAAP FINANCIAL MEASURES
The Company uses EBITDA, adjusted EBITDA, adjusted EBITDA margin, adjusted operating income per segment and adjusted operating income margin per segment as
supplemental non-GAAP measures of performance. PAE defines EBITDA as net income excluding (i) interest expense, (ii) provision for or benefit from income taxes and (iii)
depreciation and amortization. Adjusted EBITDA and adjusted operating income per segment exclude certain amounts included in EBITDA as provided in the reconciliations
provided herein. Adjusted EBITDA is equal to the sum of adjusted operating income for each segment. Adjusted EBITDA margin is calculated as adjusted EBITDA divided by
revenues expressed as a percentage and adjusted operating income margin is calculated as adjusted operating income divided by revenues expressed as a percentage.
For 2020 and 2019, the Company’s net income was impacted by certain events, as described in the footnotes to the reconciliation tables, that do not reflect the cost of our
operations and which may affect the period-over-period assessment of operating results. The non-GAAP financial measures demonstrate the impact of these events.
During 2019 substantially all the assets of PAE ISR LLC (“ISR”) were sold. The Company believes that it is helpful for investors to be able to evaluate the performance of PAE’s
underlying business based on excluding ISR’s operations during the year. To calculate the loss, adjusted EBITDA and adjusted operating income without ISR, the Company
removed ISR from its revenue and loss metrics for the fourth quarter and full year of 2019.
These non-GAAP measures of performance are used by management to conduct and evaluate its business during its regular review of operating results for the periods
presented. Management and the Company’s Board utilize these non-GAAP measures to make decisions about the use of the Company’s resources, analyze performance
between periods, develop internal projections and measure management performance. PAE believes these non-GAAP measures are useful to investors in evaluating the
Company’s ongoing operating and financial results and understanding how such results compare with the Company’s historical performance.
In addition to the above non-GAAP financial measures, the Company has included backlog, net bookings, and book-to-bill ratio in this presentation. Backlog is an operational
measure representing the estimated amount of future revenues to be recognized under negotiated contracts and task orders as work is performed and excludes contract awards
which have been protested by competitors until the protest is resolved in our favor. Net bookings are an operational measure representing the change in backlog between
reporting periods plus reported revenue for the period and book-to-bill ratio is an operational measure representing net bookings divided by reported revenues for the same
period. We believe backlog, net bookings and book-to-bill ratio are useful metrics for investors because they are an important measure of business development performance
and revenue growth. These metrics are used by management to conduct and evaluate its business during its regular review of operating results for the periods presented.
19 |
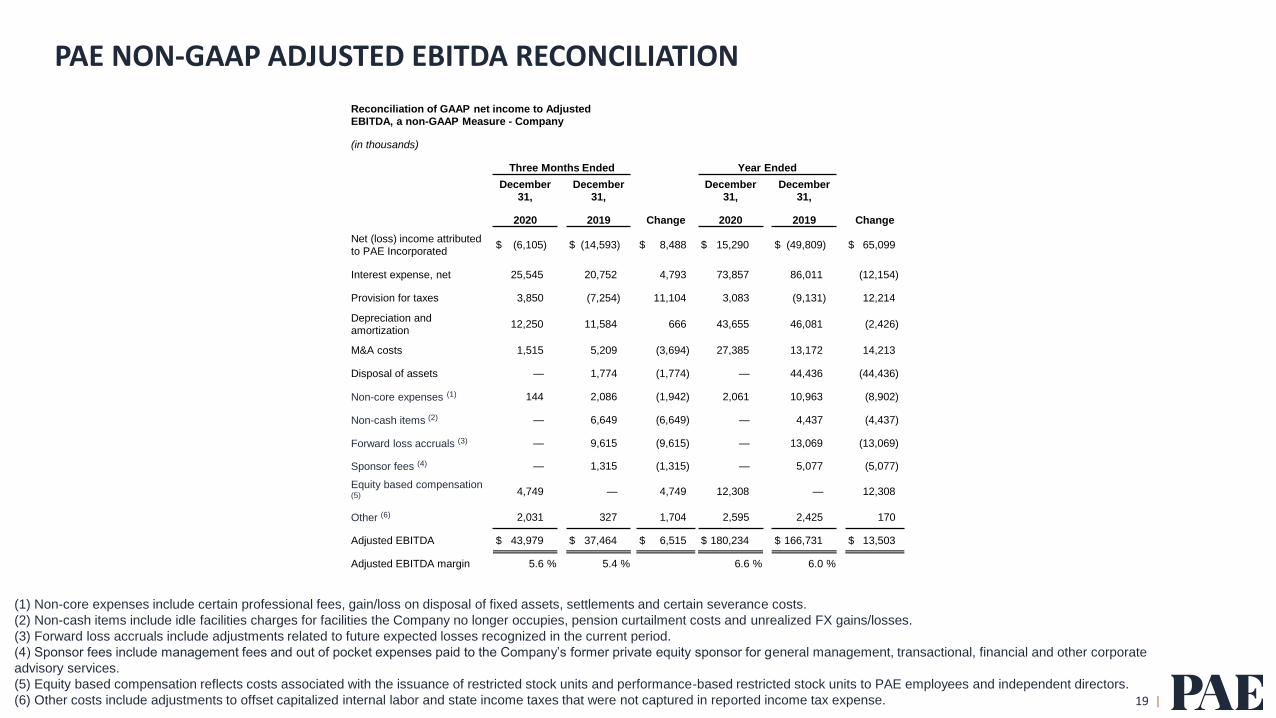
PAE NON-GAAP ADJUSTED EBITDA RECONCILIATION
(1) Non-core expenses include certain professional fees, gain/loss on disposal of fixed assets, settlements and certain severance costs.
(2) Non-cash items include idle facilities charges for facilities the Company no longer occupies, pension curtailment costs and unrealized FX gains/losses.
(3) Forward loss accruals include adjustments related to future expected losses recognized in the current period.
(4) Sponsor fees include management fees and out of pocket expenses paid to the Company’s former private equity sponsor for general management, transactional, financial and other corporate
advisory services.
(5) Equity based compensation reflects costs associated with the issuance of restricted stock units and performance-based restricted stock units to PAE employees and independent directors.
(6) Other costs include adjustments to offset capitalized internal labor and state income taxes that were not captured in reported income tax expense.
Reconciliation of GAAP net income to Adjusted EBITDA, a non-GAAP Measure - Company
(in thousands)
Three Months Ended Year Ended
December 31,
December 31,
December 31,
December 31,
2020 2019 Change 2020 2019 Change
Net (loss) income attributed to PAE Incorporated
$ (6,105) $ (14,593) $ 8,488 $ 15,290 $ (49,809) $ 65,099
Interest expense, net 25,545 20,752 4,793 73,857 86,011 (12,154)
Provision for taxes 3,850 (7,254) 11,104 3,083 (9,131) 12,214
Depreciation and amortization
12,250 11,584 666 43,655 46,081 (2,426)
M&A costs 1,515 5,209 (3,694) 27,385 13,172 14,213
Disposal of assets — 1,774 (1,774) — 44,436 (44,436)
Non-core expenses (1) 144 2,086 (1,942) 2,061 10,963 (8,902)
Non-cash items (2) — 6,649 (6,649) — 4,437 (4,437)
Forward loss accruals (3) — 9,615 (9,615) — 13,069 (13,069)
Sponsor fees (4) — 1,315 (1,315) — 5,077 (5,077)
Equity based compensation (5) 4,749 — 4,749 12,308 — 12,308
Other (6) 2,031 327 1,704 2,595 2,425 170
Adjusted EBITDA $ 43,979 $ 37,464 $ 6,515 $ 180,234 $ 166,731 $ 13,503
Adjusted EBITDA margin 5.6 % 5.4 % 6.6 % 6.0 %

20 |
REPORTABLE SEGMENTS NON-GAAP ADJUSTED OPERATING INCOME RECONCILIATION
(1) Non-core expenses include certain professional fees, gain/loss on disposal of fixed assets, settlements and certain severance costs.
(2) Non-cash items include idle facilities charges for facilities the Company no longer occupies, pension curtailment costs and unrealized FX gains/losses.
(3) Forward loss accruals include adjustments related to future expected losses recognized in the current period.
(4) Sponsor fees include management fees and out of pocket expenses paid to the Company’s former private equity sponsor for general management, transactional, financial and other corporate
advisory services.
(5) Equity based compensation reflects costs associated with the issuance of restricted stock units and performance-based restricted stock units to PAE employees and independent directors.
(6) Other costs include adjustments to offset capitalized internal labor and state income taxes that were not captured in reported income tax expense.
(7) Corporate operating loss allocation includes certain selling, general and administrative, depreciation and amortization costs that cannot be assigned to a specific segment; this cost is
allocated based on proportionate segment revenues for the period in which the cost is incurred.
Reconciliation of GAAP operating income to
adjusted operating income, a non-GAAP Measure - GMS
(in thousands)
Three Months Ended Year Ended
December
31,
December
31,
December
31,
December
31,
2020 2019 Change 2020 2019 Change
Operating income $ 4,549 $ 15,407 $ (10,858) $ 80,090 $ 92,386 $ (12,296)
Corp operating loss allocation (7) 8,765 (3,709) 12,474 (8,891) (21,746) 12,855
Corporate NCI allocation 2,739 1,973 766 1,241 (51) 1,292
Depreciation and amortization 5,846 6,847 (1,001) 23,934 26,934 (3,000)
M&A costs 1,126 3,987 (2,861) 19,073 10,004 9,069
Disposal of assets — — — — — —
Non-core expenses (1) 109 108 1 1,606 5,371 (3,765)
Non-cash items (2) — 2,262 (2,262) — 3,153 (3,153)
Forward loss accruals (3) — 5,384 (5,384) — 4,349 (4,349)
Sponsor fees (4) — 1,007 (1,007) — 3,857 (3,857)
Equity based compensation (5) 3,580 — 3,580 9,517 — 9,517
Other (6) 1,520 250 1,270 2,093 1,842 251
Adjusted operating income $ 28,234 $ 33,516 $ (5,282) $ 128,663 $ 126,099 $ 2,564
Adjusted operating income margin 4.8% 6.3% 6.2% 6.0%

21 |
REPORTABLE SEGMENTS NON-GAAP ADJUSTED OPERATING INCOME RECONCILIATION
(1) Non-core expenses include certain professional fees, gain/loss on disposal of fixed assets, settlements and certain severance costs.
(2) Non-cash items include idle facilities charges for facilities the Company no longer occupies, pension curtailment costs and unrealized FX gains/losses.
(3) Forward loss accruals include adjustments related to future expected losses recognized in the current period.
(4) Sponsor fees include management fees and out of pocket expenses paid to the Company’s former private equity sponsor for general management, transactional, financial and other corporate
advisory services.
(5) Equity based compensation reflects costs associated with the issuance of restricted stock units and performance-based restricted stock units to PAE employees and independent directors.
(6) Other costs include adjustments to offset capitalized internal labor and state income taxes that were not captured in reported income tax expense.
(7) Corporate operating loss allocation includes certain selling, general and administrative, depreciation and amortization costs that cannot be assigned to a specific segment; this cost is
allocated based on proportionate segment revenues for the period in which the cost is incurred.
Reconciliation of GAAP operating income to adjusted operating
income, a non-GAAP Measure - NSS
(in thousands)
Three Months Ended Year Ended
Decembe
r 31,
Decembe
r 31,
Decembe
r 31,
Decembe
r 31,
2020 2019 Change 2020 2019 Change
Operating income (loss) $ 4,303 $ (13,729) $ 18,032 $ 22,073 $ (36,940) $ 59,013
Corp operating loss allocation (7) 2,864 (1,136) 4,000 (2,506) (6,879) 4,373
Corporate NCI allocation 69 94 (25) 223 304 (81)
Depreciation and amortization 6,404 4,738 1,666 19,721 19,146 575
M&A costs 390 1,222 (832) 8,312 3,164 5,148
Disposal of assets — 1,774 (1,774) — 44,436 (44,436)
Non-core expenses (1) 35 1,978 (1,943) 455 5,592 (5,137)
Non-cash items (2) — 4,389 (4,389) — 1,283 (1,283)
Forward loss accruals (3) — 4,232 (4,232) — 8,721 (8,721)
Sponsor fees (4) — 308 (308) — 1,220 (1,220)
Equity based compensation (5) 1,169 — 1,169 2,791 — 2,791
Other (6) 512 77 435 501 583 (82)
Adjusted operating income $ 15,746 $ 3,947 $ 11,799 $ 51,570 $ 40,630 $ 10,940
Adjusted operating income
margin8.1% 2.4% 8.1% 6.1%