2020 fourth quarter and full year results
TRANSCRIPT
2020 Fourth Quarter and
Full Year Results
February 25, 2021

2
Safe Harbor Statement
Forward Looking Language
Certain statements in this presentation constitute “forward-looking statements” within the meaning of the Private Securities Litigation Reform Act of 1995. Such forward-looking statements
involve known and unknown risks, uncertainties and other factors which may cause the actual results, performance or achievements of Clear Channel Outdoor Holdings, Inc. to be materially
different from any future results, performance or achievements expressed or implied by such forward-looking statements. The words or phrases “guidance,” “believe,” “expect,” “anticipate,”
“estimates,” “forecast” and similar words or expressions are intended to identify such forward-looking statements. In addition, any statements that refer to expectations or other characterizations
of future events or circumstances, such as statements about our guidance and outlook, our business plans, our strategies, our expectations about certain markets, our cost savings initiatives,
our bookings, our restructuring plans and our liquidity are forward-looking statements. These statements are not guarantees of future performance and are subject to certain risks, uncertainties
and other factors, some of which are beyond our control and are difficult to predict. Various risks that could cause future results to differ from those expressed by the forward-looking statements
included in this press release include, but are not limited to: the magnitude of the impact of the COVID-19 pandemic on our operations and on general economic conditions; weak or uncertain
global economic conditions and their impact on the level of expenditures on advertising; our ability to service our debt obligations and to fund our operations and capital expenditures; industry
conditions, including competition; our ability to obtain and renew key contracts with municipalities, transit authorities and private landlords; fluctuations in operating costs; technological changes
and innovations; shifts in population and other demographics; other general economic and political conditions in the U.S. and in other countries in which we currently do business, including
those resulting from recessions, political events and acts or threats of terrorism or military conflicts; changes in labor conditions and management; the impact of future dispositions, acquisitions
and other strategic transactions; our ability to execute restructuring plans; legislative or regulatory requirements; regulations and consumer concerns regarding privacy and data protection; a
breach of our information security measures; restrictions on outdoor advertising of certain products; fluctuations in exchange rates and currency values; risks of doing business in foreign
countries; third-party claims of intellectual property infringement, misappropriation or other violation against us or our suppliers; our dependence on our management team and other key
individuals; the risk that indemnities from iHeartMedia will not be sufficient to insure us against the full amount of certain liabilities; volatility of our stock price; the effects of Brexit on our
business; the impact of our substantial indebtedness, including the effect of our leverage on our financial position and earnings; the ability of our subsidiaries to dividend or distribute funds to us
in order for us to repay our debts; the restrictions contained in the agreements governing our indebtedness limiting our flexibility in operating our business; the effect of analyst or credit ratings
downgrades; our ability to continue to comply with the applicable listing standards of the New York Stock Exchange; our ability to fully realize the expected benefits of the Port Authority contract;
the risk that our historical financial information is not necessarily representative of the results we would have achieved as an independent public company and may not be a reliable indicator of
future results; the uncertainty relating to the LIBOR calculation process and potential phasing out of LIBOR after 2021; and certain other factors set forth in our other filings with the SEC. This
list of factors that may affect future performance and the accuracy of forward-looking statements is illustrative and is not intended to be exhaustive. You are cautioned not to place undue
reliance on these forward-looking statements, which speak only as of the date stated, or if no date is stated, as of the date of this presentation. Other key risks are described in the section
entitled "Item 1A. Risk Factors" of the Company’s reports filed with the U.S. Securities and Exchange Commission, including the Company's Annual Report on Form 10-K for the year ended
December 31, 2020. Except as otherwise stated in this presentation, the Company does not undertake any obligation to publicly update or revise any forward-looking statements because of
new information, future events or otherwise.
Non-GAAP Financial Measures
This presentation includes information that does not conform to U.S. generally accepted accounting principles ("GAAP"), including Adjusted EBITDA; Adjusted Corporate expenses; and
revenue, direct operating expenses, SG&A expenses and Adjusted EBITDA excluding movements in foreign exchange rates ("FX"). Since these non-GAAP financial measures are not
calculated in accordance with GAAP, they should not be considered in isolation of, or as a substitute for, the most directly comparable GAAP financial measures as an indicator of operating
performance or, in the case of Adjusted EBITDA, the Company's ability to fund its cash needs. In addition, these measures may not be comparable to similar measures provided by other
companies. This data should be read in conjunction with previously published Company reports on Forms 10-K, 10-Q and 8-K. These reports are available on the Investor Relations page of
investor.clearchannel.com. Reconciliations of consolidated net loss to Adjusted EBITDA and corporate expenses to Adjusted Corporate expenses are included at the end of this presentation.
This presentation should be read in conjunction with the 2020 earnings releases and Form 10-K filings of Clear Channel Outdoor Holdings, Inc., available at
investor.clearchannel.com.
Numbers may not sum due to rounding. Certain financial information shown in this presentation excludes the effects of foreign exchange rates, which are calculated by converting the current
period's amounts in local currency to U.S. dollars using average foreign exchange rates for the comparable prior period. In this presentation, Adjusted EBITDA is defined as consolidated net
income (loss), plus: income tax expense (benefit); all non-operating expenses (income), including other expense (income), net, loss on extinguishment of debt, loss on Due from
iHeartCommunications, and interest expense, net; other operating expense (income), net; impairment charges; depreciation and amortization; non-cash compensation expenses included within
corporate expenses; and restructuring and other costs included within operating expenses. Restructuring and other costs include costs associated with cost savings initiatives such as
severance, consulting and termination costs, and other special costs. In this presentation, Adjusted Corporate is defined as corporate expenses excluding restructuring and other costs and non-
cash compensation expense. See reconciliations of consolidated net loss to Adjusted EBITDA and corporate expenses to Adjusted Corporate expenses in the Appendix.

3

4
Key Financial Highlights
Q4 2020:
• Revenue: $541 million (down 27.4%, $204 million)
• Down 29.3% adjusting for FX
• Net Loss: $33 million (compared to net income of $32 million in Q4 2019)
• Adj. EBITDA: $101 million (down 51.1%, or $106 million)
• Down 52.1% adjusting for FX
Full Year 2020:
• Revenue: $1.9 billion (down 30.9%, or $829 million)
• Down 31.4% adjusting for FX
• Net Loss: $600 million (compared to net loss of $362 million in 2019)
• Adj. EBITDA: $120 million (down 80.8%, or $505 million)
• Down 82.0% adjusting for FX
Notes:
1. Comparisons are to the same period of 2019.
2. Certain financial information shown in this presentation excludes the effects of foreign exchange rates, which are calculated by converting the current period's amounts in
local currency to U.S. dollars using average foreign exchange rates for the comparable prior period.
3. In this presentation, Adjusted EBITDA is defined as consolidated net income (loss), plus: income tax expense (benefit); all non-operating expenses (income), including other
expense (income), net, loss on extinguishment of debt, loss on Due from iHeartCommunications, and interest expense, net; other operating expense (income), net;
impairment charges; depreciation and amortization; non-cash compensation expenses included within corporate expenses; and restructuring and other costs included within
operating expenses. See reconciliation of consolidated net loss to Adjusted EBITDA in the Appendix.

5
Financial Results: Americas
(USD, in millions) Three Months Ended December 31,
2020 2019 Variance3
Revenue $ 258 $ 345 (25.3)%
Direct operating expenses1 $ 118 $ 144 (17.7)%
SG&A expenses1 $ 48 $ 56 (14.6)%
Segment Adjusted EBITDA2 $ 94 $ 146 (35.4)%
1 Includes restructuring and other costs that are excluded from Segment Adjusted EBITDA.
2 Calculated as Revenue less Direct operating expenses and SG&A expenses, excluding restructuring and other costs.
3 Variance percentages are calculated based on actual amounts.
Fourth Quarter:
• Revenue: Down 25.3%, or $87 million
◦ Digital revenue down 29.6% to $83 million; digital revenue from billboards & street furniture down 15.4% to $71 million
◦ Revenue from print billboards, airport displays, other transit displays and wallscapes down
◦ National sales down 27.3%; local sales down 24.0%
• Direct operating and SG&A expenses (excluding D&A): Down 16.8%, or $34 million
• Lower site lease expenses related to lower revenue and renegotiated fixed lease expense
• Lower compensation costs from lower revenue and operating cost savings initiatives
◦ Lower direct production, maintenance and installation expenses driven by lower revenue and operating cost savings initiatives

6
Financial Results: Europe
(USD, in millions) Three Months Ended December 31,
Adjusted4
2020 2019 Variance3 2020 2019 Variance3
Revenue $ 268 $ 327 (17.9)% $ 252 $ 327 (23.0)%
Direct operating expenses1 $ 177 $ 205 (13.6)% $ 166 $ 205 (18.8)%
SG&A expenses1 $ 60 $ 63 (4.9)% $ 56 $ 63 (11.0)%
Segment Adjusted EBITDA2 $ 37 $ 65 (43.2)% $ 35 $ 65 (46.9)%
1 Includes restructuring and other costs that are excluded from Segment Adjusted EBITDA.
2 Calculated as Revenue less Direct operating expenses and SG&A expenses, excluding restructuring and other costs.
3 Variance percentages are calculated based on actual amounts.
4 Adjusted results exclude the impact of FX.
Fourth Quarter:
• Adjusted Revenue: Down 23.0%, or $75 million
• Digital revenue down 14.2% to $92 million; digital revenue, excluding movements in FX, down 18.8% to $87 million
• Adjusted Direct operating and SG&A expenses (excluding D&A): Down 17.0%, or $45 million
• Lower site lease expense related to lower revenue and renegotiated fixed lease expense
• Lower employee compensation expense from lower revenue, operating cost savings initiatives, and governmental support and wage
subsidies

7
Financial Results: Other
(USD, in millions) Three Months Ended December 31,
Adjusted4
2020 2019 Variance3 2020 2019 Variance3
Revenue $ 15 $ 73 (79.3)% $ 17 $ 73 (76.4)%
Direct operating expenses1 $ 10 $ 34 (70.1)% $ 12 $ 34 (66.1)%
SG&A expenses1 $ 5 $ 16 (69.4)% $ 5 $ 16 (65.2)%
Segment Adjusted EBITDA2 $ 1 $ 23 (97.5)% $ 1 $ 23 (96.7)%
1 Includes restructuring and other costs that are excluded from Segment Adjusted EBITDA.
2 Calculated as Revenue less Direct operating expenses and SG&A expenses, excluding restructuring and other costs.
3 Variance percentages are calculated based on actual amounts.
4 Adjusted results exclude the impact of FX.
Fourth Quarter:
• Adjusted Revenue: Down 76.4%, or $56 million
• We sold our Clear Media business on April 28, 2020
• Revenue from our Latin America business was $15 million and $26 million for the three months ended December 31, 2020 and 2019,
respectively
• Adjusted Direct operating and SG&A expenses (excluding D&A): Down 65.8%, or $33 million
• We sold our Clear Media business on April 28, 2020
• Direct operating and SG&A expenses from our Latin America business were $15 million and $19 million for the three months ended
December 31, 2020 and 2019, respectively

8
Capital Expenditures
(USD, in millions) Three Months Ended December 31, Years Ended December 31,
2020 2019 $ % 2020 2019 $ %
Americas $ 15 $ 36 $ (21) (58.3)% $ 56 $ 83 $ (26) (31.9)%
Europe 12 21 (9) (42.9)% 43 81 (37) (46.2)%
Other 1 33 (32) (96.9)% 12 55 (44) (78.7)%
Corporate 3 3 — (10.2)% 13 14 (1) (7.8)%
Total Capex $ 31 $ 93 $ (62) (66.7)% $ 124 $ 232 $ (108) (46.6)%
Note: Variances and variance percentages are calculated based on actual amounts. Due to rounding, totals may not equal the sum of the line items in the table above.
Key Drivers:
• Americas: Constructing and sustaining our billboards and other out-of-home advertising displays, including digital boards
• Europe: Constructing and sustaining our street furniture and other out-of-home advertising displays, including digital boards
• Other: Transit advertising structure additions and purchase of concession rights in China (prior to sale of Clear Media)
• Corporate: Build-out of IT infrastructure due to the Separation; equipment and software purchases

9
Selected Balance Sheet Information
(USD, in millions) 12/31/2020 12/31/2019 $ Change
Cash & Cash Equivalents(1) $ 785 $ 399 $ 386
Total Debt $ 5,572 $ 5,084 $ 488
Mandatorily-Redeemable Preferred Stock(2) $ — $ 45 $ (45)
(USD, in millions) Maturity 12/31/2020 12/31/2019 $ Change
Term Loan Facility(3) $ 1,975 $ 1,995 $ (20)
Revolving Credit Facility(4) 2024 130 — 130
Receivables-Based Credit Facility — — —
CCOH 5.125% Senior Secured Notes 2027 1,250 1,250 —
CCIBV 6.625% Senior Secured Notes(5) 2025 375 — 375
CCWH 9.25% Senior Notes(6) 2024 1,902 1,902 —
Other(7) (59) (63) 3
Total Debt $ 5,572 $ 5,084 $ 488
Weighted Average Cost of Debt 6.1 % 6.8 %
(1) As of December 31, 2020, we had $785 million of cash on our balance sheet, including $347 million of cash held outside the U.S. by our subsidiaries.
(2) In May 2020, CCIBV transferred a promissory note in principal amount of $53 million to the holder of the Preferred Stock in exchange for the Preferred Stock,
which is now held by an affiliate of the Company. In August 2020, the promissory note was repaid in full.
(3) During 2020, we paid $20 million of outstanding principal on Term Loan Facility in accordance with the terms of the agreement.
(4) In March 2020, we borrowed $150 million under the Revolving Credit Facility, which matures in August 2024. We repaid $20.0 million of this outstanding
balance in October 2020.
(5) In August 2020, CCIBV issued $375 million of 6.625% Senior Secured Notes, which mature in August 2025.
(6) On February 17, 2021, we issued $1.0 billion aggregate principal amount of 7.750% Senior Notes Due 2028. We plan to use the proceeds, together with cash
on hand, to redeem $940.0 million aggregate principal amount of our CCWH 9.25% Senior Notes due 2024 and to pay related transaction fees.
(7) Other consists of long-term debt fees and original issue discount, partially offset by capital leases.
Notes: Variances are calculated based on actual amounts. Due to rounding, totals may not equal the sum of the line items in the table above.

10
Initiatives to Reduce Costs and Strengthen Balance Sheet
• Restructuring plans
◦ Americas segment restructuring plan completed in Q4 2020; expect annualized pre-tax
cost savings of approximately $7 million
◦ Europe restructuring plan delayed due to evolving nature of COVID-19 impacts and
complexity of executing plan. Plan expected to be substantially complete by first half of
2022.
◦ Corporate operations restructuring plans expected to generate pre-tax cost savings of
approximately $5 million upon completion
• Additionally:
◦ Continued site lease contract negotiations, generated rent abatements of $28 million in
Q4 and $78 million YTD
◦ Obtained European government support and wage subsidies of $1 million in Q4 and
$16 million YTD
• Issued $1 billion of 7.75% Senior Notes due 2028
◦ Proceeds will be used to redeem $940 million of 9.25% Senior Notes due 2024, as well
as pay transaction fees and expenses, including associated call premium and accrued
interest
◦ Weighted average maturity 5.6 years, up from 4.9 years
◦ Run-rate cash interest savings of approximately $10 million

11
Outlook
• Expect revenue to be down in the high twenty
percentage range in Q1 2021.
• Expect revenue to be down in the mid-30
percentage range in Q1 2021.
• Expect cash interest payments of $362 million in
2021 and $335 million in 2022.
Americas
Europe
Cash Interest

12
Appendix

13
Segment Operating Results
(In thousands) Three Months Ended December 31, Years Ended December 31,
2020 2019 Variance 2020 2019 VarianceRevenue
Americas $ 257,770 $ 344,904 (25.3)% $ 976,972 $ 1,273,018 (23.3)%
Europe 268,425 326,998 (17.9)% 804,395 1,111,770 (27.6)%
Other 15,193 73,330 (79.3)% 73,241 299,022 (75.5)%
Consolidated Revenue $ 541,388 $ 745,232 (27.4)% $ 1,854,608 $ 2,683,810 (30.9)%
Direct Operating and SG&A Expenses (Excluding Depreciation and Amortization)1
Americas $ 166,103 $ 199,706 (16.8)% $ 664,162 $ 765,782 (13.3)%
Europe 236,652 267,535 (11.5)% 869,219 980,488 (11.3)%
Other 15,068 50,003 (69.9)% 110,137 226,835 (51.4)%Consolidated Direct Operating and SG&A
Expenses $ 417,823 $ 517,244 (19.2)% $ 1,643,518 $ 1,973,105 (16.7)%
Segment Adjusted EBITDA2
Americas $ 94,179 $ 145,768 (35.4)% $ 319,872 $ 510,135 (37.3)%
Europe 36,978 65,129 (43.2)% (54,093) 142,590 (137.9)%
Other 587 23,481 (97.5)% (35,505) 73,296 (148.4)%
Total Segment Adjusted EBITDA 131,744 234,378 (43.8)% 230,274 726,021 (68.3)%
Adjusted Corporate expenses3 (30,438) (27,291) 11.5 % (110,304) (100,829) 9.4 %
Adjusted EBITDA4 $ 101,306 $ 207,087 (51.1)% $ 119,970 $ 625,192 (80.8)%
1 Direct Operating and SG&A Expenses refers to the sum of direct operating expenses (excluding depreciation and amortization) and selling, general and administrative
expenses (excluding depreciation and amortization).2 Segment Adjusted EBITDA is a GAAP financial measure that is calculated as Revenue less Direct operating expenses and SG&A expenses, excluding restructuring and
other costs. Restructuring and other costs include costs associated with cost savings initiatives such as severance, consulting and termination costs, and other special costs.3 Adjusted Corporate expenses is defined as corporate expenses excluding restructuring and other costs and non-cash compensation expense. See reconciliation of
corporate expenses to Adjusted Corporate expenses within these slides.4 Adjusted EBITDA is defined as consolidated net income (loss), plus: income tax expense (benefit); all non-operating expenses (income), including other expense (income),
net, loss on extinguishment of debt, loss on Due from iHeartCommunications, and interest expense, net; other operating expense (income), net; impairment charges;
depreciation and amortization; non-cash compensation expenses included within corporate expenses; and restructuring and other costs included within operating expenses.
See reconciliation of consolidated net loss to Adjusted EBITDA within these slides.

14
Segment Operating Results Excluding Movements in FX
(In thousands) Three Months Ended December 31, Years Ended December 31,
2020 2019 Variance 2020 2019 Variance
Revenue Excluding Movements in FX1
Americas $ 257,770 $ 344,904 (25.3)% $ 976,971 $ 1,273,018 (23.3)%
Europe 251,900 326,998 (23.0)% 785,074 1,111,770 (29.4)%
Other 17,329 73,330 (76.4)% 80,135 299,022 (73.2)%
Consolidated Revenue Excluding Movements in FX $ 526,999 $ 745,232 (29.3)% $ 1,842,180 $ 2,683,810 (31.4)%
Direct Operating and SG&A Expenses Excluding Movements in FX1
Americas $ 166,104 $ 199,706 (16.8)% $ 664,163 $ 765,782 (13.3)%
Europe 222,147 267,535 (17.0)% 854,127 980,488 (12.9)%
Other 17,091 50,003 (65.8)% 120,244 226,835 (47.0)%
Consolidated Direct Operating and SG&A Expenses Excluding Movements in FX $ 405,342 $ 517,244 (21.6)% $ 1,638,534 $ 1,973,105 (17.0)%
Segment Adjusted EBITDA Excluding Movements in FX1
Americas $ 94,178 $ 145,768 (35.4)% $ 319,870 $ 510,135 (37.3)%
Europe 34,612 65,129 (46.9)% (58,811) 142,590 (141.2)%
Other 775 23,481 (96.7)% (38,581) 73,296 (152.6)%
Total Segment Adjusted EBITDA 129,565 234,378 (44.7)% 222,478 726,021 (69.4)%
Adjusted Corporate Excluding Movements in FX1 (30,319) (27,291) 11.1 % (110,252) (100,829) 9.3 %
Adjusted EBITDA Excluding Movements in FX1 $ 99,246 $ 207,087 (52.1)% $ 112,226 $ 625,192 (82.0)%
1 These non-GAAP financial measures, which exclude the effects of foreign exchange rates, are calculated by converting the current period's amounts in
local currency to U.S dollars using average foreign exchange rates for the comparable prior period. Refer to the previous slide for segment operating results
before adjusting for movements in FX.

15
Reconciliation of Consolidated Net Loss to Adjusted EBITDA
(in thousands)Three Months Ended
December 31,Years EndedDecember 31,
2020 2019 2020 2019
Consolidated net income (loss) $ (32,556) $ 31,551 $ (600,226) $ (361,777)
Adjustments:
Income tax (benefit) expense (25,048) 13,448 (58,006) 72,254
Other (income) expense, net (16,716) (21,258) 170 15,384
Loss on extinguishment of debt — — 5,389 101,745
Loss on Due from iHeartCommunications — — — 5,778
Interest expense, net 90,824 89,908 360,259 419,518
Other operating (income) expense, net 4,437 (2,794) (53,614) (1,162)
Impairment charges — — 150,400 5,300
Depreciation & amortization 65,049 77,848 269,421 309,324
Share-based compensation 4,055 3,354 13,235 15,770
Restructuring and other costs 11,261 15,030 32,942 43,058
Adjusted EBITDA $ 101,306 $ 207,087 $ 119,970 $ 625,192
16
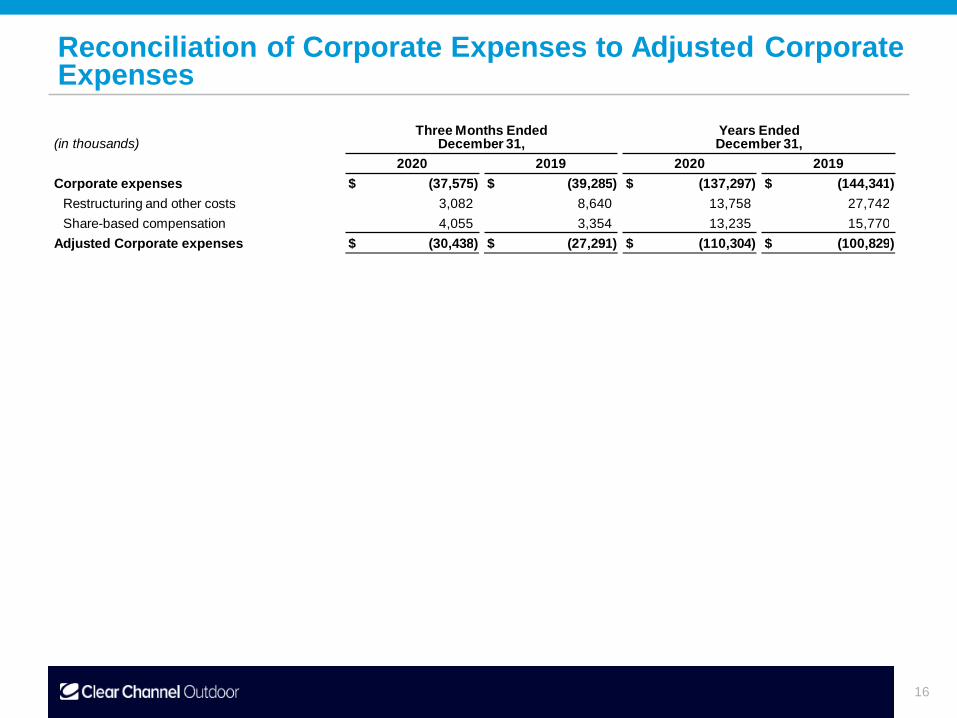
Reconciliation of Corporate Expenses to Adjusted Corporate Expenses
(in thousands)Three Months Ended
December 31,Years EndedDecember 31,
2020 2019 2020 2019
Corporate expenses $ (37,575) $ (39,285) $ (137,297) $ (144,341)
Restructuring and other costs 3,082 8,640 13,758 27,742
Share-based compensation 4,055 3,354 13,235 15,770
Adjusted Corporate expenses $ (30,438) $ (27,291) $ (110,304) $ (100,829)

17
Reconciliation of Revenue
(In thousands) Three Months Ended December 31, Variance
2020 2019 %
Revenue:
Consolidated revenue $ 541,388 $ 745,232 (27.4)%
Excluding: China revenue — 47,062 (100.0)%
Consolidated revenue excluding China 541,388 698,170 (22.5)%
Excluding: Effects of foreign exchange 14,389 —
Consolidated revenue excluding China and effects of foreign exchange $ 526,999 $ 698,170 (24.5)%

18
Items Impacting Comparability
($US Dollars in millions)
FX Impact: Q4 2020
Revenue $ 14.4
Direct Operating and SG&A Expenses $ 12.5
Adjusted EBITDA $ 2.1

19
About Clear Channel Outdoor Holdings, Inc.
Clear Channel Outdoor Holdings, Inc. (NYSE: CCO) is one of
the world’s largest outdoor advertising companies with a
diverse portfolio of approximately 500,000 print and digital
displays in 31 countries across North America, Europe, Latin
America and Asia, reaching millions of people monthly. A
growing digital platform includes nearly 17,000 digital displays
in international markets and more than 2,000 digital displays
(excluding airports), including more than 1,400 digital
billboards, in the U.S. Comprised of two business divisions –
Clear Channel Outdoor Americas (CCOA), the U.S. and
Caribbean business division, and Clear Channel International
(CCI), covering markets in Europe, Latin America and Asia –
CCO employs approximately 4,800 people globally. More
information is available at investor.clearchannel.com,
clearchanneloutdoor.com and clearchannelinternational.com.
Investors Eileen McLaughlin Vice President - Investor Relations [email protected]