forward-looking statements€¦ · lpg consumption by sector - main importing countries r 120 76 52...
TRANSCRIPT
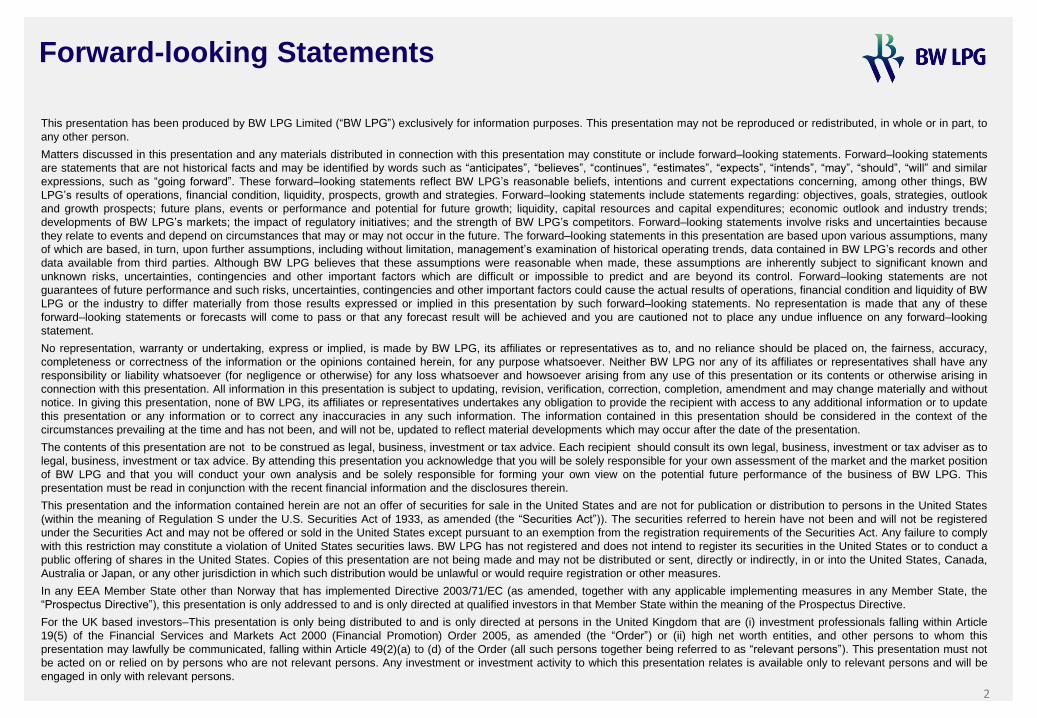
Forward-looking Statements
This presentation has been produced by BW LPG Limited (“BW LPG”) exclusively for information purposes. This presentation may not be reproduced or redistributed, in whole or in part, to
any other person.
Matters discussed in this presentation and any materials distributed in connection with this presentation may constitute or include forward–looking statements. Forward–looking statements
are statements that are not historical facts and may be identified by words such as “anticipates”, “believes”, “continues”, “estimates”, “expects”, “intends”, “may”, “should”, “will” and similar
expressions, such as “going forward”. These forward–looking statements reflect BW LPG’s reasonable beliefs, intentions and current expectations concerning, among other things, BW
LPG’s results of operations, financial condition, liquidity, prospects, growth and strategies. Forward–looking statements include statements regarding: objectives, goals, strategies, outlook
and growth prospects; future plans, events or performance and potential for future growth; liquidity, capital resources and capital expenditures; economic outlook and industry trends;
developments of BW LPG’s markets; the impact of regulatory initiatives; and the strength of BW LPG’s competitors. Forward–looking statements involve risks and uncertainties because
they relate to events and depend on circumstances that may or may not occur in the future. The forward–looking statements in this presentation are based upon various assumptions, many
of which are based, in turn, upon further assumptions, including without limitation, management’s examination of historical operating trends, data contained in BW LPG’s records and other
data available from third parties. Although BW LPG believes that these assumptions were reasonable when made, these assumptions are inherently subject to significant known and
unknown risks, uncertainties, contingencies and other important factors which are difficult or impossible to predict and are beyond its control. Forward–looking statements are not
guarantees of future performance and such risks, uncertainties, contingencies and other important factors could cause the actual results of operations, financial condition and liquidity of BW
LPG or the industry to differ materially from those results expressed or implied in this presentation by such forward–looking statements. No representation is made that any of these
forward–looking statements or forecasts will come to pass or that any forecast result will be achieved and you are cautioned not to place any undue influence on any forward–looking
statement.
No representation, warranty or undertaking, express or implied, is made by BW LPG, its affiliates or representatives as to, and no reliance should be placed on, the fairness, accuracy,
completeness or correctness of the information or the opinions contained herein, for any purpose whatsoever. Neither BW LPG nor any of its affiliates or representatives shall have any
responsibility or liability whatsoever (for negligence or otherwise) for any loss whatsoever and howsoever arising from any use of this presentation or its contents or otherwise arising in
connection with this presentation. All information in this presentation is subject to updating, revision, verification, correction, completion, amendment and may change materially and without
notice. In giving this presentation, none of BW LPG, its affiliates or representatives undertakes any obligation to provide the recipient with access to any additional information or to update
this presentation or any information or to correct any inaccuracies in any such information. The information contained in this presentation should be considered in the context of the
circumstances prevailing at the time and has not been, and will not be, updated to reflect material developments which may occur after the date of the presentation.
The contents of this presentation are not to be construed as legal, business, investment or tax advice. Each recipient should consult its own legal, business, investment or tax adviser as to
legal, business, investment or tax advice. By attending this presentation you acknowledge that you will be solely responsible for your own assessment of the market and the market position
of BW LPG and that you will conduct your own analysis and be solely responsible for forming your own view on the potential future performance of the business of BW LPG. This
presentation must be read in conjunction with the recent financial information and the disclosures therein.
This presentation and the information contained herein are not an offer of securities for sale in the United States and are not for publication or distribution to persons in the United States
(within the meaning of Regulation S under the U.S. Securities Act of 1933, as amended (the “Securities Act”)). The securities referred to herein have not been and will not be registered
under the Securities Act and may not be offered or sold in the United States except pursuant to an exemption from the registration requirements of the Securities Act. Any failure to comply
with this restriction may constitute a violation of United States securities laws. BW LPG has not registered and does not intend to register its securities in the United States or to conduct a
public offering of shares in the United States. Copies of this presentation are not being made and may not be distributed or sent, directly or indirectly, in or into the United States, Canada,
Australia or Japan, or any other jurisdiction in which such distribution would be unlawful or would require registration or other measures.
In any EEA Member State other than Norway that has implemented Directive 2003/71/EC (as amended, together with any applicable implementing measures in any Member State, the
“Prospectus Directive”), this presentation is only addressed to and is only directed at qualified investors in that Member State within the meaning of the Prospectus Directive.
For the UK based investors–This presentation is only being distributed to and is only directed at persons in the United Kingdom that are (i) investment professionals falling within Article
19(5) of the Financial Services and Markets Act 2000 (Financial Promotion) Order 2005, as amended (the “Order”) or (ii) high net worth entities, and other persons to whom this
presentation may lawfully be communicated, falling within Article 49(2)(a) to (d) of the Order (all such persons together being referred to as “relevant persons”). This presentation must not
be acted on or relied on by persons who are not relevant persons. Any investment or investment activity to which this presentation relates is available only to relevant persons and will be
engaged in only with relevant persons.
2

1,537 PEOPLE
45 VESSELS
TOTAL ASSETS
USD 2.1Bn
TRCF
1.954
EPS USD 2.44
ROE
28%
TCE INCOME USD 626 Million
EBITDA USD 430 Million
NPAT USD 326 Million
3
BW LPG at a glance
4
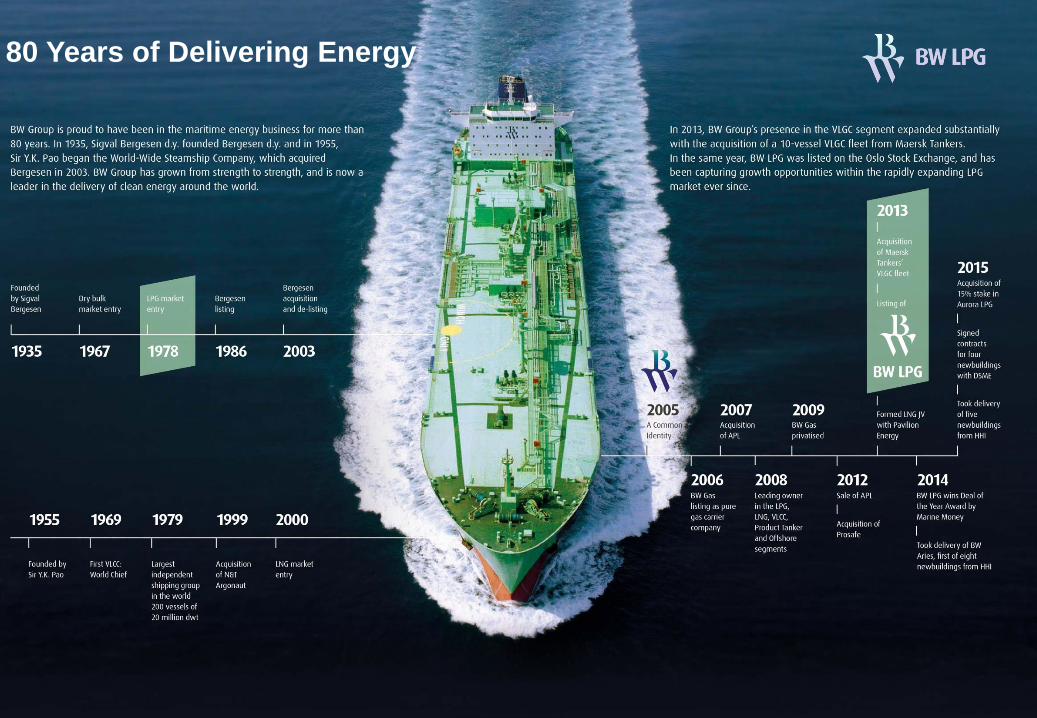
80 Years of Delivering Energy
5
Our Blue Chip Customer Base
National
Oil Companies
International
Oil Companies
International
Trading
Companies

6
2015 Seaborne LPG Exports by Country/Region (Mt)
2015 Seaborne LPG Imports by Country/Region (Mt)
35.6
20.5
8.7 7.9
3.3
-
5
10
15
20
25
30
35
40
Middle East U.S.A. North Europe North Africa West Africa
11.5 11.2
9.7
5.4
4.2
-
5
10
15
China Japan India Korea Indonesia
Source: Waterborne, Poten, BW LPG analysis
Comments
2015 Seaborne LPG Trade Overview U.S. cements its status as largest exporting country, China overtakes Japan as world’s largest LPG importer
Exports
Middle Eastern export growth driven by increase
in UAE and Iran volumes
US LPG export growth driven by increase in
volumes from Enterprise, Targa and Sunoco, as
well as start-up of Nederland terminal
N. Europe & African volumes remained steady
Imports
China import growth led by PDH & retail demand
Indian & Indonesian import growth driven entirely
by retail demand
Japanese imports decline slightly due to LPG
demand displacement from increased city gas
consumption
Korean imports decline slightly due to lower
price-sensitive feedstock switching demand
Source: EIA March 2016 STEO, BW LPG analysis 7
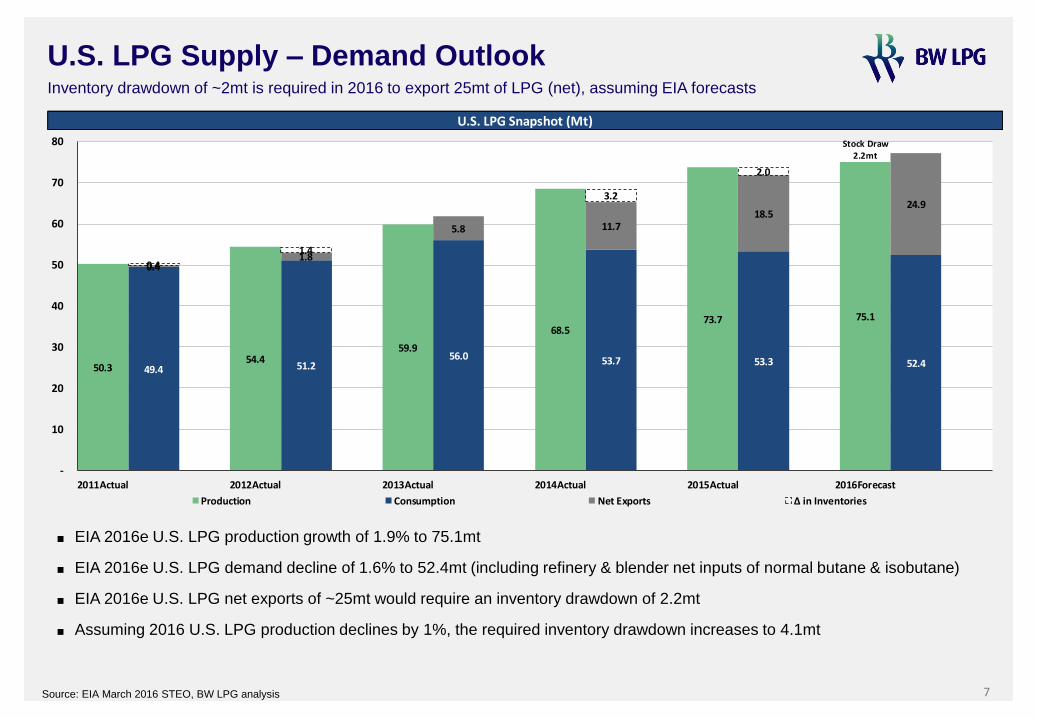
U.S. LPG Supply – Demand Outlook Inventory drawdown of ~2mt is required in 2016 to export 25mt of LPG (net), assuming EIA forecasts
■ EIA 2016e U.S. LPG production growth of 1.9% to 75.1mt
■ EIA 2016e U.S. LPG demand decline of 1.6% to 52.4mt (including refinery & blender net inputs of normal butane & isobutane)
■ EIA 2016e U.S. LPG net exports of ~25mt would require an inventory drawdown of 2.2mt
■ Assuming 2016 U.S. LPG production declines by 1%, the required inventory drawdown increases to 4.1mt
U.S. LPG Snapshot (Mt)
50.3 54.4
59.9
68.5 73.7 75.1
49.4 51.2 56.0 53.7 53.3 52.4
0.4 1.8
5.8 11.7 18.5
24.9
0.4
1.4
3.2
2.0
-
10
20
30
40
50
60
70
80
2011Actual 2012Actual 2013Actual 2014Actual 2015Actual 2016Forecast
Production Consumption Net Exports Δ in Inventories
Stock Draw 2.2mt
Source: Argus, BW LPG analysis. All data for CY 2014, 2015 final data will be available by Q2 2016. 8
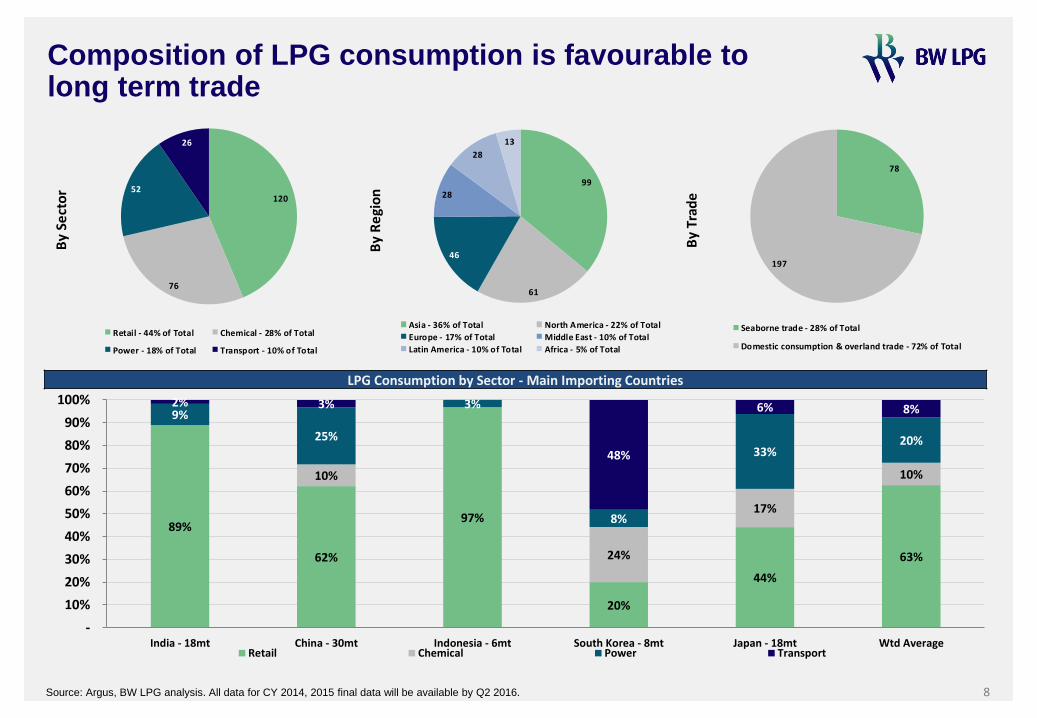
Composition of LPG consumption is favourable to long term trade
89%
62%
97%
20%
44%
63%
10%
24%
17%
10%
9%
25%
3%
8%
33% 20%
2% 3%
48%
6% 8%
-
10%
20%
30%
40%
50%
60%
70%
80%
90%
100%
India - 18mt China - 30mt Indonesia - 6mt South Korea - 8mt Japan - 18mt Wtd AverageRetail Chemical Power Transport
LPG Consumption by Sector - Main Importing Countries
By
Sect
or
120
76
52
26
Retail - 44% of Total Chemical - 28% of Total
Power - 18% of Total Transport - 10% of Total
By
Re
gio
n
99
61
46
28
28
13
Asia - 36% of Total North America - 22% of Total
Europe - 17% of Total Middle East - 10% of Total
Latin America - 10% of Total Africa - 5% of Total
By
Trad
e
78
197
Seaborne trade - 28% of Total
Domestic consumption & overland trade - 72% of Total

The 4 Pillars of Chinese LPG Consumption
9
Retail Chemical
Power Transport
China LPG Consumption
Source: Argus, BW LPG analysis. All data for CY 2014, 2015 final data will be available by Q2 2016.
62% of total LPG consumption
18.6mt of retail demand
Driven by switching from biomass to LPG and %
of population with no access to piped city gas
10% of total LPG consumption
3.0mt of chemical demand
Fastest growing segment driven by PDH capacity
expansion
25% of total LPG consumption
7.5mt of industrial/power demand
Will compete with natural gas for larger scale
projects, LPG ideal for projects with <250 MW of
capacity
3% of total LPG consumption
0.9mt of transport demand
Smallest segment with uncertain growth
trajectory; will require government support

10 Source: Waterborne, Poten, BW LPG analysis
LPG Trade Flows in China 62% LPG import demand growth in 2015
China Imports by Source (11.5 mt)
China Imports by Source (% of Imports)
66%
21%
6%
4% 3%
Middle East North America West Africa Asia Pacific Other
7.5
2.5
0.7
0.4 0.4
Middle East North America West Africa Asia Pacific Other
Comments
China has overtaken Japan as world’s largest
LPG importer in 2015
>60% LPG import growth
~90% of volumes sourced from two regions:
Middle East (UAE in particular) & North America

Global VLGC & BW LPG Fleet Profile
Source: Clarksons, BW LPG analysis
[1] As of 15 March 2016
11
VLGC Fleet Profile [1] - Average Age: 9.6 Years BW LPG Market Share (Owned + Operated VLGCs)
-
5
10
15
20
25
30
35
40
45
50
19
80>
19
81
19
82
19
83
19
84
19
85
19
86
19
87
19
88
19
89
19
90
19
91
19
92
19
93
19
94
19
95
19
96
19
97
19
98
19
99
20
00
20
01
20
02
20
03
20
04
20
05
20
06
20
07
20
08
20
09
20
10
20
11
20
12
20
13
20
14
20
15
20
16
20
17
20
18
20
19
Nu
mb
er
of V
LGC
s
BW LPG Owned & Operated Other VLGC Fleet Other VLGC Newbuildings
>20 Years: 38 Vessels / 19% of Fleet
174 34
62
6
Total Delivered VLGC Fleet - 208 Vessels; BW LPG - 34 Vessels
Total NB VLGC Fleet - 68 Vessels (35% of Fleet); BW LPG - 6Vessels
Other VLGC NB
Other VLGC Fleet
BW LPG VLGC Fleet

12
Global LPG Trade
13
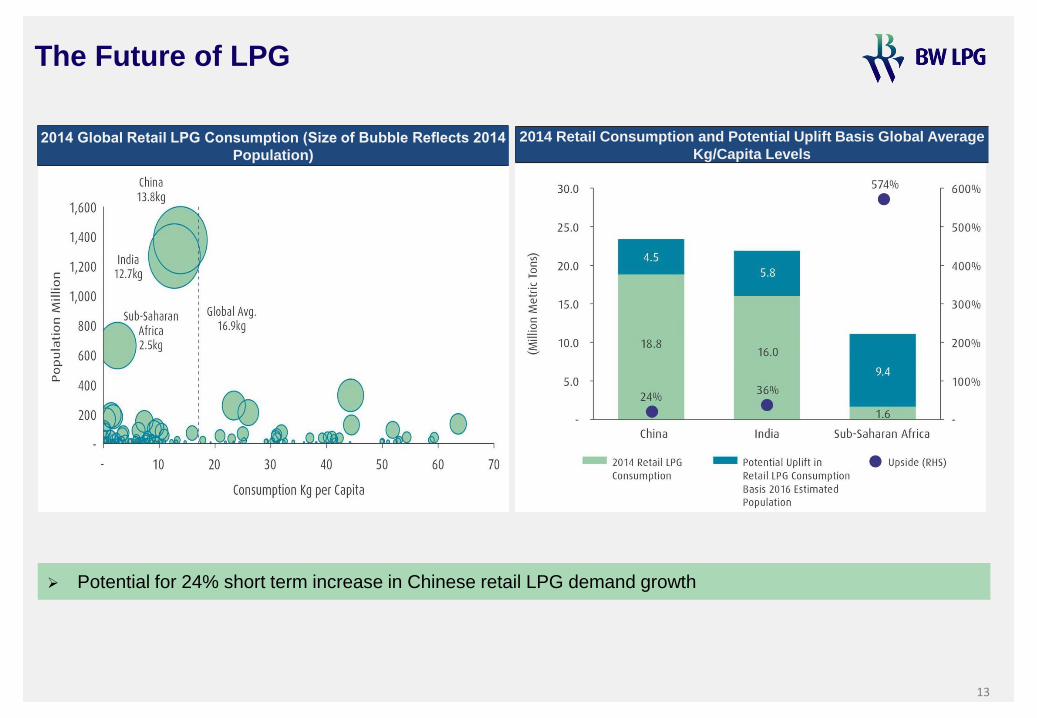
The Future of LPG
2014 Global Retail LPG Consumption (Size of Bubble Reflects 2014
Population)
2014 Retail Consumption and Potential Uplift Basis Global Average
Kg/Capita Levels
Potential for 24% short term increase in Chinese retail LPG demand growth
14
Global Leader in Maritime LPG
“BW LPG’s
vision is to be
the global
leader in
maritime LPG.”
Proven
Operating
Platform
In-house
technical
management
Preferred
partner for
blue chip
charterers
Proximity to capital
markets & Asian
demand centers
Market leading
financing
Share Liquidity
Largest fleet of
VLGCs