formulating push marketing strategies: a method and ... · formulating push marketing strategies: a...
TRANSCRIPT

Michael Levy, John Webster & Roger A. Kerin
"Push" marketing strategies can create additionalprofit opportunities within the marketing channel.This paper describes a method that provides mar-keting managers with information on the profitimpact of various marketing mix strategies. Astudy is described in which high yield "push"strategies are identified.
FormulatingPush MarketingStrategies: AMethod andApplication
EFFORTS to identify salient variables affectingchannel member cooperation and reseller support
are critical in determining the character and successof channel-directed support programs, or "push"marketing strategies (Chevalier and Curban 1976).Furthermore, efforts designed to evaluate the salesand profit impact of alternative push marketing strat-egies are particularly relevant in today's competitiveand economic climate (Lambert and Bennion 1982).
The purpose of this paper is three-fold. First, amanagerial approach is outlined for examining thesales and profit impact of alternative push marketingstrategies. This approach involves four major steps:identifying the salient marketing activities affectingreseller support for a product class, determining thelevel or "amount" of each activity that would differ-entially affect reseller support, estimating the salesresponse and costs associated with these marketing
Michael Levy is Associate Professor of Marketing, Edwin L, Cox Schoolof Business; John Webster is Professor of Statistics; and Roger A. Kerinis Professor of Marketing, Edwin L Cox School of Business; SouthernMethodist University, The authors would like to thank George W, Jones,Jr., Dwight Grant, Vijay Mahajan, three JM reviewers and the sectioneditor for their comments on earlier drafts of this article, and Tom Mari-no and Bob Borys for their programming assistance. The cooperationand assistance of an anonymous margarine manufacturer is also grate-fully acknowledged.
activities, and calculating the profit impact of alter-native marketing activities. Second, an illustration ofhow this approach can be implemented in a field set-ting is provided. Specifically, a research design andstatistical analysis are described and applied in a man-ner unique to the problem of formulating channel-di-rected support programs. Finally, results obtainedfrom the proposed approach are presented and impli-cations for management discussed. A brief review ofprevious approaches is provided prior to describingthe method proposed.
Previous Push MarketingStrategies
The most common approach for formulating a firm's"push" marketing strategy is to determine the im-portance of marketing mix variables and then concen-trate on those variables deemed most important to re-sellers. The degree of importance has been measuredusing three different approaches. One method asksrespondents to rank order reseller support variables interms of importance (Cunningham and Roberts 1974,Gilmour 1977). However, the importance of a servicecannot be determined using ordinal data. Anothermethod, a constant sum scale, provides a relative im-portance measure but is difficult to use if many ser-
Journal of MarketingVol. 47 (Winter 1983), 25-34. Formulating Push Marketing Strategies / 25

vices are being evaluated (LaLonde and Zinszer1976). The third method uses a Likert-type impor-tance scale using the mean response for each variableto prioritize marketing strategy (Evans 1980, Leh-mann and O'Shaughnessy 1974, Perreault and Russ1976, Simon 1965). However, relatively small vari-ations in response often yield little usable informa-tion.
Apart from the shortcomings indicated, a commondeficiency of these methods for developing marketingstrategy is that no specific information is providedabout the level of marketing activities that should bedelivered. For example, using one of the methodsdescribed above, if cooperative advertising is judgedan important variable, a marketing manager still hasno indication of how much greater attention shouldbe afforded that activity.
Research by Gilmour (1979) explicitly consideredthe level of marketing and distribution activities. Inhis study an interactive computer program was uti-lized, in which 40 suppliers provided their perceptionsof how they believed their market share wouldchange, given changes in their marketing mix and thatof their competition. This approach provides manage-ment with additional information not available fromthe research described above. However, it is expectedthat a more accurate demand function would be ob-tained using customers rather than suppliers as thesample frame. In addition his criterion variable, cor-porate growth rate, is insufficient for directing mar-keting strategy since costs are not explicitly consid-ered.
Several different approaches have been used toestimate the sales and profit impact of different mar-keting mix strategies. An early study by Pessimier etal. (1971) compared preferences using dollar values.Darmon (1979) used conjoint analysis to derive aprofit function based on salespeoples' trade-offs fordifferent levels of salary and bonus.
Conjoint analysis has also been used in a market-ing channels context to determine utilities for variouscombinations of marketing strategy activities. Per-reault and Russ (1977) and Levy (1981a) attemptedto define the "perceived dollar benefit" for each sa-lient marketing mix variable, i. e., how much moneywholesalers or retailers would be willing to "tradeo f f for a better or a higher activity level. However,the monetary estimates derived in both studies assumethe relationship between the utility of the customerand the sales revenue of the manufacturer are linear—a potentially unwarranted assumption. Uhr, Houckand Rogers (1981) attempted to estimate the sales andprofit response to order cycle time, variability of de-livery time, and request for information time usingordinary least squares regression. Their finding thatsales changes were linked to changes in physical dis-tribution services is noteworthy. However, their find-
ings have limited direct application to marketing strat-
egy-
Method and ApplicationAstute manufacturers may argue that increasing awholesaler's or retailer's preference for their productsby a push marketing strategy may have a positive rev-enue generating effect. But the critical question is,how will the manufacturer's profits change withchanges in the activity levels? The present study wasdesigned to help manufacturers answer this question.A variation of the conjoint analysis approach is usedto derive the sales response function directly, therebyavoiding the linearity problem indicated above. Inaddition, this study extends previous efforts by deriv-ing a function that describes the most profitable mar-keting mixes. This information can be used directlyby marketing managers to formulate their push mar-keting strategy.
Product and Sample SelectionThe promotion and distribution of margarine was in-vestigated in this study. The promotion of margarineto retailers relies heavily on deals that buyers or mer-chandise managers are relatively free to accept or re-ject. Further, buyers and merchandise managers havesome direct control over shelf space. In this capacity,they have some control over sales and can judge theefficacy of different manufacturer marketing pro-grams. One hundred and three specific buyers andmerchandise managers thought to be the most inno-vative and aggressive by the top management of anationally branded margarine manufacturer were iden-tified. Sixteen refused to participate in the study; 19were judged to lack sufficient knowledge to provideaccurate answers after they started the interview. Theremaining 68 comprised the sample in this study.
Identifying the Type and Levelof Marketing Activity
Marketing mix variables and levels of those variableswere selected on the basis of importance to channelmembers and effect on a manufacturer's differentialadvantage over competing firms. Personal interviewswith a margarine manufacturer's sales, product, andphysical distribution managers, its brokers and retailmerchandise managers ensured that these two criteriawere met. These executives narrowed a comprehen-sive list of 71 activities (Levy 1981b) down to fourvariables—cooperative advertising, coupons, termsof sale and service level. The levels of the four pro-motion and distribution activities shown in Table 1represented the range of feasible alternatives offeredby margarine manufacturers.
Cooperative advertising and coupons in localnewspapers are two forms of promotion over which
26 / Journal of Marketing, Winter 1983
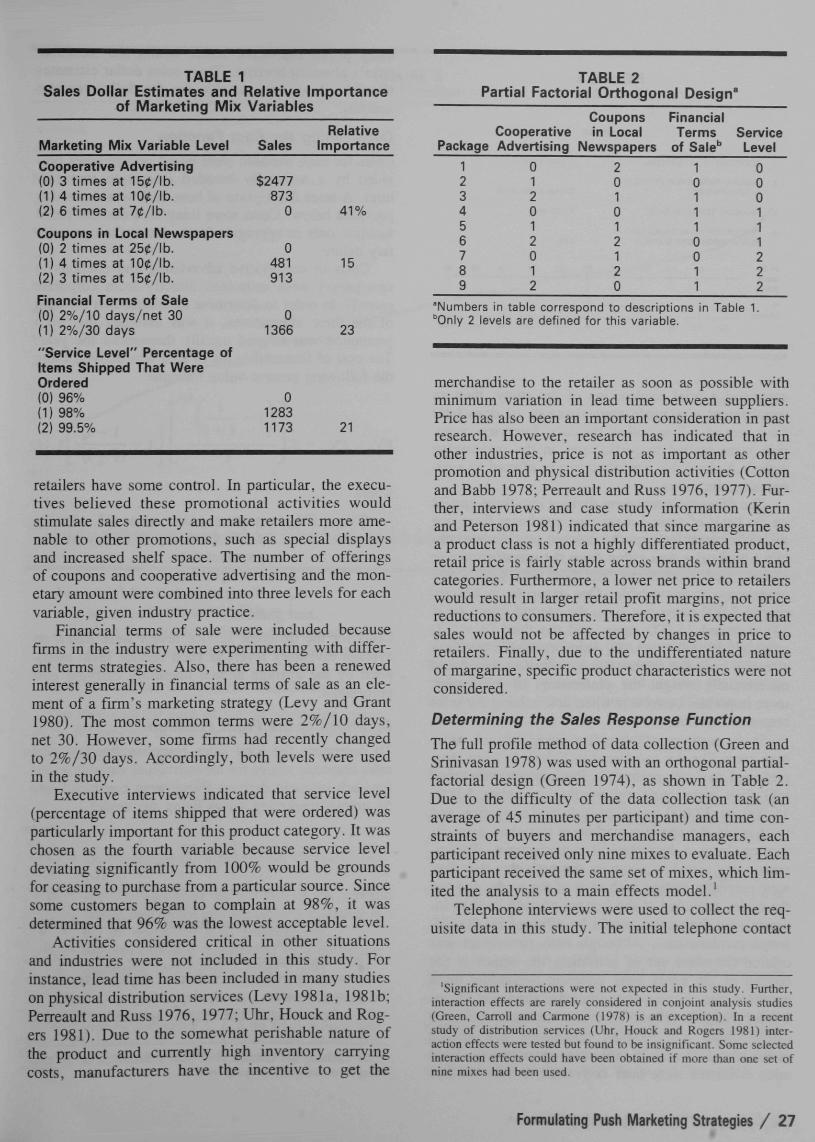
TABLE 1Sales Dollar Estimates and Relative Importance
of Marketing Mix Variables
TABLE 2Partial Factorial Orthogonal Design"
Marketing Mix Variable Level
Cooperative Advertising(0) 3 times at 150/lb.(1) 4 times at 1OC/lb.(2) 6 times at 7c/lb.
Coupons in Local Newspapers(0) 2 times at 25C/lb.(1) 4 times at 100/lb.(2) 3 times at 15C/lb,
Financial Terms of Sale(0) 2%/10 days/net 30(1) 2%/30 days
"Service Level" Percentage ofItems Shipped That WereOrdered(0) 96%(1) 98%(2) 99.5%
Sales
$2477873
0
0481913
01366
012831173
RelativeImportance
41%
15
23
21
retailers have some control. In particular, the execu-tives believed these promotional activities wouldstimulate sales directly and make retailers more ame-nable to other promotions, such as special displaysand increased shelf space. The number of offeringsof coupons and cooperative advertising and the mon-etary amount were combined into three levels for eachvariable, given industry practice.
Financial terms of sale were included becausefirms in the industry were experimenting with differ-ent terms strategies. Also, there has been a renewedinterest generally in financial terms of sale as an ele-ment of a firm's marketing strategy (Levy and Grant1980). The most common terms were 2%/10 days,net 30. However, some firms had recently changedto 2%/'iO days. Accordingly, both levels were usedin the study.
Executive interviews indicated that service level(percentage of items shipped that were ordered) wasparticularly important for this product category. It waschosen as the fourth variable because service leveldeviating significantly from 100% would be groundsfor ceasing to purchase from a particular source. Sincesome customers began to complain at 98%, it wasdetermined that 96% was the lowest acceptable level.
Activities considered critical in other situationsand industries were not included in this study. Forinstance, lead time has been included in many studieson physical distribution services (Levy 1981a, 1981b;Perreault and Russ 1976, 1977; Uhr, Houck and Rog-ers 1981). Due to the somewhat perishable nature ofthe product and currently high inventory carryingcosts, manufacturers have the incentive to get the
CouponsCooperative in Local
Package Advertising Newspapers
FinancialTerms Service
of Sale^ Level
123456789
012012012
201012120
101110011
000111222
"Numbers in table correspond to descriptions in Table 1.''Only 2 levels are defined for this variable.
merchandise to the retailer as soon as possible withminimum variation in lead time between suppliers.Price has also been an important consideration in pastresearch. However, research has indicated that inother industries, price is not as important as otherpromotion and physical distribution activities (Cottonand Babb 1978; Perreault and Russ 1976. 1977). Fur-ther, interviews and case study infonnation (Kerinand Peterson 1981) indicated that since margarine asa product class is not a highly differentiated product,retail price is fairly stable across brands within brandcategories. Furthermore, a lower net price to retailerswould result in larger retail profit margins, not pricereductions to consumers. Therefore, it is expected thatsales would not be affected by changes in price toretailers. Finally, due to the undifferentiated natureof margarine, specific product characteristics were notconsidered.
Determining the Sales Response Function
The full profile method of data collection (Green andSrinivasan 1978) was used with an orthogonal partial-factorial design (Green 1974), as shown in Table 2.Due to the difficulty of the data collection task (anaverage of 45 minutes per participant) and time con-straints of buyers and merchandise managers, eachparticipant received only nine mixes to evaluate. Eachparticipant received the same set of mixes, which lim-ited the analysis to a main effects model.'
Telephone interviews were used to collect the req-uisite data in this study. The initial telephone contact
'Significant interactions were not expected In this study. Further,interaction effects are rarely considered in conjoint analysis studies(Green, Carroll and Carmone (1978) is an exception). In a recentstudy of distribution services (Uhr, Houck and Rogers 1981) inter-action effects were tested but found to be insignificant. Some selectedinteraction effects could have been obtained if more than one set ofnine mixes had been used.
Formulating Push Marketing Strategies / 27
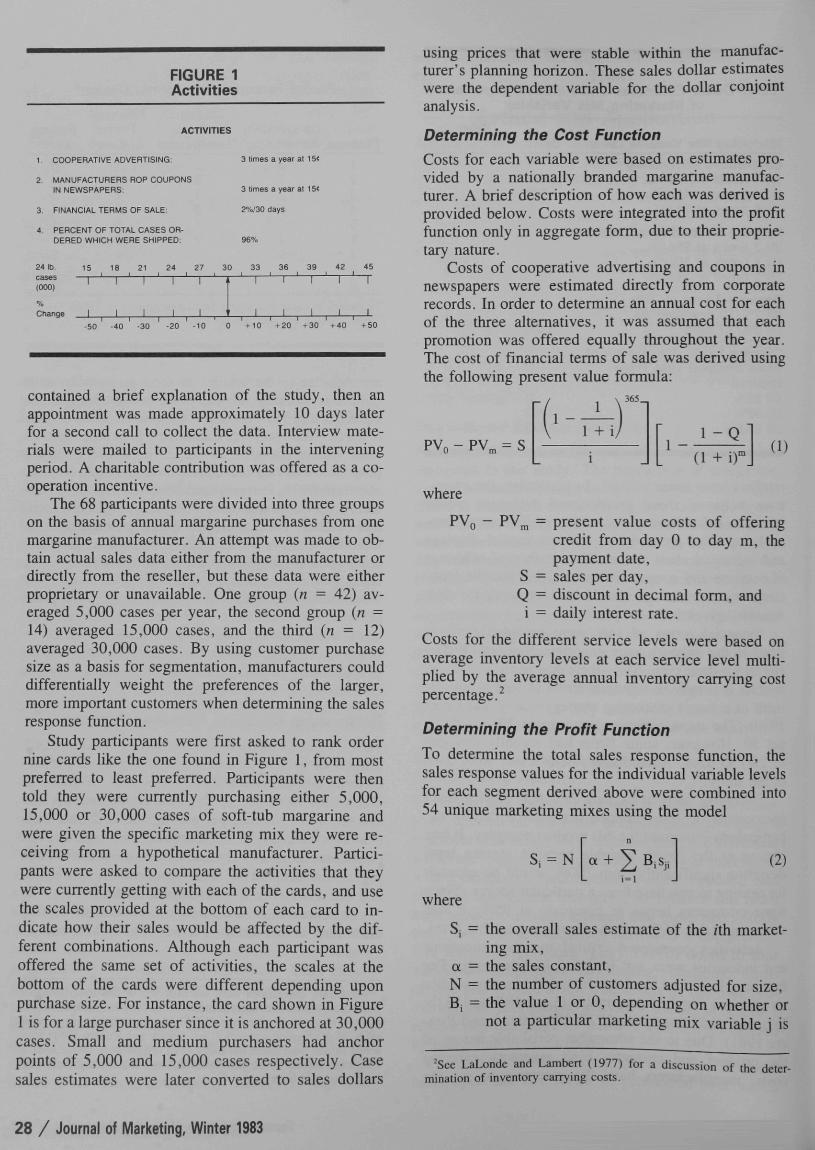
FIGURE 1Activities
ACTIVITIES
1, COOPERATIVE ADVERTISING:
2 MANUFACTURERS ROP COUPONSIN NEWSPAPERS:
3. FINANCIAL TERMS OF SALE:
PEHCENT OF TOTAL CASES OR-DERED WHICH WERE SHIPPED.
3 limes a year al 15<
3 tiniBS a year al 15<
2%/30 days
96%
24 1b, 15 18 21 24 27 30 33 36 39 42 45cases —I—I r—' 1—I 1—I—I '—•—I—• ' — • — ' " ^(000)
Change
1 r
-1—'—I—•—I—•—I—•—1 1—' 1—'—I—'—I——I
-50 -40 -30 -20 -10 0 +10 +20 +30 +40 +50
contained a brief explanation of the study, then anappointment was made approximately 10 days laterfor a second call to collect the data. Interview mate-rials were mailed to participants in the interveningperiod. A charitable contribution was offered as a co-operation incentive.
The 68 participants were divided into three groupson the basis of annual margarine purchases from onemargarine manufacturer. An attempt was made to ob-tain actual sales data either from the manufacturer ordirectly from the reseller, but these data were eitherproprietary or unavailable. One group (n = 42) av-eraged 5,000 cases per year, the second group {n =14) averaged 15,000 cases, and the third (n = 12)averaged 30,000 cases. By using customer purchasesize as a basis for segmentation, manufacturers coulddifferentially weight the preferences of the larger,more important customers when determining the salesresponse function.
Study participants were first asked to rank ordernine cards like the one found in Figure 1, from mostpreferred to least preferred. Participants were thentold they were currently purchasing either 5,000,15,000 or 30,000 cases of soft-tub margarine andwere given the specific marketing mix they were re-ceiving from a hypothetical manufacturer. Partici-pants were asked to compare the activities that theywere currently getting with each of the cards, and usethe scales provided at the bottom of each card to in-dicate how their sales would be affected by the dif-ferent combinations. Although each participant wasoffered the same set of activities, the scales at thebottom of the cards were different depending uponpurchase size. For instance, the card shown in Figure1 is for a large purchaser since it is anchored at 30,000cases. Small and medium purchasers had anchorpoints of 5,000 and 15,000 cases respectively. Casesales estimates were later converted to sales dollars
using prices that were stable within the manufac-turer's planning horizon. These sales dollar estimateswere the dependent variable for the dollar conjointanalysis.
Determining the Cost FunctionCosts for each variable were based on estimates pro-vided by a nationally branded margarine manufac-turer. A brief description of how each was derived isprovided below. Costs were integrated into the profitfunction only in aggregate form, due to their proprie-tary nature.
Costs of cooperative advertising and coupons innewspapers were estimated directly from corporaterecords. In order to determine an annual cost for eachof the three alternatives, it was assumed that eachpromotion was offered equally throughout the year.The cost of financial terms of sale was derived usingthe following present value formula:
= S
1 -1
365 _
1 + i,1 -
1 - Q
(1 + i)"(1)
where
= present value costs of offeringcredit from day 0 to day m, thepayment date,
S = sales per day,Q = discount in decimal form, andi = daily interest rate.
Costs for the different service levels were based onaverage inventory levels at each service level multi-plied by the average annual inventory carrying costpercentage. •
Determining the Profit FunctionTo determine the total sales response function, thesales response values for the individual variable levelsfor each segment derived above were combined into54 unique marketing mixes using the model
= N (2)
where
s,aN
= the overall sales estimate of the iih market-ing mix,
= tbe sales constant,= the number of customers adjusted for size,= the value 1 or 0, depending on whether or
not a particular marketing mix variable j is
^See LaLonde and Lambert (1977) for a discussion of the deter-mination of inventory can7ing costs.
28 / Journal of Marketing, Winter 1983

FIGURE 2Profit Function
(millions)
S6.0
56.5
55.0
54.5
54.0
53.5
53.0
5^5
52.0
S0.5
4B.5
49.0
Marketing Mix
I I I I I I I I I I1 2 3 4 5 6 7 8 9 10 11 12 13 14 IS 16 17 18 19 20 21 22 23 24 25 26 27 28 29 30 31 32 33 34 35 36 37 38 39 40 41 42 43 44 45 46 47 48 49 SO 51 S2 53 S4
n =
included in the ith marketing mix,= the sales dollar estimate contributed by
particular marketing mix variable level jandthe number of different variable levels.
The total cost for each of the 54 marketing mixescan be determined by adding the costs for the com-ponent variables:
(3)
where
Ci = the overall cost estimate of the /th marketingmix,
B, = 1 or 0, depending on whether or not a par-ticular marketing mix variable is included inthe /th marketing mix, respectively,
Cj, = the cost estimate contributed by a particularmarketing mix variable level j , and
'In the analysis for determining S,. s,, is the actual ordinary leastsquares regression coefficient. It is not scaled so that the least pre-ferred level is zero, as reported in Table 1 and is customary in conjointanalysis.
n = the number of different variable levels.
The profit function can then be determined by sub-tracting the cost of each marketing mix, C,, from itsrespective sales revenue, S,, and ranking the market-ing mixes from lowest to highest contribution.
Analysis and ResultsSales Response
The data were analyzed using ordinary least squaresregression. This approach is particularly appropriatein this study since the dependent measure, sales, isassumed to be at least described by interval data."
The data from all 68 participants were aggregatedinto one analysis and the results are shown in Table
""One reviewer suggested that alternative estimation procedurescould be presented, such as LINMAP (Shocker and Srinivasan 1977,Srinivasan and Shocker 1973) or the hybrid conjoint method proposedby Green and Montemayor (1981)- However, given at least intervalscale measurement of the dependent variable, only ordinary leastsquares was performed. Even for ordinal scale measurement, thereis sufficient support for the notion that only minor differences existin the predictive validities obtained from alternative metric and non-metric estimation procedures (Carmone, Green and Jain 1978; Cattinand Winink 1976; Jain et al. 1979; Wittink and Cattin 1981).
Formulating Push Marketing Strategies / 29

1. Aggregation issues, data preparation for the regres-sion and the validity and reliability of the data areexamined in the Appendix. The sales estimates werederived from the dummy variable regression coeffi-cients and scaled so that the least preferred marketingmix variable level serves as a zero anchor. Recall thatthese estimates apply to a 5,000 pound per year cus-tomer. Estimates of larger or smaller customers couldbe derived through a linear approximation; for in-stance, the estimates for the average 15,000 poundper year customer would be determined by multiply-ing by three. Thus, one concludes that the manufac-turers can expect to receive $2,477 more sales by of-fering cooperative advertising three times a year at150 per pound compared to six times a year at 7(i perpound. In addition, the average customer was vir-tually indifferent to terms of 2%/30 days ($1,366)and getting 98% or 99.5% service level ($1,208 or$1,173).
The relative importance of each variable is rep-resented by the ratio of the highest sales level withineach variable to the total of the highest sales levelsacross all variables. Cooperative advertising was themost important variable, followed by financial termsof sale and service level. Coupons were the least im-portant activity.
Profit ImpactThe profit impacts of each of 54 separate marketingmixes were determined by subtracting the estimatedcost of each mix (C;) from the sales dollar estimate(Sj). The partial sales dollar estimate, s ,, representsone "average" small customer. Therefore, to gener-alize a particular marketing mix variable level to allcustomers, it was assumed that one medium customerwould be equivalent to three small customers, sincetheir sales estimates were based on 15,000 cases in-stead of 5,000 cases. Similarly, a large customer wasequivalent to six small customers. Therefore, Sjj wasmultiplied by the estimated number of total cus-tomers, adjusted by size. Finally, the 54 marketingmixes were derived by combining all possible mar-keting mix variable level combinations and addingthem to tbe sales constant.
The results from this analysis are graphed in Fig-ure 2. The least profitable marketing mix, package 1,is cooperative advertising offered three times a yearat 150 per pound, coupons in newspapers offered twotimes a year at 25^ per pound, terms of sale of 2%/10 days/net 30, and a 96% service level. The mostprofitable mix, package 54, consists of cooperativeadvertising six times a year at 70 per pound, couponsfour times a year at 100 per pound, 2%/30 day termsand a 98% service level. In general, these aggregateprofit findings parallel the individual results summa-rized in Table 1. Twelve of the top 20 mixes offered
terms of 2%/30 days. Nine of tbe top 20 mixes of-fered a 98% service level, while six offered 99.5%.Ten of the top 20 mixes provided coupons four timesa year at 100 per pound, while seven offered threetimes at 150 per pound. Only the results of cooper-ative advertising contradict the individual analyses:Fifteen of the top 20 marketing mixes offered coop-erative advertising six times a year at 70 per pound,since the cost of this particular alternative was rela-tively lower than the other two.
ImplicationsA four-step approach to determine and assess alter-native push marketing strategies, which ranks themost profitable combinations of distribution and pro-motion variables, was described and applied in a fieldsetting. The results show how the data gathered canbe used to formulate channel-directed support pro-grams .
The question of how to determine push marketingstrategies has direct implications for the field of mar-keting management and for practicing marketing man-agers. By addressing how push strategies can be for-mulated, this study examined a frequently overlookedissue in marketing management. Indeed, industrybased research focusing on a specific problem as thisstudy does has been singled out as contributing greatlyto developing relevant generalizations in tbe marketing management field (Myers, Greyser and Massy1979).
The approach described has direct implications formanagers competing in industries where push mar-keting strategies are important, such as tbe margarineindustry examined here. For example, the approachassists managers in examining the relative importanceof different marketing mix variables, e.g., coopera-tive advertising versus service levels. Furthermore,managers can examine the relative importance of dif-ferent levels within a variable, e.g., terms of 2%/10days, net 30 versus 2%/30 days. Finally, the salesresponse information can be used in conjunction withassociated costs to determine the profit impact of al-ternative push marketing strategies. Knowledge ofthis type is invaluable for planning and budgeting pur-poses and enhances the managerial utility of this ap-proach over other approaches described earlier. More-over, the approach described sensitizes managers tothe profit contributions of their actions, thus overcom-ing a frequent criticism of marketing managers (Webster1981).
Despite potential benefits accruing to managementof adopting tbe approach described, important imple-mentation considerations must be raised. One consid-eration involves the data collection process. The keyto successful implementation of similar studies is in
30 / Journal of Marketing, Winter 1983

the researchers' ability to interview knowledgeableindividuals who have had some experience examininga product's sales response to different marketing ac-tivities. Once a good respondent pool is identified, thedifficult task of conducting interviews remains. Threeoptions exist. The first is to use the telephone inter-view procedure described; this requires a great dealof time and coordination. Another option is to enlistthe aid of field salespeople. This method can be suc-cessful with top management support and monetaryand/or psychological incentives for the salespeople.A third option is to work through or create ''distrib-utor advisory councils" consisting of representativesfrom major accounts (Rosenbloom 1978).
Another consideration is the validity of sales es-timates. Some internal (predictive) validity has beenestablished in the Appendix. However the question ofexternal validity remains. The sales estimates are asurrogate measure for buyers' demand responses tomarketing activities. Sales estimates should be a closeapproximation of reality and should be more usefulmanagerially than other analytical tools. Therefore,the most profitable combination derived from theanalysis may not, in fact, be optimal. It is expectedthat the optimum will exist near the group of mar-keting mixes producing the highest profit contribu-tion. The manager can then choose the "best" mixand/or modify the levels based on other managerialand competitive constraints.
AppendixThis appendix describes some aggregation issues inconjoint analysis, data preparation for the regressionsand evaluation of the validity and reliability of thedata.
Aggregation and Data PreparationA separate analysis was performed for each of thethree segments. Within each segment all responseswere pooled which, in effect, provides an "average"response for each segment. Numerous articles haverecently addressed issues related to aggregation ofconjoint analysis data (Huber and Moore 1979; Jain,Malhotra and Mahajan 1979; Montgomery and Wit-tink 1980). Specifically, Currim and Wittink (1980)demonstrate the equivalence of least squares resultsfor four aggregation procedures. Moore (1980) em-pirically examined the predictive validity of four ag-gregation methods and emphasized that a great ad-vantage of segmented analyses over individual levelanalyses was in data collection: "To analyze data atthe individual level, one must require each respondentto rate enough concepts to estimate individual utili-ties" (p. 522). However, in the present study the ninepackages that each respondent evaluated were used to
estimate coefficients for seven dummy variables.^ Anindividual analysis would therefore have been insuf-ficient for stable results.
The independent variables were coded as dummyrather than continuous variables in this analysis.When an independent variable is continuous but onlya limited number of its values (levels) are used in anexperiment, the same information is obtained for con-joint analysis as is obtained from the dummy variableapproach (using one less dummy variable than thenumber of levels per independent variable). What islost using dummy variables is ease in prediction forvalues of the independent variable not utilized in theexperiment. The dummy variable approach was usedin this study since two of the independent variables,cooperative advertising expense and coupon expense,are actually combinations of pseudocontinuous vari-ables. Continuous values for these variables wouldhave been quite subjective.
Prior to aggregating the data, it was important todetermine whether the relative magnitude of the salesestimates derived from the analysis were differentacross the three segments. A multivariate analysis ofvariance (MANOVA) was used to determine if theseven dummy-variable regression coefficients weredifferent across the three groups. The sales dollar datafrom each respondent were used to compute the sevenregression coefficients for each individual respondent.These values were then scaled so they would all becomparable to the 5,000 case purchase. That is, theresponses from the medium and large groups weredivided by three and six, respectively. Since each re-spondent had evaluated the same set of nine activities,these 68 sets of regression coefficients are indepen-dent with the same expected value (under the nullhypothesis) and the same variance matrix. TheMANOVA then compared the difference between thethree groups to the variability within the groups. Thealpha level for this test was p = .332. Therefore, therewas no reason to believe that the projected sales re-sponses to the activities differed for the three groups.Accordingly, the data from all 68 participants wereaggregated into one analysis.
Vaiidity and ReiiabilityRecent attention has been directed toward validity andreliability issues in conjoint analysis (Acito 1977,Acito and Jain 1980, Cattin and Wittink 1976, Greenand Srinivasan 1978, Jain et al. 1979, Montgomeryand Wittink 1980, Parker and Srinivasan 1976, Scott
dummy variables are required to define all levels of the fouractivities since the three-level marketing mix variables (cooperativeadvertising, coupons and service level) require two dummy variablesand the two-level marketing mix variable (financial terms of sale) isdefined by one dummy variable.
Formulating Push Marketing Strategies / 31

Rank Order Preferences, R,TABLE 3
Determined after Renioyal of the Eight Holdout Samples,and Page's L Statistic
ActivityProfile
123456789
Page's L StatisticSignificance
1
2981473
(71
61892.062
2
2981374
(71
61996.001
3
298146357
1926.018
Subsamples4
2981473
(71
61976.002
5
298137456
1928.017
6
2891
(71
7346
1674.983
7
596724138
1843.243
8
298147
(71
36
1784.394
and Wright 1976, Segal 1982). This study examinesthe predictive validity and reliability of the findingsusing a series of holdout samples. The 68 participantswere randomly assigned to eight groups. The ordinaryleast squares regressions were performed eight times,holding out a different group of eight each time. Thesales dollar estimates derived from the analyses wereused to determine the overall sales dollar estimates ofthe nine profiles using the additive model:
(A-1)
where
Sj = the sales dollar estimate of the /th profile,Sji = the sales dollar estimate contributed by a
particular activity level j ,Bj = 1 or 0, depending on whether or not activity
j characterizes the zth profile, respectively,and
n = the number of different activity levels.
The overall sales dollar estimates, S,, are ranked andsummarized in Table 3.
Predictive Validity. The regression equations usedto determine the rankings in Table 3 were used topredict the rankings of the participants in each cor-responding holdout sample using Page's L statistic(1963);
(A-2)
where
Rj = the rank of marketing mix j derived from theregression equation of subsamples,
rj. = the sum of the ranks of the holdout samplefor the 7th marketing mix, and
n = the number of activity profiles.
The significance of L was determined by relatingz from equation (A-3) to the standard normal tables:
z = Vm(n -12L 3(n
m(n - n) n - 1(A-3)
where
n = the number of profiles,m = the number of holdout respondents, andz = standard normal z statistic.
These L statistics are not independent, due to theoverlap of the data in determining the Rj. Howeverthere is no overlap in the holdout samples.
The purpose of this test is to validate individualresponses. The sales estimates are probably somewhatsubjective at the individual level, but the aggregateprovides a good picture of the activities' impact onsales. Among other things the individual estimates areaffected by the degree of conservatism of each man-ager. The differences of the nine sales values withinthe package will vary from manager to manager eventhough the rankings may be quite consistent. The rel-ative values of the packages are of concern in thisvalidation, and with this in mind, the validity of therankings rather than the sales data were checked.
The results of these predictive validity tests arefound in Table 3. The null hypothesis being tested is:There is no relationship between predicted ranking,Rj, and the ranks from the holdout samples, rj. There-fore, a small significance implies a strong relation-ship. The data show relatively strong validity. Fiveof the eight tests were significant at a < .05.
Reliability. Conventional tests for reliability(e.g., test-retest, alternate forms, and/or split-half)were not possible in this study due to the difficultyof data collection and the relatively small samplesizes. The participant pool would not have cooperatedfor a test-retest or alternate forms analysis. The sam-
32 / Journal of Marketing, Winter 1983

pie was too small for stable results in a conventionalsplit-half analysis; had a number of the subsamplesbeen used in a series of split-half analyses, the as-sumption of independent samples would have been
violated. Therefore, no statistical tests for reliabilitywere performed. However, examination of Table 3reveals stability of ranks across subsamples. which issome indication of reliable results.
REFERENCESAcito, Franklin (1977), "An Investigation of Some Data Col-
lection Issues in Conjoint Measurement." in ContemporaryMarketing Thought, B. A. Greenberg and D. N. Bellenger.eds., Chicago: American Marketing Association.
and Arun K. Jain (1980), "Evaluation of ConjointAnalysis Results: A Comparison of Methods," Journal ofMarketing Research. 17 (February), 106-112.
Carmone. Frank J.. Paul E. Green and Arun K. Jain (1978)."Robustness of Conjoint Analysis: Some Monte Carlo Re-sults." Journal of Marketing Research. 15 (May). 300-3.
Cattin, Philippe and Dick R. Wittink (1976). "A Monte CarloStudy of Metric and Non-Metric Estimation Methods forMultiattribute Models," Research Paper No. 341, GraduateSchool of Business. Stanford University.
Chevalier, Michel and Ronald C. Curhan (1976), "Retail Pro-motions as a Function of Trade Promotions: A DescriptiveAnalysis," Sloan Management Review. 18 (Fall), 19-32.
Cotton. B. C. and Emerson M. Babb (1978), "ConsumerResponse to Promotional Deals." Journal of Marketing. 24(July). 109-113.
Cunningham. M. T. and D. A. Robens (1974), "The Roleof Customer Service in Industrial Marketing," EuropeanJournal of Marketing. 8 (Spring). 15-29.
Currim. Imran S. and Dick R. Wittink (1980), "Issues in theDevelopment of a Marketing Decision Support System Us-ing Segment-Based Consumer Preference Models," Mar-ket Measurement and Analysis Proceedings of ORSA/TIMS Conference. David B. Montgomery and Dick R.Wittink. eds.. Marketing Science Institute. 386-96.
Darmon. Rene Y. (1979), "Setting Sales Quotas with Con-joint Analysis," Journal of Marketing Research, 16 (Feb-ruary), 133-40.
Evans, Richard H. (1980). "Choice Criteria Revisited." Vowr-nal of Marketing, 44 (Winter). 55-6.
Gilmour. Peter (1977). "Customer Service. Differentiating byMarket Segment," International Journal of Physical Dis-tribution, 1 (no. 3), 141-8.
(1979), "Development of a Demand ResponseFunction,'' Journal of Business Logistics, 1 (no. 2), 8 3 -102.
Green, Paul E. (1974), "On the Design of Choice Experi-ments Involving Multifactor Alternatives." The Journal ofConsumer Research. 1 (September). 61-8 .
. J. Douglas Carroll and Frank J. Carmone (1978),"Some New Types of Fractional Factorial Designs forMarketing Experiments," in Research in Marketing. J. N.Sheth, ed.. Greenwich, CT: JAI Press.
and Mila Montemayor (1981). "A Hybrid UtilityEstimation Model for Conjoint Analysis," Journal of Mar-keting, 45 (Winter), 33-41 .
and V. Srinivasan (1978), "Conjoint Analysis in
E. Beckwith et al.. eds., Chicago: American MarketingAssociation, 64-8.
Jain. Arun K.. Franklin Acito. Naresh K. Malhotra and VijayMahajan (1979), "A Comparison of the Internal Validityof Alternative Parameter Estimation Methods in Decom-position Multiattribute Preference Models," Journal ofMarketing Research, 16 (August). 313-22.
, Naresh K. Malhotra and Vijay Mahajan (1979),"Aggregating Conjoint Data: Some Methodological Con-siderations and Approaches." Educators' Conference Pro-ceedings. Neil E. Beckwith et al., eds., Chicago: AmericanMarketing Association, 74-7.
Kerin, Roger A. and Robert A. Peterson (1981). "JanmarFoods Corporation," in Strategic Marketing Problems:Cases and Comments. Boston: Allyn and Bacon. 120-35.
LaLonde. B. J. and Douglas M. Lambert (1977), "A Meth-odology for Calculating Inventory Carrying Costs." Inter-national Journal of Physical Distribution. 7 (no. 4). 195-231.
and Paul H. Zinszer (1976), Customer Service:Meaning and Measurement. Chicago: National Council ofPhysical Distribution Management.
Lambert. Douglas M. and Mark L. Bennion (1982), "NewChannel Strategies for the 198O's," in Marketing Chan-nels: Domestic and International Perspectives, MichaelHarvey and Robert Lusch. eds.. Norman, OK: Center forEconomic and Management Research, School of BusinessAdministration, University of Oklahoma Press, 116-23.
Lehmann. Donald R. and John O'Shaughnessy (1974), "Dif-ference in Attribute Importance for Different IndustrialProducts." Journal of Marketing. 38 (April), 36-42.
Levy, Michael (1981a), "Toward an Optimal Customer Ser-vice Policy," Journal of Business Logistics. 11 (no. 2),87-111.
— • '(1981b). "Customer Service: A Managerial Ap-proach to Controlling Marketing Channel Conflict," Inter-national Journal of Physical Distribution and MaterialsManagement. 11 (no. 7). 38-52.
and Dwight Grant (1980). "Financial Terms of Sale
Consumer Behavior; Issues and Outlook," Journal of Con-sumer Research. 5 (September). 103-23.
Huber, Joel C. and William L. Moore (1979). "A Comparisonof Alternative Ways to Aggregate Individual ConjointAnalyses," 1979 Educators' Conference Proceedings, Neil
and Control of Marketing Channel Conflict," Journal ofMarketing Research, 17 (November). 516-523.
Montgomery. David B. and Dick R. Winink (1980). "ThePredictive Validity of Conjoint Analysis for AlternativeAggregation Schemes." Market Measurement and AnalysisProceedings, ORSA/TIMS Conference. David B. Mont-gomery and Dick R. Wittink. eds.. Marketing Science In-stitute, 298-309.
Moore, William L. (1980). "Levels of Aggregation in Con-joint Analysis: An Empirical Comparison." Journal ofMarketing Research. 17 (November). 516-23.
Myers. John G.. Stephen A. Greyser and William F. Massy(1979), "The Effectiveness of Marketing's "R&D" for Mar-keting Management: An Assessment," Journal of Market-ing. 43 (January). 17-29.
Page, Ellis B. (1963), "Ordered Hypotheses for MultipleTreatments: A Significance Test for Linear Ranks," Jour-
Formulating Push Marketing Strategies / 33

nal of the American Statistical Association, 58 (March),216-30.
Parker, Bamett R. and V. Srinivasan (1976), "A ConsumerPreference Approach to the Planning of Rural PrimaryHealth Care Facilities," Operations Research, 24 (Septem-ber-October), 991-1025.
Perreault, William D., Jr., and Frederick A. Russ (1976),"Physical Distribution Service in Industrial Purchase De-cisions," Journal of Marketing, 40 (April), 3-10.
and (1977), "Improving Physical Distri-bution Service Decisions with Trade-Off Analysis," Inter-national Journal of Physical Distribution, 7 (no. 3), 17-27.
Pessimier, Edgar A., Philip Burger, Richard Teach and Doug-las Tigert (1971), ''Using Laboratory Brand PreferenceScales to Predict Consumer Brand Purchases," Manage-ment Science. 17 (February), B371-85.
Rosenbloom, Bert (1978), /^iarketing Channels: A Manage-ment Review, Hinsdale, IL: The Dryden Press, 190-91.
Scott, Jerome E. and Peter Wright (1976), "Modeling an Or-ganizational Buyer's Product Evaluation Strategy; Validityand Procedural Considerations," Journal of Marketing Re-search, 13 (August), 221-4.
Segal, Madhav N. (1982), "Reliability of Conjoint Analysis:
Contrasting Data Collection Procedures," Journal of Mar-keting Research. 19 (February), 139-143.
Shocker, Allan D. and V. Srinivasan (1977), "LINMAP(Version II): A FORTRAN IV Computer Program for Ana-lyzing Ordinal Preference (Dominance) Judgments via Lin-ear Programming Techniques and for Conjoint Measure-ment," Journal of Marketing Research, 14 (February),101-103.
Simon, Leonard S. (1965), "Measuring the Market Impact ofTechnical Services," Journal of Marketing Research, 2(February), 32-9.
Srinivasan, V. and Allan D. Shocker (1973), "Linear Pro-gramming Techniques for Multidimensional Analysis ofPreferences," Psychometrika, 38 (September), 337-370.
Uhr, Emest B., Ernest C. Houck and John C. Rogers (1981),"Physical Distribution Service," Journal of Business Lo-gistics, 2 (no. 2), 158-69,
Webster, Frederick E., Jr. (1981), "Top Management's Con-cerns About Marketing: Issues for the 198O's," Journal ofMarketing, 45 (Summer), 9-16.
Wittink, Dick R. and Philippe Cattin (1981), "AlternativeEstimation Methods for Conjoint Analysis: A Monte CarloStudy," Journal of Marketing Research, 18 (February),101-6.
strategic Sales ManagementG. Daind Hughes, University of North Carolina,and Charles H. Singier, sales management con-sultant and retired Vice President for Saks,Burro ughs-Wellcome Co.combines academic research with practical experi-ence and cases to give complete and current
No coverage of basic sales management.D 10260 1983 Available in November
Strategic Retail ManagementDanny R Arn-old, Louis M Capella, andGarry D. Smith, Mississippi State Universityfocuses on the analysis of retail environments and
, No strategic planning and decision making to achieveD objectives. 10085 1983 Available in February
Transportation Policy in the 1980sQiylon E. Germane, Stanford University
The first casebook in the field uses a problem-solvingorientation in covering the major transporation
Yei No issues of the 1980s.ffl D 10510 1983 Available flow
Product Policy: Concepts, Methods,and StrategyYoram]. Wind, the Wharton SchoolUniversity of Pennsylvania
]^ J^ the definitive book on product polic\'.H D 08343 688pp 1982
For complimentary copy consideration or for pur-chase for personal library, write Mark S. Dalton,Marketing Manager, Business. If you're teaching acourse, be sure to mention course title, enrollment,and book now in use.
Addison-Wesley Publishing Company, Inc.Reading, Massachusetts 01867
34 / Journal of Marketing, Winter 1983
