forensic fire scene analysis using computational fluid ......forensic fire scene analysis using...
TRANSCRIPT
Project Number: MTP-0001
Forensic Fire Scene Analysis Using
Computational Fluid Dynamics (CFD)
A Major Qualifying Project Report:
Submitted to the Faculty
of the
WORCESTER POLYTECHNIC INSTITUTE
In partial fulfillment of the requirement for the
Degree of Bachelor of Science
by
Francisco Kang
Raeshawn Kennedy
Bernard Rabidou
Dimitrios Savva
Date: April 27, 2016
Approved by:
Professor Milosh T. Puchovsky, Advisor
Professor Christopher B. Wood, Co-Advisor
Table of Contents Executive Summary ......................................................................................................................... i
Abstract .......................................................................................................................................... iv
Acknowledgement .......................................................................................................................... v
List of Figures ................................................................................................................................ vi
List of Tables ............................................................................................................................... viii
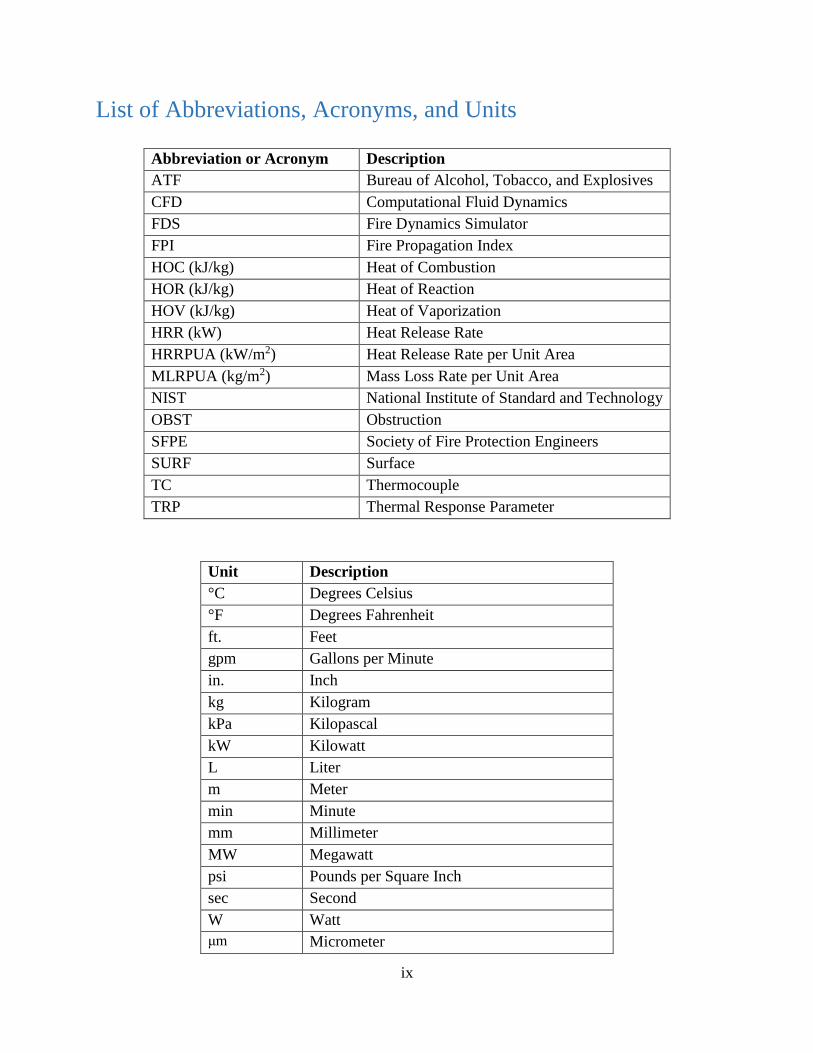
List of Abbreviations, Acronyms, and Units ................................................................................. ix
1 Introduction .................................................................................................................................. 1
1.1 Problem Statement ................................................................................................................ 1
1.2 Organization of the Report .................................................................................................... 2
2 Background .................................................................................................................................. 3
2.1 Bureau of Alcohol, Tobacco, Firearms and Explosives ....................................................... 3
2.2 Key Factors in Compartment Fires ....................................................................................... 3
2.2.1 Solid Fuel Packages ....................................................................................................... 3
2.2.2 Ventilation Parameters ................................................................................................... 4
2.3 Fire Dynamics Simulator (FDS) ........................................................................................... 5
2.3.1 FDS Fire Modeling ........................................................................................................ 6
3 ATF Tests..................................................................................................................................... 8
3.1 Individual Fuel Packages ...................................................................................................... 8
3.1.1 Polystyrene Based Fuel Packages .................................................................................. 8
3.1.2 Polyurethane Based Fuel Packages ................................................................................ 8
3.1.3 Wood Based Fuel Packages ........................................................................................... 9
3.2 Full-Scale ............................................................................................................................ 10
3.2.1 Compartment Structure ................................................................................................ 10
3.2.2 Instrumentation ............................................................................................................ 11
3.2.3 Contents of Structure ................................................................................................... 12
3.2.4 Test Scenarios and Results........................................................................................... 12
4 Modeling Procedures ................................................................................................................. 15
4.1 Numerical Mesh .................................................................................................................. 15
4.2 Modeling Procedure for Fuel Packages .............................................................................. 16
4.2.1 Geometry...................................................................................................................... 16
4.2.2 Material Properties ....................................................................................................... 16
4.2.3 Heat Release Rate per Unit Area (HRRPUA) ............................................................. 17
4.2.4 Sensitivity Analysis ..................................................................................................... 18
4.2.5 Standard Ignition Package (SIP) .................................................................................. 18
4.2.6 Beanbag........................................................................................................................ 18
4.2.7 Bookcase ...................................................................................................................... 19
4.2.8 Desk ............................................................................................................................. 19
4.2.9 Desk Chair ................................................................................................................... 20
4.2.10 Dresser ....................................................................................................................... 20
4.2.11 Mattress ...................................................................................................................... 21
4.2.12 Upholstered Chair ...................................................................................................... 21
4.3 Modeling Procedure for Full-scale Model .......................................................................... 22
4.3.1 Computational Domain ................................................................................................ 22
4.3.2 Geometry...................................................................................................................... 23
4.3.3 Ventilation.................................................................................................................... 24
4.3.4 Devices ......................................................................................................................... 24
5 Results ........................................................................................................................................ 26
5.1 Sensitivity Analysis ............................................................................................................ 26
5.2 Fuel Package Results .......................................................................................................... 27
5.2.1 Beanbag........................................................................................................................ 27
5.2.2 Bookcase ...................................................................................................................... 27
5.2.3 Desk ............................................................................................................................. 28
5.2.4 Desk Chair ................................................................................................................... 30
5.2.5 Dresser ......................................................................................................................... 30
5.2.6 Mattress ........................................................................................................................ 31
5.2.7 Upholstered Chair ........................................................................................................ 33
5.3 Full-scale Results ................................................................................................................ 34
5.3.1 Test 1 ............................................................................................................................ 34
5.3.2 Test 2 ............................................................................................................................ 41
5.3.3 Test 3 ............................................................................................................................ 48
5.3.4 Test 4 ............................................................................................................................ 55
6 Damage Analysis ....................................................................................................................... 63
6.1 Exterior Window Wall ........................................................................................................ 63
6.2 Interior Window Wall ......................................................................................................... 67
6.3 Quadrant 2: Corner Area ..................................................................................................... 69
6.4 Quadrant 3: Mattress ........................................................................................................... 71
6.5 Quadrant 3: Corner Area ..................................................................................................... 73
7 Conclusions ................................................................................................................................ 75
7.1 Future Work ........................................................................................................................ 75
Bibliography ................................................................................................................................. 77
Appendix ....................................................................................................................................... 79
Appendix A: Fuel Package Set-Ups ......................................................................................... 79
Appendix B: Compartment Set-Up ........................................................................................... 83
Appendix C: Sensitivity Analysis ............................................................................................. 85
Density .................................................................................................................................. 85
Heat of Combustion .............................................................................................................. 86
Ignition Temperature ............................................................................................................ 87
Specific Heat ......................................................................................................................... 88
Thermal Conductivity ........................................................................................................... 89
Appendix D: Master FDS Input File ......................................................................................... 90
i
Executive Summary Fire Dynamics Simulator (FDS) is a computational fluid dynamics program
developed and maintained by the U.S. National Institute of Standards and Technology (NIST).
This project examined the use of FDS as a forensics tool to provide better insight on how
changing ventilation conditions within a compartment fire can affect fire growth, flame spread
and resulting fire damage.
Fire investigations remain a very complex forensic science. It is not unusual for two fire
investigators to examine the same fire scene and reach different conclusions. Heat energy
initially in the form of an ignition source, available fuels and their associated physical and
chemical properties, an oxidizer such as oxygen in air, and an uninhibited chemical reaction are
necessary to initiate and sustain combustion, and are fundamental in understanding flame spread
and fire growth. Fuel properties and availability of the oxidizer through varying ventilation
conditions such as door openings and failed windows during a fire, as well as the location of fuel
sources with respect to the ventilation openings, can significantly affect the fire’s outcome and
overall resulting fire scene.
Burn patterns and resulting fire damage prompt certain notions about where and how the
fire started. However, areas of heavy fire damage do not always correlate with initial areas of
fire origin and growth. Key factors such as changing compartment ventilation conditions
throughout the fire event can result in substantial localized fire damage and burn patterns remote
from actual areas of origin. A computer model that can replicate, with a sufficient degree of
accuracy, the stages of a fire event for a range of likely scenarios would prove useful for better
informing decisions about a fire scene and facilitate more uniform conclusions.
A series of four fire tests conducted by the Bureau of Alcohol, Tobacco, Firearms and
Explosives (ATF), a U.S. government agency responsible for investigating key fire events
formed the basis for the project. These tests were performed in identical compartments in which
either initial ventilation conditions or initial items ignited varied. In further detail, tests 1 and 2
varied in ventilation conditions, but with the same fire location; tests 3 and 4 varied in fire
location, but had the same initial ventilation conditions as test 1. The effect of these ventilation
conditions and fire locations on burn patterns and overall areas of substantial fire damage was
specifically examined and assessed. During the course of testing, ATF utilized instruments such
as thermocouples, heat flux gauges and velocity probes to record data. In addition, they captured
visual data with video recording equipment. Fire growth as characterized by heat release rates
(HRR) for the overall compartment fires was not measured. However, smaller scale calorimeter
tests were conducted to measure specific HRR of individual fuel packages. FDS was applied to
recreate the ATF compartment fire tests to determine if and how FDS could reproduce similar
results to those measured and observed during the tests.
The physical state and arrangement of the fuel packages, and the individual materials that
comprise them need to be sufficiently articulated and quantified for use with FDS. However, in
fire scene investigations, the actual fuel packages, their arrangement and specific material
ii
properties are rarely precisely known. This situation held true for this project, as the material
properties of the fuels used as part of the ATF tests were not specifically obtained as part of the
test program. The fuel packages in the ATF tests consisted of furnishings composed of synthetic
fibers such as polystyrene and polyurethane, and natural materials such as wood and cotton.
Common material compositions of the fuel packages and pertinent material properties such as
density, specific heat, thermal conductivity, heat of combustion and ignition temperature were
investigated and estimates for use as input for the FDS calculations were made. The degree to
which the material properties used accurately represent the actual fuels involved can have a
significant outcome on the resulting calculations.
Various modeling techniques needed to be applied while using FDS. For certain fuel
packages, a ramping function was employed to mathematically match the heat release rates to
those measured during the ATF calorimeter tests. While FDS contains a subroutine to calculate
flame spread and resulting fire growth based on certain input parameters, the results of these
calculations did not match well with measured test results. The associated physical phenomenon
is not sufficiently understood nor is it mathematically well characterized. Even so, numerical
approaches exist and were applied. FDS approximates a compartment or building as a series of
user specified small three-dimensional rectangular control volumes or computational cells. FDS
computes changes within and among the cells throughout a computational domain. The
numerical flame spread model relies upon user specified material properties as they influence
how cells, in this case those that represent the surface of a fuel, absorb energy and heat up. The
cell mathematically ignites when the entire cell reaches a user specified ignition temperature.
The temperature, heat flux and velocity measurements recorded during the ATF tests
were compared to the results calculated by FDS. For certain full-scale FDS simulations, the
temperature and velocity data showed reasonable agreement in terms of trends and magnitude to
the data measured in the ATF tests. However, all of the simulations showed some discrepancies,
which could be due to a delay in fire growth and flame spread. Additionally, Smokeview, a
program coupled with FDS for visualizing numerical calculations was employed to evaluate the
results of FDS with the video data obtained. However, the video footage showed to be of limited
value as the test fires progressed because visibility into the compartment was drastically reduced
due to smoke production. As a result, performing visual comparisons of fire growth and flame
spread between the model’s calculations and the live tests could not be made. Although the video
footage could not be fully utilized, the ATF provided photos of the resulting damage for each
individual test allowing us to perform a damage analysis. In doing so, additional features of FDS
including boundary, slice, and vector files were applied to show the fire conditions that may have
led to the cause and formation of the resulting damage to the compartments.
From the aforementioned FDS results and analysis, ventilation was identified to be a key
factor in fire growth as characterized by heat release rates (HRR). FDS was able to provide HRR
data through mathematical calculations. A relationship between the effects of dynamic
ventilation and HRR was identified such that when a window failed, the HRR increased
contributing to fire growth leading to the transition of flashover. In all four FDS simulations,
iii
flaming combustion was observed only in areas proximate to oxygen supplying vents in the post
flashover environment. This same observation was made by ATF in their tests as regardless of
where the initial ignition was located, flaming fire conditions existed only in areas of ventilation
openings during the post-flashover environment.
This project puts forth recommendations for areas of further effort and study to improve
upon the analysis of resulting damage. The resulting damage of certain fuel packages caused by
fire conditions may provide more insight on identifying area of origin. In order to do so, further
examination of the materials used in the fuel packages could lead to better characterization of
their material properties for use with FDS. Future work should consider performing small-scale
bench tests on the materials of the fuel packages using a cone calorimeter or other test devices to
derive the actual material properties. In addition, a better characterization of the thermal
properties could allow for a more accurate prediction of flame spread.
iv
Abstract The ATF conducted four identical compartment fire tests to observe the difference in fire
conditions and resulting damage when varying the ignition location or initial ventilation
conditions. Fire Dynamics Simulator (FDS) was applied to simulate the fire tests to determine
the degree to which the fire conditions and resulting outcome from the tests could be replicated.
The data measured during the experiments was analyzed against the results calculated by FDS
and demonstrated reasonable agreement for certain scenarios.
v
Acknowledgements We would like to thank the following professors who provided guidance and support throughout
the duration of the project:
Professor Milosh Puchovsky, Advisor
Professor Christopher Wood, Co-advisor
We would also like to thank the Bureau of Alcohol, Tobacco, Firearms and Explosives for the
opportunity to work on this project. In particular, we would like to thank the following people,
who provided us with the materials necessary to complete the project:
Andrew Cox
David Tucholski
We would also like to thank the WPI Information Technology department for providing us with
resources essential to the completion of the project. In particular, we would like to thank the
following person:
Siamak Najafi
vi
List of Figures Figure 1: ATF Test Structure ........................................................................................................ 10
Figure 2: Location of Instruments................................................................................................. 11
Figure 3: Upholstered Chair with SIP ........................................................................................... 21
Figure 4: FDS Computation Domain of Compartment................................................................. 23
Figure 5: Bird's Eye View of Compartment ................................................................................. 23
Figure 6: Full-scale Location of Instrumentation ......................................................................... 25
Figure 7: Beanbag HRR Graph ..................................................................................................... 27
Figure 8: Bookcase HRR Graph ................................................................................................... 28
Figure 9: Desk HRR Graph........................................................................................................... 29
Figure 10: Desk Chair HRR Graph ............................................................................................... 30
Figure 11: Dresser HRR Graph..................................................................................................... 31
Figure 12: Mattress HRR Graph .................................................................................................. 32
Figure 13: Mattress and Beanbag Chair HRR Graph ................................................................... 32
Figure 14: Upholstered Chair HRR Graph ................................................................................... 33
Figure 15: FDS Full-scale Test 1 HRR ......................................................................................... 36
Figure 16: Full-scale Test 1 Thermocouple Data - Quadrant 1 .................................................... 37
Figure 17: Full-scale Test 1 Thermocouple Data - Quadrant 2 .................................................... 38
Figure 18: Full-scale Test 1 Thermocouple Data - Quadrant 3 .................................................... 38
Figure 19: Full-scale Test 1 Thermocouple Data - Quadrant 4 .................................................... 39
Figure 20: Full-scale Test 1 Heat Flux Data ................................................................................. 40
Figure 21: Full-scale Test 1 Velocity Data ................................................................................... 41
Figure 22: FDS Full-scale Test 2 HRR ......................................................................................... 42
Figure 23: Full-scale Test 2 Thermocouple Data - Quadrant 1 .................................................... 44
Figure 24: Full-scale Test 2 Thermocouple Data - Quadrant 2 .................................................... 45
Figure 25: Full-scale Test 2 Thermocouple Data - Quadrant 3 .................................................... 45
Figure 26: Full-scale Test 2 Thermocouple Data - Quadrant 4 .................................................... 46
Figure 27: Full-scale Test 2 Heat Flux Data ................................................................................. 47
Figure 28: Full-scale Test 2 Velocity Data ................................................................................... 48
Figure 29: FDS Full-scale Test 3 HRR ......................................................................................... 50
Figure 30: Full-scale Test 3 Thermocouple Data - Quadrant 1 .................................................... 51
Figure 31: Full-scale Test 3 Thermocouple Data - Quadrant 2 .................................................... 52
Figure 32: Full-scale Test 3 Thermocouple Data - Quadrant 3 .................................................... 52
Figure 33: Full-scale Test 3 Thermocouple Data - Quadrant 4 .................................................... 53
Figure 34: Full Scale Test 3 Heat Flux Data................................................................................. 54
Figure 35: Full Scale Test 3 Velocity Data ................................................................................... 55
Figure 36: FDS Full-scale Test 4 HRR ......................................................................................... 57
Figure 37: Full-scale Test 4 Thermocouple Data - Quadrant 1 .................................................... 58
Figure 38: Full-scale Test 4 Thermocouple Data - Quadrant 2 .................................................... 59
Figure 39: Full-scale Test 4 Thermocouple Data - Quadrant 3 .................................................... 59
vii
Figure 40: Full-scale Test 4 Thermocouple Data - Quadrant 4 .................................................... 60
Figure 41: Full-scale Test 4 Heat Flux Data ................................................................................. 61
Figure 42: Full-scale Test 4 Velocity Data ................................................................................... 62
Figure 43: Exterior Window Wall Damages ................................................................................ 63
Figure 44: Interior Window Wall Damages.................................................................................. 67
Figure 45: Quadrant 2 Corner Wall Damages .............................................................................. 69
Figure 46: ATF Mattress Damage Comparison ............................................................................ 71
Figure 47: Quadrant 3 Corner Wall Damages .............................................................................. 73
viii
List of Tables Table 1: Polystyrene HRR Data ...................................................................................................... 8
Table 2: Polyurethane HRR Data ................................................................................................... 9
Table 3: Wood HRR Data ............................................................................................................. 10
Table 4: Furniture Items................................................................................................................ 12
Table 5: Miscellaneous Items ....................................................................................................... 12
Table 6: Full-scale Ignition Sources ............................................................................................. 13
Table 7: Summary of Full-scale Events in Minutes...................................................................... 14
Table 8: D*/dx Ratio for all Models ............................................................................................. 15
Table 9: Material Database ........................................................................................................... 17
Table 10: Full-scale Test 1 Smokeview Timeline ........................................................................ 35
Table 11: Full-scale Test 1 Events Timeline ................................................................................ 36
Table 12: Full-scale Test 2 Results Timeline ............................................................................... 42
Table 13: FDS Full-scale Test 2 Smokeview Timeline ................................................................ 43
Table 14: FDS Full-scale Test 3 Smokeview Timeline ............................................................... 49
Table 15: Full-scale Test 3 Events Timeline ................................................................................ 50
Table 16: Full-scale Test 4 Smokeview Timeline ........................................................................ 56
Table 17: Full-scale Test 4 Events Timeline ................................................................................ 57
Table 18: Exterior Window Wall Heat Flux Boundary File Time-Lapse .................................... 64
Table 19: Exterior Window Wall Temperature Slice File Time-Lapse ........................................ 65
Table 20: Exterior Window Temperature Vector-Slice File Time-Lapse .................................... 66
Table 21: Interior Window Wall Heat Flux Boundary File Time-Lapse ...................................... 68
Table 22: Quadrant 2 Corner Heat Flux Boundary File Time-Lapse ........................................... 70
Table 23: FDS Mattress Damage Comparison ............................................................................. 72
Table 24: Quadrant 3 Corner Heat Flux Boundary File Time-Lapse ........................................... 74
ix
List of Abbreviations, Acronyms, and Units
Abbreviation or Acronym Description
ATF Bureau of Alcohol, Tobacco, and Explosives
CFD Computational Fluid Dynamics
FDS Fire Dynamics Simulator
FPI Fire Propagation Index
HOC (kJ/kg) Heat of Combustion
HOR (kJ/kg) Heat of Reaction
HOV (kJ/kg) Heat of Vaporization
HRR (kW) Heat Release Rate
HRRPUA (kW/m2) Heat Release Rate per Unit Area
MLRPUA (kg/m2) Mass Loss Rate per Unit Area
NIST National Institute of Standard and Technology
OBST Obstruction
SFPE Society of Fire Protection Engineers
SURF Surface
TC Thermocouple
TRP Thermal Response Parameter
Unit Description
°C Degrees Celsius
°F Degrees Fahrenheit
ft. Feet
gpm Gallons per Minute
in. Inch
kg Kilogram
kPa Kilopascal
kW Kilowatt
L Liter
m Meter
min Minute
mm Millimeter
MW Megawatt
psi Pounds per Square Inch
sec Second
W Watt
μm Micrometer
1
1 Introduction
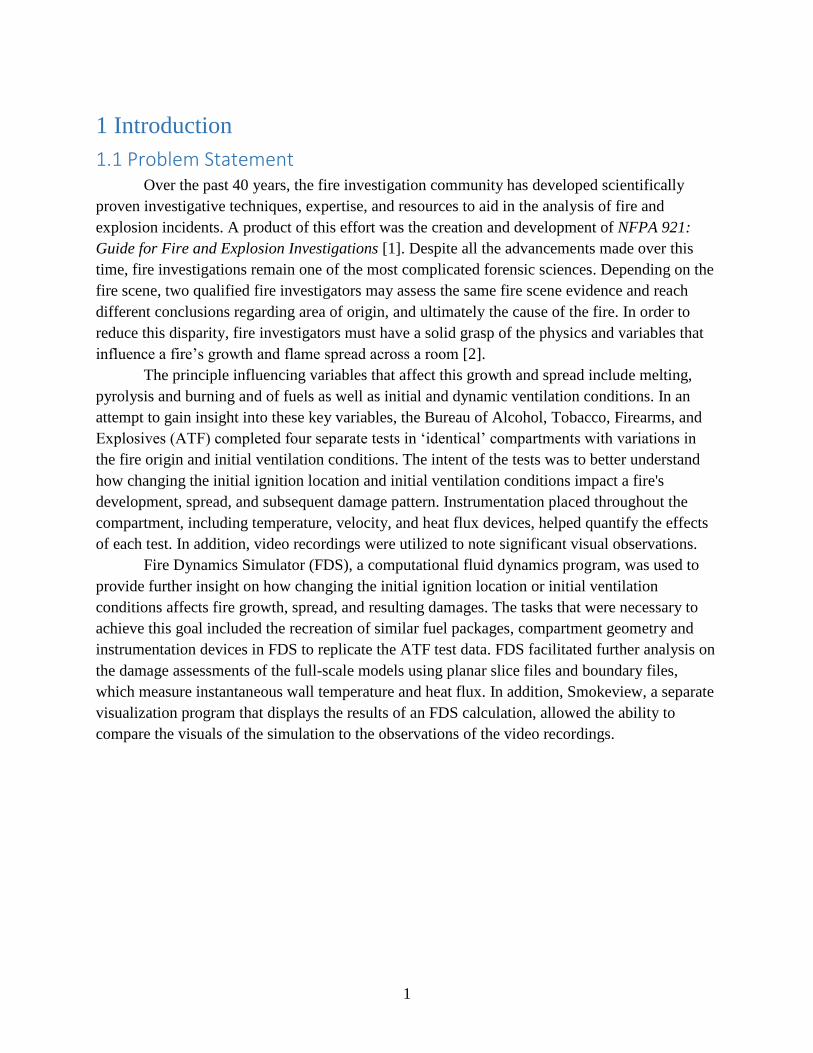
1.1 Problem Statement Over the past 40 years, the fire investigation community has developed scientifically
proven investigative techniques, expertise, and resources to aid in the analysis of fire and
explosion incidents. A product of this effort was the creation and development of NFPA 921:
Guide for Fire and Explosion Investigations [1]. Despite all the advancements made over this
time, fire investigations remain one of the most complicated forensic sciences. Depending on the
fire scene, two qualified fire investigators may assess the same fire scene evidence and reach
different conclusions regarding area of origin, and ultimately the cause of the fire. In order to
reduce this disparity, fire investigators must have a solid grasp of the physics and variables that
influence a fire’s growth and flame spread across a room [2].
The principle influencing variables that affect this growth and spread include melting,
pyrolysis and burning and of fuels as well as initial and dynamic ventilation conditions. In an
attempt to gain insight into these key variables, the Bureau of Alcohol, Tobacco, Firearms, and
Explosives (ATF) completed four separate tests in ‘identical’ compartments with variations in
the fire origin and initial ventilation conditions. The intent of the tests was to better understand
how changing the initial ignition location and initial ventilation conditions impact a fire's
development, spread, and subsequent damage pattern. Instrumentation placed throughout the
compartment, including temperature, velocity, and heat flux devices, helped quantify the effects
of each test. In addition, video recordings were utilized to note significant visual observations.
Fire Dynamics Simulator (FDS), a computational fluid dynamics program, was used to
provide further insight on how changing the initial ignition location or initial ventilation
conditions affects fire growth, spread, and resulting damages. The tasks that were necessary to
achieve this goal included the recreation of similar fuel packages, compartment geometry and
instrumentation devices in FDS to replicate the ATF test data. FDS facilitated further analysis on
the damage assessments of the full-scale models using planar slice files and boundary files,
which measure instantaneous wall temperature and heat flux. In addition, Smokeview, a separate
visualization program that displays the results of an FDS calculation, allowed the ability to
compare the visuals of the simulation to the observations of the video recordings.
2
1.2 Organization of the Report This report is organized into eight chapters as follows:
Chapter 1 introduces the problem statement and outlines the overall approach used for this
project.
Chapter 2 provides relevant background information, details about key factors in compartment
fires and further information about the applications of FDS.
Chapter 3 presents the compartment tests conducted by the ATF and the descriptions of the
material composition of the fuel packages.
Chapter 4 discusses the procedure for modeling the fuel packages and the full-scale tests. This
chapter also addresses the complications of modeling certain phenomenon using FDS.
Chapter 5 shows the FDS modeling results for comparison with the ATF test measurements and
observations.
Chapter 6 provides an analysis of the FDS calculations and keys in on certain features of the
computer model that can provide for additional insight about the fire tests.
Chapter 7 concludes the overall report and summarizes our findings.
Chapter 8 provides recommendations for potential future work.
3
2 Background
2.1 Bureau of Alcohol, Tobacco, Firearms and Explosives Over the past 40 years, the Bureau of Alcohol, Tobacco, Firearms and Explosives (ATF)
has developed investigative capabilities that have positioned them as a well-known source for
fire investigative knowledge and assistance [3]. ATF fire investigators routinely assess and
interpret fire scene patterns and damages in an effort to develop hypotheses, and eventually draw
conclusions about where a fire may have started and how that fire spread throughout a
compartment or structure. In addition, the ATF conducted compartment burn tests to better
understand the fire dynamics of these events.
2.2 Key Factors in Compartment Fires In order for a fire to exist, the presence of heat, fuel, an oxidizer, and an uninhibited
chemical reaction are all required; this is known as the fire tetrahedron [2]. From this
characterization of the fire phenomenon, two major fire science principles play a significant role
in understanding flame spread and fire growth in compartment fires [2]. The first principle has to
do with the state of the fuels and their material properties. In other words, the first principle is
about what is burning and how. The thermal properties of the materials used for the fuel
packages affect the initial ignition and the associated heat release rate (HRR). The second
principle pertains to ventilation or the supply of oxygen to the compartment fire. Oxygen flow
and the direction of ventilation profoundly affect a fire in terms of heat generation and spread
rate. Both of these principles also pertain to the project goal of simulating flame spread and fire
growth because they highlight the importance of accurately representing the material properties
of the fuel packages and the significant influence of changing ventilation conditions.
2.2.1 Solid Fuel Packages
Before flaming combustion can be achieved, solids must first be transformed into an
ignitable gas. In order for this phase change to occur for a solid, sufficient heat needs to be
applied creating potential fuel for flaming combustion. This heat vaporizes the fuel package into
a gas then ignites at a certain temperature [2]. This material-based property is known as the
ignition temperature. It is important to note that the solid to gas phase transformation begins
prior to reaching this temperature. Although this material property has a strong influence on how
long a fuel package takes to ignite, there is usually a certain level of uncertainty related to its
value. This is so because it depends on the manner in which the material is heated, the rate of
energy transfer to the material, and the physical and chemical composition of the material [4].
This concept becomes particularly important in the pre-flashover environment because the entire
compartment is filled with a hot upper gas layer. The heat energy from these gases radiates
downwards and causes pyrolysis of solid items distant from the actual flames; a phenomenon
that can be described as flame spread. The fuel packages then begin to vaporize and produce
more gaseous fuels creating a fuel-rich environment that tends to flashover once a change in
4
ventilation has occurred. Flashover is the moment in time where all ignitable items have ignited.
During the transition to flashover, the energy from the upper gas layer radiates down toward any
exposed solids. The resistance to ignition and fire propagation for these previously uninvolved
fuel packages is assessed through the thermal response parameter (TRP) of a material [5]. As
expected, this property depends upon the ignition temperature (𝑇𝑖𝑔) and other material properties
such as density (𝜌), specific heat (𝑐𝑝) and thermal conductivity (𝑘) as well as the ambient
temperature (𝑇𝑎). The equation for TRP is as follows [4]:
𝑇𝑅𝑃 = (𝑇𝑖𝑔 − 𝑇𝑎)√𝑘𝜌𝑐𝑝
This can then be used to calculate the fire propagation index (FPI) of a material, which
represents the ease or difficulty of flame spread on the surface of the material beyond the area of
ignition [4]. This characteristic, which is important in simulating flame spread, is also dependent
upon the thermal properties of the material.
Once a fuel package has fully ignited, its burning characteristics are further governed by
the material properties that make up that respective solid. Properties such as the heat of
combustion of a material, which is the amount of energy produced for each unit of fuel mass
burned, have a direct impact on fire growth [4]. Since the HRR is a measurement of the objects
energy production over time, it can be an indication of fire size and is calculated by the following
equation from the 4th Edition of the SFPE Handbook:
�̇� = �̇�∆ℎ𝑐
where �̇� is the heat release rate of an object, �̇� is the mass loss rate and ∆ℎ𝑐 is the heat of
combustion. The heat of combustion for a material is determined almost entirely by the chemical
composition of the material as well as the air quality at the time of combustion meaning that a
reaction with pure oxygen will yield the highest heat of combustion [4]. This thermal property is
often controlled by the oxygen supply and subsequently the ventilation parameters of the
scenario.
2.2.2 Ventilation Parameters
In compartment fires, the ventilation parameters may control the amount and location of
available oxygen for combustion [4]. It was previously stated that flashover fires in a
compartment create enough heat energy to effectively pyrolize every exposed solid within a
compartment. The resulting fuel gases in the upper layer of the compartment can be 600C or
above, but can only ignite and continue to burn when they mix with the appropriate amount of
oxygen; this usually occurs near ventilation openings where fresh air can enter a compartment. In
order to continue the combustion process, flames are forced to spread from the fire origin toward
the ventilation openings where oxygen is more readily available, ultimately promoting flame
spread and subsequently fire growth in this direction. In some cases, the mixing of air and
gaseous fuel occurs further away from the ventilation opening creating a cooling effect at the
initial point of air entry subsequently reducing the damage at that point [2]. As an example, it is
5
possible that the influx of fresh air at a ventilation opening has enough velocity to extend fire
conditions beyond that vent toward the interior of the compartment [2]. Any solid object that
obstructs or interferes with these flows will be the recipient of intense heat fluxes.
In further detail of transitioning to flashover in a compartment, an upper gas layer is formed
with increasing thickness and temperature. The position of this upper gas layer affects the
ventilation parameters by controlling the size of the vents, which decreases their effective area as
the layer descends [4]. This can cause a fire to develop to a point where it produces more
gaseous fuels than can be consumed in the compartment with the available air yielding a
ventilation-limited fire [4]. Having a ventilation-limited fire with insufficient oxygen causes the
HRR of the fire to decrease in a direct relationship to the area (𝐴) and height (ℎ) of the
ventilation openings as shown below:
�̇� ∝ 𝐴√ℎ
As the resulting upper gas layer from flashover continues to descend, the dimensions of the
effective ventilation opening also decrease as does the energy release and size of the fire. These
ventilation openings directly control the growth or decay of the fire. A more likely scenario for a
compartment fire is to have dynamic ventilation conditions meaning the opening of previously
closed vents (for example, window breakage or door opening), which create an increase in
compartment ventilation resulting in a fuel-controlled condition. This also increases the HRR
and size of the fire with the previously mentioned equation. Dynamic vents also promote flame
spread because an opening such as a window could break part way through a compartment fire,
altering the direction of incoming air. There can be enough velocity with this flow to push the
flames in a specified direction or to draw the flames towards the opening, causing the fire to
spread across the compartment. The ventilation parameters of a compartment fire are very
influential to the growth and spread of the fire; however, irrespective of where the fire started or
where fuel items are located, flaming fire conditions will consistently exist only in areas near
oxygen-supplying vents [2].
2.3 Fire Dynamics Simulator (FDS) Fire Dynamics Simulator (FDS) is a computational fluid dynamics (CFD) model of fire-
driven fluid flow. This software numerically solves a form of the Navier-Stokes equations
appropriate for low-speed, thermally driven flow, with an emphasis on smoke and heat transport
from fires. This report utilized version 6.2.0 of FDS with a compilation date of April 11, 2015
[6]. As a supplementary program to FDS, Smokeview (SMV) is a scientific visualization
program that was developed to display the results of an FDS model computation in a three-
dimensional animation. Both FDS and Smokeview are free to download open-source software
tools provided by the National Institute of Standards and Technology (NIST) [7].
6
2.3.1 FDS Fire Modeling
The main function of FDS is to solve practical fire problems, as well as provide a tool to
study fundamental fire dynamics and combustion. Fire protection engineers and fire researchers
use FDS when trying to model low speed transport of heat and combustion products from fire. It
is also commonly used to calculate radiative and convective heat transfer between gases and
solid surfaces, pyrolysis, flame spread and fire growth [6].
FDS computes the density, velocity, temperature, pressure and species concentration of
the gas in each cell as it steps through time. Based on the laws of conservation of mass,
momentum, species, and energy, the model tracks the generation and movement of fire gases. All
solid surfaces are assigned thermal boundary conditions, plus information about their burning
behavior. Computer simulations have been demonstrated to be a credible tool, when properly
applied, to help fill in critical details of a fire incident. NIST has previously used FDS
simulations to [8]:
1. Examine the effect of fire-induced flow paths (including temperature, pressure,
and fire conditions)
2. Simulate and analyze fire phenomena (with associated uncertainties), including
fire spread, smoke movement, tenability and operation of active and passive fire
protection systems
3. Provide visualizations of the fire behavior that are representative of the
conditions that members of a fire departments are likely to experience during
the course of their interior operations
With these previous applications, FDS was identified as a suitable tool to provide
valuable insight into fire induced flow paths, flame spread, and ventilation induced smoke
movement. The results of FDS simulations are exported .csv files that record quantities such as a
fire’s heat release rate (HRR) output. In addition, Smokeview has the ability to take FDS results
and display contours of its calculation results such as temperature, velocity and gas concentration
in planar slices.
2.3.1.1 FDS Experiment Validation
The FDS validation guide divides the various examples of validation studies into two
classes. The first being design applications for which the heat release rate (HRR) of the fire is
specified as an input to the model and secondly forensic reconstruction for which the HRR is
predicted by the model [9]. Design applications are generally used for existing or new building
designs to predict the transport of heat and combustion products throughout an area of interest.
However, detailed descriptions of building contents are usually not necessary due to the user
prescribed burning rate of the materials [10].
Forensic reconstructions require the model to simulate fire scenes based on information
collected after an event, such as personal accounts, unburned materials and burn patterns. The
7
purpose of the simulation is to connect a sequence of discrete observations with a continuous
description of the fire dynamics. Usually, reconstructions involve more emphasis on such
phenomena as heat transfer to surfaces, pyrolysis, and flame spread because virtually all objects
in a given room are potentially ignitable, especially when flashover occurs. In general, forensic
reconstructions are more challenging simulations to perform because they require more detailed
information about the room contents, and there is much greater uncertainty in the total HRR as
the fire spreads from object to object. [10]
The FDS simulations described in this report have elements of both design and forensic
reconstructions. The individual fuel packages, that will be discussed later in the report, were
modeled after actual burn tests conducted by the ATF. Subsequently, the HRR of each fuel
package was predefined based on the results of those live tests. Modeling the full-scale
compartments involved a forensic reconstruction. Even though the individual fuel packages that
composed the compartment had specified HRRs, FDS was used to simulate how the fire would
spread throughout the room. As stated previously, this involves simulating heat transfer to
surfaces and flame spread, which are both elements of forensic reconstruction.
8
3 ATF Tests The ATF conducted a series of four separate tests in “identical” compartments to obtain a
better understanding of the differences in fire conditions, specifically fire growth, spread and
resulting damage due to variation in initial ventilation condition and initial ignition location. In
addition, individual fuel packages were burned under calorimeter to measure the heat release
rates (HRR), which determines fire growth and development. The fuel packages included a
beanbag chair, bookcase, desk, desk chair, dresser, mattress, and an upholstered chair. The
ignition source that was used to ignite the individual fuel packages consisted of gauze pad
soaked in 250 ml. of gasoline. The ignition scenario for all four compartment tests consisted of
the same ignition source adjacent to the beanbag chair. The peak HRR of all the fuel packages
measured during the ATF calorimeter tests are displayed in this section. The test set-ups of the
fuel packages under the calorimeter hood and the structure of the compartment tests can be seen
in Appendix A and B, respectively.
3.1 Individual Fuel Packages The ignition source used to ignite the individual fuel packages was measured to have a
peak HRR of 40 kW.
3.1.1 Polystyrene Based Fuel Packages
The fuel package that consisted of polystyrene was the beanbag chair. Beanbags are
commonly filled with little foam beads that are made of expandable polystyrene (EPS).
Expanded polystyrene is primarily made of styrene monomer (C8H8) and expanded due to
heating to form a cellular structure. When EPS is exposed to temperatures above 100°C, it begins
to melt, and at higher temperatures the decomposition of the melted products produces gaseous
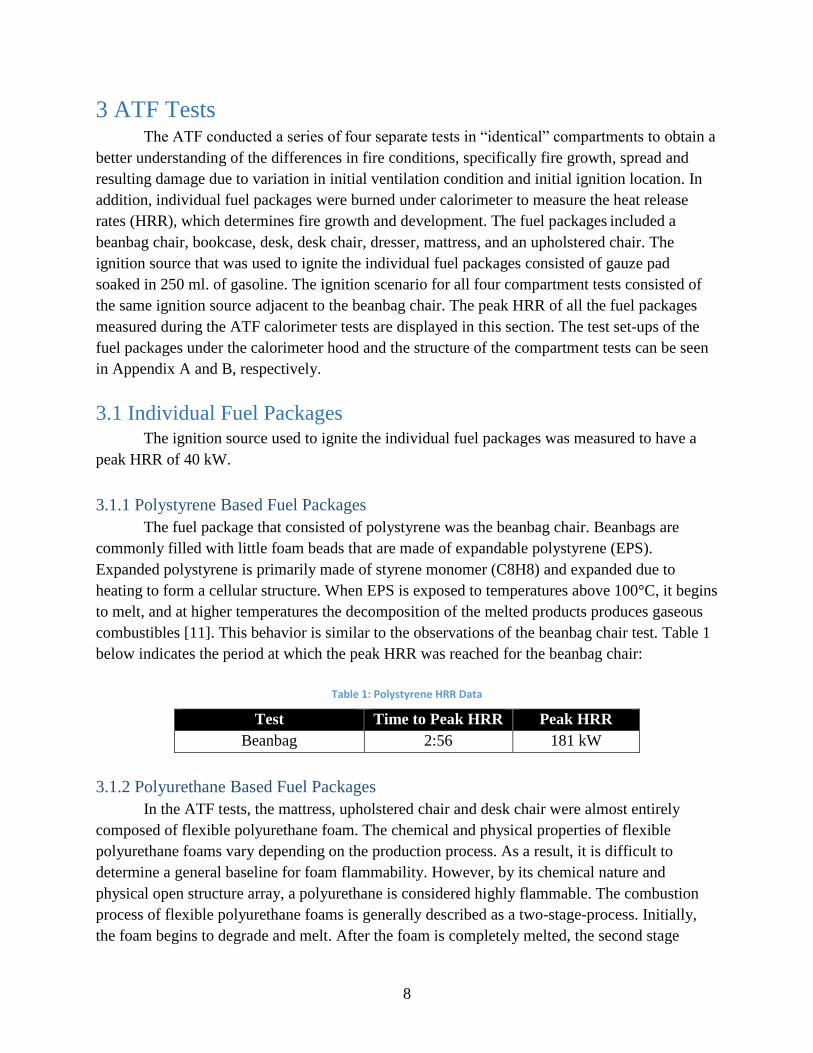
combustibles [11]. This behavior is similar to the observations of the beanbag chair test. Table 1
below indicates the period at which the peak HRR was reached for the beanbag chair:
Table 1: Polystyrene HRR Data
Test Time to Peak HRR Peak HRR
Beanbag 2:56 181 kW
3.1.2 Polyurethane Based Fuel Packages
In the ATF tests, the mattress, upholstered chair and desk chair were almost entirely
composed of flexible polyurethane foam. The chemical and physical properties of flexible
polyurethane foams vary depending on the production process. As a result, it is difficult to
determine a general baseline for foam flammability. However, by its chemical nature and
physical open structure array, a polyurethane is considered highly flammable. The combustion
process of flexible polyurethane foams is generally described as a two-stage-process. Initially,
the foam begins to degrade and melt. After the foam is completely melted, the second stage
9
begins leaving only the pool fire to burn. Similar to polystyrene based fuel packages, the melt-
drip is a complicated solid-liquid transition for which the current FDS framework is not able to
capture.
During the fire tests, the upholstered chair experienced significant dripping and pooling
of combustible material as compared to the other two fuel packages. This initial pooling delayed
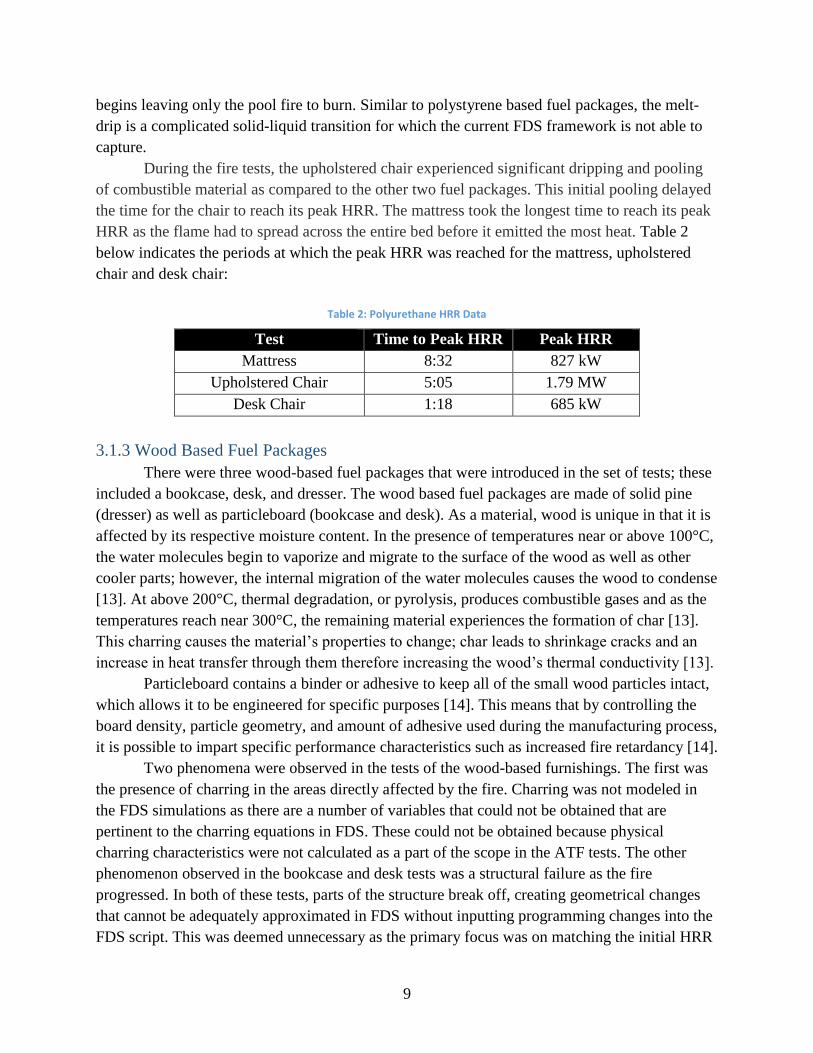
the time for the chair to reach its peak HRR. The mattress took the longest time to reach its peak
HRR as the flame had to spread across the entire bed before it emitted the most heat. Table 2
below indicates the periods at which the peak HRR was reached for the mattress, upholstered
chair and desk chair:
Table 2: Polyurethane HRR Data
Test Time to Peak HRR Peak HRR
Mattress 8:32 827 kW
Upholstered Chair 5:05 1.79 MW
Desk Chair 1:18 685 kW
3.1.3 Wood Based Fuel Packages
There were three wood-based fuel packages that were introduced in the set of tests; these
included a bookcase, desk, and dresser. The wood based fuel packages are made of solid pine
(dresser) as well as particleboard (bookcase and desk). As a material, wood is unique in that it is
affected by its respective moisture content. In the presence of temperatures near or above 100°C,
the water molecules begin to vaporize and migrate to the surface of the wood as well as other
cooler parts; however, the internal migration of the water molecules causes the wood to condense
[13]. At above 200°C, thermal degradation, or pyrolysis, produces combustible gases and as the
temperatures reach near 300°C, the remaining material experiences the formation of char [13].
This charring causes the material’s properties to change; char leads to shrinkage cracks and an
increase in heat transfer through them therefore increasing the wood’s thermal conductivity [13].
Particleboard contains a binder or adhesive to keep all of the small wood particles intact,
which allows it to be engineered for specific purposes [14]. This means that by controlling the
board density, particle geometry, and amount of adhesive used during the manufacturing process,
it is possible to impart specific performance characteristics such as increased fire retardancy [14].
Two phenomena were observed in the tests of the wood-based furnishings. The first was
the presence of charring in the areas directly affected by the fire. Charring was not modeled in
the FDS simulations as there are a number of variables that could not be obtained that are
pertinent to the charring equations in FDS. These could not be obtained because physical
charring characteristics were not calculated as a part of the scope in the ATF tests. The other
phenomenon observed in the bookcase and desk tests was a structural failure as the fire
progressed. In both of these tests, parts of the structure break off, creating geometrical changes
that cannot be adequately approximated in FDS without inputting programming changes into the
FDS script. This was deemed unnecessary as the primary focus was on matching the initial HRR
10
curve development of the tests. Table 3 below indicates the periods at which the peak HRR was
reached for the bookcase, desk and dresser:
Table 3: Wood HRR Data
Test Time to Peak HRR Peak HRR
Bookcase 2:44 209 kW
Desk 6:16 271 kW
Dresser 5:00 1.51 MW
3.2 Full-Scale As previously mentioned, there were four full-scale tests involved in analyzing the effects
of varying the ventilation and fire origin within a compartment. The following sections discuss
the test structure and the instrumentation that were used to collect the data
3.2.1 Compartment Structure
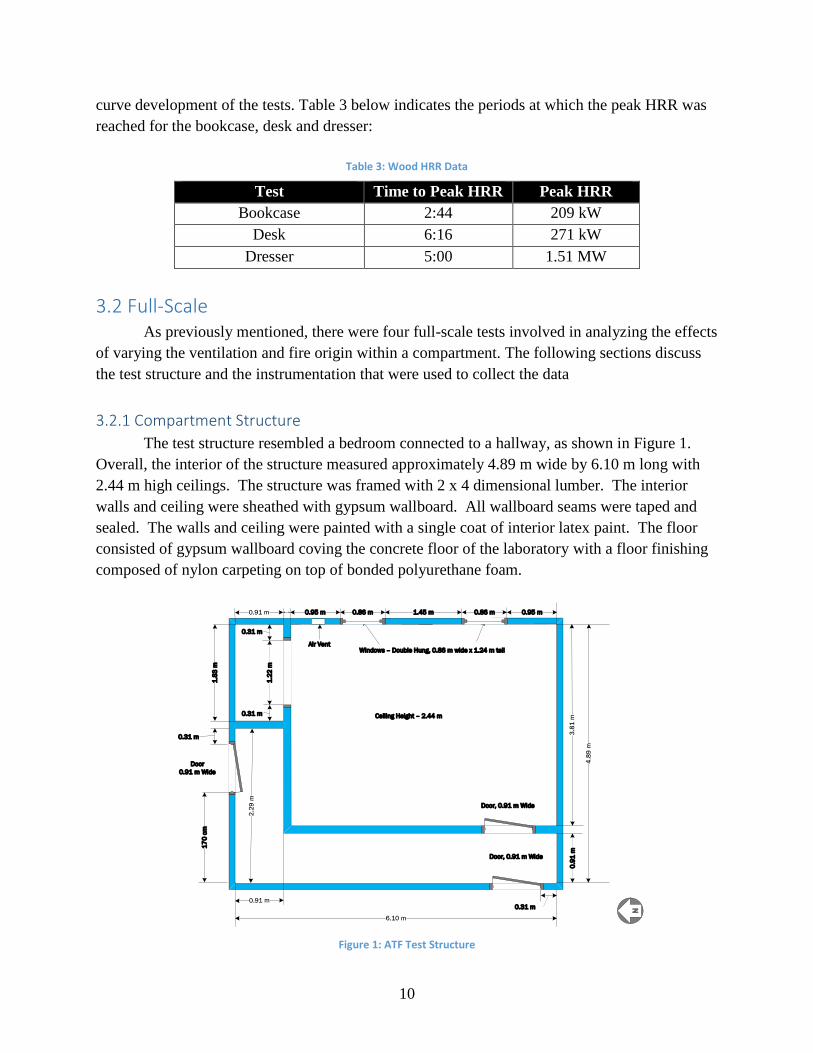
The test structure resembled a bedroom connected to a hallway, as shown in Figure 1.
Overall, the interior of the structure measured approximately 4.89 m wide by 6.10 m long with
2.44 m high ceilings. The structure was framed with 2 x 4 dimensional lumber. The interior
walls and ceiling were sheathed with gypsum wallboard. All wallboard seams were taped and
sealed. The walls and ceiling were painted with a single coat of interior latex paint. The floor
consisted of gypsum wallboard coving the concrete floor of the laboratory with a floor finishing
composed of nylon carpeting on top of bonded polyurethane foam.
Figure 1: ATF Test Structure
0.31 m
1.2
2 m
0.9
1 m
0.95 m0.95 m
Door, 0.91 m Wide
Door, 0.91 m Wide
1.45 m 0.86 m0.86 m
1.8
3 m
17
0 c
m
0.31 m
Door
0.91 m Wide
0.31 m
0.31 m
Ceiling Height – 2.44 m
Windows – Double Hung, 0.86 m wide x 1.24 m tallAir Vent
11
Two double hung windows (0.86 m wide x 1.24 m high) were located in the bedroom. A
hollow core door (0.91 m wide) separated the bedroom from the hallway. Two hollow core
doors (0.91 m wide) were also located in the hallway and opened to the exterior space within the
laboratory. One door was directly opposite of the bedroom door, while the other was at the end
of the hallway. In each test, the bedroom door remained opened and one of the two hallway
doors were open. In addition, both windows were closed at the start of the test. An air vent was
also located on one of the bedroom walls near the floor. An adjustable vent was attached to a
section of circular heating, ventilating, and air conditioning (HVAC) duct, which was open to the
laboratory space. In all but test 3, the vent was is the open position.
For identification purposes, the test structures was divided into two sections: the bedroom
and the hallway. Furthermore, the bedroom was further divided into quadrants, which were
identified as Quadrants 1-4 on the drawings and figures.
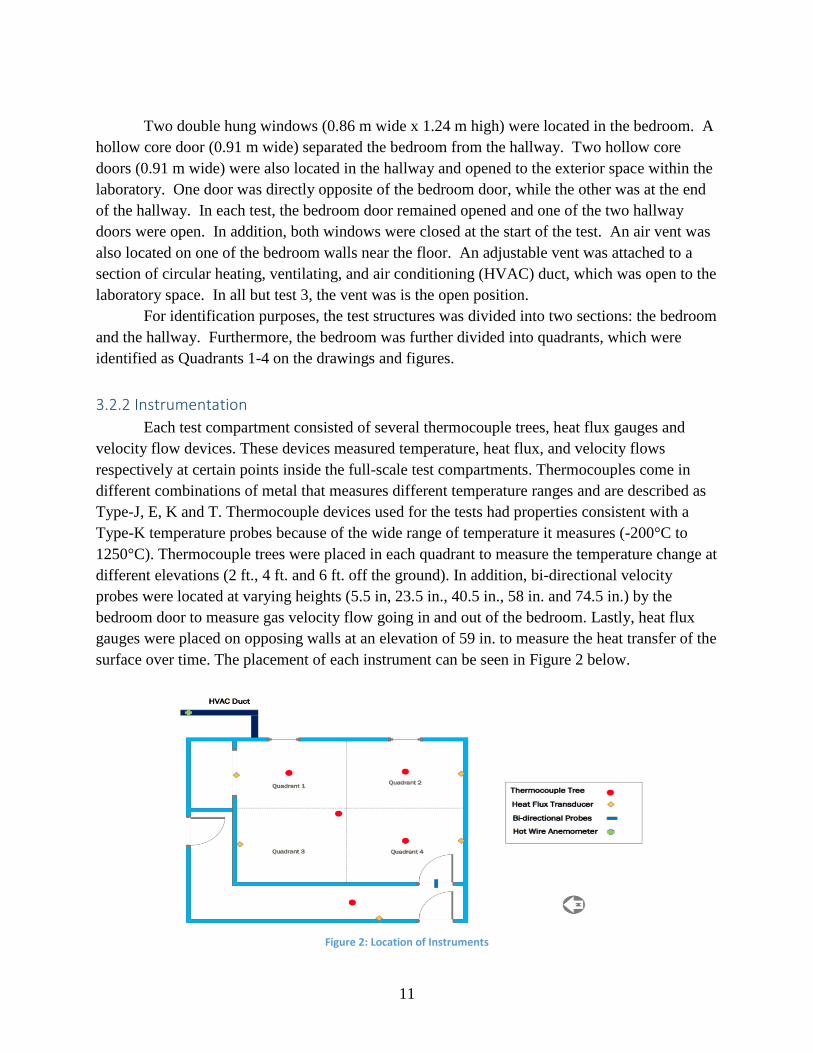
3.2.2 Instrumentation
Each test compartment consisted of several thermocouple trees, heat flux gauges and
velocity flow devices. These devices measured temperature, heat flux, and velocity flows
respectively at certain points inside the full-scale test compartments. Thermocouples come in
different combinations of metal that measures different temperature ranges and are described as
Type-J, E, K and T. Thermocouple devices used for the tests had properties consistent with a
Type-K temperature probes because of the wide range of temperature it measures (-200°C to
1250°C). Thermocouple trees were placed in each quadrant to measure the temperature change at
different elevations (2 ft., 4 ft. and 6 ft. off the ground). In addition, bi-directional velocity
probes were located at varying heights (5.5 in, 23.5 in., 40.5 in., 58 in. and 74.5 in.) by the
bedroom door to measure gas velocity flow going in and out of the bedroom. Lastly, heat flux
gauges were placed on opposing walls at an elevation of 59 in. to measure the heat transfer of the
surface over time. The placement of each instrument can be seen in Figure 2 below.
Figure 2: Location of Instruments
12
3.2.3 Contents of Structure
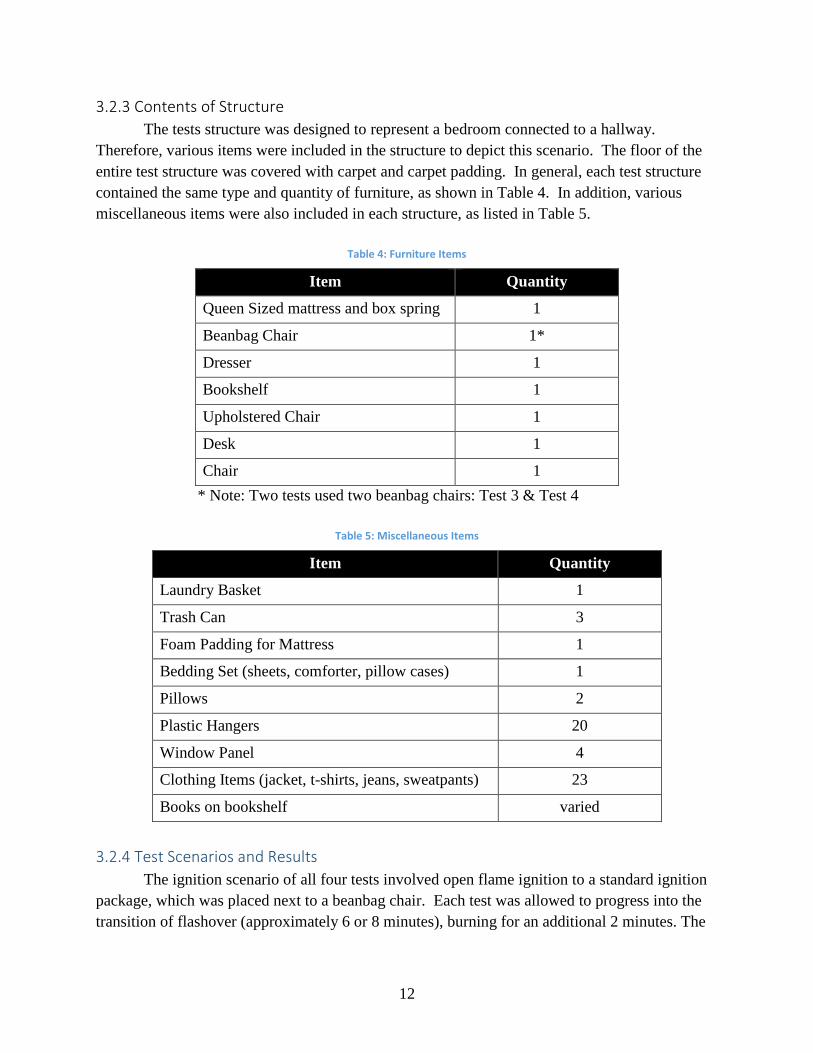
The tests structure was designed to represent a bedroom connected to a hallway.
Therefore, various items were included in the structure to depict this scenario. The floor of the
entire test structure was covered with carpet and carpet padding. In general, each test structure
contained the same type and quantity of furniture, as shown in Table 4. In addition, various
miscellaneous items were also included in each structure, as listed in Table 5.
Table 4: Furniture Items
Item Quantity
Queen Sized mattress and box spring 1
Beanbag Chair 1*
Dresser 1
Bookshelf 1
Upholstered Chair 1
Desk 1
Chair 1
* Note: Two tests used two beanbag chairs: Test 3 & Test 4
Table 5: Miscellaneous Items
Item Quantity
Laundry Basket 1
Trash Can 3
Foam Padding for Mattress 1
Bedding Set (sheets, comforter, pillow cases) 1
Pillows 2
Plastic Hangers 20
Window Panel 4
Clothing Items (jacket, t-shirts, jeans, sweatpants) 23
Books on bookshelf varied
3.2.4 Test Scenarios and Results
The ignition scenario of all four tests involved open flame ignition to a standard ignition
package, which was placed next to a beanbag chair. Each test was allowed to progress into the
transition of flashover (approximately 6 or 8 minutes), burning for an additional 2 minutes. The
13
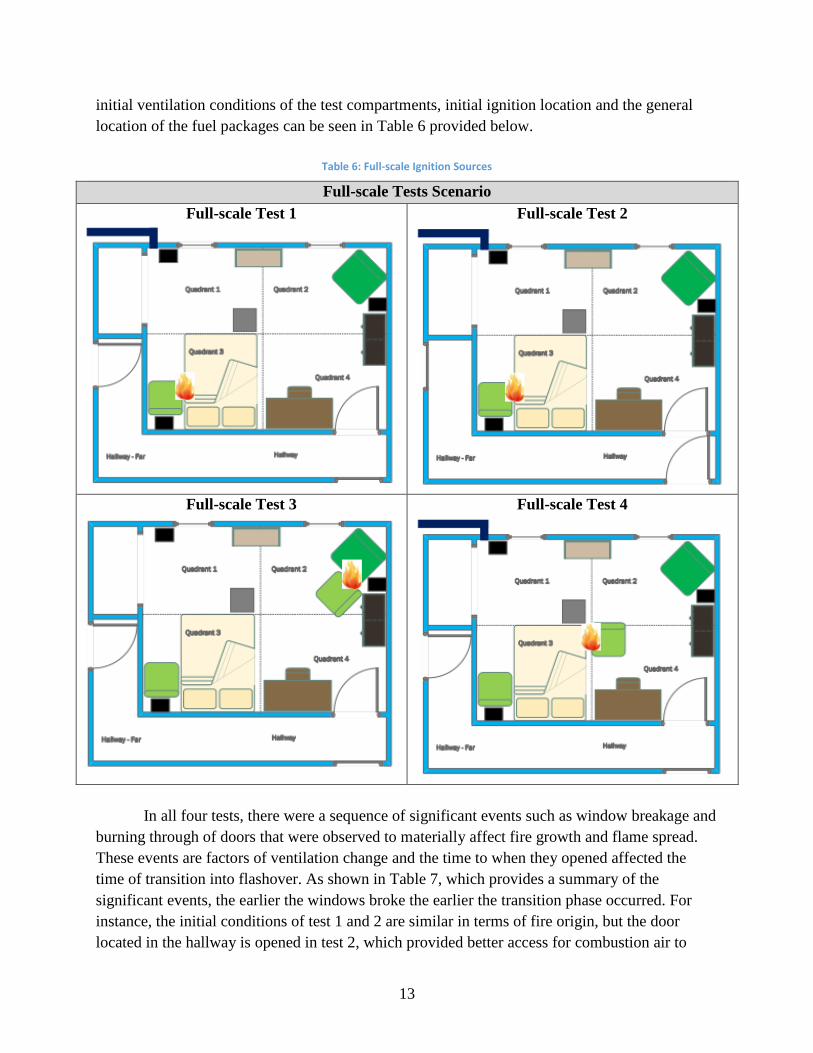
initial ventilation conditions of the test compartments, initial ignition location and the general
location of the fuel packages can be seen in Table 6 provided below.
Table 6: Full-scale Ignition Sources
Full-scale Tests Scenario
Full-scale Test 1 Full-scale Test 2
Full-scale Test 3 Full-scale Test 4
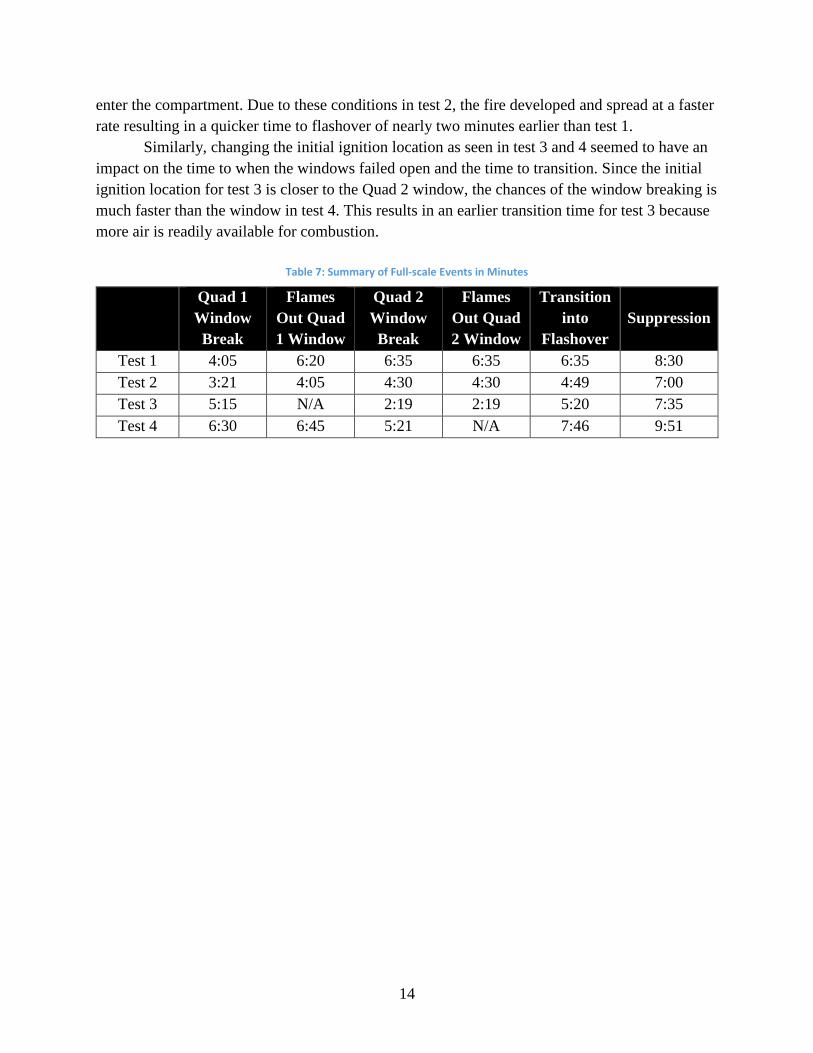
In all four tests, there were a sequence of significant events such as window breakage and
burning through of doors that were observed to materially affect fire growth and flame spread.
These events are factors of ventilation change and the time to when they opened affected the
time of transition into flashover. As shown in Table 7, which provides a summary of the
significant events, the earlier the windows broke the earlier the transition phase occurred. For
instance, the initial conditions of test 1 and 2 are similar in terms of fire origin, but the door
located in the hallway is opened in test 2, which provided better access for combustion air to
14
enter the compartment. Due to these conditions in test 2, the fire developed and spread at a faster
rate resulting in a quicker time to flashover of nearly two minutes earlier than test 1.
Similarly, changing the initial ignition location as seen in test 3 and 4 seemed to have an
impact on the time to when the windows failed open and the time to transition. Since the initial
ignition location for test 3 is closer to the Quad 2 window, the chances of the window breaking is
much faster than the window in test 4. This results in an earlier transition time for test 3 because
more air is readily available for combustion.
Table 7: Summary of Full-scale Events in Minutes
Quad 1
Window
Break
Flames
Out Quad
1 Window
Quad 2
Window
Break
Flames
Out Quad
2 Window
Transition
into
Flashover
Suppression
Test 1 4:05 6:20 6:35 6:35 6:35 8:30
Test 2 3:21 4:05 4:30 4:30 4:49 7:00
Test 3 5:15 N/A 2:19 2:19 5:20 7:35
Test 4 6:30 6:45 5:21 N/A 7:46 9:51

15
4 Modeling Procedures The modeling approach for this study was broken down into two different parts. The first
part was to model the fuel packages individually to match the heat release rates (HRR) data of
the ATF tests. The second part was to incorporate the modeled fuel packages into the full-scale
model and add instrumentation devices such as thermocouples, velocity probes and heat flux
gauges to collect data.
4.1 Numerical Mesh The computational cell size needs to be specified since CFD models use a numerical grid
to solve a form of the conservation of mass, momentum, and energy equations. The non-
dimensional expression, D*/δx, can be used to estimate how well a flow field is measured. D* is
the characteristic fire diameter and δx is the nominal size of a mesh cell. From the FDS User’s
guide, [6] the characteristic fire diameter can be calculated by the equation:
𝐷∗ = (𝑄
𝜌∞𝑐𝑝𝑇∞√𝑔)
25⁄
where Q is the maximum heat release rate of the fire, , cp, T is the density, specific heat, and
temperature of the ambient air respectively and g is the gravitational force of earth [12]. Based
on the validation work performed for the U.S. Nuclear Regulatory Commission, D*/δx ratios
ranged between 4 and 16 are used to accurately resolve fires [13]. A ratio of 16 describes finer
cell size as a ratio of 4 describes coarser cell size. Finer grid cells allow for more computational
cells to span the characteristic fire diameter resulting in better calculations. However, the more
cells there are to compute, the longer the calculation will take. The D*/dx ratios for the fuel
package models in our study fell within the range when using 7 cm. grid spacing as shown in
Table 8 below. This allowed for quick and accurate simulations. The same grid spacing was used
for the full-scale models in order for the fuel packages to produce the same HRR when modeled
individually.
Table 8: D*/dx Ratio for all Models
FDS Model Peak HRR D* D*/dx
Bean Bag Chair 181 kW 0.484 6.9
Book Case 209 kW 0.513 7.3
Desk 271 kW 0.569 8.1
Desk Chair 685 kW 0.824 11.8
Dresser 1.51MW 1.128 16.1
Mattress 827 kW 0.889 12.7
Upholstered Chair 1.79 MW 1.21 17.3
Full-scale 1 6.5 MW 2.028 28.9
Full-scale 2 7.0 MW 2.089 29.8
Full-scale 3 7.2 MW 2.112 30.2
Full-scale 4 6.9 MW 2.077 29.7
16
4.2 Modeling Procedure for Fuel Packages
4.2.1 Geometry
Furniture and other fuels in FDS need to be specified as rectangular blocks with no
sloped or curved surfaces. FDS takes the input coordinate values of the furnishings and adjusts
them to match the grid cell boundaries of the computational domain. As a result, using exact
measurements may affect the geometry of the fuel packages by either growing or shrinking to
match the grid. In these cases, the input coordinate values were changed by the user to match the
grid for a proportional representation of the fuel packages.
4.2.2 Material Properties
It is essential to specify the thermo-chemical material properties of a solid object in FDS
to calculate the fire development and growth for a certain fire scenario. These material properties
include density, specific heat, thermal conductivity, heat of combustion and ignition temperature.
The density of a material is the ratio of its mass to its volume. As a property, density represents
the physical form of a material and affects the ease with which a solid may be ignited by
influencing thermal inertia. This characterizes the rate of surface temperature rise for a material
when exposed to heat. Low values of thermal inertia lead to increased surface temperatures for a
certain heat flux and therefore, to a more rapid ignition [4]. The specific heat of a material
describes the amount of heat it absorbs as its temperature increases. Specifically, it is the amount
of thermal energy required to raise one unit of mass of the material by one degree [4]. A higher
thermal conductivity transfers heat through a material faster, thereby slowing the storage of heat
at surface and increasing the time to ignition temperature. Conversely, a low thermal
conductivity would mean that the material readily stores heat, lowering the time to ignition [4].
Thermal conductivity depends upon the temperature, composition, and orientation of the
structure [14]. Heat of combustion is the amount of energy produced for each unit of fuel mass
burned. The effect of chemical composition on “ease of ignition” is affected by the heat of
combustion of a material. If the heat of combustion is high, then more energy will be available to
sustain flaming after ignition [4]. These thermo-chemical properties influence how fuel surface
cells in FDS heat up. Once a specific area of the fuel surface, as characterized by the
computational cell size, reaches a user specified ignition temperature, that particular cell will
ignite and being to burn.
The thermo-chemical properties for each fuel were not readily determined nor provided
as part of the ATF test program. Values were determined through research of reference literature
such as the fourth edition of the Society of Fire Protection Handbook [14], the Ignition
Handbook [15], and the UMD burning material databases [16]. The list of fuels and their thermo-
chemical properties used in the FDS simulations are provided in the Table 9 below. Since the
literature sources had different values of material properties, the average value was determined
and used. A sensitivity analysis was performed to see the overall effect of the range of values
17
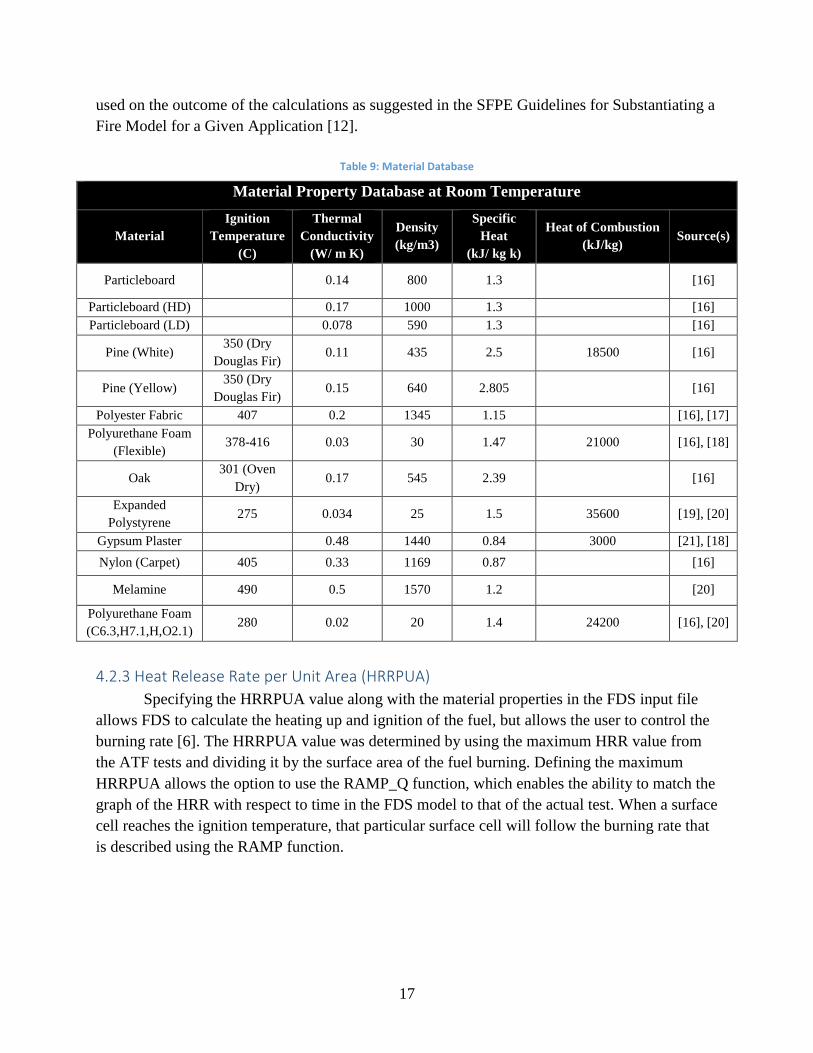
used on the outcome of the calculations as suggested in the SFPE Guidelines for Substantiating a
Fire Model for a Given Application [12].
Table 9: Material Database
Material Property Database at Room Temperature
Material Ignition
Temperature
(C)
Thermal
Conductivity
(W/ m K)
Density
(kg/m3)
Specific
Heat (kJ/ kg k)
Heat of Combustion
(kJ/kg) Source(s)
Particleboard 0.14 800 1.3 [16]
Particleboard (HD) 0.17 1000 1.3 [16]
Particleboard (LD) 0.078 590 1.3 [16]
Pine (White) 350 (Dry
Douglas Fir) 0.11 435 2.5 18500 [16]
Pine (Yellow) 350 (Dry
Douglas Fir) 0.15 640 2.805 [16]
Polyester Fabric 407 0.2 1345 1.15 [16], [17]
Polyurethane Foam
(Flexible) 378-416 0.03 30 1.47 21000 [16], [18]
Oak 301 (Oven
Dry) 0.17 545 2.39 [16]
Expanded
Polystyrene 275 0.034 25 1.5 35600 [19], [20]
Gypsum Plaster 0.48 1440 0.84 3000 [21], [18]
Nylon (Carpet) 405 0.33 1169 0.87 [16]
Melamine 490 0.5 1570 1.2 [20]
Polyurethane Foam
(C6.3,H7.1,H,O2.1) 280 0.02 20 1.4 24200 [16], [20]
4.2.3 Heat Release Rate per Unit Area (HRRPUA)
Specifying the HRRPUA value along with the material properties in the FDS input file
allows FDS to calculate the heating up and ignition of the fuel, but allows the user to control the
burning rate [6]. The HRRPUA value was determined by using the maximum HRR value from
the ATF tests and dividing it by the surface area of the fuel burning. Defining the maximum
HRRPUA allows the option to use the RAMP_Q function, which enables the ability to match the
graph of the HRR with respect to time in the FDS model to that of the actual test. When a surface
cell reaches the ignition temperature, that particular surface cell will follow the burning rate that
is described using the RAMP function.
18
4.2.4 Sensitivity Analysis
An informative approach for evaluating the effect of model input is to assess the
proportionality of an FDS simulated output to an input parameter. Otherwise referred to as a
Power Dependence sensitivity analysis [12]. The input parameters that were tested included
thermal properties such as density, specific heat, thermal conductivity, ignition temperature and
where applicable heat of combustion. Each thermal property had three iterations which included
the actual input value used for the individual fuel package runs and ±10% of that value. By
examining the relationship of model outcome to input, the modeler would be able to identify the
relative importance of the input. The outcome of this analysis will provide evidence to further
investigate specific material and thermal properties in order to reduce uncertainty in further
studies. The equation used for this sensitivity analysis is depicted below:
𝑥 = 𝐹𝐷𝑆 𝐶𝑎𝑙𝑐𝑢𝑙𝑎𝑡𝑒𝑑 𝐻𝑅𝑅
𝑦 = ±10% 𝑇ℎ𝑒𝑟𝑚𝑎𝑙 𝑃𝑟𝑜𝑝𝑒𝑟𝑡𝑦 𝐶𝑎𝑙𝑐𝑢𝑙𝑎𝑡𝑒𝑑 𝐻𝑅𝑅
𝑃𝑜𝑤𝑒𝑟 𝐷𝑒𝑝𝑒𝑛𝑑𝑒𝑛𝑐𝑒 % =|𝑥 − 𝑦|
𝑥∗ 100
4.2.5 Standard Ignition Package (SIP)
Modeling the SIP was kept simple to recognize its role in the overall event. Since the SIP
consists of gauze and liquid, they are going to be merged and essentially act as a single solid fuel
package. The SIP was modeled in FDS as an obstruction with a surface that specifies the
ramping HRR.
4.2.6 Beanbag
During the beanbag chair burn test, the melting and pooling phenomenon was observed,
but these phenomena is not simulated by FDS. There were two ways to modeling the beanbag
chair; one way was to attempt to use several functions of FDS to mimic the melting of the
beanbag chair and the other way was to simply control the burning rate by using the ramp
function in case the melting phenomenon could not be replicated. In an attempt to model the
melting phenomenon, the burn away function was used to mimic the melting of the beanbag
chair. The burn away function allows a particular cell to disappear once all of the fuel in that cell
is consumed. When using this function, the fire spread across the chair when certain cells burnt
away, which was observed in the burn test. The pooling of the liquid after the fuel has
completely melted was not modeled, but the HRR curve produced by FDS was similar to the
ATF test. Therefore, a ramp function was not necessary for the beanbag chair.
19
4.2.7 Bookcase
There were two phenomena that were observed which affected the changes in modeling
strategy. The first of these phenomena is the burning away of the back portion of the bookcase.
This piece of particleboard is much thinner than the rest of the frame and shelves, contributing to
its faster decomposition. Eventually, though, the entire structure burns away. To model this, the
back of the bookcase was allowed to burn away while maintaining the structure of the rest of the
frame. This was achieved by specifying two Surface ID's for the fuel, one with burn away and
one without.
The second phenomenon is the physical separation between the shelves and the back of
the bookcase. In theory, there would be no separation between those obstructions, but when the
bookcase was built, there was no sealant introduced to prevent the spread of air between the
shelves and the back of the bookcase. This air gap permits smoke and heat to travel up the back
of the bookcase, contributing to the spread of fire from the bottom shelf to the top. A small gap
was introduced in the model between the middle shelves and the back of the bookcase. This
change allowed for a faster spread of heat and gases along the back of the bookcase. Finally, to
produce a HRR curve in FDS similar to the one produced by the ATF, a ramp function was used
to control the peak energy produced, as well as the decay phase of the simulated fire.
4.2.8 Desk
The desk creates a number of complexities when attempting to model its fire behavior as
it is not a solid object, i.e. it is comprised of a number of objects connected at various surfaces
and separated by volumes of air space. The process of modeling the desk began with applying
the correct material properties identified as particleboard from the manufacturer’s data sheet.
Since particleboard is comprised of wood, we had to replicate the physical structure of the desk
including the air space within the drawers with the use of multiple obstruction lines, as the
burning of wood is dependent upon geometrical factors. This idea is further discussed in section
4.2.10 which addresses a solid wood fuel package. The manufacturer was not specific in the type
of particleboard used, creating uncertainty as there are multiple types all with different thermal
properties. The University of Maryland Burn Database offered properties for a low-density and a
high-density form of particleboard as well as a general particleboard.
The three variations of the material had a wide range in density and thermal conductivity
therefore, they were all explored and compared to the HRR data provided by the ATF.
Ultimately, general particleboard was chosen as its initial HRR growth curve was the most
closely approximated to that of the ATF results and because its thermal properties were at an
average; low-density particleboard resulted in a very early and low energy steady state fire and
high-density particleboard had a very steep growth phase unlike the ATF HRR. Finally, to
produce a heat release rate curve in FDS similar to the one measured by ATF, a ramp function
had to be used to control the peak energy produced as well as the tail end of the FDS simulation.
20
4.2.9 Desk Chair
The modeling procedure for the desk chair was more straightforward when compared to
other fuel packages. However, its composition of solid oak, polyurethane foam and polyester
covering still posed challenges. Due to the polyurethane foam, the desk chair experienced
melting during pyrolysis; subsequently forming a pool fire during the ATF calorimeter test. This
phenomenon hindered our ability to produce an accurate FDS approximation of HRR. In
addition, finding the correct way to input different material layers of a fuel into FDS was a cause
of concern.
The initial iterations of the desk chair simulations involved varying the HRRPUA of the
chair. The HRRPUA was steadily increased from one test to another. In addition, there were
variations in the way the seat and back support of the chair were modeled. Some simulations
combined the two parts as one obstruction with a single HRRPUA while other split the two
obstruction and distributed the HRRPUA accordingly. In the end, we decided to use a single top
obstruction in order to minimize input parameters and simplify our design. To further simplify
the design, particleboard and polyester were excluded from input files leaving foam as the main
material. This final change ultimately resulted in the most accurate simulations since foam was
the main contributor in determining HRR.
4.2.10 Dresser
In modeling the wood dresser, we began with the known values such as the HRRPUA,
which was supplied by the ATF’s tests. Next, it was necessary to replicate the actual physical
structure of the dresser as described in the manufacturer’s data sheet (i.e. drawer space) using
multiple obstruction lines opposed to a single, solid unit. We did this because wood is a complex
composite of natural polymers and is generally anisotropic, heterogeneous and porous meaning
that physical properties depend upon structural geometry and thickness [22]. Using individual
obstructions over a single one allow us to better replicate this aspect of wood-based fuel
packages.
Another challenging aspect of modeling wood-based structures in FDS is the combustion
process known as charring which results in heat generation, flame spread, and dramatic changes
in material properties. Modeling this behavior in FDS is not only very complex but also requires
a lot of very specific information about the type of wood being burned such as the activation
energy, the reference temperature, and the pre-exponential factor [9]. Unfortunately, the
manufacturer’s sheet stated a general “solid pine” as the primary material which limits
knowledge of the thermal properties as there are over 115 different species of pine. Through
literature research, it was found that yellow pine and white pine are commonly used for home
construction or furniture items; however, not all thermal properties could be found which
restricted the team from modeling a char effect on the dresser. Although both variations were
explored through various FDS simulations, white pine was ultimately applied to the model as it
proved to formulate a more accurate peak-HRR; however, ramp functions had to be used to
control the growth and decay stages of the HRR produced by the model.
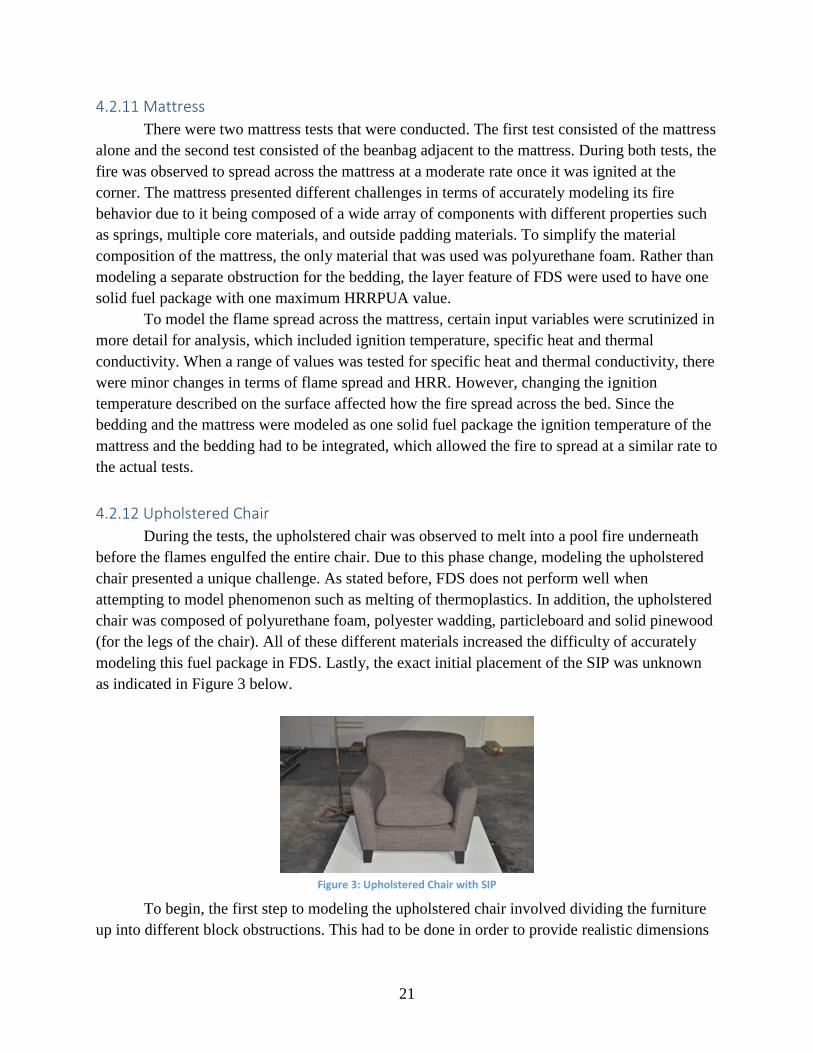
21
4.2.11 Mattress
There were two mattress tests that were conducted. The first test consisted of the mattress
alone and the second test consisted of the beanbag adjacent to the mattress. During both tests, the
fire was observed to spread across the mattress at a moderate rate once it was ignited at the
corner. The mattress presented different challenges in terms of accurately modeling its fire
behavior due to it being composed of a wide array of components with different properties such
as springs, multiple core materials, and outside padding materials. To simplify the material
composition of the mattress, the only material that was used was polyurethane foam. Rather than
modeling a separate obstruction for the bedding, the layer feature of FDS were used to have one
solid fuel package with one maximum HRRPUA value.
To model the flame spread across the mattress, certain input variables were scrutinized in
more detail for analysis, which included ignition temperature, specific heat and thermal
conductivity. When a range of values was tested for specific heat and thermal conductivity, there
were minor changes in terms of flame spread and HRR. However, changing the ignition
temperature described on the surface affected how the fire spread across the bed. Since the
bedding and the mattress were modeled as one solid fuel package the ignition temperature of the
mattress and the bedding had to be integrated, which allowed the fire to spread at a similar rate to
the actual tests.
4.2.12 Upholstered Chair
During the tests, the upholstered chair was observed to melt into a pool fire underneath
before the flames engulfed the entire chair. Due to this phase change, modeling the upholstered
chair presented a unique challenge. As stated before, FDS does not perform well when
attempting to model phenomenon such as melting of thermoplastics. In addition, the upholstered
chair was composed of polyurethane foam, polyester wadding, particleboard and solid pinewood
(for the legs of the chair). All of these different materials increased the difficulty of accurately
modeling this fuel package in FDS. Lastly, the exact initial placement of the SIP was unknown
as indicated in Figure 3 below.
Figure 3: Upholstered Chair with SIP
To begin, the first step to modeling the upholstered chair involved dividing the furniture
up into different block obstructions. This had to be done in order to provide realistic dimensions
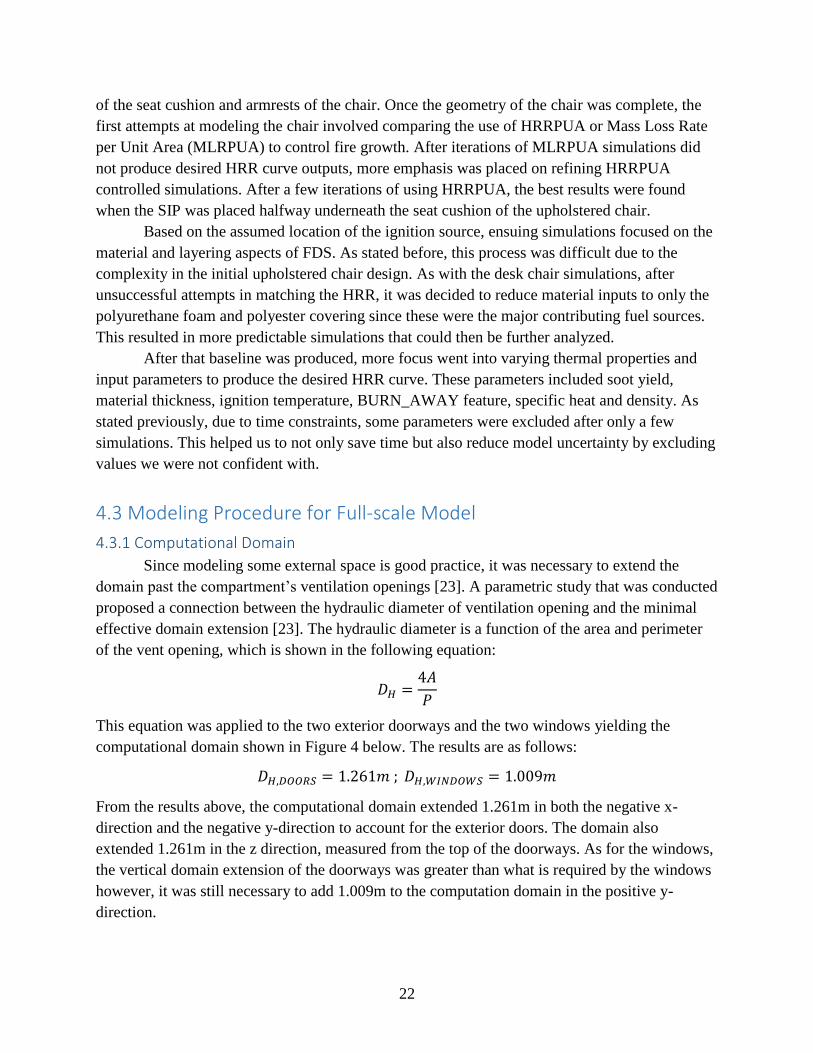
22
of the seat cushion and armrests of the chair. Once the geometry of the chair was complete, the
first attempts at modeling the chair involved comparing the use of HRRPUA or Mass Loss Rate
per Unit Area (MLRPUA) to control fire growth. After iterations of MLRPUA simulations did
not produce desired HRR curve outputs, more emphasis was placed on refining HRRPUA
controlled simulations. After a few iterations of using HRRPUA, the best results were found
when the SIP was placed halfway underneath the seat cushion of the upholstered chair.
Based on the assumed location of the ignition source, ensuing simulations focused on the
material and layering aspects of FDS. As stated before, this process was difficult due to the
complexity in the initial upholstered chair design. As with the desk chair simulations, after
unsuccessful attempts in matching the HRR, it was decided to reduce material inputs to only the
polyurethane foam and polyester covering since these were the major contributing fuel sources.
This resulted in more predictable simulations that could then be further analyzed.
After that baseline was produced, more focus went into varying thermal properties and
input parameters to produce the desired HRR curve. These parameters included soot yield,
material thickness, ignition temperature, BURN_AWAY feature, specific heat and density. As
stated previously, due to time constraints, some parameters were excluded after only a few
simulations. This helped us to not only save time but also reduce model uncertainty by excluding
values we were not confident with.
4.3 Modeling Procedure for Full-scale Model
4.3.1 Computational Domain
Since modeling some external space is good practice, it was necessary to extend the
domain past the compartment’s ventilation openings [23]. A parametric study that was conducted
proposed a connection between the hydraulic diameter of ventilation opening and the minimal
effective domain extension [23]. The hydraulic diameter is a function of the area and perimeter
of the vent opening, which is shown in the following equation:
𝐷𝐻 =4𝐴
𝑃
This equation was applied to the two exterior doorways and the two windows yielding the
computational domain shown in Figure 4 below. The results are as follows:
𝐷𝐻,𝐷𝑂𝑂𝑅𝑆 = 1.261𝑚 ; 𝐷𝐻,𝑊𝐼𝑁𝐷𝑂𝑊𝑆 = 1.009𝑚
From the results above, the computational domain extended 1.261m in both the negative x-
direction and the negative y-direction to account for the exterior doors. The domain also
extended 1.261m in the z direction, measured from the top of the doorways. As for the windows,
the vertical domain extension of the doorways was greater than what is required by the windows
however, it was still necessary to add 1.009m to the computation domain in the positive y-
direction.
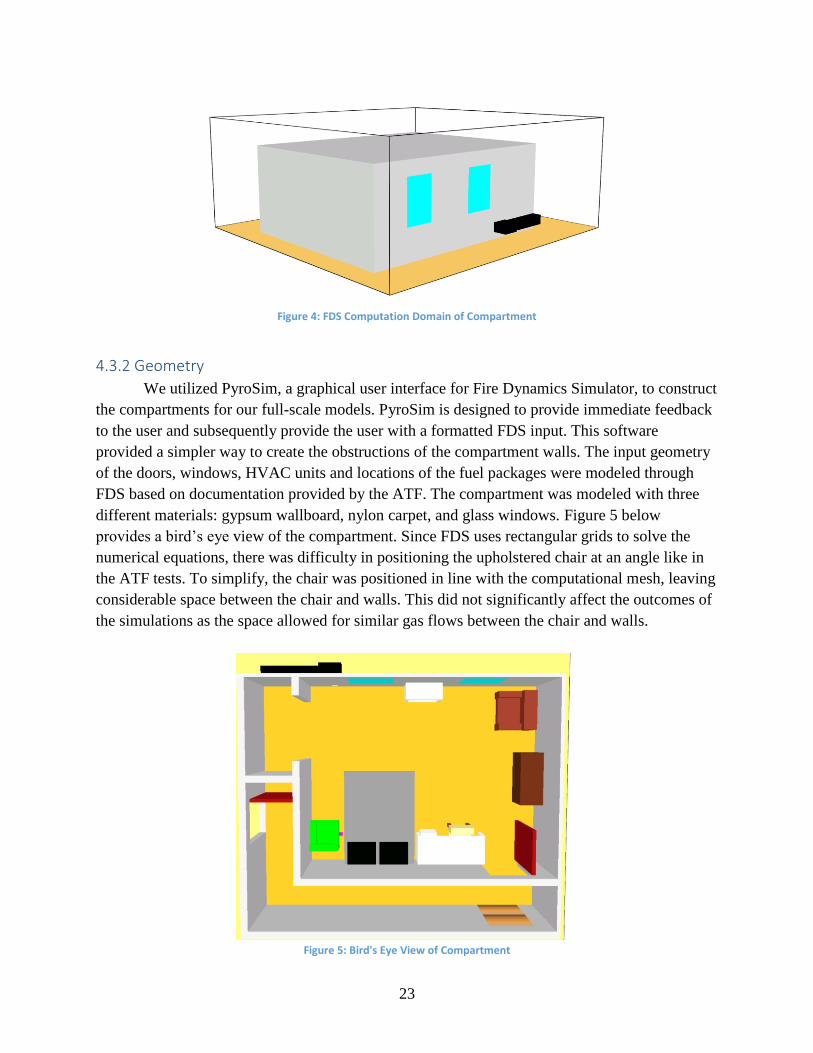
23
Figure 4: FDS Computation Domain of Compartment
4.3.2 Geometry
We utilized PyroSim, a graphical user interface for Fire Dynamics Simulator, to construct
the compartments for our full-scale models. PyroSim is designed to provide immediate feedback
to the user and subsequently provide the user with a formatted FDS input. This software
provided a simpler way to create the obstructions of the compartment walls. The input geometry
of the doors, windows, HVAC units and locations of the fuel packages were modeled through
FDS based on documentation provided by the ATF. The compartment was modeled with three
different materials: gypsum wallboard, nylon carpet, and glass windows. Figure 5 below
provides a bird’s eye view of the compartment. Since FDS uses rectangular grids to solve the
numerical equations, there was difficulty in positioning the upholstered chair at an angle like in
the ATF tests. To simplify, the chair was positioned in line with the computational mesh, leaving
considerable space between the chair and walls. This did not significantly affect the outcomes of
the simulations as the space allowed for similar gas flows between the chair and walls.
Figure 5: Bird's Eye View of Compartment
24
4.3.3 Ventilation
Vents in FDS are openings from the compartment to outside ambient conditions. In our
simulations, vents allow smoke and heat to leave the compartment and fresh air to enter. Vents
may be either simple openings such as open doors or failed windows that allow natural flow to
occur, or may produce a specified flow rate such as the flow from a fan. In the full-scale
simulations, only natural ventilation occurred based on the buoyancy of the hot gases.
The two major sources of ventilation in the full-scale tests are the windows and doors.
There were two windows located on the back wall opposite the bedroom door and three doors
placed throughout the compartment. There was also a passive HVAC vent present in tests 1, 2
and 4. A major factor of these ventilation components is their subsequent failure during the
course of the full-scale burn tests. This failure was important to model due to significant changes
observed in fire conditions following their opening.
The FDS model includes the window as two obstructions to replicate an actual
windowpane. This construction also allowed for independent control for each half of the window
and a more accurate representation of window breakage. Based on research conducted by Dr.
Vytenis Babrauskas, he concluded that for 3 mm thick glass, a gas temperature of 360C resulted
in window failure and at 450C for 4 mm – 6 mm thick glass [24]. Based on his results, a device
located on the center of each window obstruction controlled window failure. Each window in the
simulation was set to fail when the device recorded a gas temperature of 450C.
4.3.4 Devices
The full-scale FDS model incorporated all of the devices previously mentioned in the
ATF full-scale tests. The virtual devices were placed in comparable positions and elevations in
order to allow for a direct comparison between the ATF tests and FDS model results.
Complimentary to the ATF instrumentation, a number of additional virtual thermocouple and
velocity devices were utilized to ascertain a better understanding of the simulated fire dynamics
inside the compartment. Virtual thermocouple trees were placed in the corner of quadrants 1, 2
and 3 and at the bedroom door at elevations of 2 ft., 4 ft., 6 ft. and 8 ft. Along with these devices,
virtual bi-directional velocity probes were placed in each window at 39.8 in., 58.1 in. and 76.4
in. high. In addition, both a virtual thermocouple and velocity probe was inputted into the model
at the HVAC opening. These additional thermocouple and velocity devices allowed for a better
description of the simulated temperature profile and fluid flows leaving and entering the
compartment. The placement of each virtual instrument can be seen in Figure 6 below.
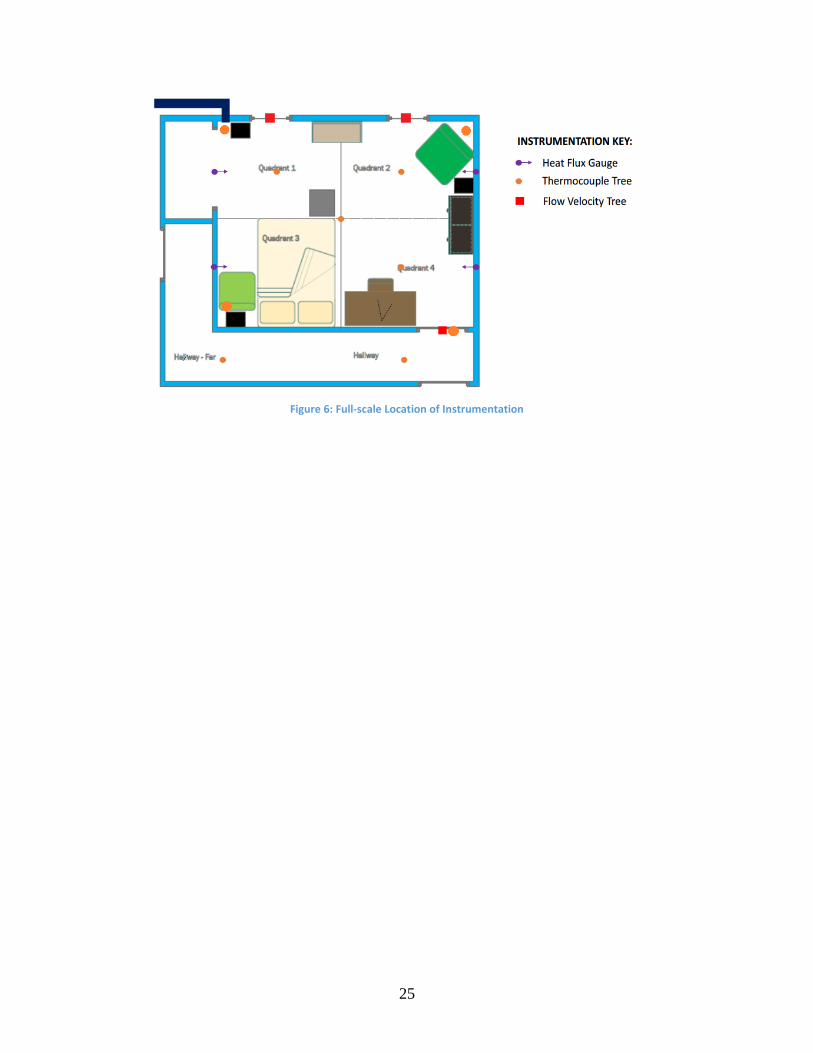
25
Figure 6: Full-scale Location of Instrumentation
26
5 Results As described in Chapter 4.2, each individual fuel package was modeled to match the
simulated HRR curve to the curve recorded during the ATF tests. This was achieved through the
use of RAMP_Q and BURN_AWAY functions. A major factor in the growth of a fire is the
thermal properties associated with each of the fuel packages. The exact materials for each fuel
package were not given; therefore, properties for the fuel packages were determined through
research from reference literature. This presents a level of uncertainty in the inputs and therefore,
a sensitivity analysis was conducted to determine the effect that changing the value of the major
thermal properties has on the fuel packages. The fuel packages were then inputted into the full
scale model, where the ventilation openings were controlled by a temperature dependent
function. The following sections outline the results of the FDS simulations as compared to the
ATF live tests.
5.1 Sensitivity Analysis The focus of the sensitivity analysis was to uncover trends between FDS thermal property
value inputs and the subsequent calculated maximum HRR. This analysis provides insight that
would be helpful in learning how manipulating FDS thermal input values change the simulated
HRR graph. In the context of this project, knowing the sensitivity of each thermal property
would assist in modeling FDS fuel packages to match ATF calorimeter tests.
The results of the sensitivity analysis are presented in Appendix B. The tables display
+10% and -10% values for each thermal property. Both the power dependence and time shift of
peak HRR were calculated for each fuel package. The power dependence illustrates how
sensitive the maximum HRR prediction by FDS is when a change in thermal property value
occurs. In addition, the time shift of the peak HRR gives insight into how the flame propagated
over the fuel package.
Ultimately, the sensitivity analysis could not identify a consistent trend in simulated max
HRR difference and time to max HRR from varying either the density, the specific heat, or the
thermal conductivity. In addition, this analysis found that both specific heat and ignition
temperature produced outlier max HRR dependence values. It was noted that in varying the
either the heat of combustion or the ignition temperature, an increase for the thermal property
constantly led to an increased time to peak while decreasing the value led to quicker peak HRR
times. In a broader context, the sensitivity analysis provided information that shows that the
thermal properties applied to the surface ( 𝑇𝑖𝑔) of an FDS model have a more consistent trend to
the resulting HRR. This suggests that they have a more prominent role in the associated FDS
equations when compared to the material properties (𝑘, 𝜌, 𝑐𝑝).
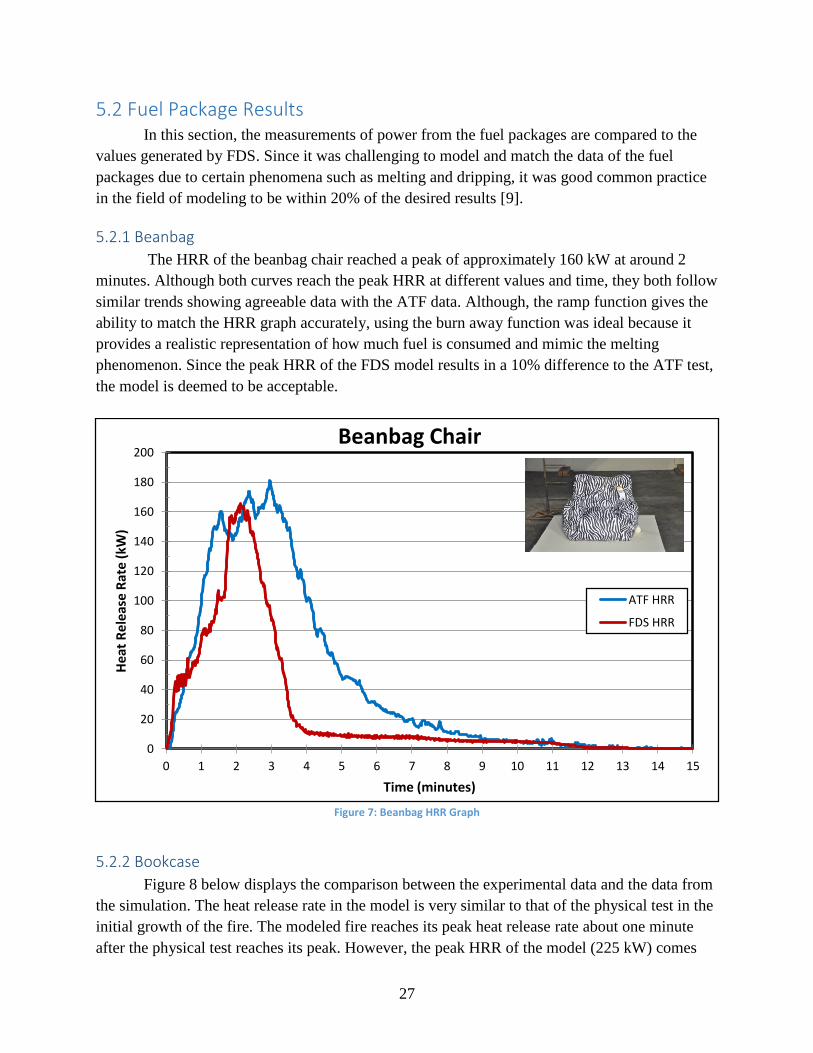
27
5.2 Fuel Package Results In this section, the measurements of power from the fuel packages are compared to the
values generated by FDS. Since it was challenging to model and match the data of the fuel
packages due to certain phenomena such as melting and dripping, it was good common practice
in the field of modeling to be within 20% of the desired results [9].
5.2.1 Beanbag
The HRR of the beanbag chair reached a peak of approximately 160 kW at around 2
minutes. Although both curves reach the peak HRR at different values and time, they both follow
similar trends showing agreeable data with the ATF data. Although, the ramp function gives the
ability to match the HRR graph accurately, using the burn away function was ideal because it
provides a realistic representation of how much fuel is consumed and mimic the melting
phenomenon. Since the peak HRR of the FDS model results in a 10% difference to the ATF test,
the model is deemed to be acceptable.
Figure 7: Beanbag HRR Graph
5.2.2 Bookcase
Figure 8 below displays the comparison between the experimental data and the data from
the simulation. The heat release rate in the model is very similar to that of the physical test in the
initial growth of the fire. The modeled fire reaches its peak heat release rate about one minute
after the physical test reaches its peak. However, the peak HRR of the model (225 kW) comes
0
20
40
60
80
100
120
140
160
180
200
0 1 2 3 4 5 6 7 8 9 10 11 12 13 14 15
Hea
t R
ele
ase
Rat
e (k
W)
Time (minutes)
Beanbag Chair
ATF HRR
FDS HRR
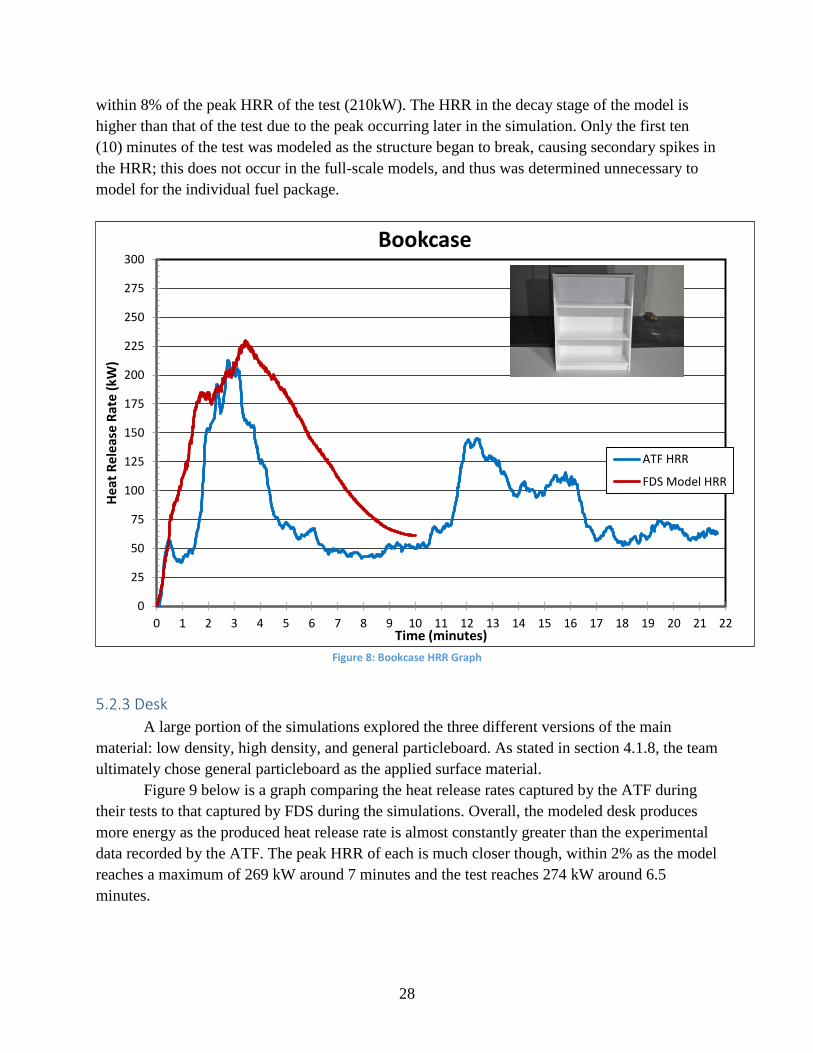
28
within 8% of the peak HRR of the test (210kW). The HRR in the decay stage of the model is
higher than that of the test due to the peak occurring later in the simulation. Only the first ten
(10) minutes of the test was modeled as the structure began to break, causing secondary spikes in
the HRR; this does not occur in the full-scale models, and thus was determined unnecessary to
model for the individual fuel package.
Figure 8: Bookcase HRR Graph
5.2.3 Desk
A large portion of the simulations explored the three different versions of the main
material: low density, high density, and general particleboard. As stated in section 4.1.8, the team
ultimately chose general particleboard as the applied surface material.
Figure 9 below is a graph comparing the heat release rates captured by the ATF during
their tests to that captured by FDS during the simulations. Overall, the modeled desk produces
more energy as the produced heat release rate is almost constantly greater than the experimental
data recorded by the ATF. The peak HRR of each is much closer though, within 2% as the model
reaches a maximum of 269 kW around 7 minutes and the test reaches 274 kW around 6.5
minutes.
0
25
50
75
100
125
150
175
200
225
250
275
300
0 1 2 3 4 5 6 7 8 9 10 11 12 13 14 15 16 17 18 19 20 21 22
Hea
t R
ele
ase
Rat
e (k
W)
Time (minutes)
Bookcase
ATF HRR
FDS Model HRR
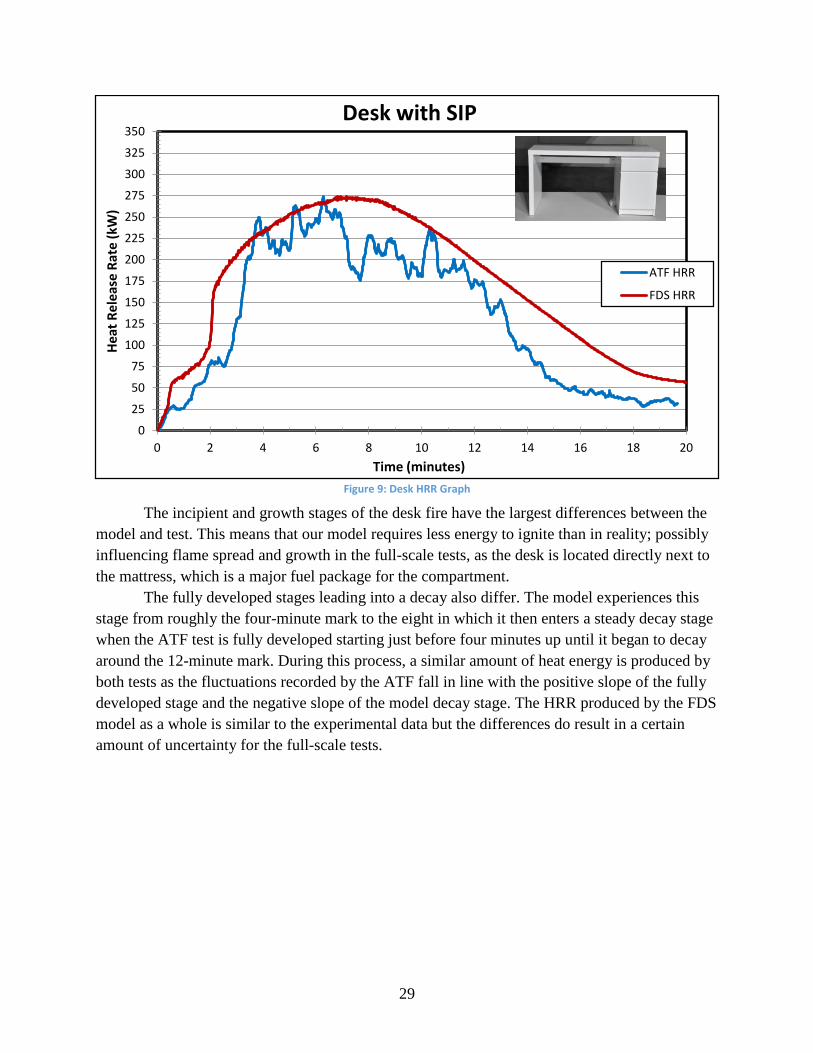
29
Figure 9: Desk HRR Graph
The incipient and growth stages of the desk fire have the largest differences between the
model and test. This means that our model requires less energy to ignite than in reality; possibly
influencing flame spread and growth in the full-scale tests, as the desk is located directly next to
the mattress, which is a major fuel package for the compartment.
The fully developed stages leading into a decay also differ. The model experiences this
stage from roughly the four-minute mark to the eight in which it then enters a steady decay stage
when the ATF test is fully developed starting just before four minutes up until it began to decay
around the 12-minute mark. During this process, a similar amount of heat energy is produced by
both tests as the fluctuations recorded by the ATF fall in line with the positive slope of the fully
developed stage and the negative slope of the model decay stage. The HRR produced by the FDS
model as a whole is similar to the experimental data but the differences do result in a certain
amount of uncertainty for the full-scale tests.
0
25
50
75
100
125
150
175
200
225
250
275
300
325
350
0 2 4 6 8 10 12 14 16 18 20
Hea
t R
ele
ase
Rat
e (k
W)
Time (minutes)
Desk with SIP
ATF HRR
FDS HRR
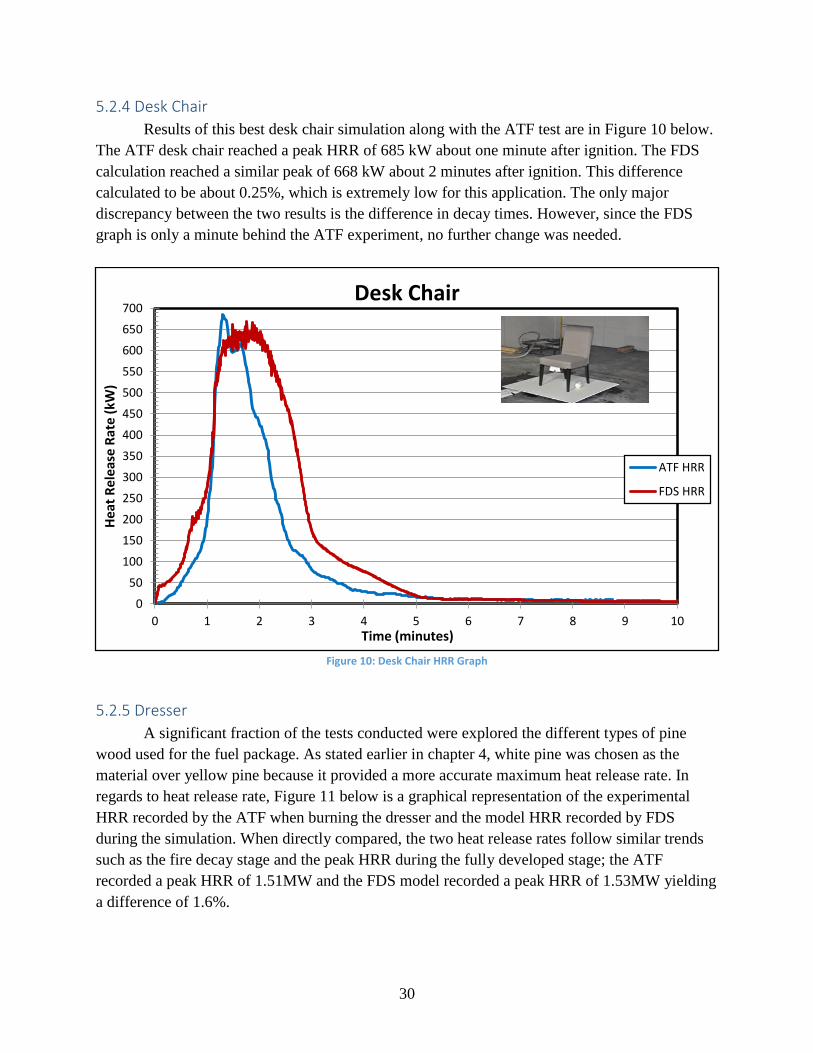
30
5.2.4 Desk Chair
Results of this best desk chair simulation along with the ATF test are in Figure 10 below.
The ATF desk chair reached a peak HRR of 685 kW about one minute after ignition. The FDS
calculation reached a similar peak of 668 kW about 2 minutes after ignition. This difference
calculated to be about 0.25%, which is extremely low for this application. The only major
discrepancy between the two results is the difference in decay times. However, since the FDS
graph is only a minute behind the ATF experiment, no further change was needed.
Figure 10: Desk Chair HRR Graph
5.2.5 Dresser
A significant fraction of the tests conducted were explored the different types of pine
wood used for the fuel package. As stated earlier in chapter 4, white pine was chosen as the
material over yellow pine because it provided a more accurate maximum heat release rate. In
regards to heat release rate, Figure 11 below is a graphical representation of the experimental
HRR recorded by the ATF when burning the dresser and the model HRR recorded by FDS
during the simulation. When directly compared, the two heat release rates follow similar trends
such as the fire decay stage and the peak HRR during the fully developed stage; the ATF
recorded a peak HRR of 1.51MW and the FDS model recorded a peak HRR of 1.53MW yielding
a difference of 1.6%.
0
50
100
150
200
250
300
350
400
450
500
550
600
650
700
0 1 2 3 4 5 6 7 8 9 10
Hea
t R
ele
ase
Rat
e (k
W)
Time (minutes)
Desk Chair
ATF HRR
FDS HRR
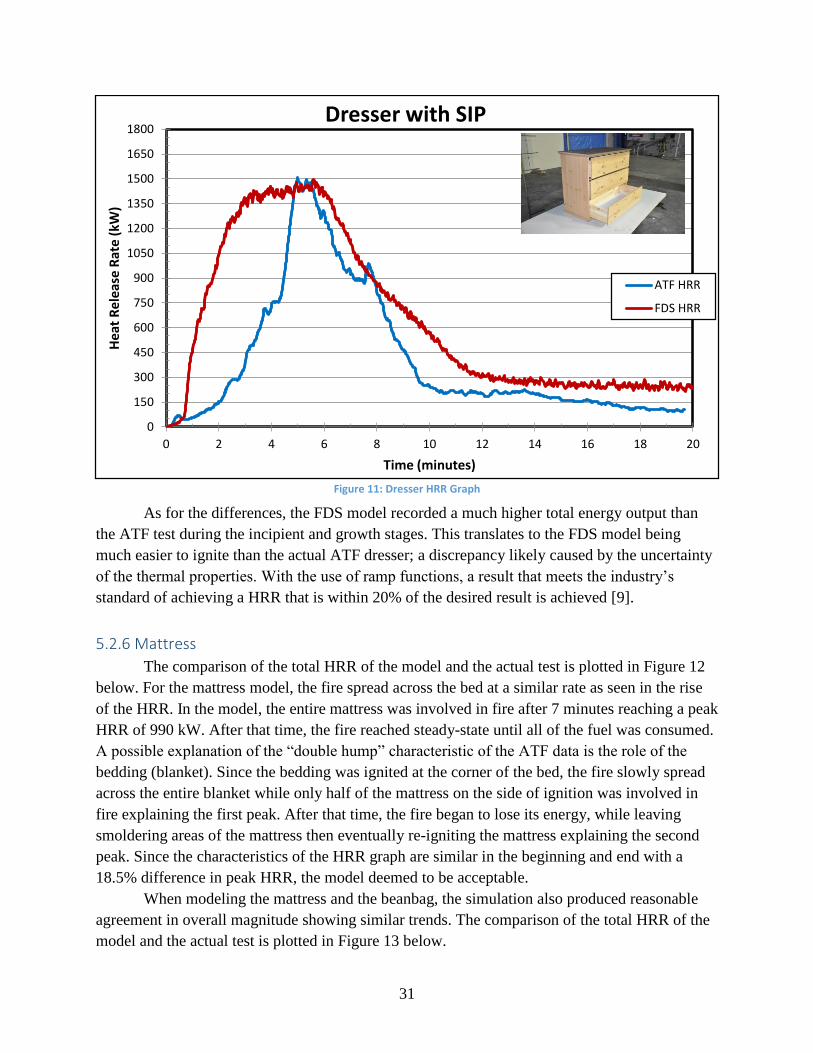
31
Figure 11: Dresser HRR Graph
As for the differences, the FDS model recorded a much higher total energy output than
the ATF test during the incipient and growth stages. This translates to the FDS model being
much easier to ignite than the actual ATF dresser; a discrepancy likely caused by the uncertainty
of the thermal properties. With the use of ramp functions, a result that meets the industry’s
standard of achieving a HRR that is within 20% of the desired result is achieved [9].
5.2.6 Mattress
The comparison of the total HRR of the model and the actual test is plotted in Figure 12
below. For the mattress model, the fire spread across the bed at a similar rate as seen in the rise
of the HRR. In the model, the entire mattress was involved in fire after 7 minutes reaching a peak
HRR of 990 kW. After that time, the fire reached steady-state until all of the fuel was consumed.
A possible explanation of the “double hump” characteristic of the ATF data is the role of the
bedding (blanket). Since the bedding was ignited at the corner of the bed, the fire slowly spread
across the entire blanket while only half of the mattress on the side of ignition was involved in
fire explaining the first peak. After that time, the fire began to lose its energy, while leaving
smoldering areas of the mattress then eventually re-igniting the mattress explaining the second
peak. Since the characteristics of the HRR graph are similar in the beginning and end with a
18.5% difference in peak HRR, the model deemed to be acceptable.
When modeling the mattress and the beanbag, the simulation also produced reasonable
agreement in overall magnitude showing similar trends. The comparison of the total HRR of the
model and the actual test is plotted in Figure 13 below.
0
150
300
450
600
750
900
1050
1200
1350
1500
1650
1800
0 2 4 6 8 10 12 14 16 18 20
Hea
t R
ele
ase
Rat
e (k
W)
Time (minutes)
Dresser with SIP
ATF HRR
FDS HRR
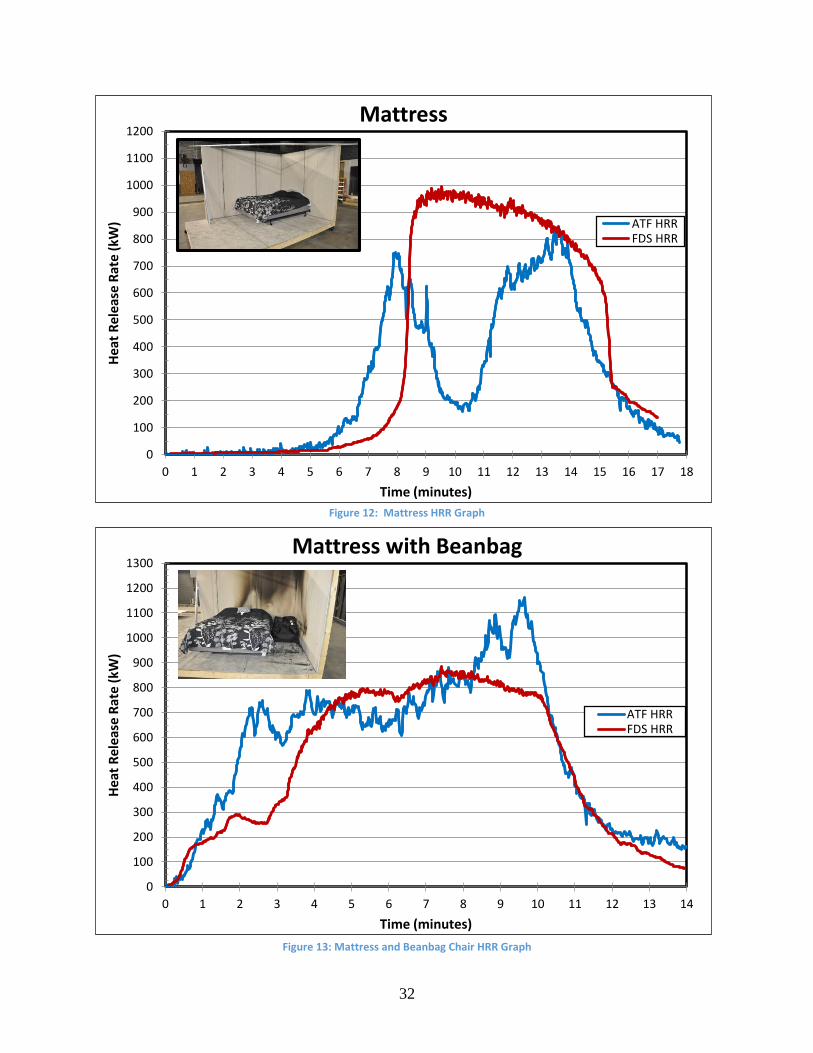
32
Figure 12: Mattress HRR Graph
Figure 13: Mattress and Beanbag Chair HRR Graph
0
100
200
300
400
500
600
700
800
900
1000
1100
1200
0 1 2 3 4 5 6 7 8 9 10 11 12 13 14 15 16 17 18
Hea
t R
ele
ase
Rat
e (k
W)
Time (minutes)
Mattress
ATF HRRFDS HRR
0
100
200
300
400
500
600
700
800
900
1000
1100
1200
1300
0 1 2 3 4 5 6 7 8 9 10 11 12 13 14
Hea
t R
ele
ase
Rat
e (k
W)
Time (minutes)
Mattress with Beanbag
ATF HRRFDS HRR
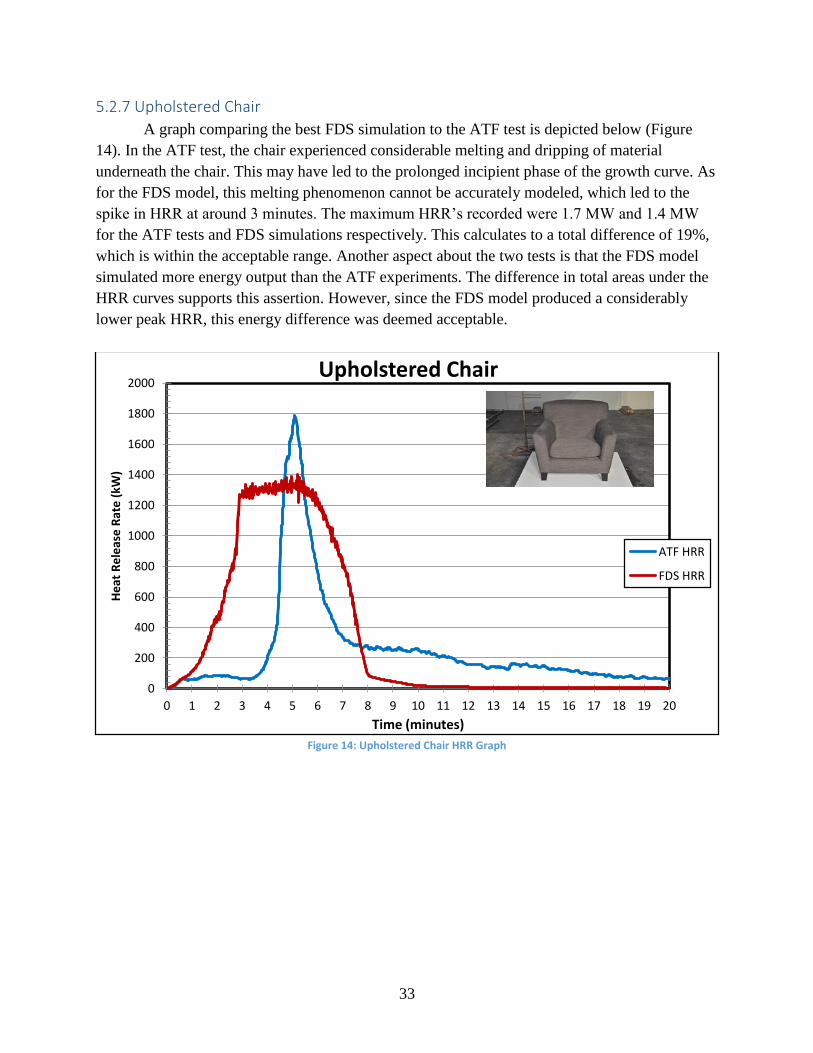
33
5.2.7 Upholstered Chair
A graph comparing the best FDS simulation to the ATF test is depicted below (Figure
14). In the ATF test, the chair experienced considerable melting and dripping of material
underneath the chair. This may have led to the prolonged incipient phase of the growth curve. As
for the FDS model, this melting phenomenon cannot be accurately modeled, which led to the
spike in HRR at around 3 minutes. The maximum HRR’s recorded were 1.7 MW and 1.4 MW
for the ATF tests and FDS simulations respectively. This calculates to a total difference of 19%,
which is within the acceptable range. Another aspect about the two tests is that the FDS model
simulated more energy output than the ATF experiments. The difference in total areas under the
HRR curves supports this assertion. However, since the FDS model produced a considerably
lower peak HRR, this energy difference was deemed acceptable.
Figure 14: Upholstered Chair HRR Graph
0
200
400
600
800
1000
1200
1400
1600
1800
2000
0 1 2 3 4 5 6 7 8 9 10 11 12 13 14 15 16 17 18 19 20
He
at R
ele
ase
Rat
e (
kW)
Time (minutes)
Upholstered Chair
ATF HRR
FDS HRR
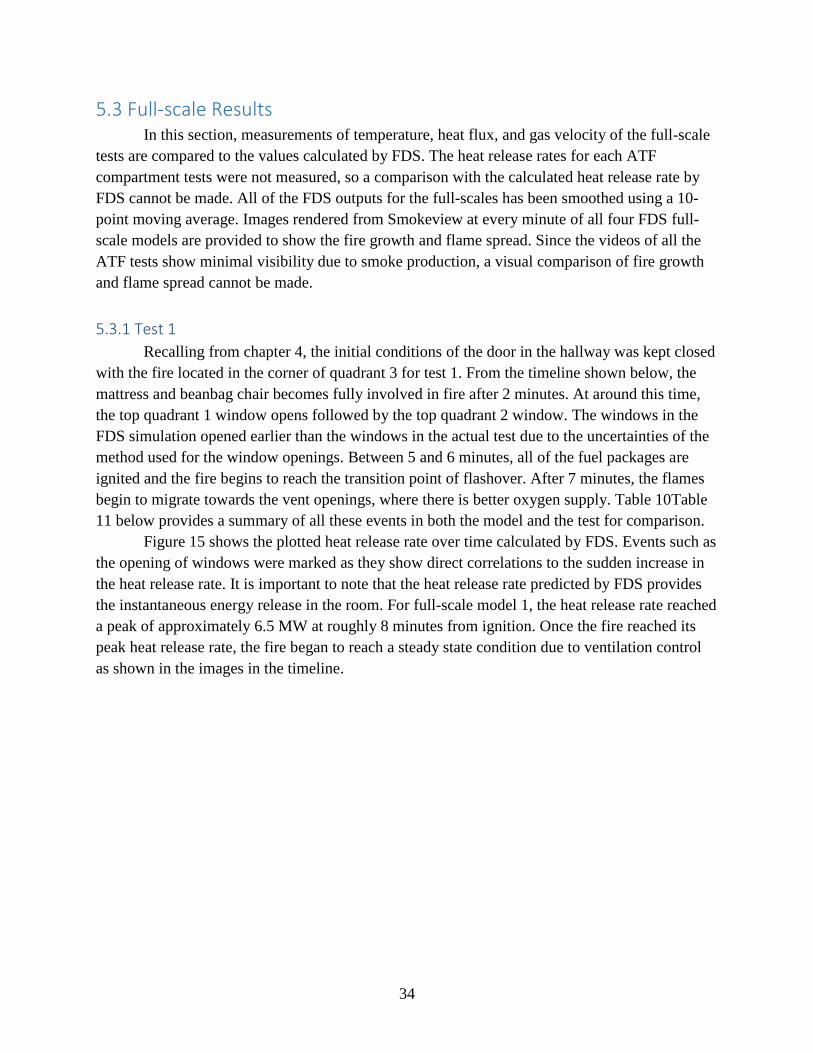
34
5.3 Full-scale Results In this section, measurements of temperature, heat flux, and gas velocity of the full-scale
tests are compared to the values calculated by FDS. The heat release rates for each ATF
compartment tests were not measured, so a comparison with the calculated heat release rate by
FDS cannot be made. All of the FDS outputs for the full-scales has been smoothed using a 10-
point moving average. Images rendered from Smokeview at every minute of all four FDS full-
scale models are provided to show the fire growth and flame spread. Since the videos of all the
ATF tests show minimal visibility due to smoke production, a visual comparison of fire growth
and flame spread cannot be made.
5.3.1 Test 1
Recalling from chapter 4, the initial conditions of the door in the hallway was kept closed
with the fire located in the corner of quadrant 3 for test 1. From the timeline shown below, the
mattress and beanbag chair becomes fully involved in fire after 2 minutes. At around this time,
the top quadrant 1 window opens followed by the top quadrant 2 window. The windows in the
FDS simulation opened earlier than the windows in the actual test due to the uncertainties of the
method used for the window openings. Between 5 and 6 minutes, all of the fuel packages are
ignited and the fire begins to reach the transition point of flashover. After 7 minutes, the flames
begin to migrate towards the vent openings, where there is better oxygen supply. Table 10Table
11 below provides a summary of all these events in both the model and the test for comparison.
Figure 15 shows the plotted heat release rate over time calculated by FDS. Events such as
the opening of windows were marked as they show direct correlations to the sudden increase in
the heat release rate. It is important to note that the heat release rate predicted by FDS provides
the instantaneous energy release in the room. For full-scale model 1, the heat release rate reached
a peak of approximately 6.5 MW at roughly 8 minutes from ignition. Once the fire reached its
peak heat release rate, the fire began to reach a steady state condition due to ventilation control
as shown in the images in the timeline.
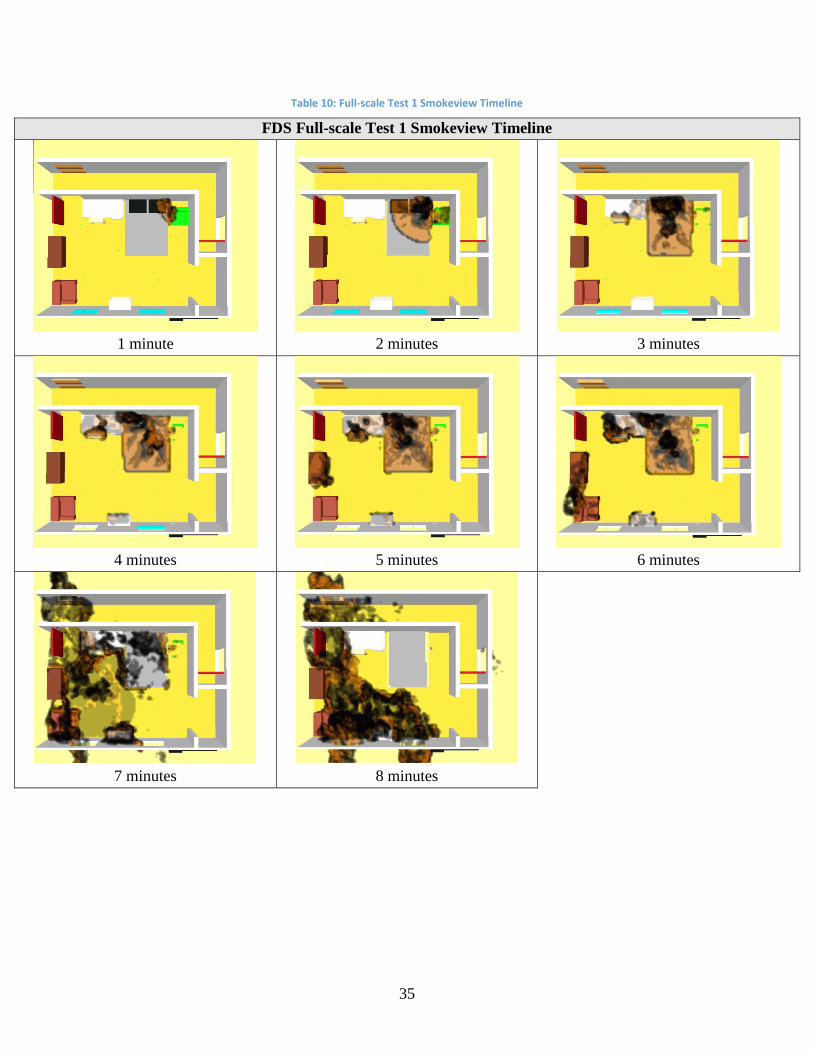
35
Table 10: Full-scale Test 1 Smokeview Timeline
FDS Full-scale Test 1 Smokeview Timeline
1 minute
2 minutes
3 minutes
4 minutes
5 minutes
6 minutes
7 minutes
8 minutes
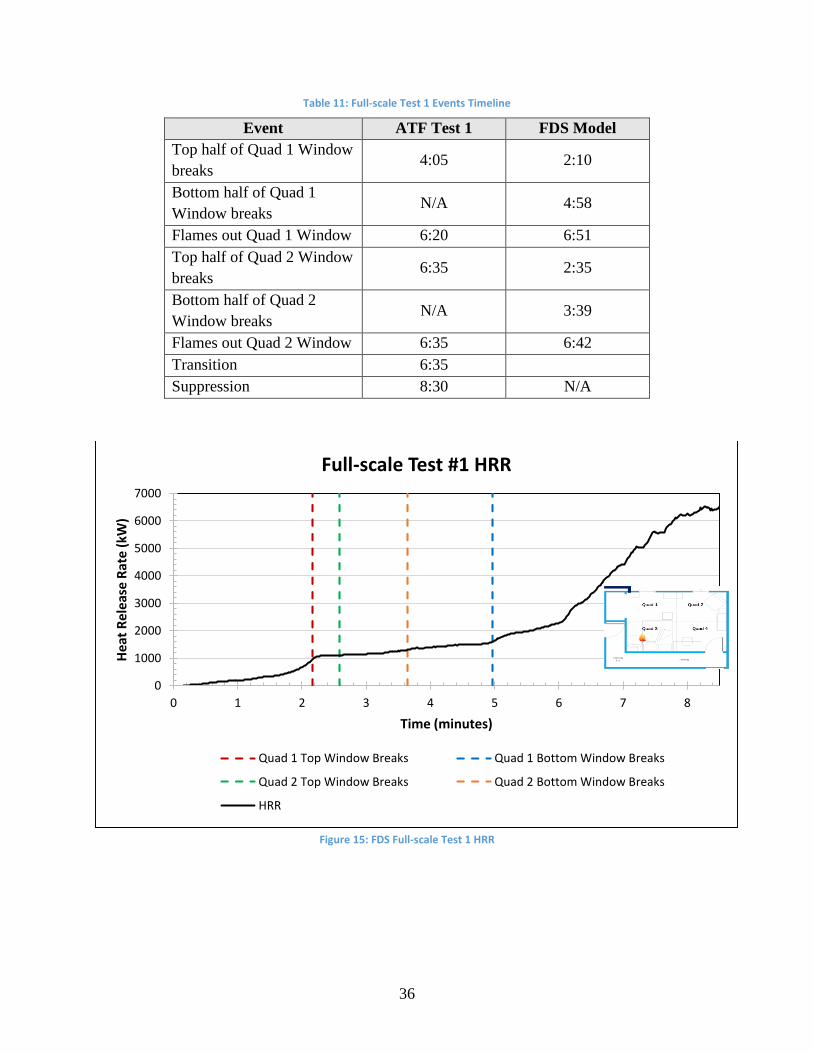
36
Table 11: Full-scale Test 1 Events Timeline
Event ATF Test 1 FDS Model
Top half of Quad 1 Window
breaks 4:05 2:10
Bottom half of Quad 1
Window breaks N/A 4:58
Flames out Quad 1 Window 6:20 6:51
Top half of Quad 2 Window
breaks 6:35 2:35
Bottom half of Quad 2
Window breaks N/A 3:39
Flames out Quad 2 Window 6:35 6:42
Transition 6:35
Suppression 8:30 N/A
Figure 15: FDS Full-scale Test 1 HRR
0
1000
2000
3000
4000
5000
6000
7000
0 1 2 3 4 5 6 7 8
Hea
t R
ele
ase
Rat
e (k
W)
Time (minutes)
Full-scale Test #1 HRR
Quad 1 Top Window Breaks Quad 1 Bottom Window Breaks
Quad 2 Top Window Breaks Quad 2 Bottom Window Breaks
HRR
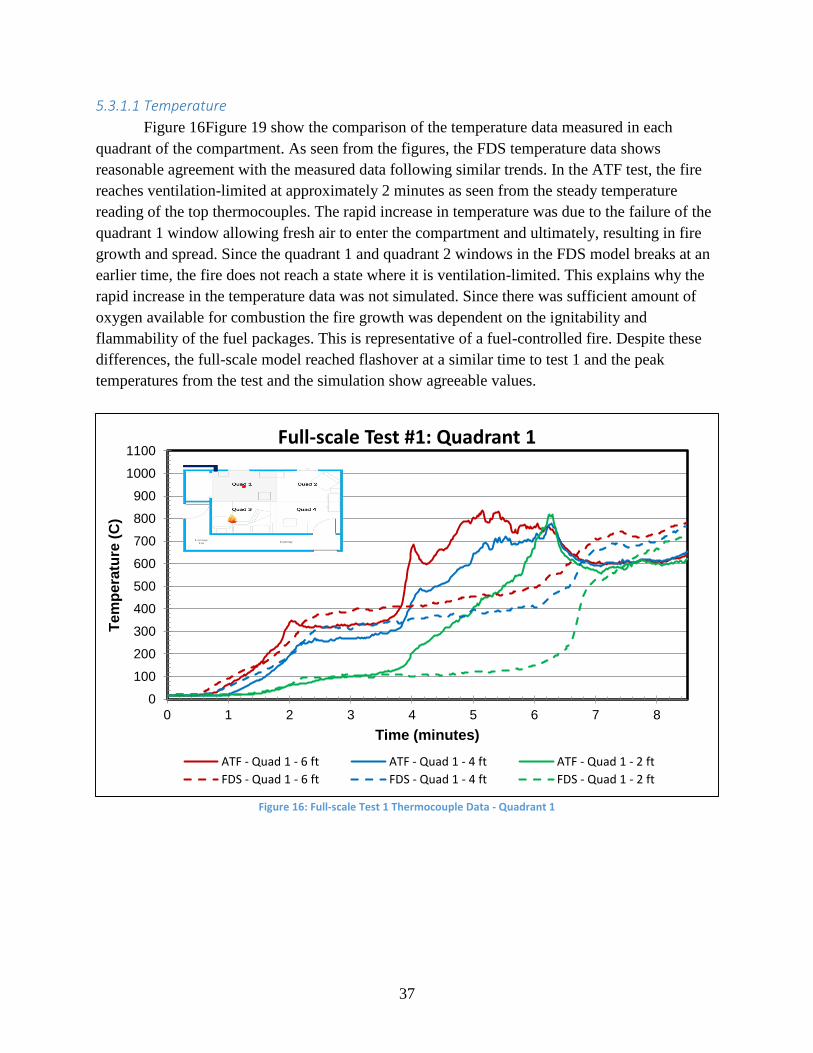
37
5.3.1.1 Temperature
Figure 16Figure 19 show the comparison of the temperature data measured in each
quadrant of the compartment. As seen from the figures, the FDS temperature data shows
reasonable agreement with the measured data following similar trends. In the ATF test, the fire
reaches ventilation-limited at approximately 2 minutes as seen from the steady temperature
reading of the top thermocouples. The rapid increase in temperature was due to the failure of the
quadrant 1 window allowing fresh air to enter the compartment and ultimately, resulting in fire
growth and spread. Since the quadrant 1 and quadrant 2 windows in the FDS model breaks at an
earlier time, the fire does not reach a state where it is ventilation-limited. This explains why the
rapid increase in the temperature data was not simulated. Since there was sufficient amount of
oxygen available for combustion the fire growth was dependent on the ignitability and
flammability of the fuel packages. This is representative of a fuel-controlled fire. Despite these
differences, the full-scale model reached flashover at a similar time to test 1 and the peak
temperatures from the test and the simulation show agreeable values.
Figure 16: Full-scale Test 1 Thermocouple Data - Quadrant 1
0
100
200
300
400
500
600
700
800
900
1000
1100
0 1 2 3 4 5 6 7 8
Te
mp
era
ture
(C
)
Time (minutes)
Full-scale Test #1: Quadrant 1
ATF - Quad 1 - 6 ft ATF - Quad 1 - 4 ft ATF - Quad 1 - 2 ft
FDS - Quad 1 - 6 ft FDS - Quad 1 - 4 ft FDS - Quad 1 - 2 ft
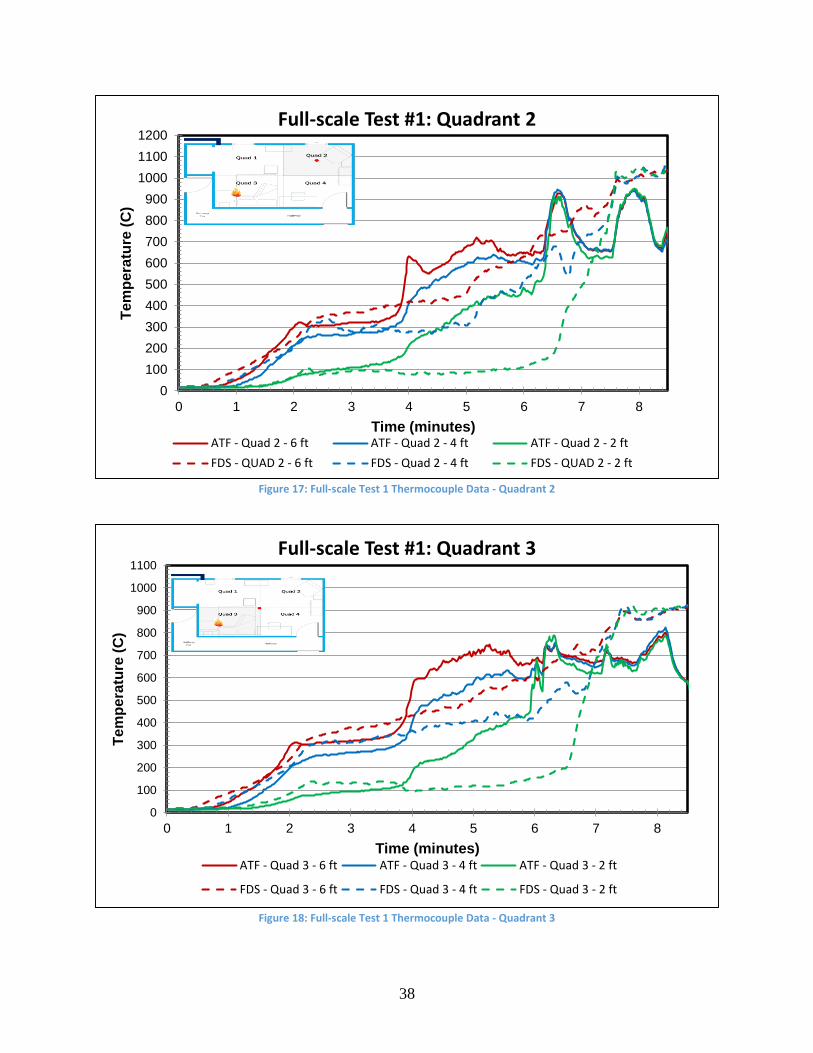
38
Figure 17: Full-scale Test 1 Thermocouple Data - Quadrant 2
Figure 18: Full-scale Test 1 Thermocouple Data - Quadrant 3
0
100
200
300
400
500
600
700
800
900
1000
1100
1200
0 1 2 3 4 5 6 7 8
Te
mp
era
ture
(C
)
Time (minutes)
Full-scale Test #1: Quadrant 2
ATF - Quad 2 - 6 ft ATF - Quad 2 - 4 ft ATF - Quad 2 - 2 ft
FDS - QUAD 2 - 6 ft FDS - Quad 2 - 4 ft FDS - QUAD 2 - 2 ft
0
100
200
300
400
500
600
700
800
900
1000
1100
0 1 2 3 4 5 6 7 8
Te
mp
era
ture
(C
)
Time (minutes)
Full-scale Test #1: Quadrant 3
ATF - Quad 3 - 6 ft ATF - Quad 3 - 4 ft ATF - Quad 3 - 2 ft
FDS - Quad 3 - 6 ft FDS - Quad 3 - 4 ft FDS - Quad 3 - 2 ft
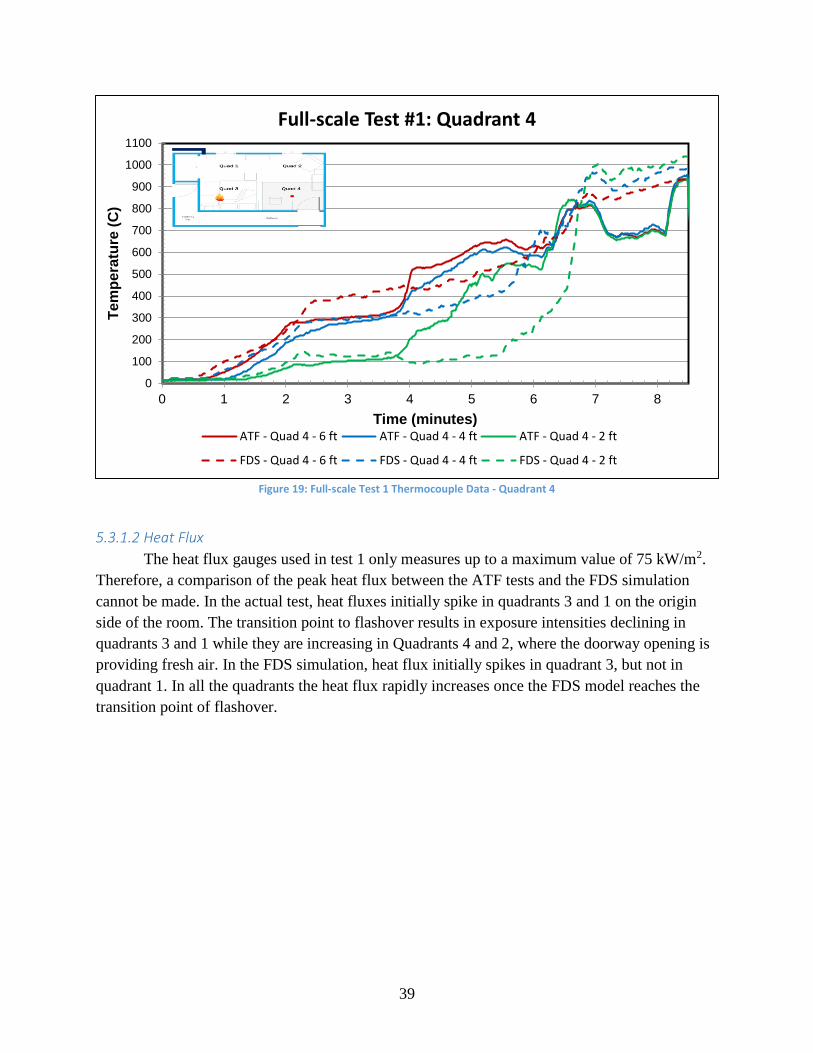
39
Figure 19: Full-scale Test 1 Thermocouple Data - Quadrant 4
5.3.1.2 Heat Flux
The heat flux gauges used in test 1 only measures up to a maximum value of 75 kW/m2.
Therefore, a comparison of the peak heat flux between the ATF tests and the FDS simulation
cannot be made. In the actual test, heat fluxes initially spike in quadrants 3 and 1 on the origin
side of the room. The transition point to flashover results in exposure intensities declining in
quadrants 3 and 1 while they are increasing in Quadrants 4 and 2, where the doorway opening is
providing fresh air. In the FDS simulation, heat flux initially spikes in quadrant 3, but not in
quadrant 1. In all the quadrants the heat flux rapidly increases once the FDS model reaches the
transition point of flashover.
0
100
200
300
400
500
600
700
800
900
1000
1100
0 1 2 3 4 5 6 7 8
Te
mp
era
ture
(C
)
Time (minutes)
Full-scale Test #1: Quadrant 4
ATF - Quad 4 - 6 ft ATF - Quad 4 - 4 ft ATF - Quad 4 - 2 ft
FDS - Quad 4 - 6 ft FDS - Quad 4 - 4 ft FDS - Quad 4 - 2 ft
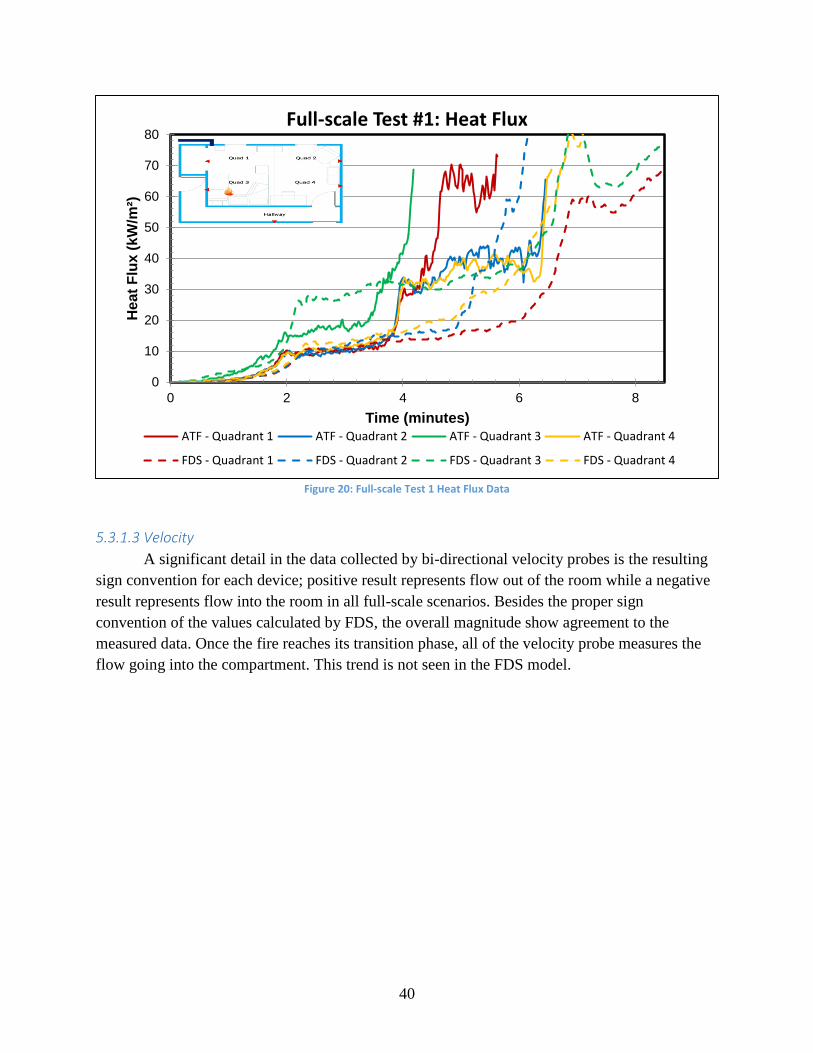
40
Figure 20: Full-scale Test 1 Heat Flux Data
5.3.1.3 Velocity
A significant detail in the data collected by bi-directional velocity probes is the resulting
sign convention for each device; positive result represents flow out of the room while a negative
result represents flow into the room in all full-scale scenarios. Besides the proper sign
convention of the values calculated by FDS, the overall magnitude show agreement to the
measured data. Once the fire reaches its transition phase, all of the velocity probe measures the
flow going into the compartment. This trend is not seen in the FDS model.
0
10
20
30
40
50
60
70
80
0 2 4 6 8
He
at
Flu
x (
kW
/m²)
Time (minutes)
Full-scale Test #1: Heat Flux
ATF - Quadrant 1 ATF - Quadrant 2 ATF - Quadrant 3 ATF - Quadrant 4
FDS - Quadrant 1 FDS - Quadrant 2 FDS - Quadrant 3 FDS - Quadrant 4
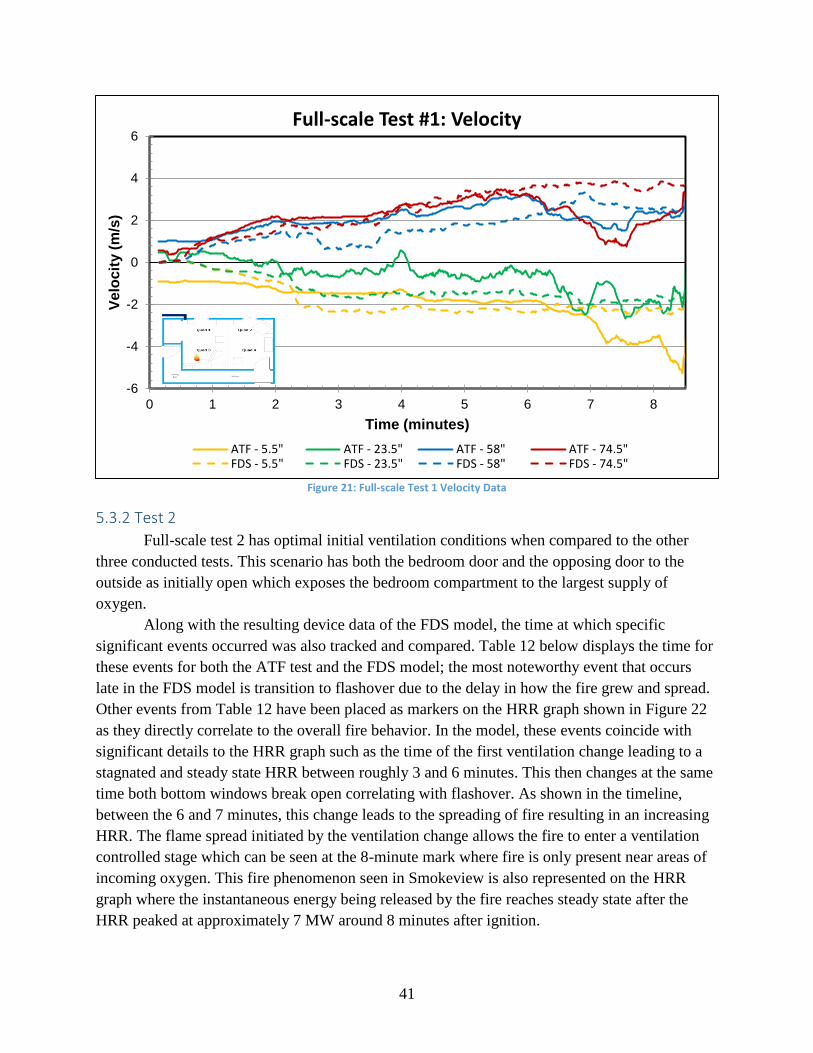
41
Figure 21: Full-scale Test 1 Velocity Data
5.3.2 Test 2
Full-scale test 2 has optimal initial ventilation conditions when compared to the other
three conducted tests. This scenario has both the bedroom door and the opposing door to the
outside as initially open which exposes the bedroom compartment to the largest supply of
oxygen.
Along with the resulting device data of the FDS model, the time at which specific
significant events occurred was also tracked and compared. Table 12 below displays the time for
these events for both the ATF test and the FDS model; the most noteworthy event that occurs
late in the FDS model is transition to flashover due to the delay in how the fire grew and spread.
Other events from Table 12 have been placed as markers on the HRR graph shown in Figure 22
as they directly correlate to the overall fire behavior. In the model, these events coincide with
significant details to the HRR graph such as the time of the first ventilation change leading to a
stagnated and steady state HRR between roughly 3 and 6 minutes. This then changes at the same
time both bottom windows break open correlating with flashover. As shown in the timeline,
between the 6 and 7 minutes, this change leads to the spreading of fire resulting in an increasing
HRR. The flame spread initiated by the ventilation change allows the fire to enter a ventilation
controlled stage which can be seen at the 8-minute mark where fire is only present near areas of
incoming oxygen. This fire phenomenon seen in Smokeview is also represented on the HRR
graph where the instantaneous energy being released by the fire reaches steady state after the
HRR peaked at approximately 7 MW around 8 minutes after ignition.
-6
-4
-2
0
2
4
6
0 1 2 3 4 5 6 7 8
Ve
loc
ity (
m/s
)
Time (minutes)
Full-scale Test #1: Velocity
ATF - 5.5" ATF - 23.5" ATF - 58" ATF - 74.5"FDS - 5.5" FDS - 23.5" FDS - 58" FDS - 74.5"
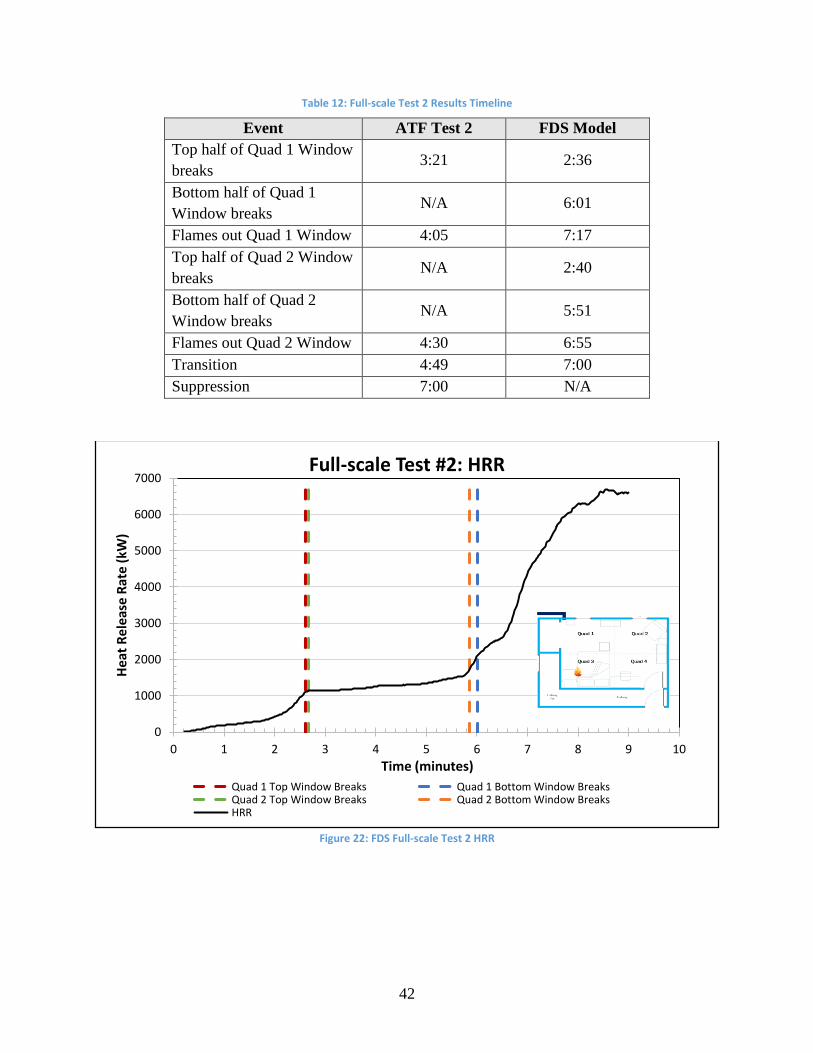
42
Table 12: Full-scale Test 2 Results Timeline
Event ATF Test 2 FDS Model
Top half of Quad 1 Window
breaks 3:21 2:36
Bottom half of Quad 1
Window breaks N/A 6:01
Flames out Quad 1 Window 4:05 7:17
Top half of Quad 2 Window
breaks N/A 2:40
Bottom half of Quad 2
Window breaks N/A 5:51
Flames out Quad 2 Window 4:30 6:55
Transition 4:49 7:00
Suppression 7:00 N/A
Figure 22: FDS Full-scale Test 2 HRR
0
1000
2000
3000
4000
5000
6000
7000
0 1 2 3 4 5 6 7 8 9 10
Hea
t R
ele
ase
Rat
e (k
W)
Time (minutes)
Full-scale Test #2: HRR
Quad 1 Top Window Breaks Quad 1 Bottom Window BreaksQuad 2 Top Window Breaks Quad 2 Bottom Window BreaksHRR
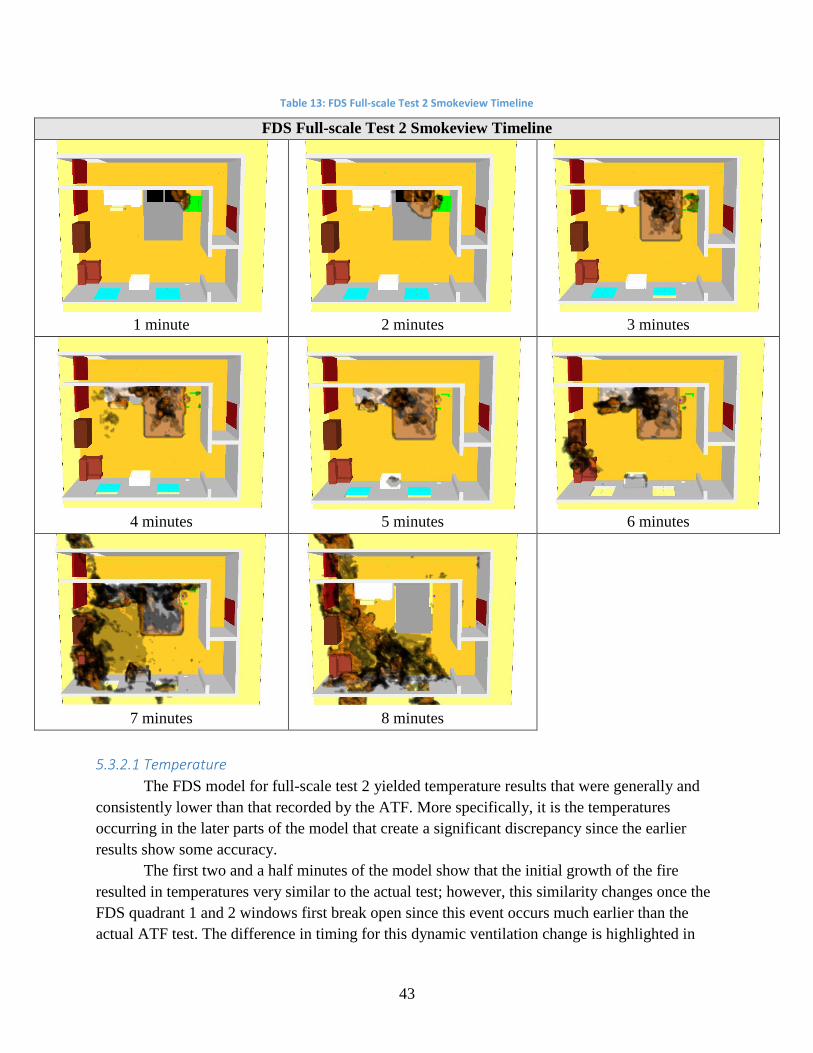
43
Table 13: FDS Full-scale Test 2 Smokeview Timeline
FDS Full-scale Test 2 Smokeview Timeline
1 minute
2 minutes
3 minutes
4 minutes
5 minutes
6 minutes
7 minutes
8 minutes
5.3.2.1 Temperature
The FDS model for full-scale test 2 yielded temperature results that were generally and
consistently lower than that recorded by the ATF. More specifically, it is the temperatures
occurring in the later parts of the model that create a significant discrepancy since the earlier
results show some accuracy.
The first two and a half minutes of the model show that the initial growth of the fire
resulted in temperatures very similar to the actual test; however, this similarity changes once the
FDS quadrant 1 and 2 windows first break open since this event occurs much earlier than the
actual ATF test. The difference in timing for this dynamic ventilation change is highlighted in
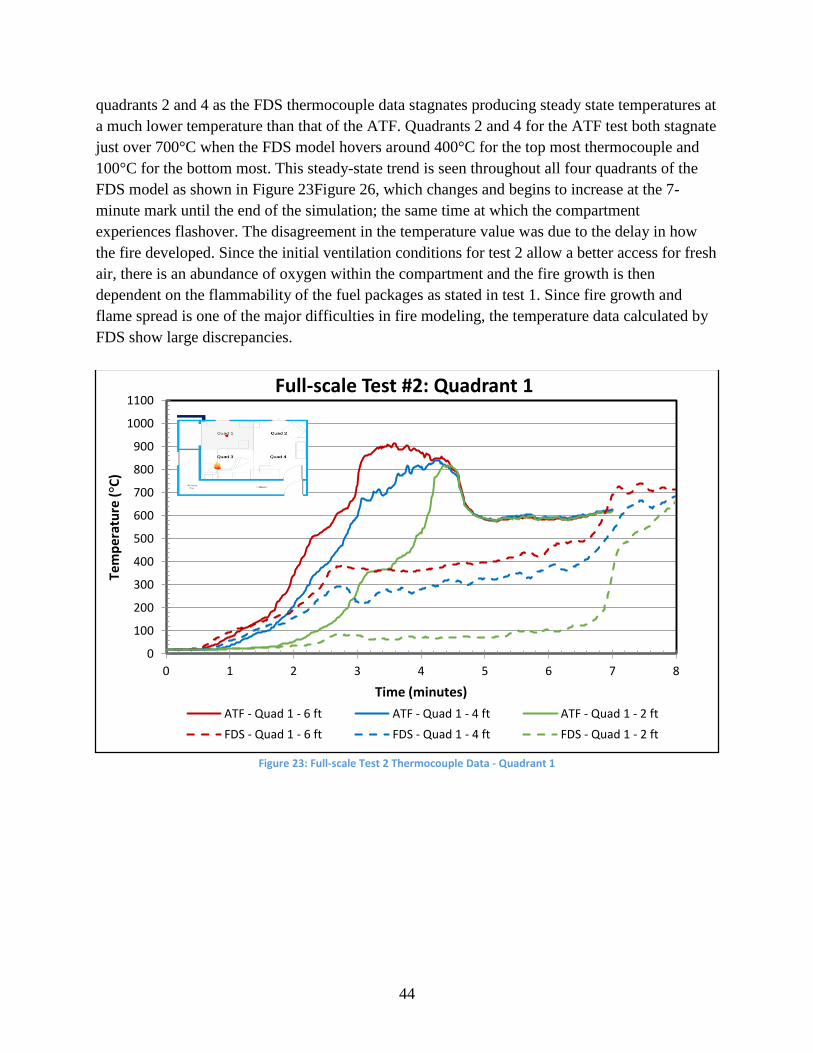
44
quadrants 2 and 4 as the FDS thermocouple data stagnates producing steady state temperatures at
a much lower temperature than that of the ATF. Quadrants 2 and 4 for the ATF test both stagnate
just over 700°C when the FDS model hovers around 400°C for the top most thermocouple and
100°C for the bottom most. This steady-state trend is seen throughout all four quadrants of the
FDS model as shown in Figure 23Figure 26, which changes and begins to increase at the 7-
minute mark until the end of the simulation; the same time at which the compartment
experiences flashover. The disagreement in the temperature value was due to the delay in how
the fire developed. Since the initial ventilation conditions for test 2 allow a better access for fresh
air, there is an abundance of oxygen within the compartment and the fire growth is then
dependent on the flammability of the fuel packages as stated in test 1. Since fire growth and
flame spread is one of the major difficulties in fire modeling, the temperature data calculated by
FDS show large discrepancies.
Figure 23: Full-scale Test 2 Thermocouple Data - Quadrant 1
0
100
200
300
400
500
600
700
800
900
1000
1100
0 1 2 3 4 5 6 7 8
Tem
per
atu
re (
°C)
Time (minutes)
Full-scale Test #2: Quadrant 1
ATF - Quad 1 - 6 ft ATF - Quad 1 - 4 ft ATF - Quad 1 - 2 ft
FDS - Quad 1 - 6 ft FDS - Quad 1 - 4 ft FDS - Quad 1 - 2 ft
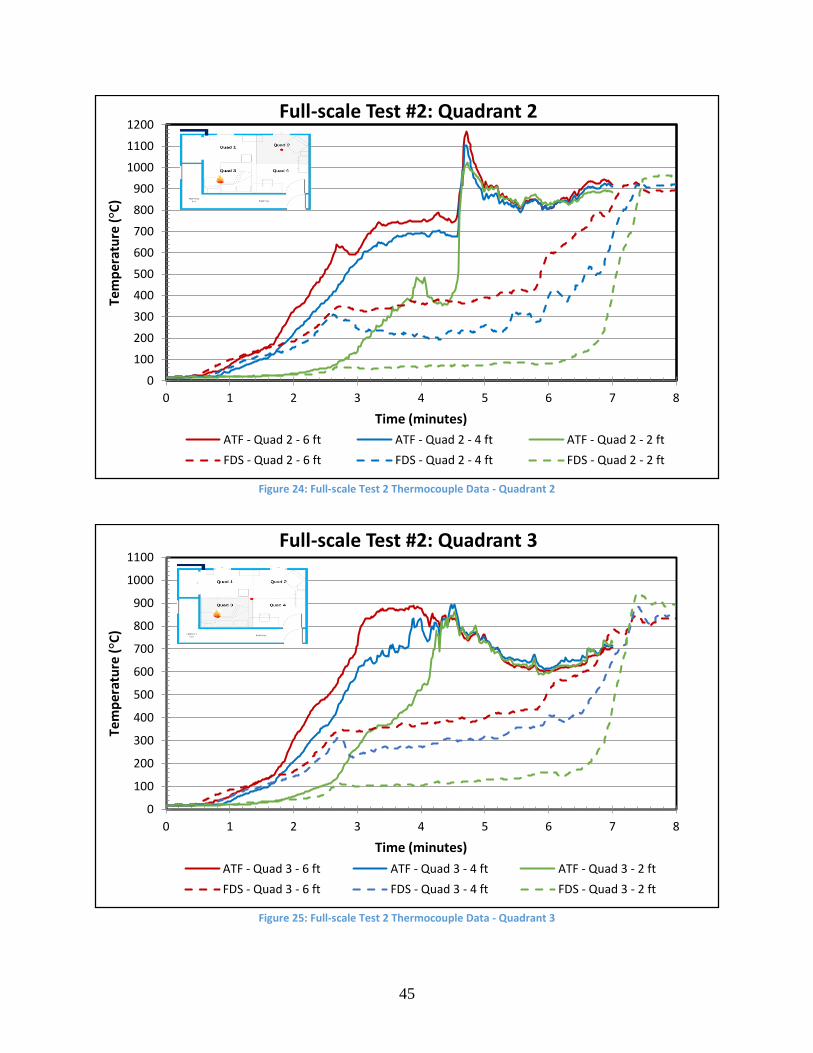
45
Figure 24: Full-scale Test 2 Thermocouple Data - Quadrant 2
Figure 25: Full-scale Test 2 Thermocouple Data - Quadrant 3
0
100
200
300
400
500
600
700
800
900
1000
1100
1200
0 1 2 3 4 5 6 7 8
Tem
per
atu
re (
°C)
Time (minutes)
Full-scale Test #2: Quadrant 2
ATF - Quad 2 - 6 ft ATF - Quad 2 - 4 ft ATF - Quad 2 - 2 ft
FDS - Quad 2 - 6 ft FDS - Quad 2 - 4 ft FDS - Quad 2 - 2 ft
0
100
200
300
400
500
600
700
800
900
1000
1100
0 1 2 3 4 5 6 7 8
Tem
per
atu
re (
°C)
Time (minutes)
Full-scale Test #2: Quadrant 3
ATF - Quad 3 - 6 ft ATF - Quad 3 - 4 ft ATF - Quad 3 - 2 ft
FDS - Quad 3 - 6 ft FDS - Quad 3 - 4 ft FDS - Quad 3 - 2 ft
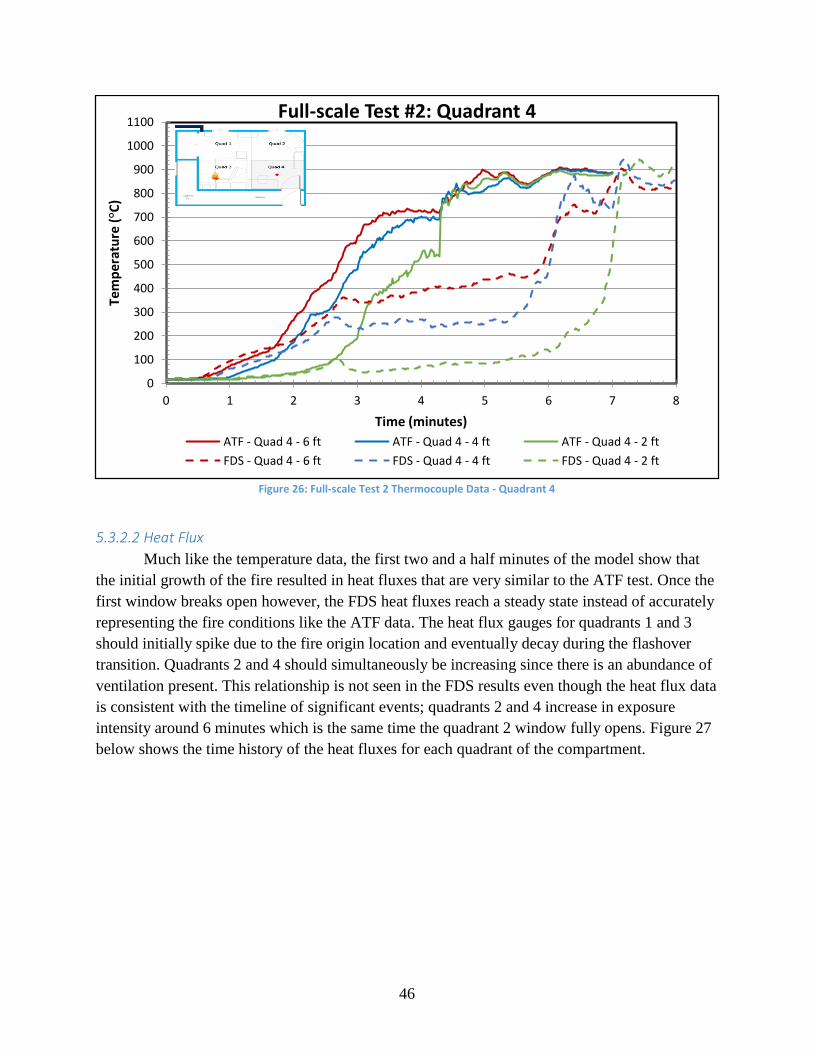
46
Figure 26: Full-scale Test 2 Thermocouple Data - Quadrant 4
5.3.2.2 Heat Flux
Much like the temperature data, the first two and a half minutes of the model show that
the initial growth of the fire resulted in heat fluxes that are very similar to the ATF test. Once the
first window breaks open however, the FDS heat fluxes reach a steady state instead of accurately
representing the fire conditions like the ATF data. The heat flux gauges for quadrants 1 and 3
should initially spike due to the fire origin location and eventually decay during the flashover
transition. Quadrants 2 and 4 should simultaneously be increasing since there is an abundance of
ventilation present. This relationship is not seen in the FDS results even though the heat flux data
is consistent with the timeline of significant events; quadrants 2 and 4 increase in exposure
intensity around 6 minutes which is the same time the quadrant 2 window fully opens. Figure 27
below shows the time history of the heat fluxes for each quadrant of the compartment.
0
100
200
300
400
500
600
700
800
900
1000
1100
0 1 2 3 4 5 6 7 8
Tem
per
atu
re (
°C)
Time (minutes)
Full-scale Test #2: Quadrant 4
ATF - Quad 4 - 6 ft ATF - Quad 4 - 4 ft ATF - Quad 4 - 2 ft
FDS - Quad 4 - 6 ft FDS - Quad 4 - 4 ft FDS - Quad 4 - 2 ft
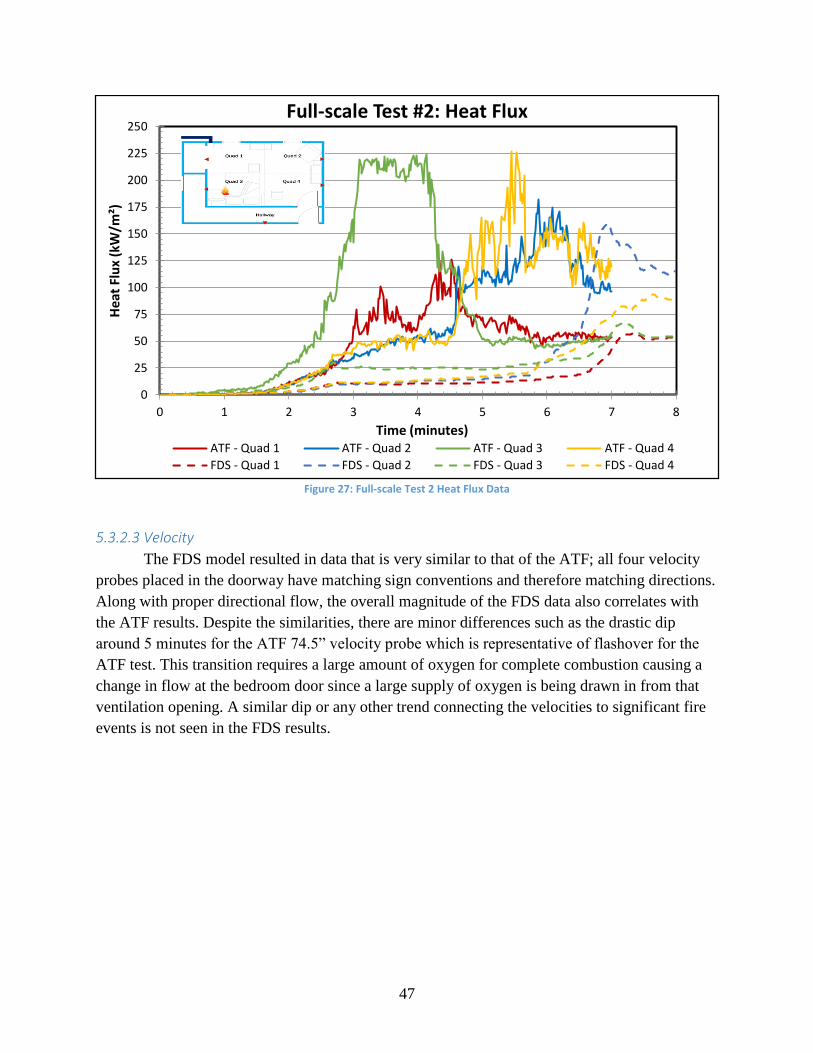
47
Figure 27: Full-scale Test 2 Heat Flux Data
5.3.2.3 Velocity
The FDS model resulted in data that is very similar to that of the ATF; all four velocity
probes placed in the doorway have matching sign conventions and therefore matching directions.
Along with proper directional flow, the overall magnitude of the FDS data also correlates with
the ATF results. Despite the similarities, there are minor differences such as the drastic dip
around 5 minutes for the ATF 74.5” velocity probe which is representative of flashover for the
ATF test. This transition requires a large amount of oxygen for complete combustion causing a
change in flow at the bedroom door since a large supply of oxygen is being drawn in from that
ventilation opening. A similar dip or any other trend connecting the velocities to significant fire
events is not seen in the FDS results.
0
25
50
75
100
125
150
175
200
225
250
0 1 2 3 4 5 6 7 8
Hea
t Fl
ux
(kW
/m²)
Time (minutes)
Full-scale Test #2: Heat Flux
ATF - Quad 1 ATF - Quad 2 ATF - Quad 3 ATF - Quad 4
FDS - Quad 1 FDS - Quad 2 FDS - Quad 3 FDS - Quad 4
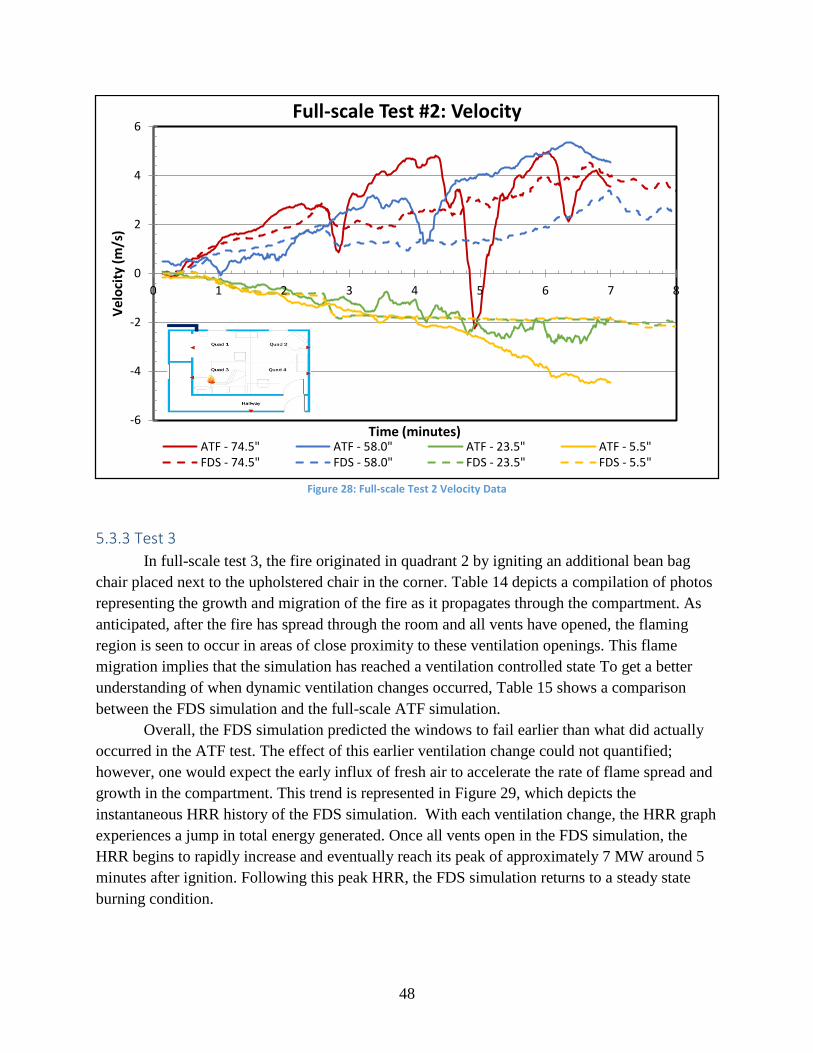
48
Figure 28: Full-scale Test 2 Velocity Data
5.3.3 Test 3
In full-scale test 3, the fire originated in quadrant 2 by igniting an additional bean bag
chair placed next to the upholstered chair in the corner. Table 14 depicts a compilation of photos
representing the growth and migration of the fire as it propagates through the compartment. As
anticipated, after the fire has spread through the room and all vents have opened, the flaming
region is seen to occur in areas of close proximity to these ventilation openings. This flame
migration implies that the simulation has reached a ventilation controlled state To get a better
understanding of when dynamic ventilation changes occurred, Table 15 shows a comparison
between the FDS simulation and the full-scale ATF simulation.
Overall, the FDS simulation predicted the windows to fail earlier than what did actually
occurred in the ATF test. The effect of this earlier ventilation change could not quantified;
however, one would expect the early influx of fresh air to accelerate the rate of flame spread and
growth in the compartment. This trend is represented in Figure 29, which depicts the
instantaneous HRR history of the FDS simulation. With each ventilation change, the HRR graph
experiences a jump in total energy generated. Once all vents open in the FDS simulation, the
HRR begins to rapidly increase and eventually reach its peak of approximately 7 MW around 5
minutes after ignition. Following this peak HRR, the FDS simulation returns to a steady state
burning condition.
-6
-4
-2
0
2
4
6
0 1 2 3 4 5 6 7 8
Vel
oci
ty (
m/s
)
Time (minutes)
Full-scale Test #2: Velocity
ATF - 74.5" ATF - 58.0" ATF - 23.5" ATF - 5.5"FDS - 74.5" FDS - 58.0" FDS - 23.5" FDS - 5.5"
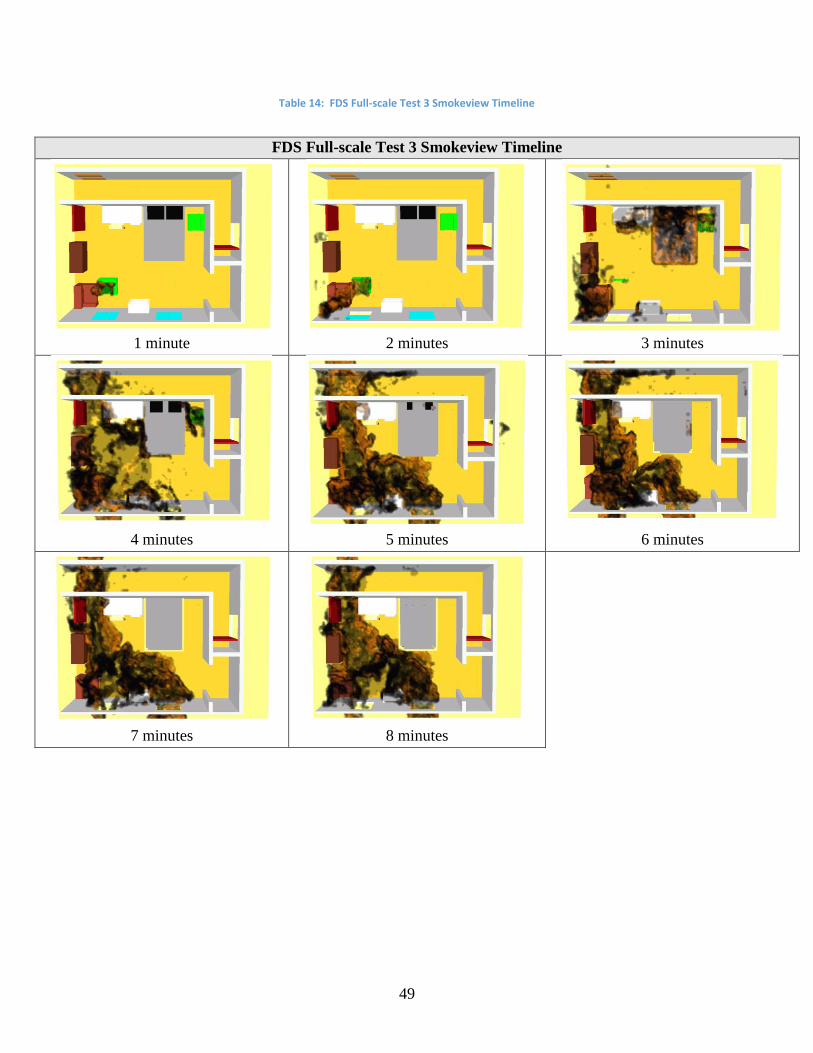
49
Table 14: FDS Full-scale Test 3 Smokeview Timeline
FDS Full-scale Test 3 Smokeview Timeline
1 minute
2 minutes
3 minutes
4 minutes
5 minutes
6 minutes
7 minutes
8 minutes
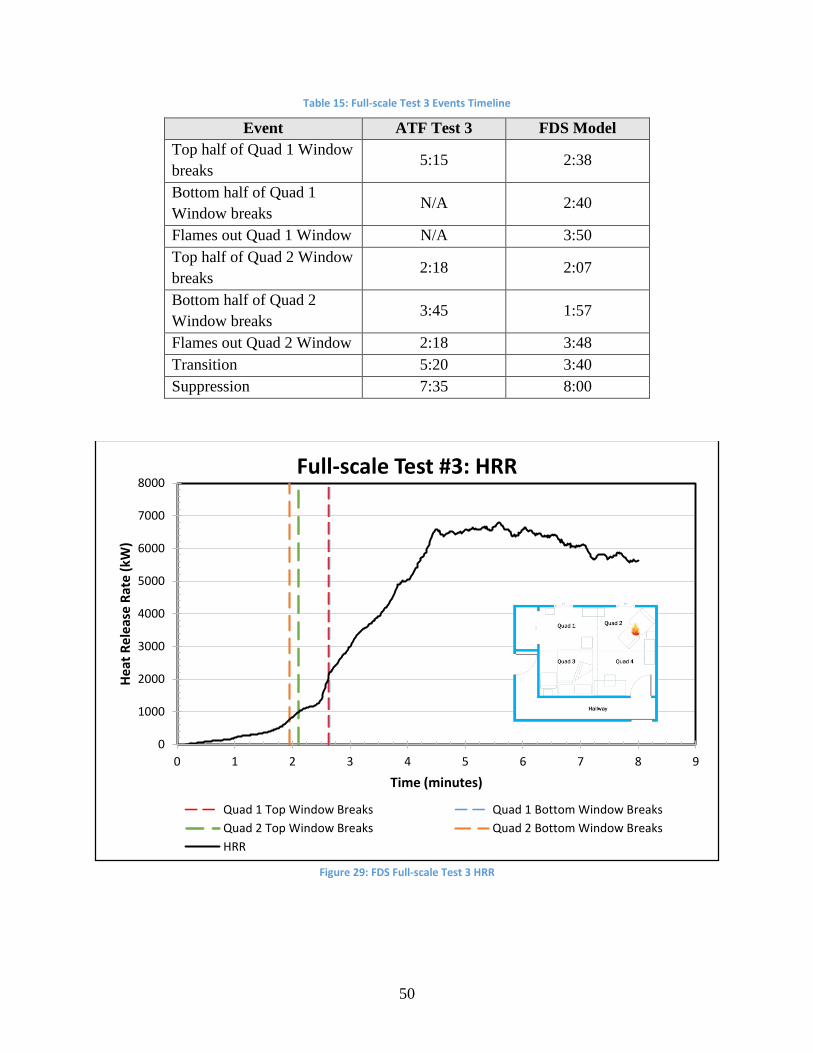
50
Table 15: Full-scale Test 3 Events Timeline
Event ATF Test 3 FDS Model
Top half of Quad 1 Window
breaks 5:15 2:38
Bottom half of Quad 1
Window breaks N/A 2:40
Flames out Quad 1 Window N/A 3:50
Top half of Quad 2 Window
breaks 2:18 2:07
Bottom half of Quad 2
Window breaks 3:45 1:57
Flames out Quad 2 Window 2:18 3:48
Transition 5:20 3:40
Suppression 7:35 8:00
Figure 29: FDS Full-scale Test 3 HRR
0
1000
2000
3000
4000
5000
6000
7000
8000
0 1 2 3 4 5 6 7 8 9
Hea
t R
ele
ase
Rat
e (k
W)
Time (minutes)
Full-scale Test #3: HRR
Quad 1 Top Window Breaks Quad 1 Bottom Window Breaks
Quad 2 Top Window Breaks Quad 2 Bottom Window Breaks
HRR
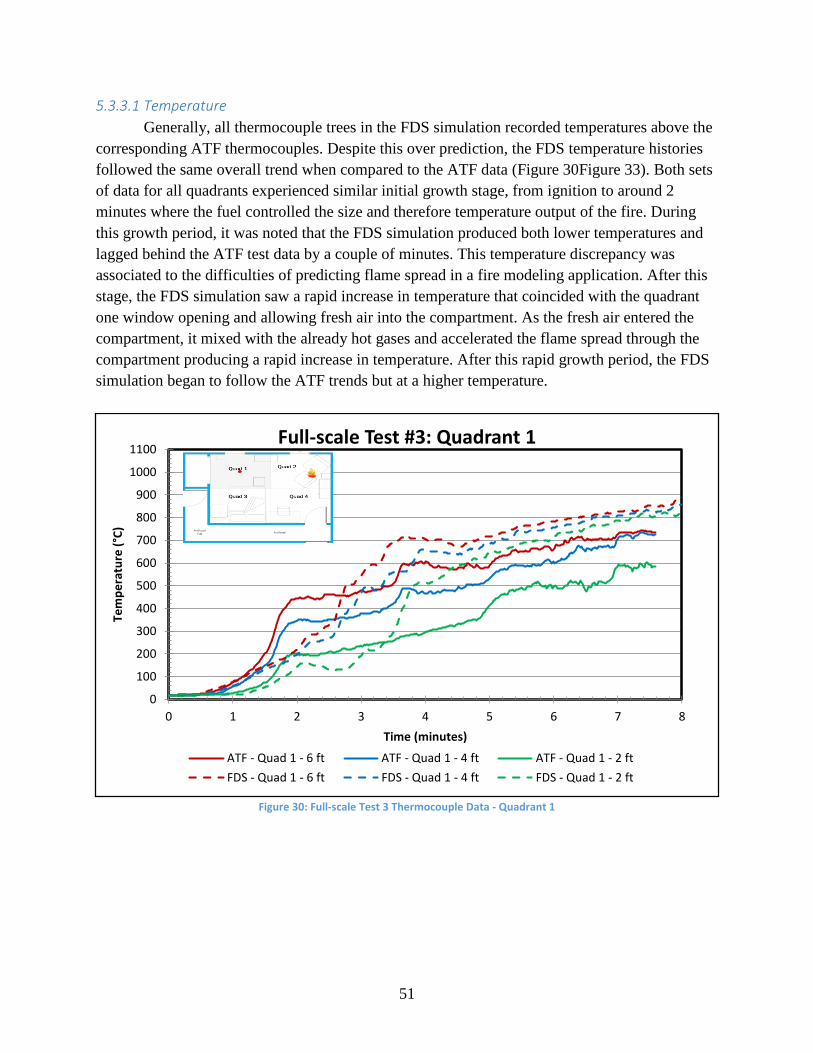
51
5.3.3.1 Temperature
Generally, all thermocouple trees in the FDS simulation recorded temperatures above the
corresponding ATF thermocouples. Despite this over prediction, the FDS temperature histories
followed the same overall trend when compared to the ATF data (Figure 30Figure 33). Both sets
of data for all quadrants experienced similar initial growth stage, from ignition to around 2
minutes where the fuel controlled the size and therefore temperature output of the fire. During
this growth period, it was noted that the FDS simulation produced both lower temperatures and
lagged behind the ATF test data by a couple of minutes. This temperature discrepancy was
associated to the difficulties of predicting flame spread in a fire modeling application. After this
stage, the FDS simulation saw a rapid increase in temperature that coincided with the quadrant
one window opening and allowing fresh air into the compartment. As the fresh air entered the
compartment, it mixed with the already hot gases and accelerated the flame spread through the
compartment producing a rapid increase in temperature. After this rapid growth period, the FDS
simulation began to follow the ATF trends but at a higher temperature.
Figure 30: Full-scale Test 3 Thermocouple Data - Quadrant 1
0
100
200
300
400
500
600
700
800
900
1000
1100
0 1 2 3 4 5 6 7 8
Tem
pe
ratu
re (
°C)
Time (minutes)
Full-scale Test #3: Quadrant 1
ATF - Quad 1 - 6 ft ATF - Quad 1 - 4 ft ATF - Quad 1 - 2 ft
FDS - Quad 1 - 6 ft FDS - Quad 1 - 4 ft FDS - Quad 1 - 2 ft
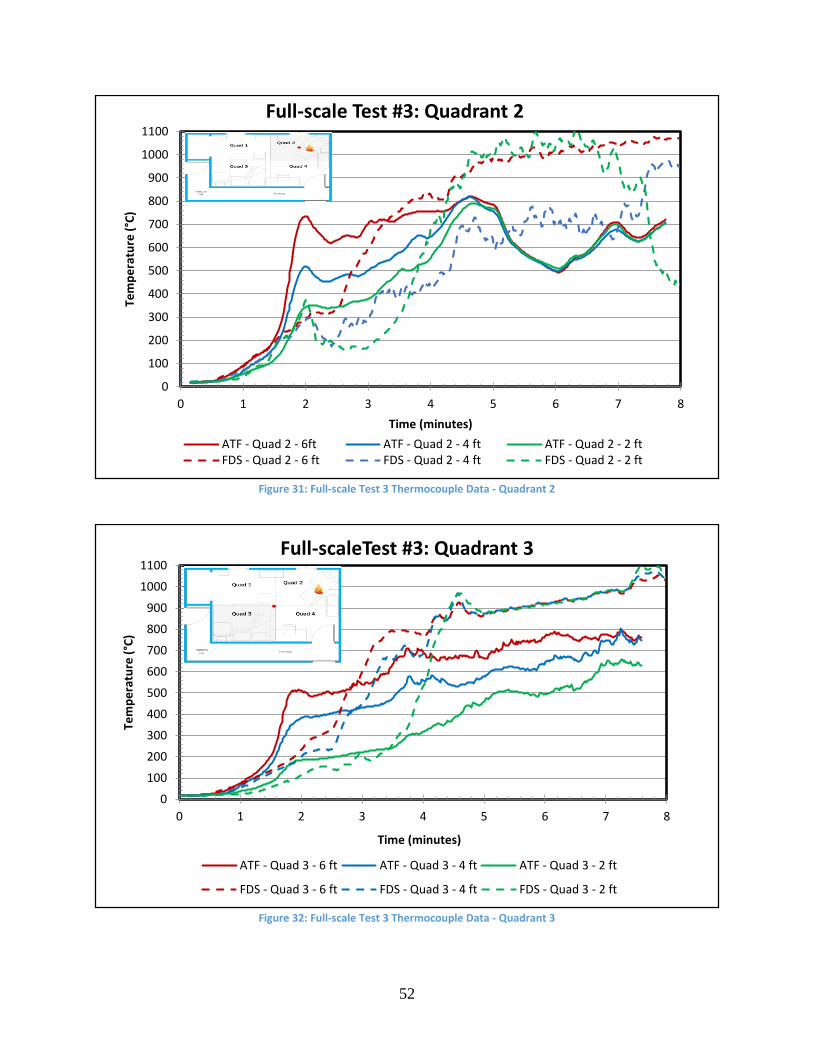
52
Figure 31: Full-scale Test 3 Thermocouple Data - Quadrant 2
Figure 32: Full-scale Test 3 Thermocouple Data - Quadrant 3
0
100
200
300
400
500
600
700
800
900
1000
1100
0 1 2 3 4 5 6 7 8
Tem
pe
ratu
re (
°C)
Time (minutes)
Full-scale Test #3: Quadrant 2
ATF - Quad 2 - 6ft ATF - Quad 2 - 4 ft ATF - Quad 2 - 2 ftFDS - Quad 2 - 6 ft FDS - Quad 2 - 4 ft FDS - Quad 2 - 2 ft
0
100
200
300
400
500
600
700
800
900
1000
1100
0 1 2 3 4 5 6 7 8
Tem
pe
ratu
re (
°C)
Time (minutes)
Full-scaleTest #3: Quadrant 3
ATF - Quad 3 - 6 ft ATF - Quad 3 - 4 ft ATF - Quad 3 - 2 ft
FDS - Quad 3 - 6 ft FDS - Quad 3 - 4 ft FDS - Quad 3 - 2 ft
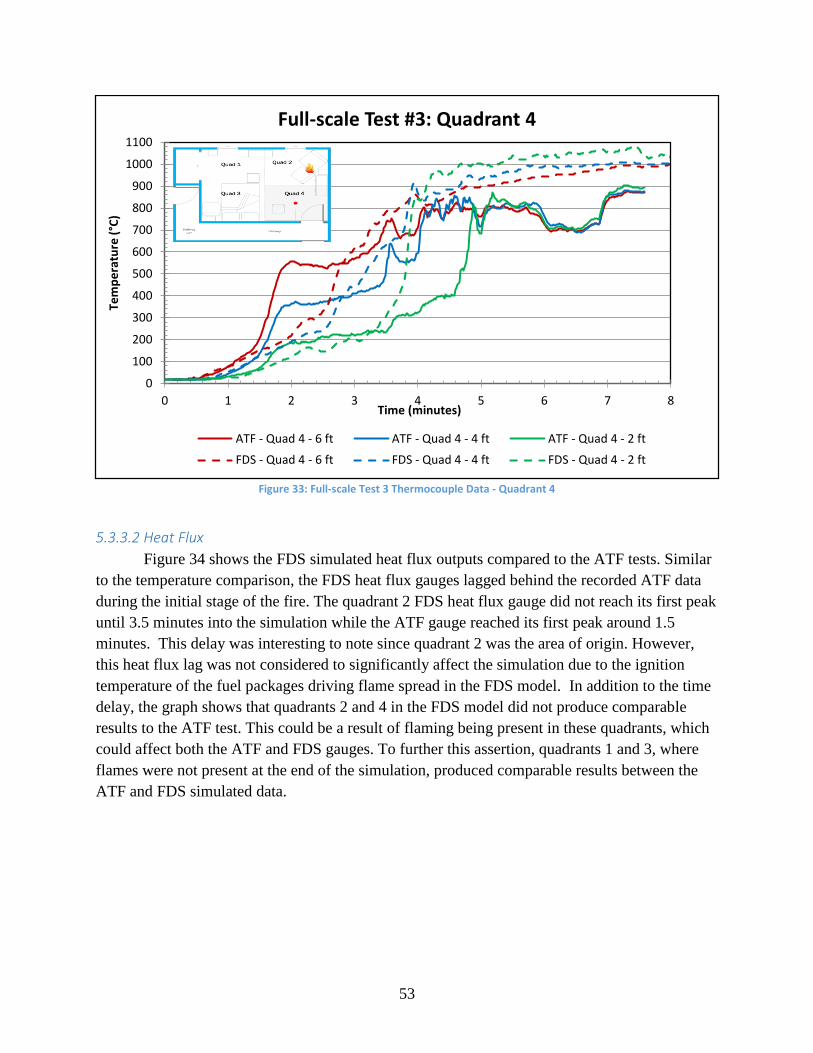
53
Figure 33: Full-scale Test 3 Thermocouple Data - Quadrant 4
5.3.3.2 Heat Flux
Figure 34 shows the FDS simulated heat flux outputs compared to the ATF tests. Similar
to the temperature comparison, the FDS heat flux gauges lagged behind the recorded ATF data
during the initial stage of the fire. The quadrant 2 FDS heat flux gauge did not reach its first peak
until 3.5 minutes into the simulation while the ATF gauge reached its first peak around 1.5
minutes. This delay was interesting to note since quadrant 2 was the area of origin. However,
this heat flux lag was not considered to significantly affect the simulation due to the ignition
temperature of the fuel packages driving flame spread in the FDS model. In addition to the time
delay, the graph shows that quadrants 2 and 4 in the FDS model did not produce comparable
results to the ATF test. This could be a result of flaming being present in these quadrants, which
could affect both the ATF and FDS gauges. To further this assertion, quadrants 1 and 3, where
flames were not present at the end of the simulation, produced comparable results between the
ATF and FDS simulated data.
0
100
200
300
400
500
600
700
800
900
1000
1100
0 1 2 3 4 5 6 7 8
Tem
pe
ratu
re (
°C)
Time (minutes)
Full-scale Test #3: Quadrant 4
ATF - Quad 4 - 6 ft ATF - Quad 4 - 4 ft ATF - Quad 4 - 2 ft
FDS - Quad 4 - 6 ft FDS - Quad 4 - 4 ft FDS - Quad 4 - 2 ft
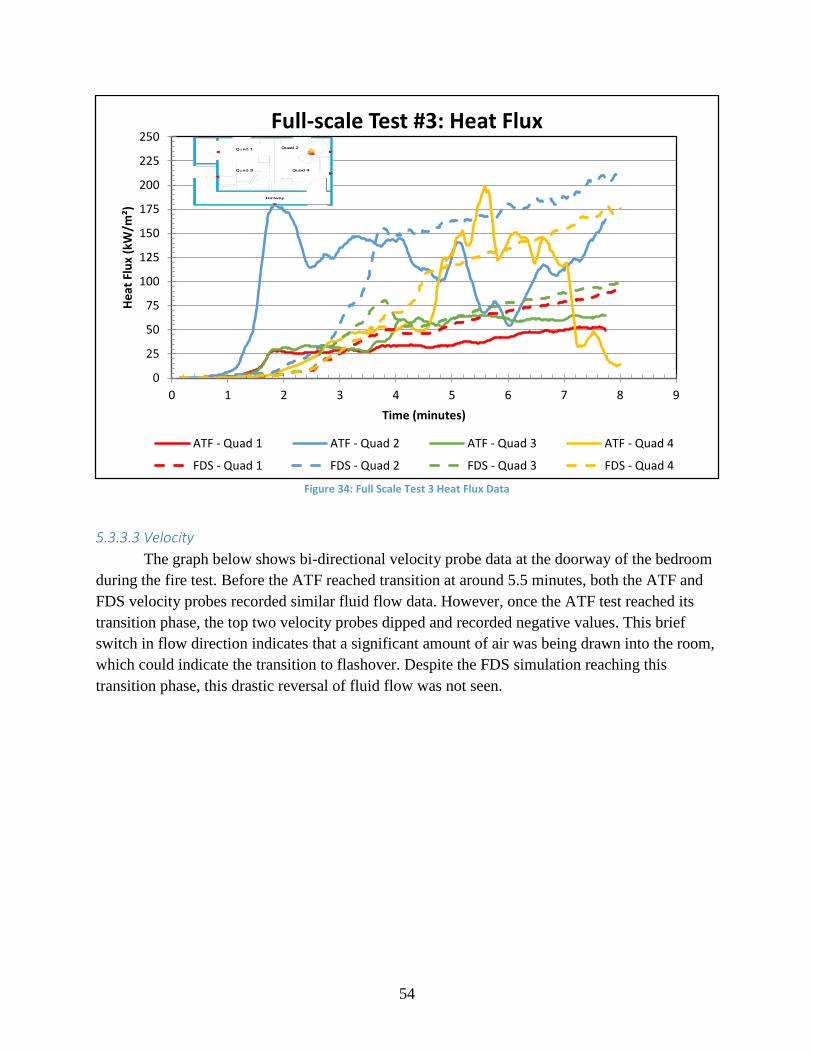
54
Figure 34: Full Scale Test 3 Heat Flux Data
5.3.3.3 Velocity
The graph below shows bi-directional velocity probe data at the doorway of the bedroom
during the fire test. Before the ATF reached transition at around 5.5 minutes, both the ATF and
FDS velocity probes recorded similar fluid flow data. However, once the ATF test reached its
transition phase, the top two velocity probes dipped and recorded negative values. This brief
switch in flow direction indicates that a significant amount of air was being drawn into the room,
which could indicate the transition to flashover. Despite the FDS simulation reaching this
transition phase, this drastic reversal of fluid flow was not seen.
0
25
50
75
100
125
150
175
200
225
250
0 1 2 3 4 5 6 7 8 9
He
at F
lux
(kW
/m²)
Time (minutes)
Full-scale Test #3: Heat Flux
ATF - Quad 1 ATF - Quad 2 ATF - Quad 3 ATF - Quad 4
FDS - Quad 1 FDS - Quad 2 FDS - Quad 3 FDS - Quad 4
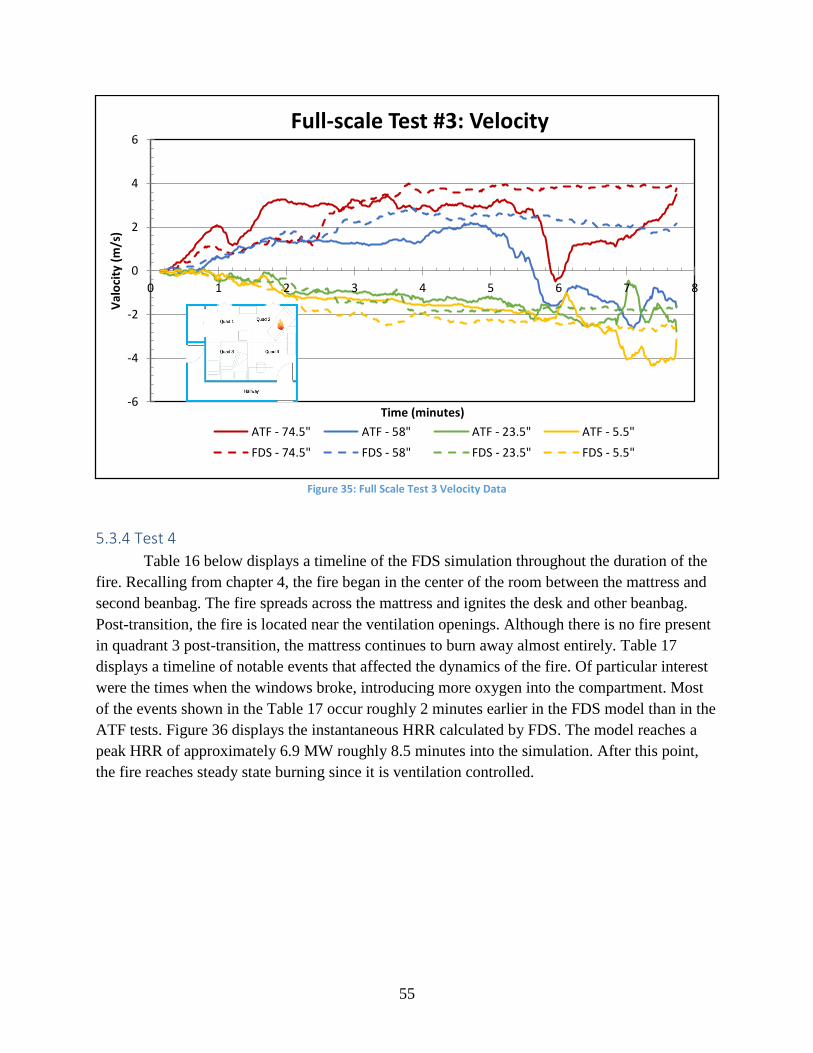
55
Figure 35: Full Scale Test 3 Velocity Data
5.3.4 Test 4
Table 16 below displays a timeline of the FDS simulation throughout the duration of the
fire. Recalling from chapter 4, the fire began in the center of the room between the mattress and
second beanbag. The fire spreads across the mattress and ignites the desk and other beanbag.
Post-transition, the fire is located near the ventilation openings. Although there is no fire present
in quadrant 3 post-transition, the mattress continues to burn away almost entirely. Table 17
displays a timeline of notable events that affected the dynamics of the fire. Of particular interest
were the times when the windows broke, introducing more oxygen into the compartment. Most
of the events shown in the Table 17 occur roughly 2 minutes earlier in the FDS model than in the
ATF tests. Figure 36 displays the instantaneous HRR calculated by FDS. The model reaches a
peak HRR of approximately 6.9 MW roughly 8.5 minutes into the simulation. After this point,
the fire reaches steady state burning since it is ventilation controlled.
-6
-4
-2
0
2
4
6
0 1 2 3 4 5 6 7 8
Val
oci
ty (
m/s
)
Time (minutes)
Full-scale Test #3: Velocity
ATF - 74.5" ATF - 58" ATF - 23.5" ATF - 5.5"
FDS - 74.5" FDS - 58" FDS - 23.5" FDS - 5.5"
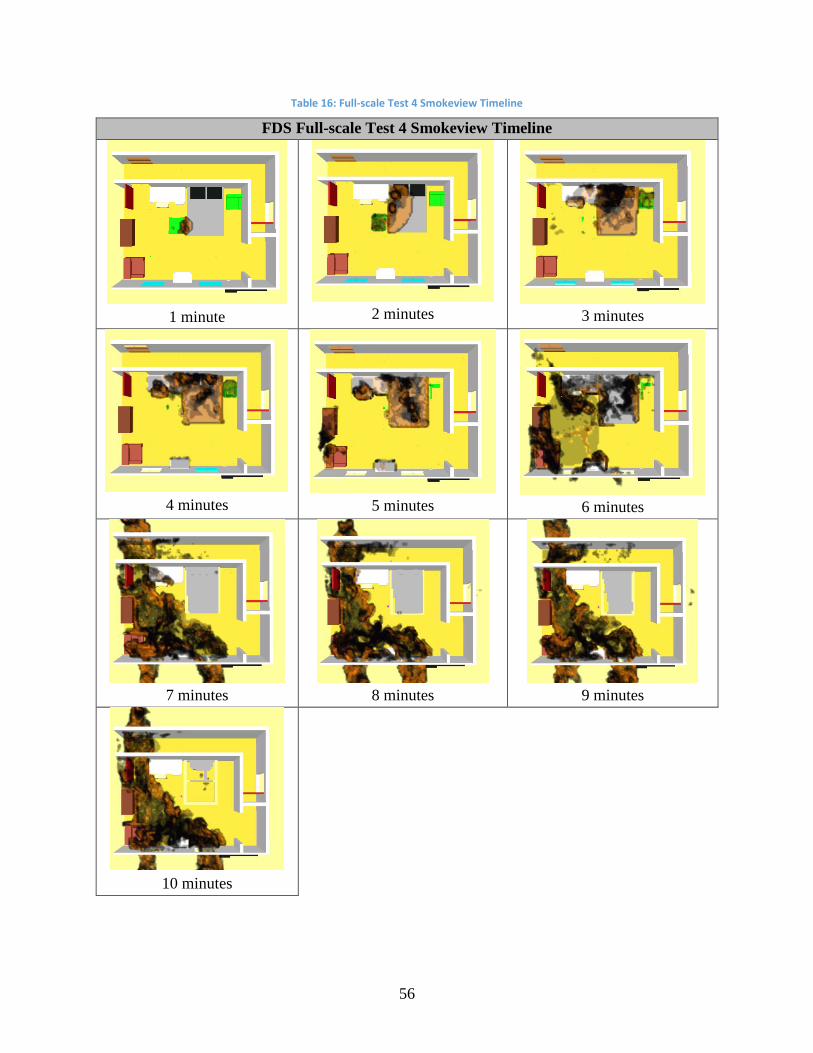
56
Table 16: Full-scale Test 4 Smokeview Timeline
FDS Full-scale Test 4 Smokeview Timeline
1 minute
2 minutes
3 minutes
4 minutes
5 minutes
6 minutes
7 minutes
8 minutes
9 minutes
10 minutes
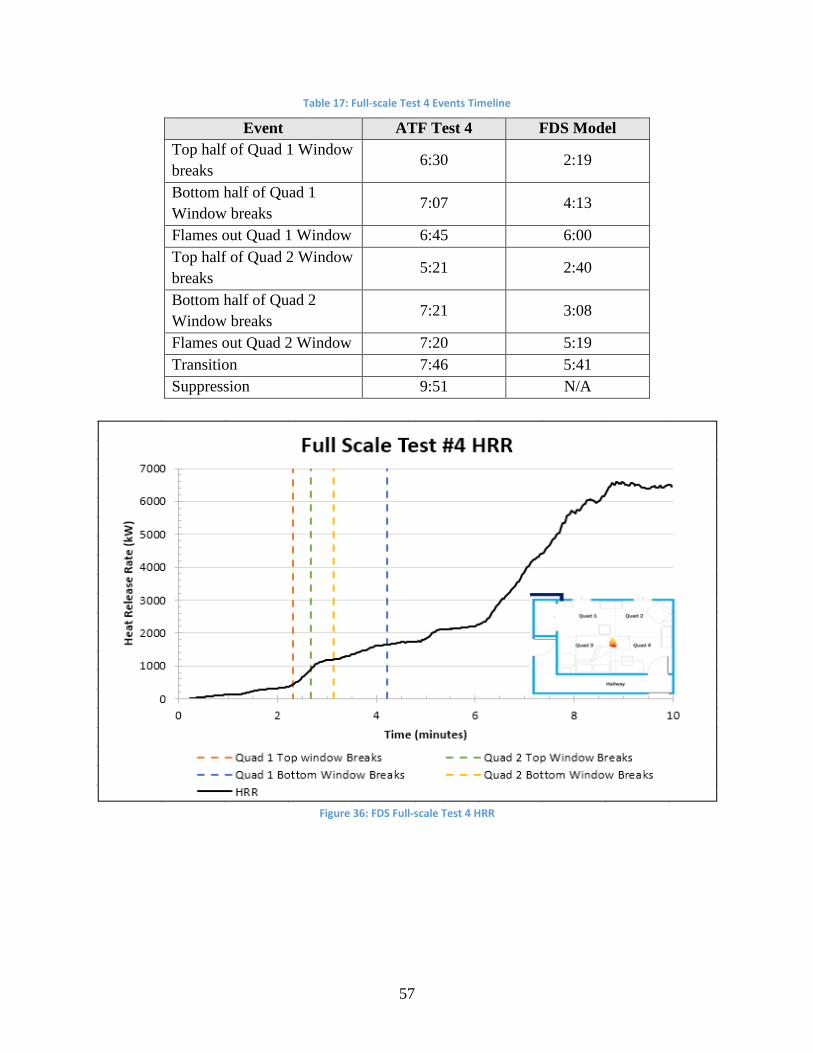
57
Table 17: Full-scale Test 4 Events Timeline
Event ATF Test 4 FDS Model
Top half of Quad 1 Window
breaks 6:30 2:19
Bottom half of Quad 1
Window breaks 7:07 4:13
Flames out Quad 1 Window 6:45 6:00
Top half of Quad 2 Window
breaks 5:21 2:40
Bottom half of Quad 2
Window breaks 7:21 3:08
Flames out Quad 2 Window 7:20 5:19
Transition 7:46 5:41
Suppression 9:51 N/A
Figure 36: FDS Full-scale Test 4 HRR
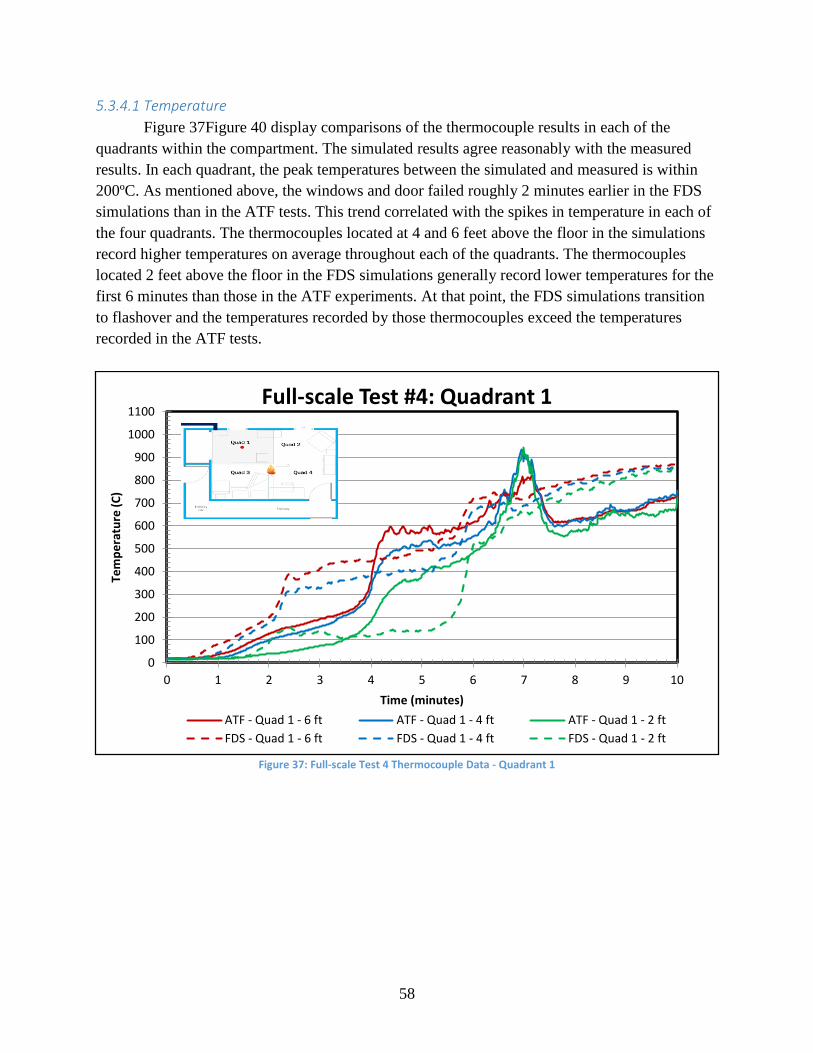
58
5.3.4.1 Temperature
Figure 37Figure 40 display comparisons of the thermocouple results in each of the
quadrants within the compartment. The simulated results agree reasonably with the measured
results. In each quadrant, the peak temperatures between the simulated and measured is within
200ºC. As mentioned above, the windows and door failed roughly 2 minutes earlier in the FDS
simulations than in the ATF tests. This trend correlated with the spikes in temperature in each of
the four quadrants. The thermocouples located at 4 and 6 feet above the floor in the simulations
record higher temperatures on average throughout each of the quadrants. The thermocouples
located 2 feet above the floor in the FDS simulations generally record lower temperatures for the
first 6 minutes than those in the ATF experiments. At that point, the FDS simulations transition
to flashover and the temperatures recorded by those thermocouples exceed the temperatures
recorded in the ATF tests.
Figure 37: Full-scale Test 4 Thermocouple Data - Quadrant 1
0
100
200
300
400
500
600
700
800
900
1000
1100
0 1 2 3 4 5 6 7 8 9 10
Tem
pe
ratu
re (
C)
Time (minutes)
Full-scale Test #4: Quadrant 1
ATF - Quad 1 - 6 ft ATF - Quad 1 - 4 ft ATF - Quad 1 - 2 ft
FDS - Quad 1 - 6 ft FDS - Quad 1 - 4 ft FDS - Quad 1 - 2 ft
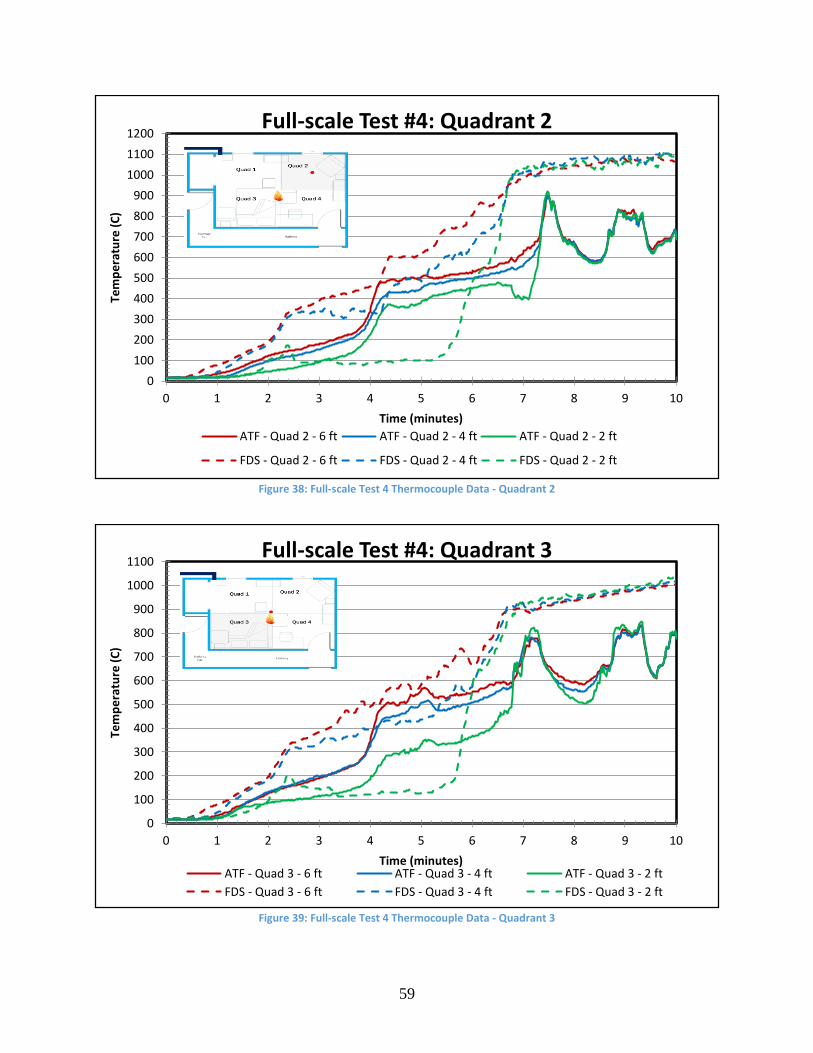
59
Figure 38: Full-scale Test 4 Thermocouple Data - Quadrant 2
Figure 39: Full-scale Test 4 Thermocouple Data - Quadrant 3
0
100
200
300
400
500
600
700
800
900
1000
1100
1200
0 1 2 3 4 5 6 7 8 9 10
Tem
pe
ratu
re (
C)
Time (minutes)
Full-scale Test #4: Quadrant 2
ATF - Quad 2 - 6 ft ATF - Quad 2 - 4 ft ATF - Quad 2 - 2 ft
FDS - Quad 2 - 6 ft FDS - Quad 2 - 4 ft FDS - Quad 2 - 2 ft
0
100
200
300
400
500
600
700
800
900
1000
1100
0 1 2 3 4 5 6 7 8 9 10
Tem
pe
ratu
re (
C)
Time (minutes)
Full-scale Test #4: Quadrant 3
ATF - Quad 3 - 6 ft ATF - Quad 3 - 4 ft ATF - Quad 3 - 2 ft
FDS - Quad 3 - 6 ft FDS - Quad 3 - 4 ft FDS - Quad 3 - 2 ft
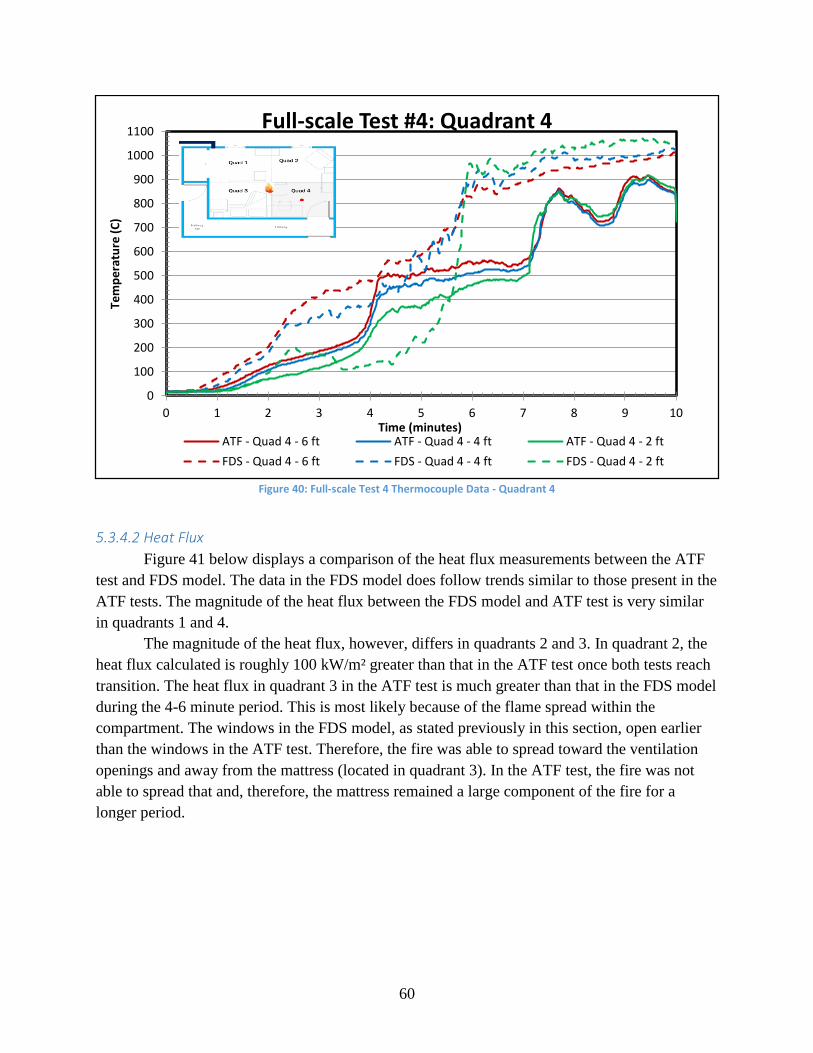
60
Figure 40: Full-scale Test 4 Thermocouple Data - Quadrant 4
5.3.4.2 Heat Flux
Figure 41 below displays a comparison of the heat flux measurements between the ATF
test and FDS model. The data in the FDS model does follow trends similar to those present in the
ATF tests. The magnitude of the heat flux between the FDS model and ATF test is very similar
in quadrants 1 and 4.
The magnitude of the heat flux, however, differs in quadrants 2 and 3. In quadrant 2, the
heat flux calculated is roughly 100 kW/m² greater than that in the ATF test once both tests reach
transition. The heat flux in quadrant 3 in the ATF test is much greater than that in the FDS model
during the 4-6 minute period. This is most likely because of the flame spread within the
compartment. The windows in the FDS model, as stated previously in this section, open earlier
than the windows in the ATF test. Therefore, the fire was able to spread toward the ventilation
openings and away from the mattress (located in quadrant 3). In the ATF test, the fire was not
able to spread that and, therefore, the mattress remained a large component of the fire for a
longer period.
0
100
200
300
400
500
600
700
800
900
1000
1100
0 1 2 3 4 5 6 7 8 9 10
Tem
pe
ratu
re (
C)
Time (minutes)
Full-scale Test #4: Quadrant 4
ATF - Quad 4 - 6 ft ATF - Quad 4 - 4 ft ATF - Quad 4 - 2 ft
FDS - Quad 4 - 6 ft FDS - Quad 4 - 4 ft FDS - Quad 4 - 2 ft
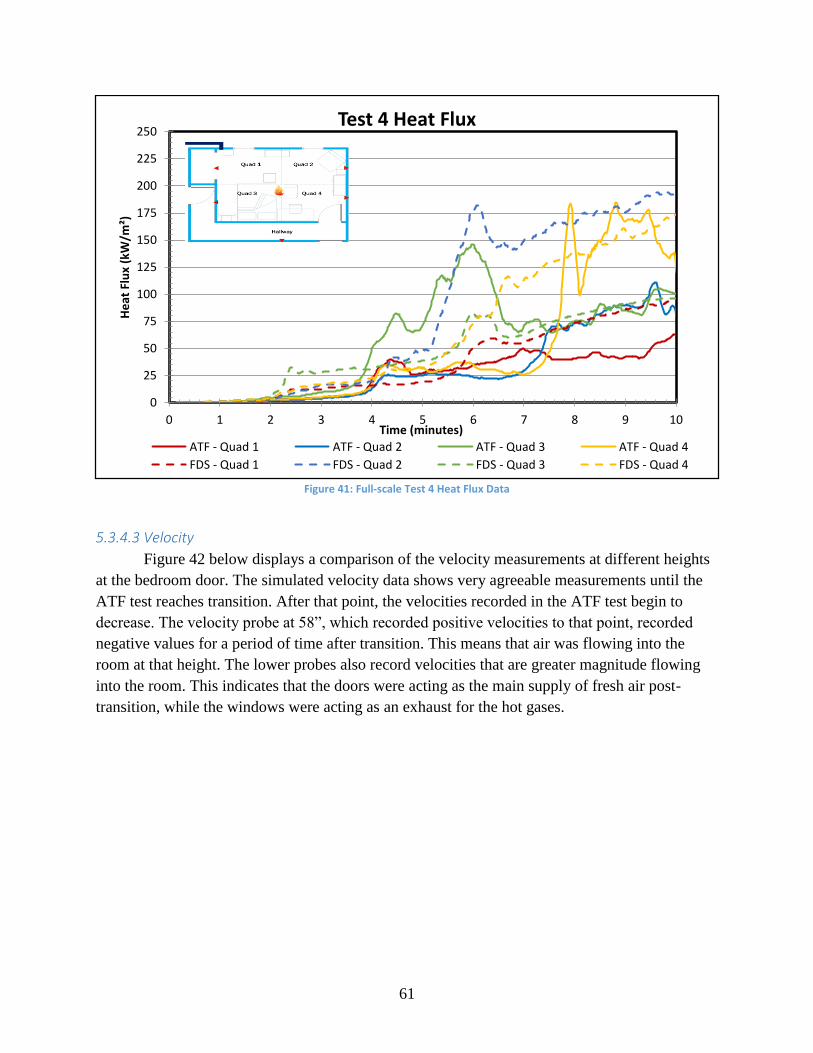
61
Figure 41: Full-scale Test 4 Heat Flux Data
5.3.4.3 Velocity
Figure 42 below displays a comparison of the velocity measurements at different heights
at the bedroom door. The simulated velocity data shows very agreeable measurements until the
ATF test reaches transition. After that point, the velocities recorded in the ATF test begin to
decrease. The velocity probe at 58”, which recorded positive velocities to that point, recorded
negative values for a period of time after transition. This means that air was flowing into the
room at that height. The lower probes also record velocities that are greater magnitude flowing
into the room. This indicates that the doors were acting as the main supply of fresh air post-
transition, while the windows were acting as an exhaust for the hot gases.
0
25
50
75
100
125
150
175
200
225
250
0 1 2 3 4 5 6 7 8 9 10
He
at F
lux
(kW
/m²)
Time (minutes)
Test 4 Heat Flux
ATF - Quad 1 ATF - Quad 2 ATF - Quad 3 ATF - Quad 4
FDS - Quad 1 FDS - Quad 2 FDS - Quad 3 FDS - Quad 4
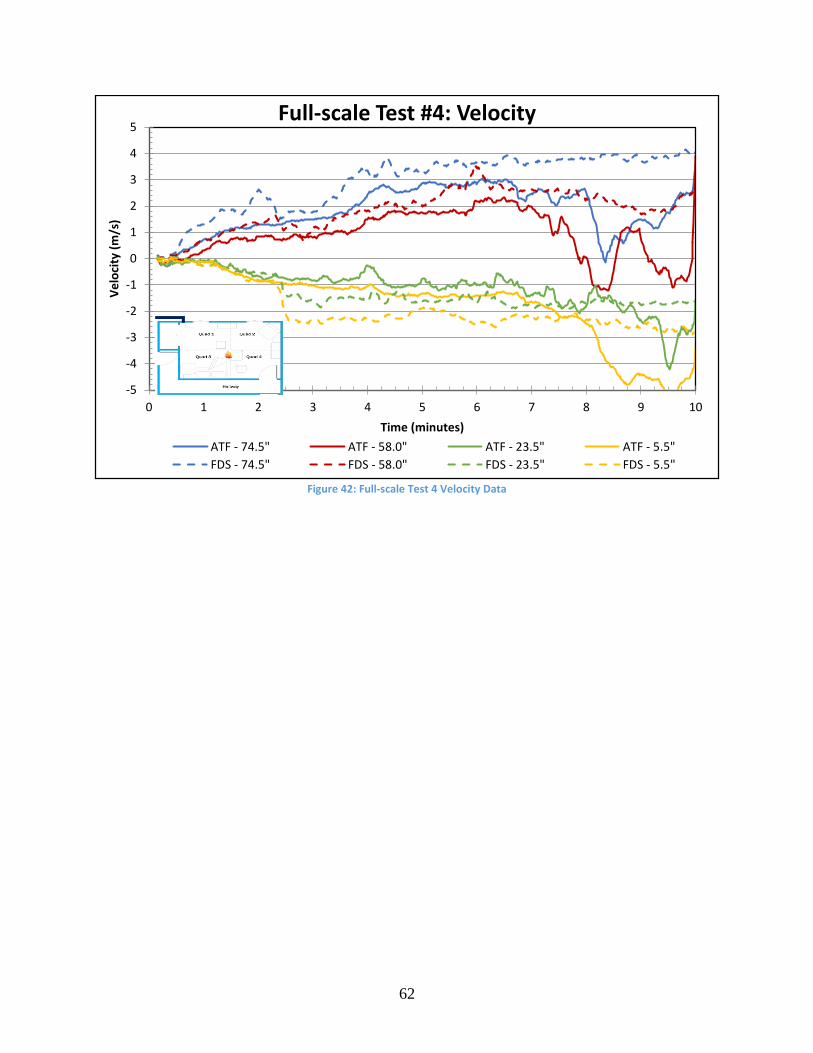
62
Figure 42: Full-scale Test 4 Velocity Data
-5
-4
-3
-2
-1
0
1
2
3
4
5
0 1 2 3 4 5 6 7 8 9 10
Ve
loci
ty (
m/s
)
Time (minutes)
Full-scale Test #4: Velocity
ATF - 74.5" ATF - 58.0" ATF - 23.5" ATF - 5.5"
FDS - 74.5" FDS - 58.0" FDS - 23.5" FDS - 5.5"
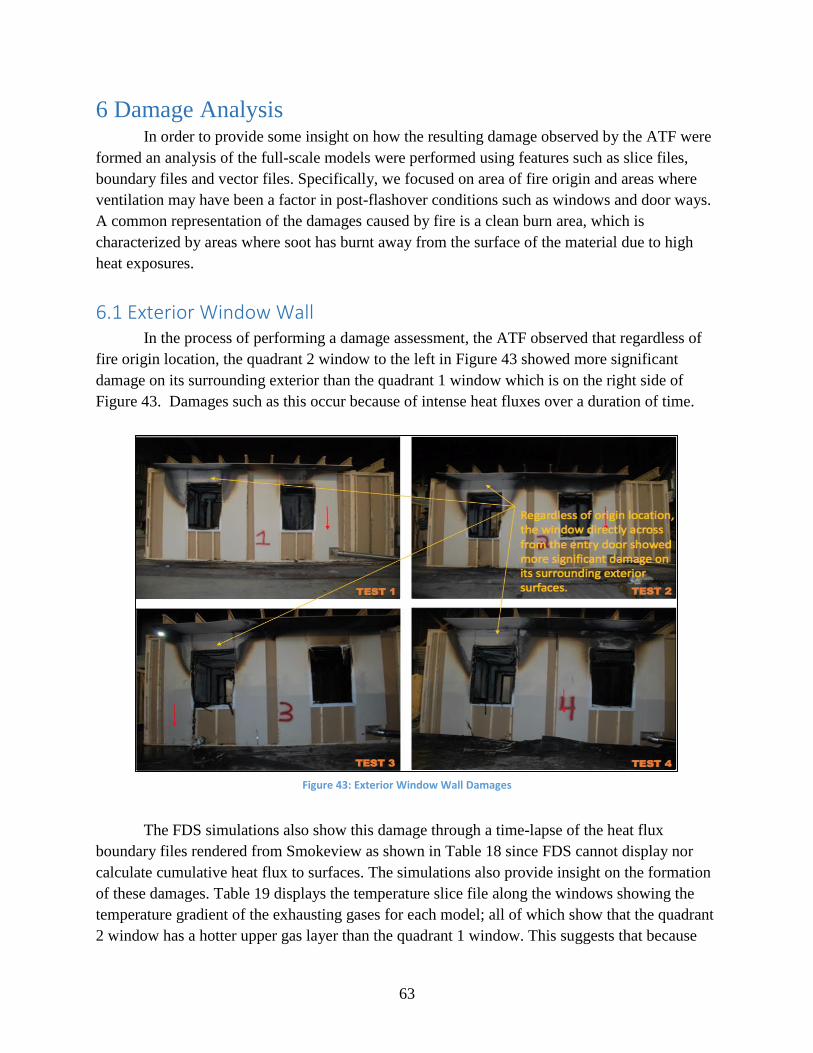
63
6 Damage Analysis In order to provide some insight on how the resulting damage observed by the ATF were
formed an analysis of the full-scale models were performed using features such as slice files,
boundary files and vector files. Specifically, we focused on area of fire origin and areas where
ventilation may have been a factor in post-flashover conditions such as windows and door ways.
A common representation of the damages caused by fire is a clean burn area, which is
characterized by areas where soot has burnt away from the surface of the material due to high
heat exposures.
6.1 Exterior Window Wall In the process of performing a damage assessment, the ATF observed that regardless of
fire origin location, the quadrant 2 window to the left in Figure 43 showed more significant
damage on its surrounding exterior than the quadrant 1 window which is on the right side of
Figure 43. Damages such as this occur because of intense heat fluxes over a duration of time.
Figure 43: Exterior Window Wall Damages
The FDS simulations also show this damage through a time-lapse of the heat flux
boundary files rendered from Smokeview as shown in Table 18 since FDS cannot display nor
calculate cumulative heat flux to surfaces. The simulations also provide insight on the formation
of these damages. Table 19 displays the temperature slice file along the windows showing the
temperature gradient of the exhausting gases for each model; all of which show that the quadrant
2 window has a hotter upper gas layer than the quadrant 1 window. This suggests that because
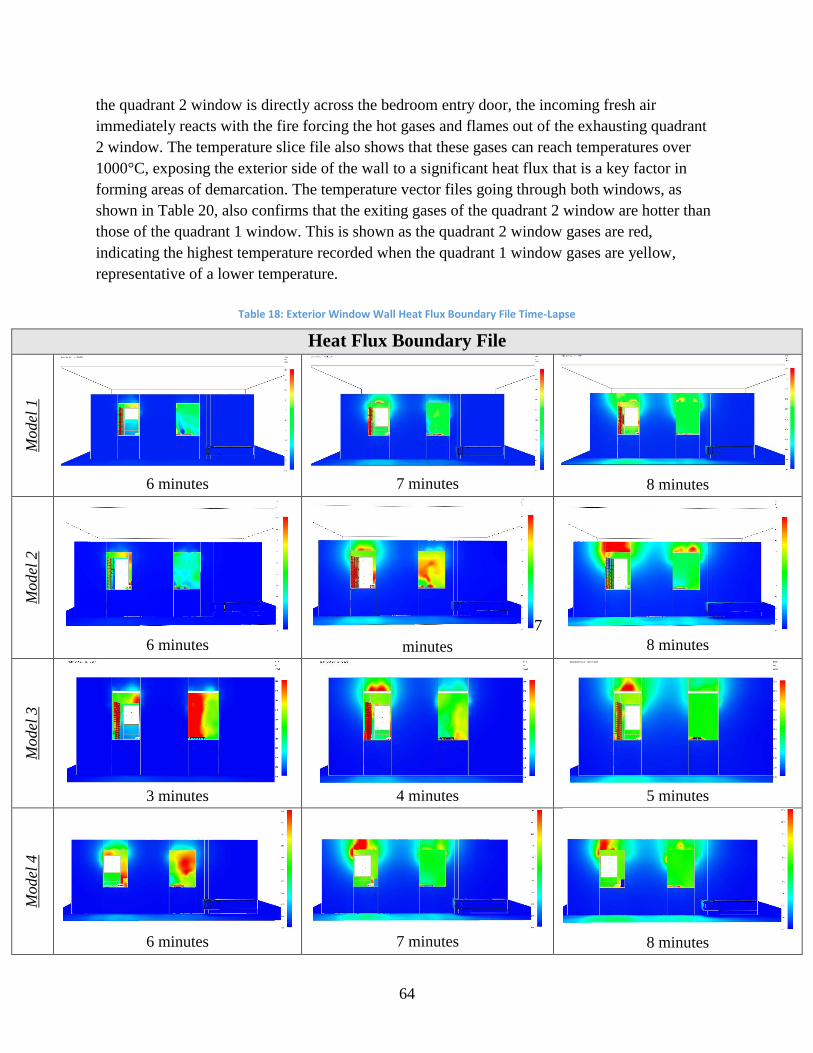
64
the quadrant 2 window is directly across the bedroom entry door, the incoming fresh air
immediately reacts with the fire forcing the hot gases and flames out of the exhausting quadrant
2 window. The temperature slice file also shows that these gases can reach temperatures over
1000°C, exposing the exterior side of the wall to a significant heat flux that is a key factor in
forming areas of demarcation. The temperature vector files going through both windows, as
shown in Table 20, also confirms that the exiting gases of the quadrant 2 window are hotter than
those of the quadrant 1 window. This is shown as the quadrant 2 window gases are red,
indicating the highest temperature recorded when the quadrant 1 window gases are yellow,
representative of a lower temperature.
Table 18: Exterior Window Wall Heat Flux Boundary File Time-Lapse
Heat Flux Boundary File
Model
1
6 minutes
7 minutes
8 minutes
Model
2
6 minutes
7
minutes
8 minutes
Model
3
3 minutes
4 minutes
5 minutes
Model
4
6 minutes 7 minutes 8 minutes
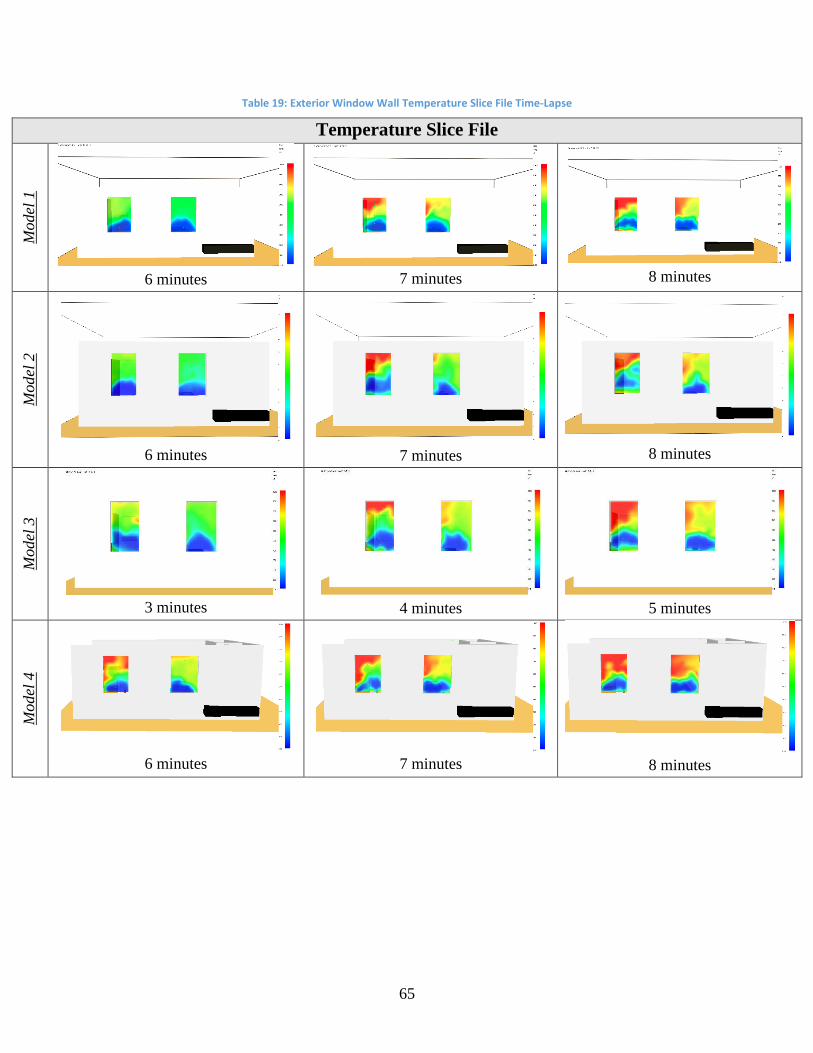
65
Table 19: Exterior Window Wall Temperature Slice File Time-Lapse
Temperature Slice File
Model
1
6 minutes
7 minutes
8 minutes
Model
2
6 minutes
7 minutes
8 minutes
Model
3
3 minutes
4 minutes
5 minutes
Model
4
6 minutes
7 minutes
8 minutes
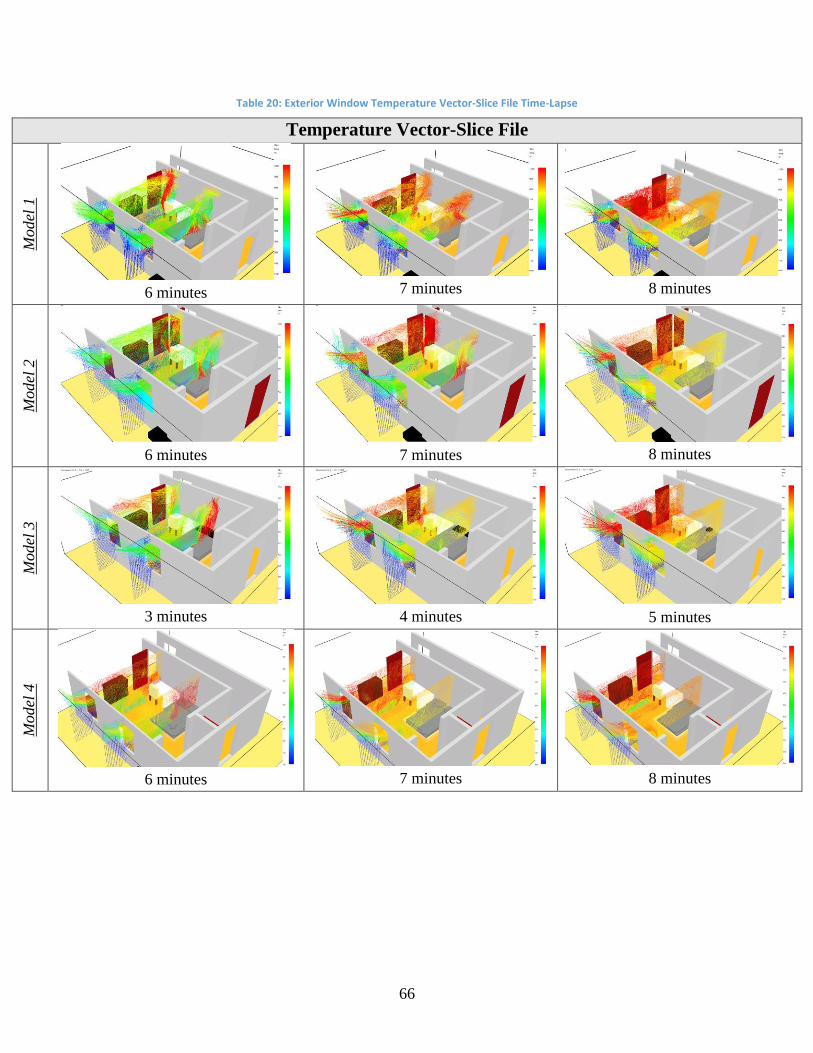
66
Table 20: Exterior Window Temperature Vector-Slice File Time-Lapse
Temperature Vector-Slice File
Model
1
6 minutes
7 minutes
8 minutes
Model
2
6 minutes
7 minutes
8 minutes
Model
3
3 minutes
4 minutes
5 minutes
Model
4
6 minutes
7 minutes
8 minutes
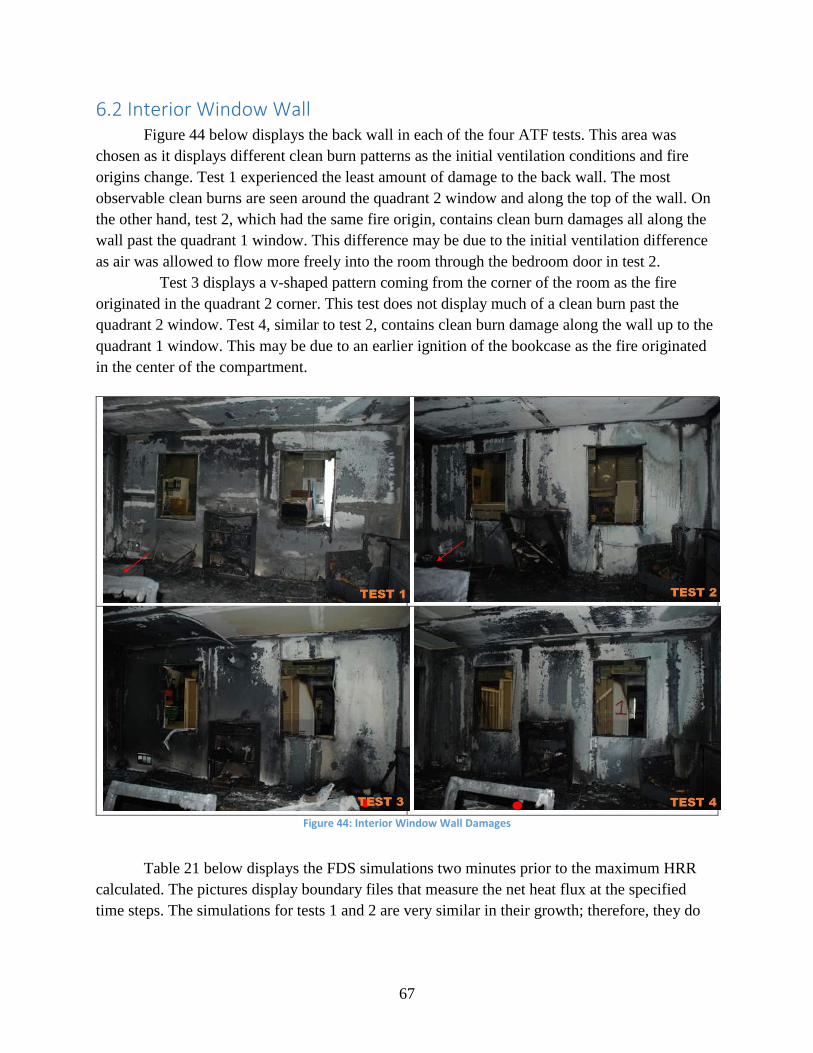
67
6.2 Interior Window Wall Figure 44 below displays the back wall in each of the four ATF tests. This area was
chosen as it displays different clean burn patterns as the initial ventilation conditions and fire
origins change. Test 1 experienced the least amount of damage to the back wall. The most
observable clean burns are seen around the quadrant 2 window and along the top of the wall. On
the other hand, test 2, which had the same fire origin, contains clean burn damages all along the
wall past the quadrant 1 window. This difference may be due to the initial ventilation difference
as air was allowed to flow more freely into the room through the bedroom door in test 2.
Test 3 displays a v-shaped pattern coming from the corner of the room as the fire
originated in the quadrant 2 corner. This test does not display much of a clean burn past the
quadrant 2 window. Test 4, similar to test 2, contains clean burn damage along the wall up to the
quadrant 1 window. This may be due to an earlier ignition of the bookcase as the fire originated
in the center of the compartment.
Figure 44: Interior Window Wall Damages
Table 21 below displays the FDS simulations two minutes prior to the maximum HRR
calculated. The pictures display boundary files that measure the net heat flux at the specified
time steps. The simulations for tests 1 and 2 are very similar in their growth; therefore, they do
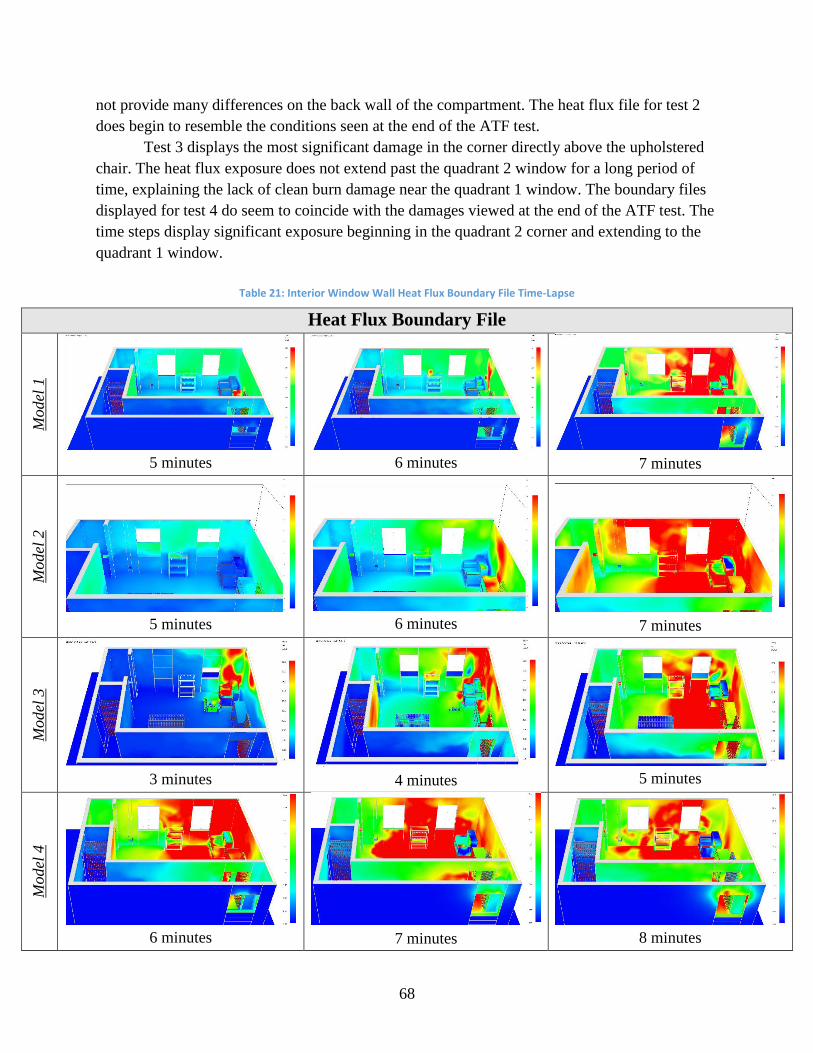
68
not provide many differences on the back wall of the compartment. The heat flux file for test 2
does begin to resemble the conditions seen at the end of the ATF test.
Test 3 displays the most significant damage in the corner directly above the upholstered
chair. The heat flux exposure does not extend past the quadrant 2 window for a long period of
time, explaining the lack of clean burn damage near the quadrant 1 window. The boundary files
displayed for test 4 do seem to coincide with the damages viewed at the end of the ATF test. The
time steps display significant exposure beginning in the quadrant 2 corner and extending to the
quadrant 1 window.
Table 21: Interior Window Wall Heat Flux Boundary File Time-Lapse
Heat Flux Boundary File
Model
1
5 minutes
6 minutes
7 minutes
Model
2
5 minutes
6 minutes
7 minutes
Mod
el 3
3 minutes
4 minutes
5 minutes
Model
4
6 minutes 7 minutes
8 minutes
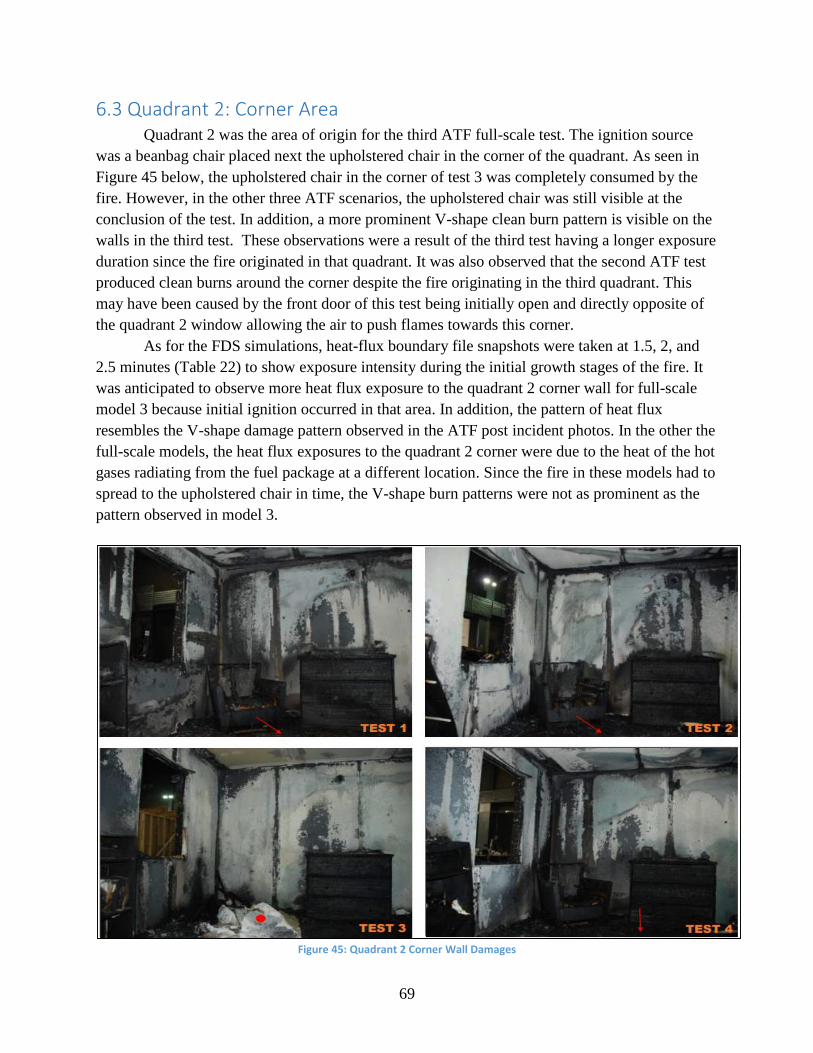
69
6.3 Quadrant 2: Corner Area Quadrant 2 was the area of origin for the third ATF full-scale test. The ignition source
was a beanbag chair placed next the upholstered chair in the corner of the quadrant. As seen in
Figure 45 below, the upholstered chair in the corner of test 3 was completely consumed by the
fire. However, in the other three ATF scenarios, the upholstered chair was still visible at the
conclusion of the test. In addition, a more prominent V-shape clean burn pattern is visible on the
walls in the third test. These observations were a result of the third test having a longer exposure
duration since the fire originated in that quadrant. It was also observed that the second ATF test
produced clean burns around the corner despite the fire originating in the third quadrant. This
may have been caused by the front door of this test being initially open and directly opposite of
the quadrant 2 window allowing the air to push flames towards this corner.
As for the FDS simulations, heat-flux boundary file snapshots were taken at 1.5, 2, and
2.5 minutes (Table 22) to show exposure intensity during the initial growth stages of the fire. It
was anticipated to observe more heat flux exposure to the quadrant 2 corner wall for full-scale
model 3 because initial ignition occurred in that area. In addition, the pattern of heat flux
resembles the V-shape damage pattern observed in the ATF post incident photos. In the other the
full-scale models, the heat flux exposures to the quadrant 2 corner were due to the heat of the hot
gases radiating from the fuel package at a different location. Since the fire in these models had to
spread to the upholstered chair in time, the V-shape burn patterns were not as prominent as the
pattern observed in model 3.
Figure 45: Quadrant 2 Corner Wall Damages
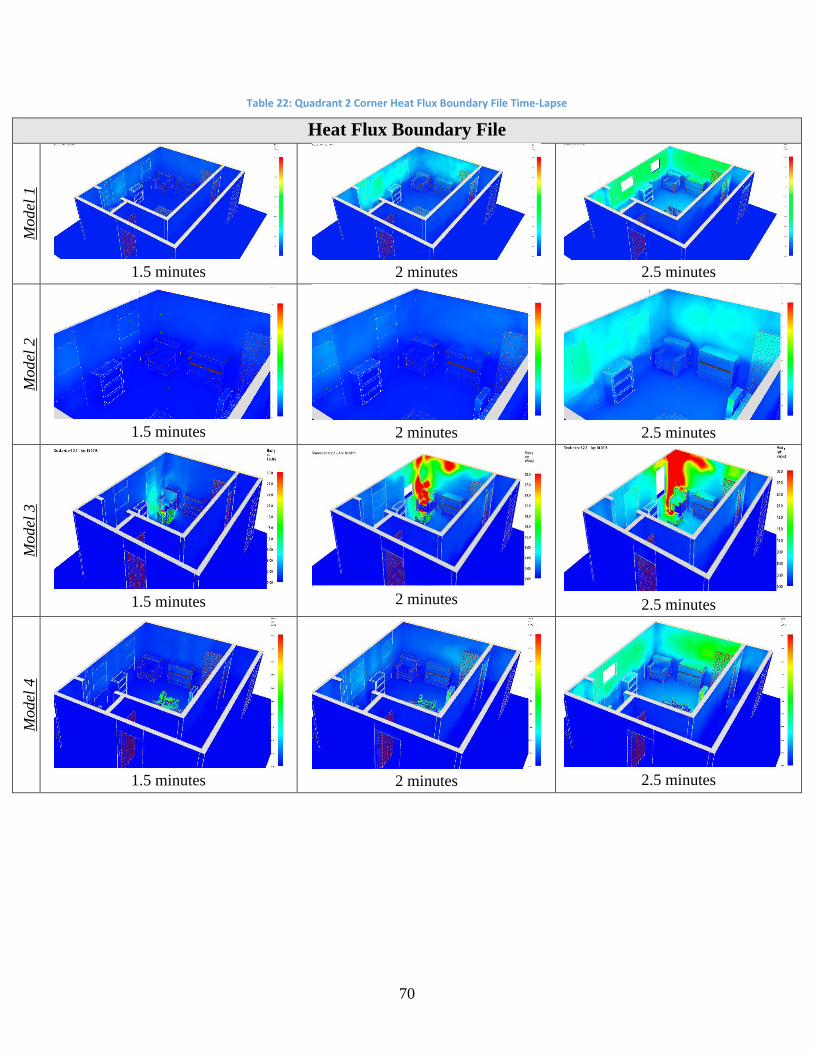
70
Table 22: Quadrant 2 Corner Heat Flux Boundary File Time-Lapse
Heat Flux Boundary File
Model
1
1.5 minutes
2 minutes
2.5 minutes
Mo
del
2
1.5 minutes
2 minutes
2.5 minutes
Model
3
1.5 minutes
2 minutes 2.5 minutes
Mo
del
4
1.5 minutes
2 minutes 2.5 minutes
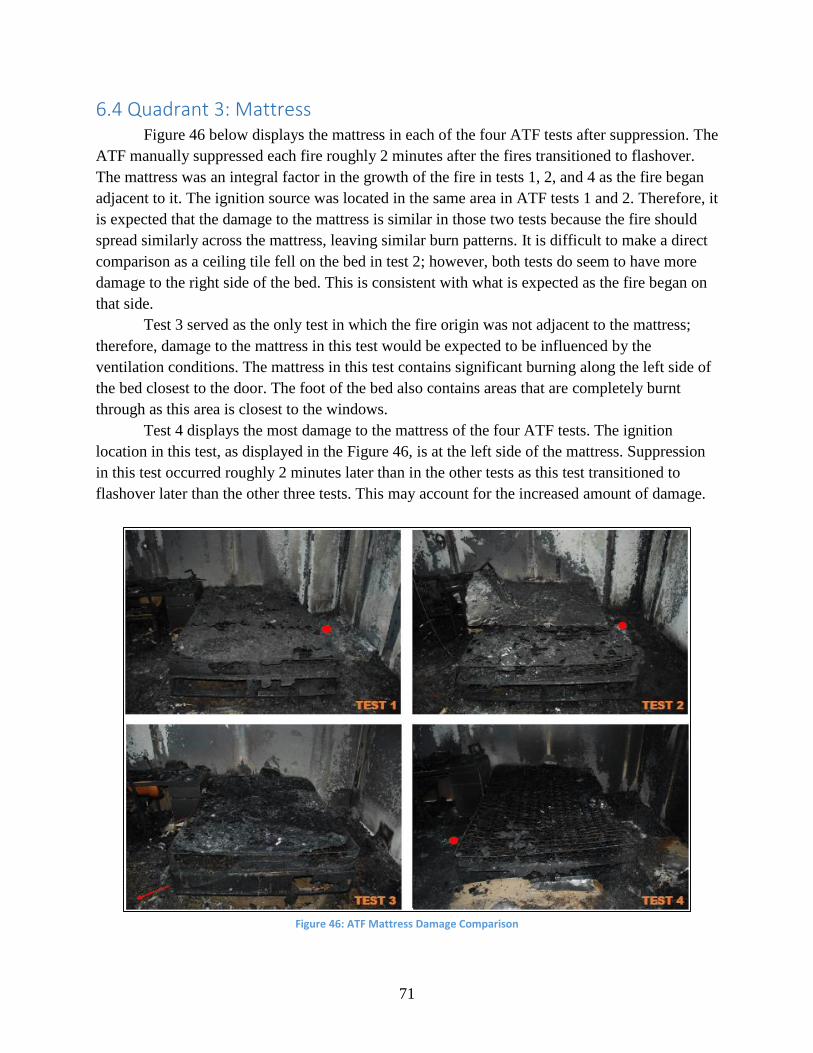
71
6.4 Quadrant 3: Mattress Figure 46 below displays the mattress in each of the four ATF tests after suppression. The
ATF manually suppressed each fire roughly 2 minutes after the fires transitioned to flashover.
The mattress was an integral factor in the growth of the fire in tests 1, 2, and 4 as the fire began
adjacent to it. The ignition source was located in the same area in ATF tests 1 and 2. Therefore, it
is expected that the damage to the mattress is similar in those two tests because the fire should
spread similarly across the mattress, leaving similar burn patterns. It is difficult to make a direct
comparison as a ceiling tile fell on the bed in test 2; however, both tests do seem to have more
damage to the right side of the bed. This is consistent with what is expected as the fire began on
that side.
Test 3 served as the only test in which the fire origin was not adjacent to the mattress;
therefore, damage to the mattress in this test would be expected to be influenced by the
ventilation conditions. The mattress in this test contains significant burning along the left side of
the bed closest to the door. The foot of the bed also contains areas that are completely burnt
through as this area is closest to the windows.
Test 4 displays the most damage to the mattress of the four ATF tests. The ignition
location in this test, as displayed in the Figure 46, is at the left side of the mattress. Suppression
in this test occurred roughly 2 minutes later than in the other tests as this test transitioned to
flashover later than the other three tests. This may account for the increased amount of damage.
Figure 46: ATF Mattress Damage Comparison
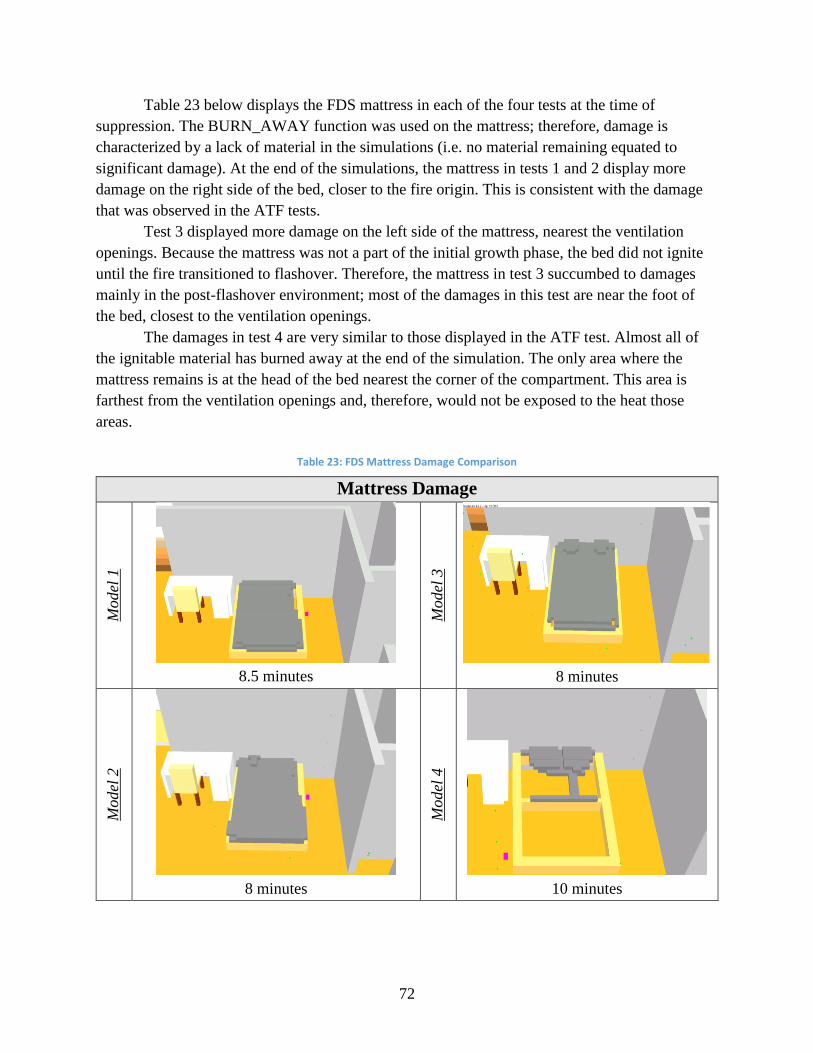
72
Table 23 below displays the FDS mattress in each of the four tests at the time of
suppression. The BURN_AWAY function was used on the mattress; therefore, damage is
characterized by a lack of material in the simulations (i.e. no material remaining equated to
significant damage). At the end of the simulations, the mattress in tests 1 and 2 display more
damage on the right side of the bed, closer to the fire origin. This is consistent with the damage
that was observed in the ATF tests.
Test 3 displayed more damage on the left side of the mattress, nearest the ventilation
openings. Because the mattress was not a part of the initial growth phase, the bed did not ignite
until the fire transitioned to flashover. Therefore, the mattress in test 3 succumbed to damages
mainly in the post-flashover environment; most of the damages in this test are near the foot of
the bed, closest to the ventilation openings.
The damages in test 4 are very similar to those displayed in the ATF test. Almost all of
the ignitable material has burned away at the end of the simulation. The only area where the
mattress remains is at the head of the bed nearest the corner of the compartment. This area is
farthest from the ventilation openings and, therefore, would not be exposed to the heat those
areas.
Table 23: FDS Mattress Damage Comparison
Mattress Damage
Model
1
8.5 minutes
Model
3
8 minutes
Model
2
8 minutes
Model
4
10 minutes
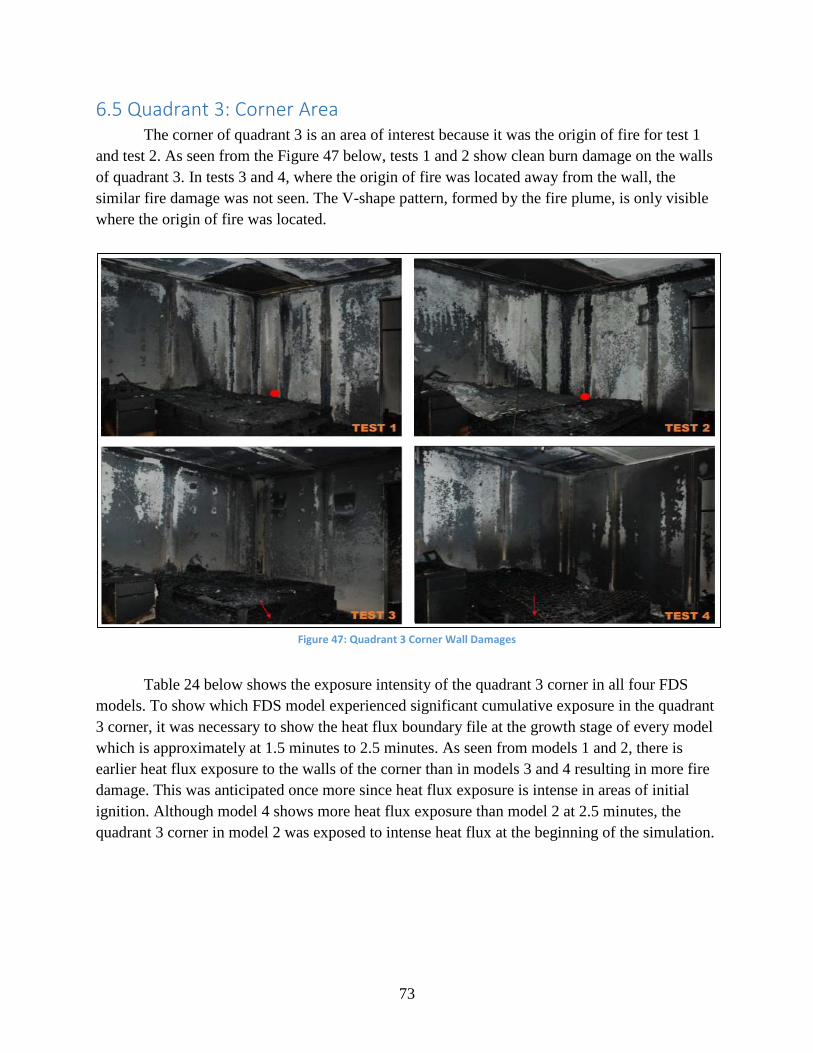
73
6.5 Quadrant 3: Corner Area The corner of quadrant 3 is an area of interest because it was the origin of fire for test 1
and test 2. As seen from the Figure 47 below, tests 1 and 2 show clean burn damage on the walls
of quadrant 3. In tests 3 and 4, where the origin of fire was located away from the wall, the
similar fire damage was not seen. The V-shape pattern, formed by the fire plume, is only visible
where the origin of fire was located.
Figure 47: Quadrant 3 Corner Wall Damages
Table 24 below shows the exposure intensity of the quadrant 3 corner in all four FDS
models. To show which FDS model experienced significant cumulative exposure in the quadrant
3 corner, it was necessary to show the heat flux boundary file at the growth stage of every model
which is approximately at 1.5 minutes to 2.5 minutes. As seen from models 1 and 2, there is
earlier heat flux exposure to the walls of the corner than in models 3 and 4 resulting in more fire
damage. This was anticipated once more since heat flux exposure is intense in areas of initial
ignition. Although model 4 shows more heat flux exposure than model 2 at 2.5 minutes, the
quadrant 3 corner in model 2 was exposed to intense heat flux at the beginning of the simulation.
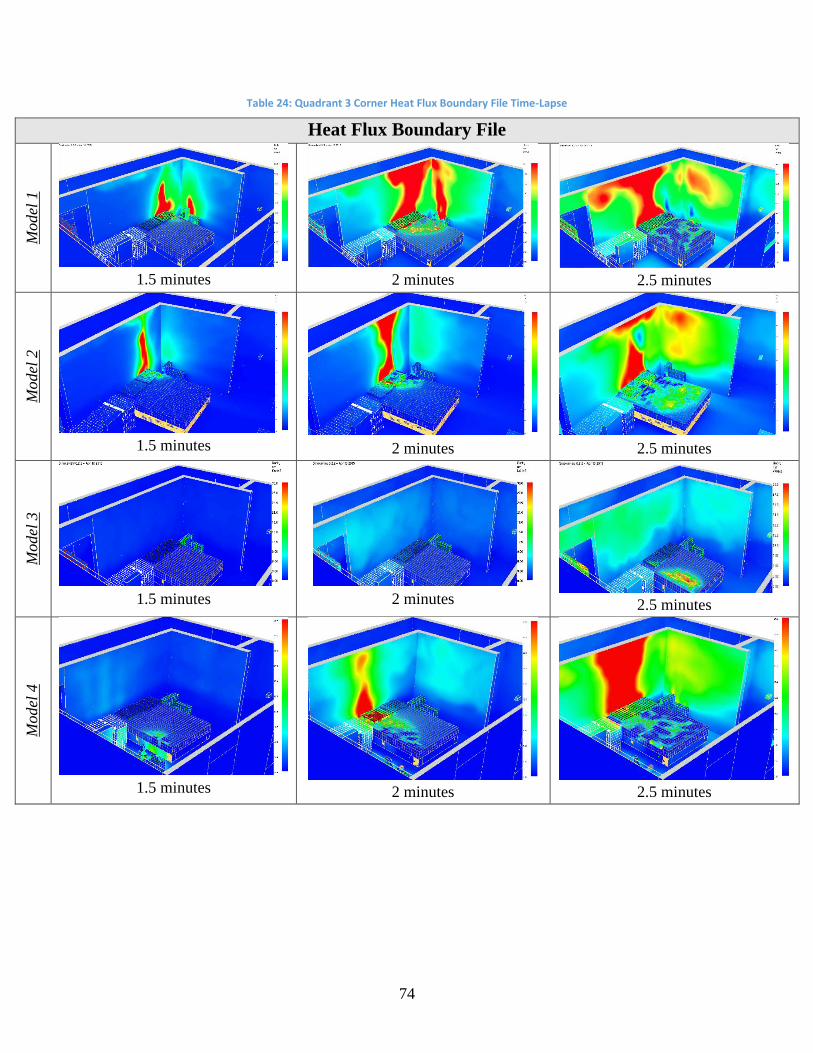
74
Table 24: Quadrant 3 Corner Heat Flux Boundary File Time-Lapse
Heat Flux Boundary File
Model
1
1.5 minutes
2 minutes
2.5 minutes
Model
2
1.5 minutes
2 minutes
2.5 minutes
Model
3
1.5 minutes
2 minutes
2.5 minutes
Model
4
1.5 minutes
2 minutes
2.5 minutes
75
7 Conclusions FDS was used to simulate a series of four compartment fire tests conducted by ATF to
provide further insight on how changing the fire location or initial ventilation conditions affects
fire growth, spread, and resulting damage. The analysis of the results calculated by FDS
determined that FDS could replicate the tests to a certain degree. In particular, the velocity
profiles were shown to be the most accurate results because FDS puts emphasis on thermally-
driven flow such as smoke transport. Similar trends and magnitude were also identified when
comparing the temperature results between the FDS simulations and ATF tests. From the FDS
results, ventilation was identified to be a key factor in fire growth as characterized by heat
release rates (HRR). Since the HRR for the overall compartment fire tests was not measured by
the ATF, FDS was able to provide this data through mathematical calculations. A relationship
between the effects of dynamic ventilation and HRR was identified such that when a window
failed, the HRR increased contributing to fire growth leading to the transition of flashover. In the
post flashover environment for all four FDS simulations, flaming combustion was observed only
in areas proximate to oxygen supplying vents such as windows and the outside door. This same
observation was made by ATF in their tests regardless of where the initial ignition was located,
flaming fire conditions existed only in areas of ventilation openings during the post-flashover
environment. Through the FDS simulations, the provided relationships between the resulting fire
conditions, the area of origin and changing ventilation conditions helped inform the scope by
which FDS could be used as tool to provide further insight to fire investigators in better
understanding a fire scene and the range of conditions that caused the resulting fire damage.
7.1 Future Work
Despite the reasonable agreement in overall magnitude and similar trends with the results
and analysis between the FDS simulations and the ATF tests, this project has identified certain
areas with room for improvement. The resulting damage of certain fuel packages caused by fire
conditions may provide more insight on identifying area of origin. To do so, utilizing the burn
away function in FDS would allow assessing and analyzing of cumulative damage to a certain
fuel package. Due to the complexity and uncertainty of the exact material properties of the fuel
packages used for this project, it was difficult to obtain a desired HRR while using the burn away
function. Given more time, further examination of the materials used in the fuel packages could
lead to better characterization of the material properties. Therefore, future work should consider
the following:
1. Obtain the actual materials of the fuel packages used in the ATF tests to perform
small-scale bench tests using the cone calorimeter to gather data or information of the
fuel packages such as:
a. Effective heat of combustion
b. Ignitibility (Critical heat flux to ignition)
c. Smoke and soot production
76
2. Using the cone calorimeter test data, derive material properties such as:
a. Ignition temperature
b. Thermal properties (specific heat cp, thermal conductivity k, density )
In addition, a better characterization of the thermal properties could allow for a more
accurate prediction of flame spread. The numerical flame spread for the FDS models relied upon
user specified material properties as they influenced how cells, in this case those that represent
the surface of a fuel, absorb energy and heat up. The cell then mathematically ignited when it
reached the user specified ignition temperature.
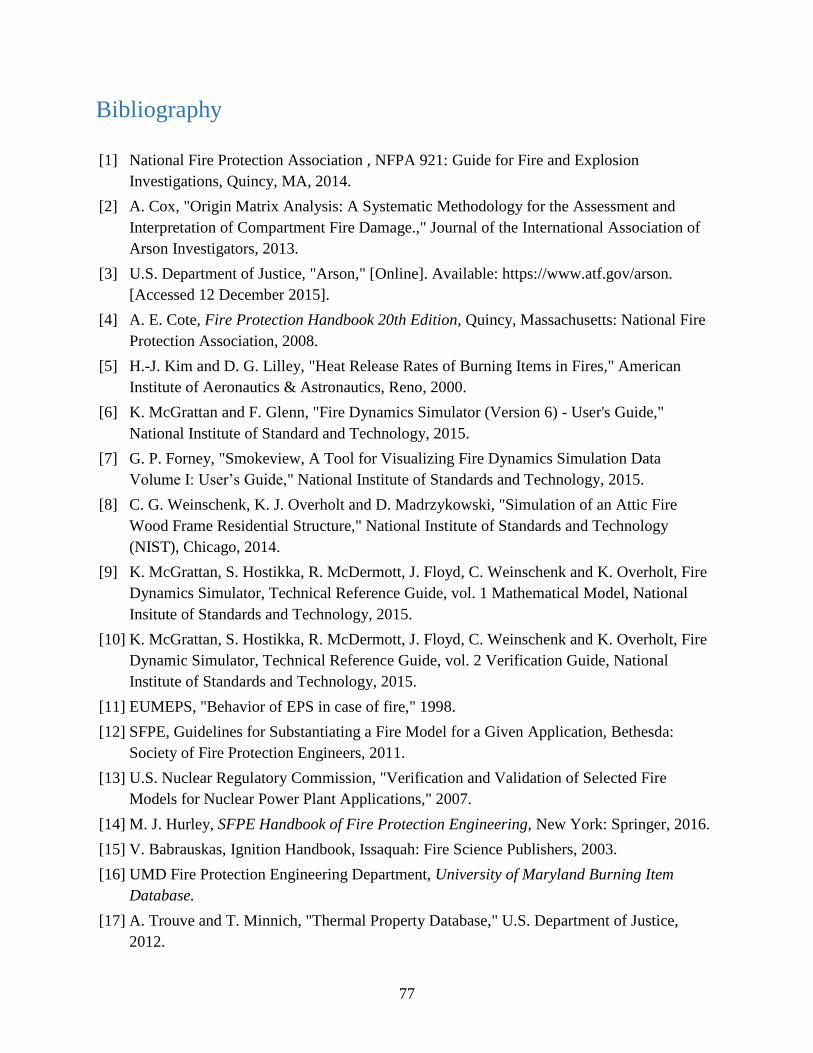
77
Bibliography
[1] National Fire Protection Association , NFPA 921: Guide for Fire and Explosion
Investigations, Quincy, MA, 2014.
[2] A. Cox, "Origin Matrix Analysis: A Systematic Methodology for the Assessment and
Interpretation of Compartment Fire Damage.," Journal of the International Association of
Arson Investigators, 2013.
[3] U.S. Department of Justice, "Arson," [Online]. Available: https://www.atf.gov/arson.
[Accessed 12 December 2015].
[4] A. E. Cote, Fire Protection Handbook 20th Edition, Quincy, Massachusetts: National Fire
Protection Association, 2008.
[5] H.-J. Kim and D. G. Lilley, "Heat Release Rates of Burning Items in Fires," American
Institute of Aeronautics & Astronautics, Reno, 2000.
[6] K. McGrattan and F. Glenn, "Fire Dynamics Simulator (Version 6) - User's Guide,"
National Institute of Standard and Technology, 2015.
[7] G. P. Forney, "Smokeview, A Tool for Visualizing Fire Dynamics Simulation Data
Volume I: User’s Guide," National Institute of Standards and Technology, 2015.
[8] C. G. Weinschenk, K. J. Overholt and D. Madrzykowski, "Simulation of an Attic Fire
Wood Frame Residential Structure," National Institute of Standards and Technology
(NIST), Chicago, 2014.
[9] K. McGrattan, S. Hostikka, R. McDermott, J. Floyd, C. Weinschenk and K. Overholt, Fire
Dynamics Simulator, Technical Reference Guide, vol. 1 Mathematical Model, National
Insitute of Standards and Technology, 2015.
[10] K. McGrattan, S. Hostikka, R. McDermott, J. Floyd, C. Weinschenk and K. Overholt, Fire
Dynamic Simulator, Technical Reference Guide, vol. 2 Verification Guide, National
Institute of Standards and Technology, 2015.
[11] EUMEPS, "Behavior of EPS in case of fire," 1998.
[12] SFPE, Guidelines for Substantiating a Fire Model for a Given Application, Bethesda:
Society of Fire Protection Engineers, 2011.
[13] U.S. Nuclear Regulatory Commission, "Verification and Validation of Selected Fire
Models for Nuclear Power Plant Applications," 2007.
[14] M. J. Hurley, SFPE Handbook of Fire Protection Engineering, New York: Springer, 2016.
[15] V. Babrauskas, Ignition Handbook, Issaquah: Fire Science Publishers, 2003.
[16] UMD Fire Protection Engineering Department, University of Maryland Burning Item
Database.
[17] A. Trouve and T. Minnich, "Thermal Property Database," U.S. Department of Justice,
2012.
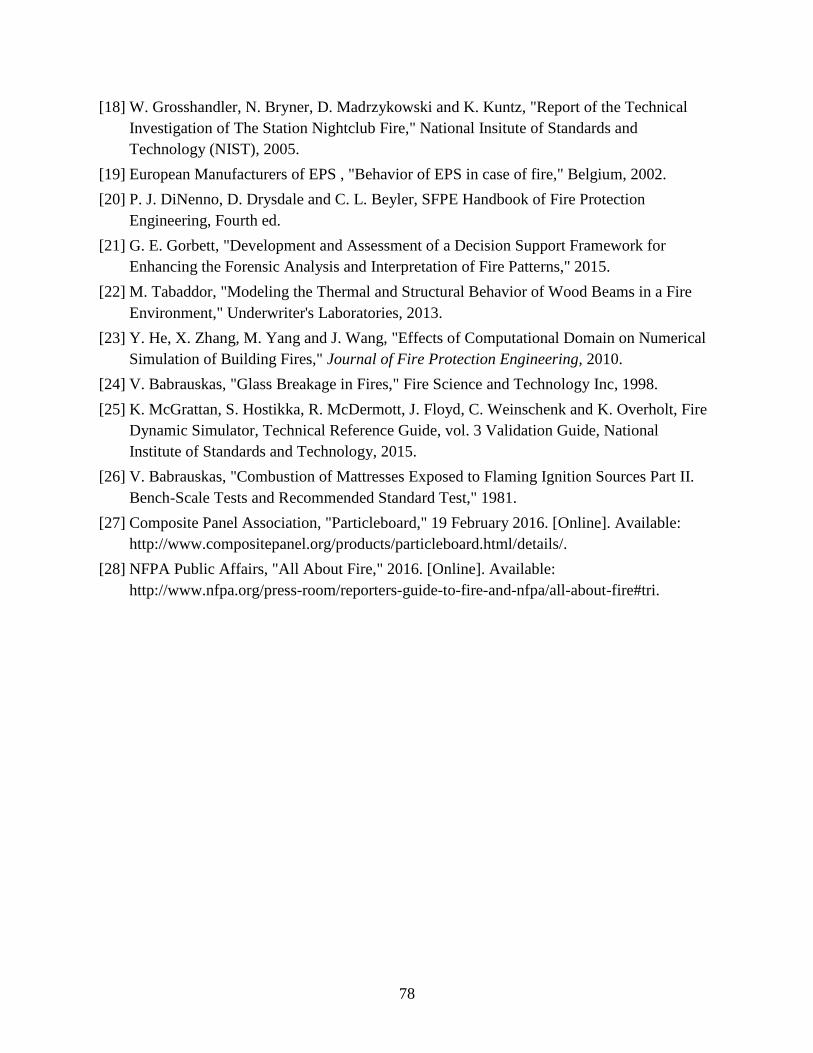
78
[18] W. Grosshandler, N. Bryner, D. Madrzykowski and K. Kuntz, "Report of the Technical
Investigation of The Station Nightclub Fire," National Insitute of Standards and
Technology (NIST), 2005.
[19] European Manufacturers of EPS , "Behavior of EPS in case of fire," Belgium, 2002.
[20] P. J. DiNenno, D. Drysdale and C. L. Beyler, SFPE Handbook of Fire Protection
Engineering, Fourth ed.
[21] G. E. Gorbett, "Development and Assessment of a Decision Support Framework for
Enhancing the Forensic Analysis and Interpretation of Fire Patterns," 2015.
[22] M. Tabaddor, "Modeling the Thermal and Structural Behavior of Wood Beams in a Fire
Environment," Underwriter's Laboratories, 2013.
[23] Y. He, X. Zhang, M. Yang and J. Wang, "Effects of Computational Domain on Numerical
Simulation of Building Fires," Journal of Fire Protection Engineering, 2010.
[24] V. Babrauskas, "Glass Breakage in Fires," Fire Science and Technology Inc, 1998.
[25] K. McGrattan, S. Hostikka, R. McDermott, J. Floyd, C. Weinschenk and K. Overholt, Fire
Dynamic Simulator, Technical Reference Guide, vol. 3 Validation Guide, National
Institute of Standards and Technology, 2015.
[26] V. Babrauskas, "Combustion of Mattresses Exposed to Flaming Ignition Sources Part II.
Bench-Scale Tests and Recommended Standard Test," 1981.
[27] Composite Panel Association, "Particleboard," 19 February 2016. [Online]. Available:
http://www.compositepanel.org/products/particleboard.html/details/.
[28] NFPA Public Affairs, "All About Fire," 2016. [Online]. Available:
http://www.nfpa.org/press-room/reporters-guide-to-fire-and-nfpa/all-about-fire#tri.
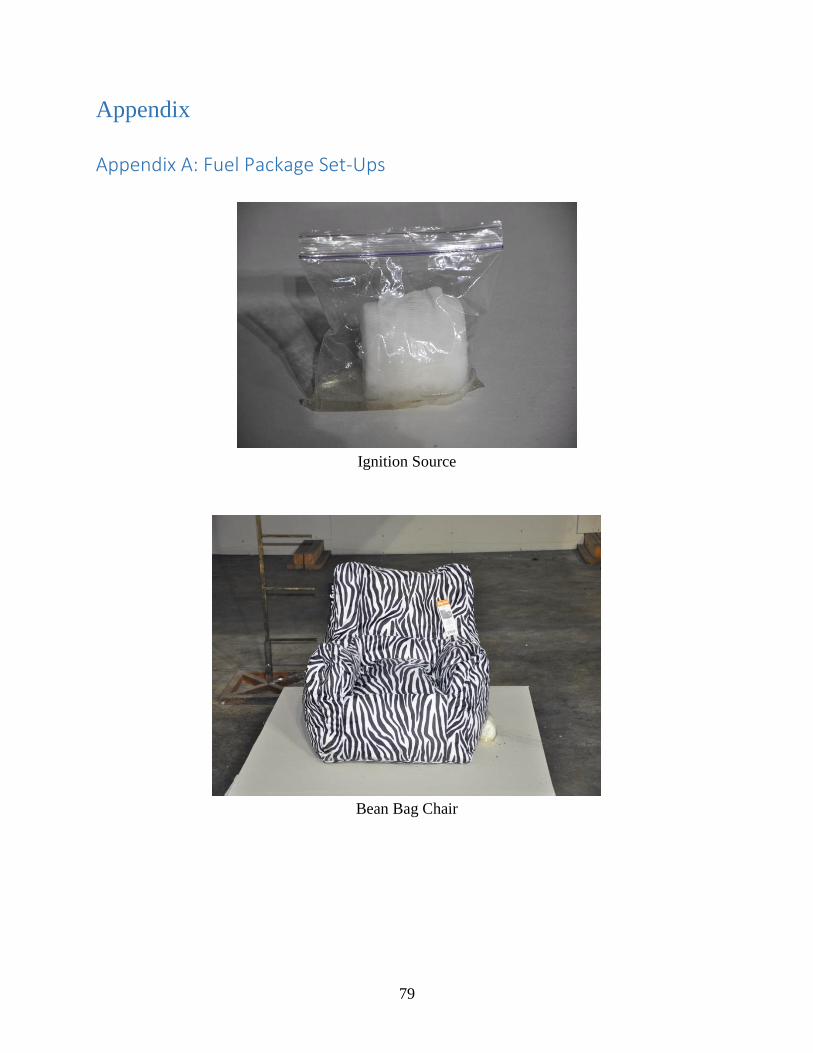
79
Appendix
Appendix A: Fuel Package Set-Ups
Ignition Source
Bean Bag Chair
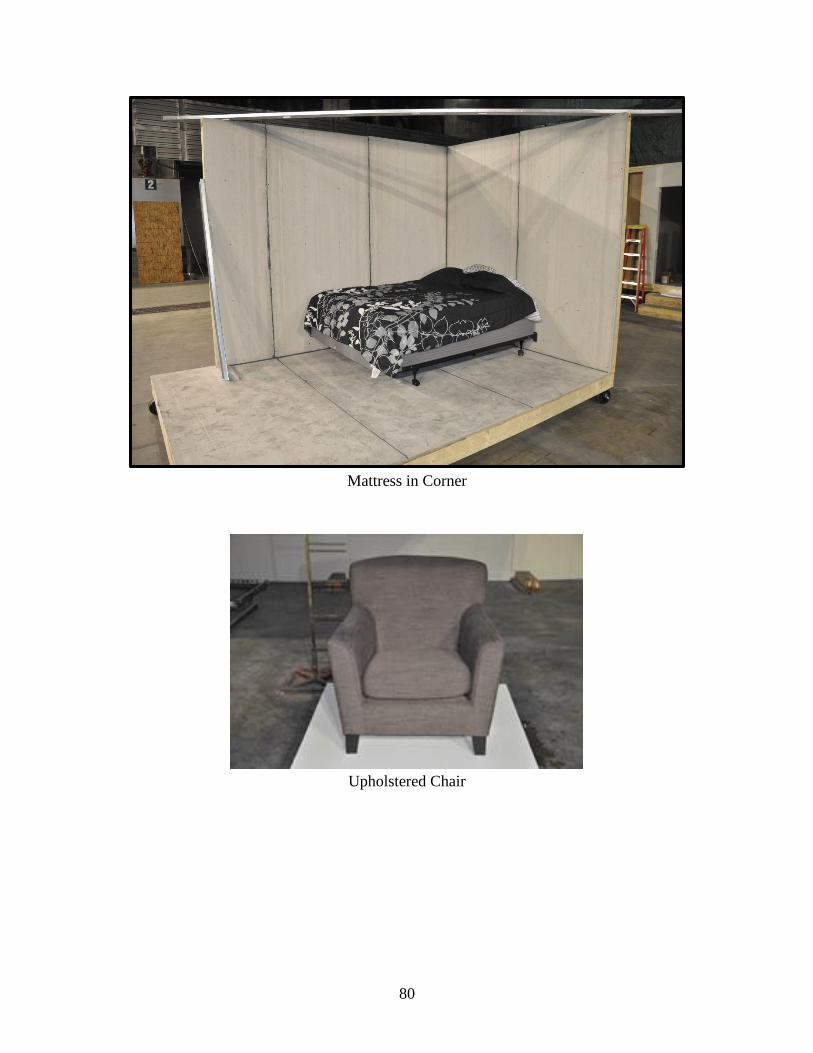
80
Mattress in Corner
Upholstered Chair
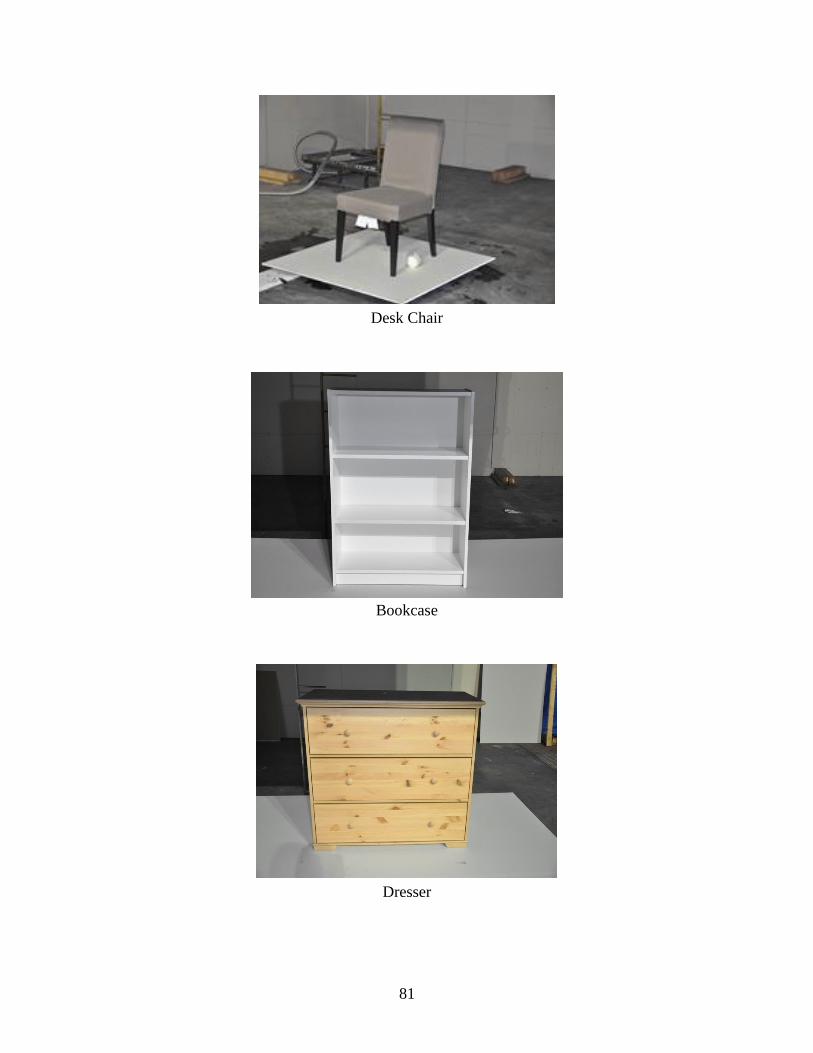
81
Desk Chair
Bookcase
Dresser
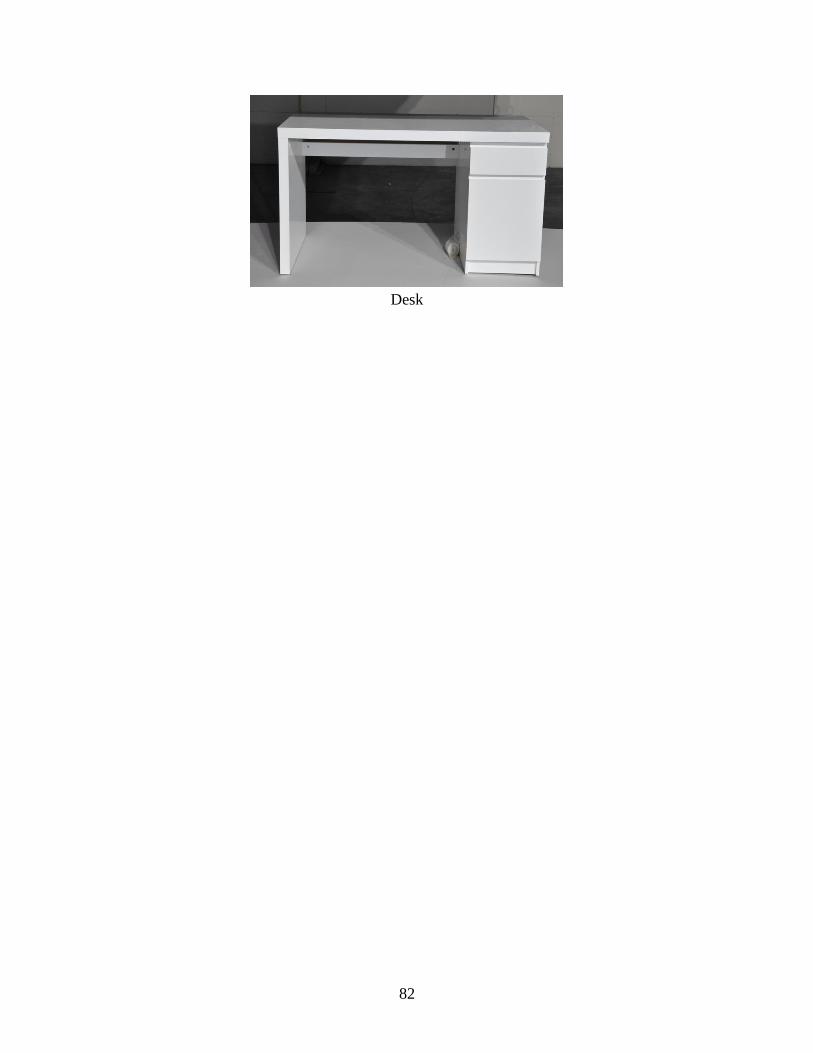
82
Desk
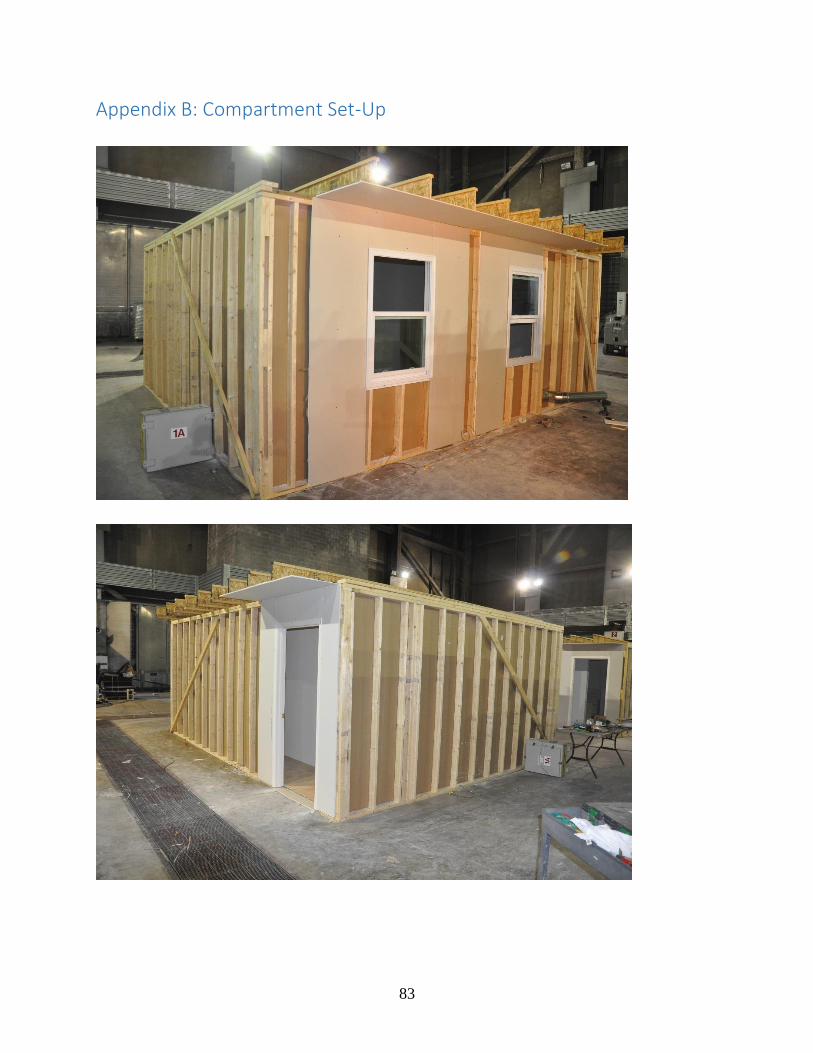
83
Appendix B: Compartment Set-Up
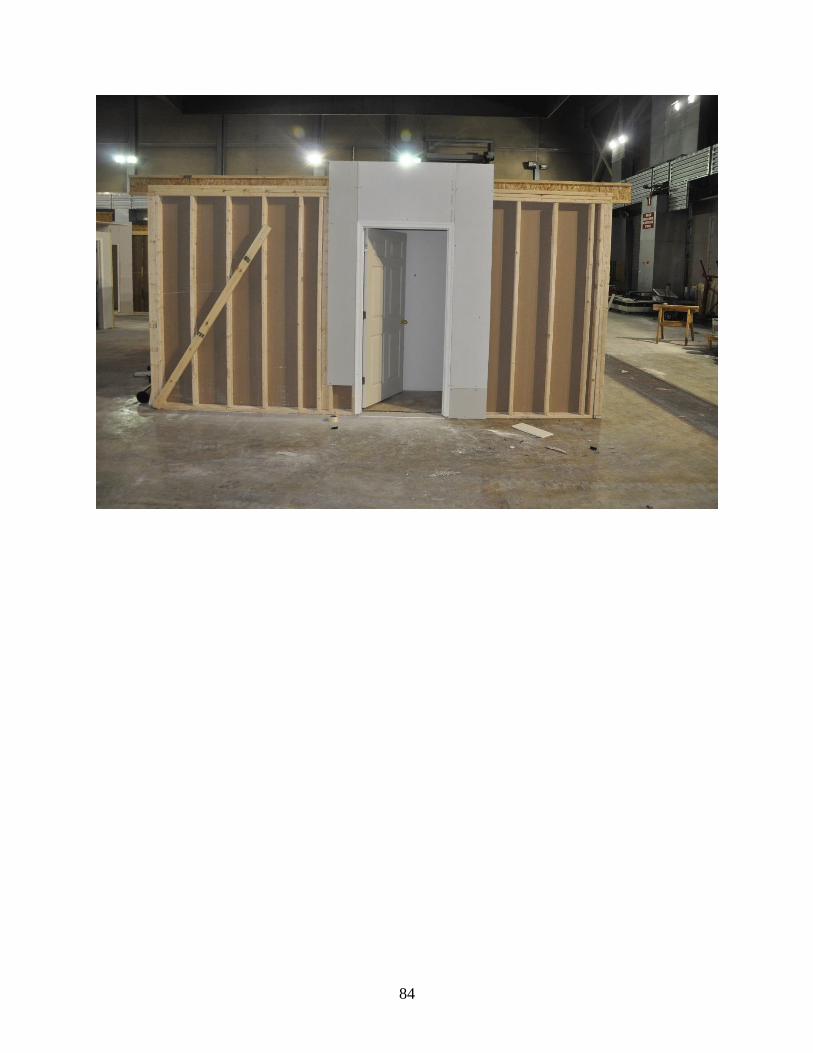
84
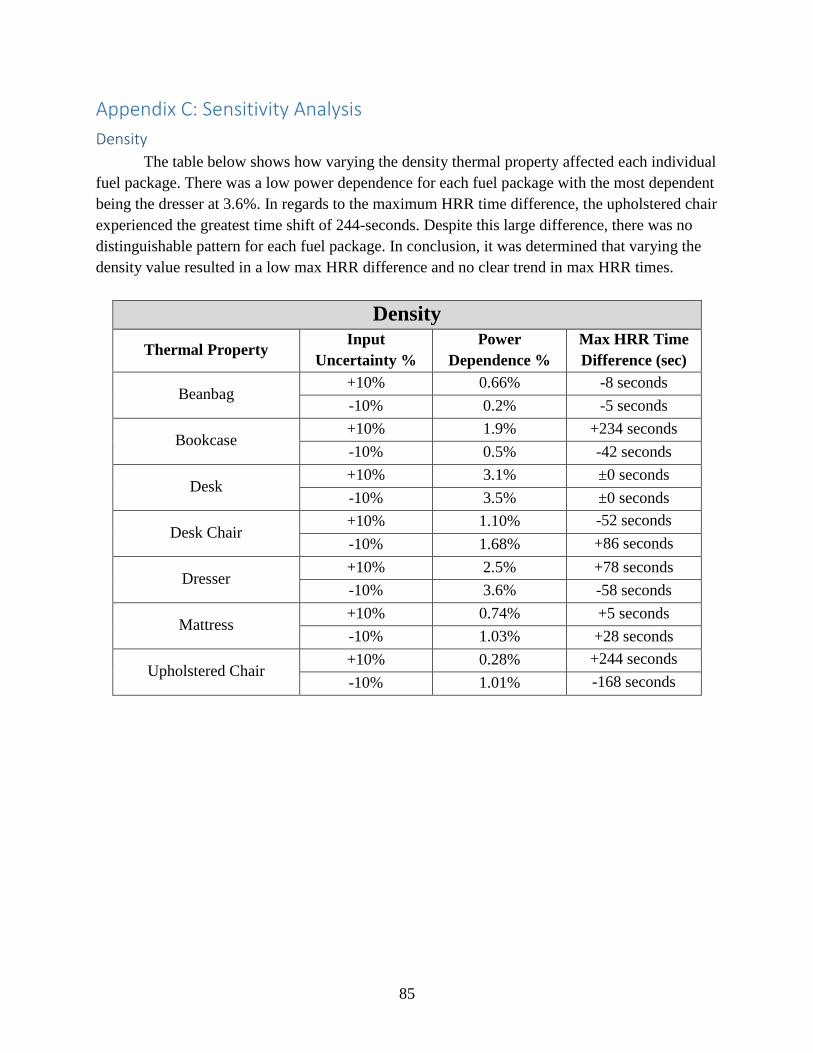
85
Appendix C: Sensitivity Analysis
Density
The table below shows how varying the density thermal property affected each individual
fuel package. There was a low power dependence for each fuel package with the most dependent
being the dresser at 3.6%. In regards to the maximum HRR time difference, the upholstered chair
experienced the greatest time shift of 244-seconds. Despite this large difference, there was no
distinguishable pattern for each fuel package. In conclusion, it was determined that varying the
density value resulted in a low max HRR difference and no clear trend in max HRR times.
Density
Thermal Property Input
Uncertainty %
Power
Dependence %
Max HRR Time
Difference (sec)
Beanbag +10% 0.66% -8 seconds
-10% 0.2% -5 seconds
Bookcase +10% 1.9% +234 seconds
-10% 0.5% -42 seconds
Desk +10% 3.1% ±0 seconds
-10% 3.5% ±0 seconds
Desk Chair +10% 1.10% -52 seconds
-10% 1.68% +86 seconds
Dresser +10% 2.5% +78 seconds
-10% 3.6% -58 seconds
Mattress +10% 0.74% +5 seconds
-10% 1.03% +28 seconds
Upholstered Chair +10% 0.28% +244 seconds
-10% 1.01% -168 seconds
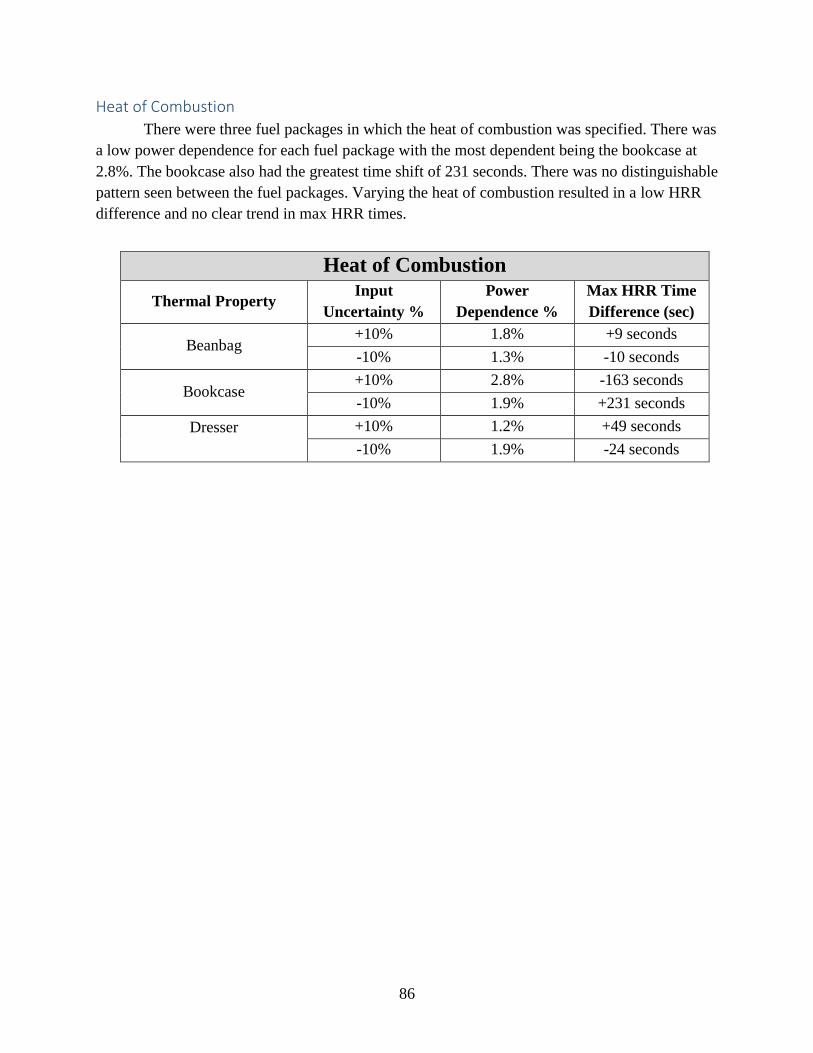
86
Heat of Combustion
There were three fuel packages in which the heat of combustion was specified. There was
a low power dependence for each fuel package with the most dependent being the bookcase at
2.8%. The bookcase also had the greatest time shift of 231 seconds. There was no distinguishable
pattern seen between the fuel packages. Varying the heat of combustion resulted in a low HRR
difference and no clear trend in max HRR times.
Heat of Combustion
Thermal Property Input
Uncertainty %
Power
Dependence %
Max HRR Time
Difference (sec)
Beanbag +10% 1.8% +9 seconds
-10% 1.3% -10 seconds
Bookcase +10% 2.8% -163 seconds
-10% 1.9% +231 seconds
Dresser
+10% 1.2% +49 seconds
-10% 1.9% -24 seconds
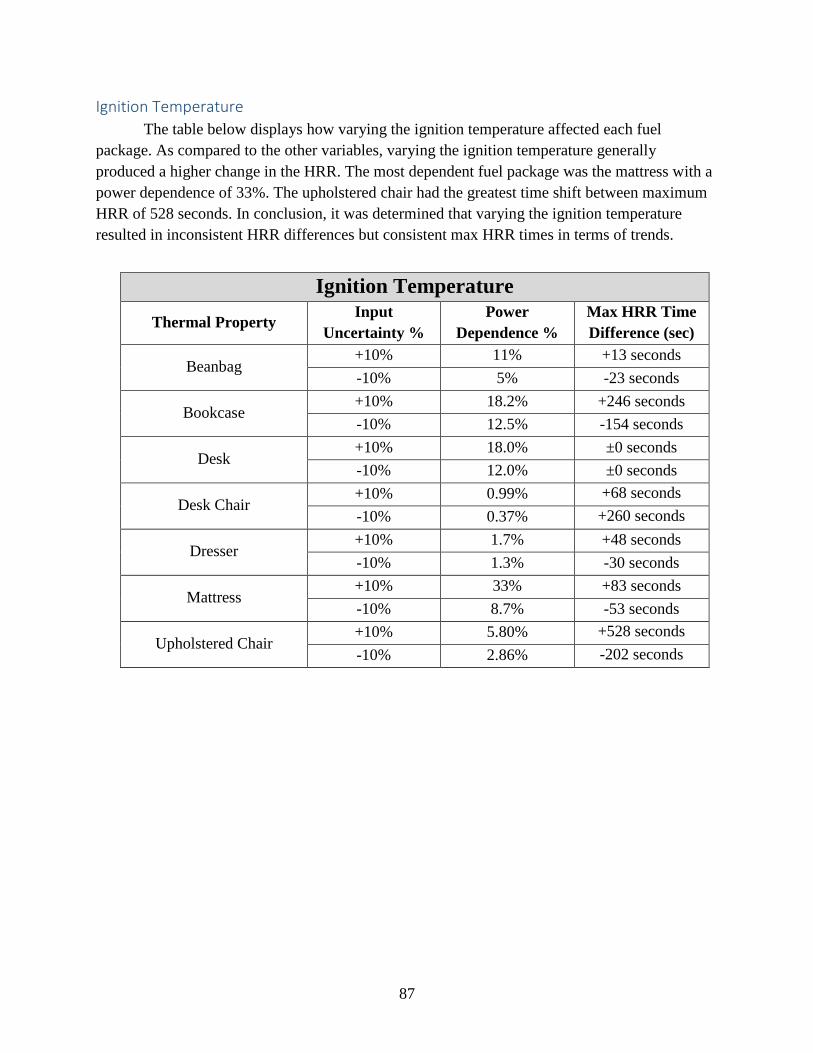
87
Ignition Temperature
The table below displays how varying the ignition temperature affected each fuel
package. As compared to the other variables, varying the ignition temperature generally
produced a higher change in the HRR. The most dependent fuel package was the mattress with a
power dependence of 33%. The upholstered chair had the greatest time shift between maximum
HRR of 528 seconds. In conclusion, it was determined that varying the ignition temperature
resulted in inconsistent HRR differences but consistent max HRR times in terms of trends.
Ignition Temperature
Thermal Property Input
Uncertainty %
Power
Dependence %
Max HRR Time
Difference (sec)
Beanbag +10% 11% +13 seconds
-10% 5% -23 seconds
Bookcase +10% 18.2% +246 seconds
-10% 12.5% -154 seconds
Desk +10% 18.0% ±0 seconds
-10% 12.0% ±0 seconds
Desk Chair +10% 0.99% +68 seconds
-10% 0.37% +260 seconds
Dresser +10% 1.7% +48 seconds
-10% 1.3% -30 seconds
Mattress +10% 33% +83 seconds
-10% 8.7% -53 seconds
Upholstered Chair +10% 5.80% +528 seconds
-10% 2.86% -202 seconds
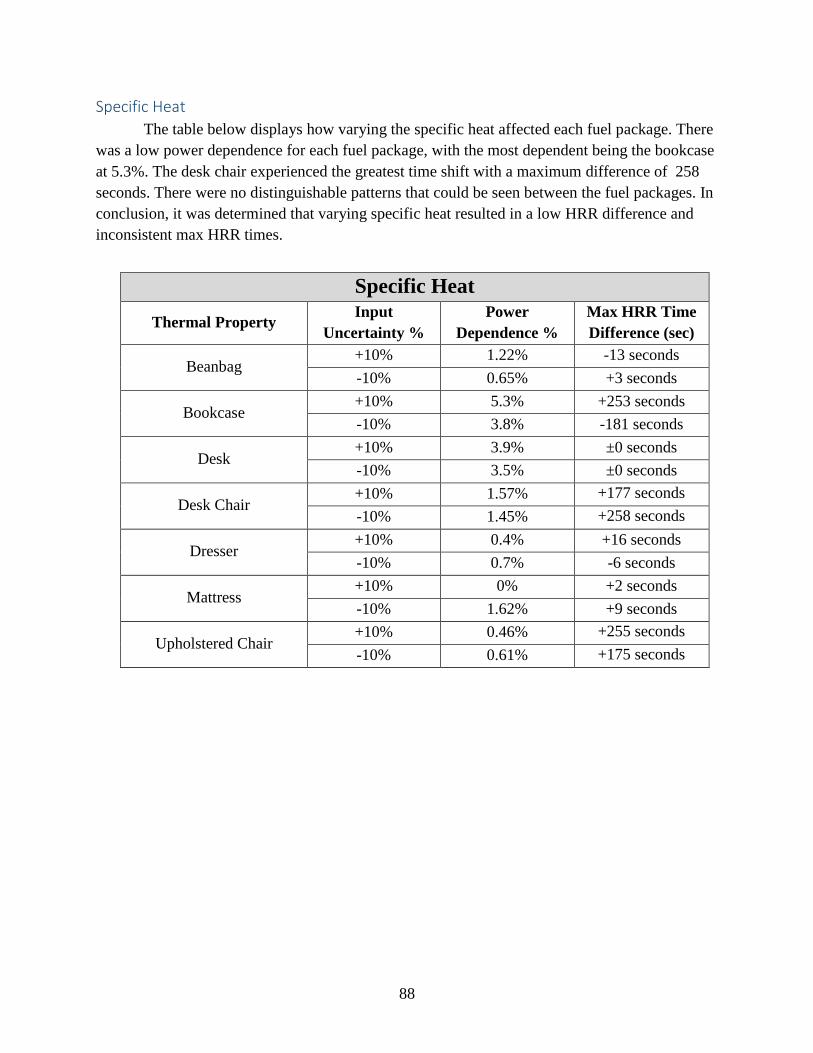
88
Specific Heat
The table below displays how varying the specific heat affected each fuel package. There
was a low power dependence for each fuel package, with the most dependent being the bookcase
at 5.3%. The desk chair experienced the greatest time shift with a maximum difference of 258
seconds. There were no distinguishable patterns that could be seen between the fuel packages. In
conclusion, it was determined that varying specific heat resulted in a low HRR difference and
inconsistent max HRR times.
Specific Heat
Thermal Property Input
Uncertainty %
Power
Dependence %
Max HRR Time
Difference (sec)
Beanbag +10% 1.22% -13 seconds
-10% 0.65% +3 seconds
Bookcase +10% 5.3% +253 seconds
-10% 3.8% -181 seconds
Desk +10% 3.9% ±0 seconds
-10% 3.5% ±0 seconds
Desk Chair +10% 1.57% +177 seconds
-10% 1.45% +258 seconds
Dresser +10% 0.4% +16 seconds
-10% 0.7% -6 seconds
Mattress +10% 0% +2 seconds
-10% 1.62% +9 seconds
Upholstered Chair +10% 0.46% +255 seconds
-10% 0.61% +175 seconds
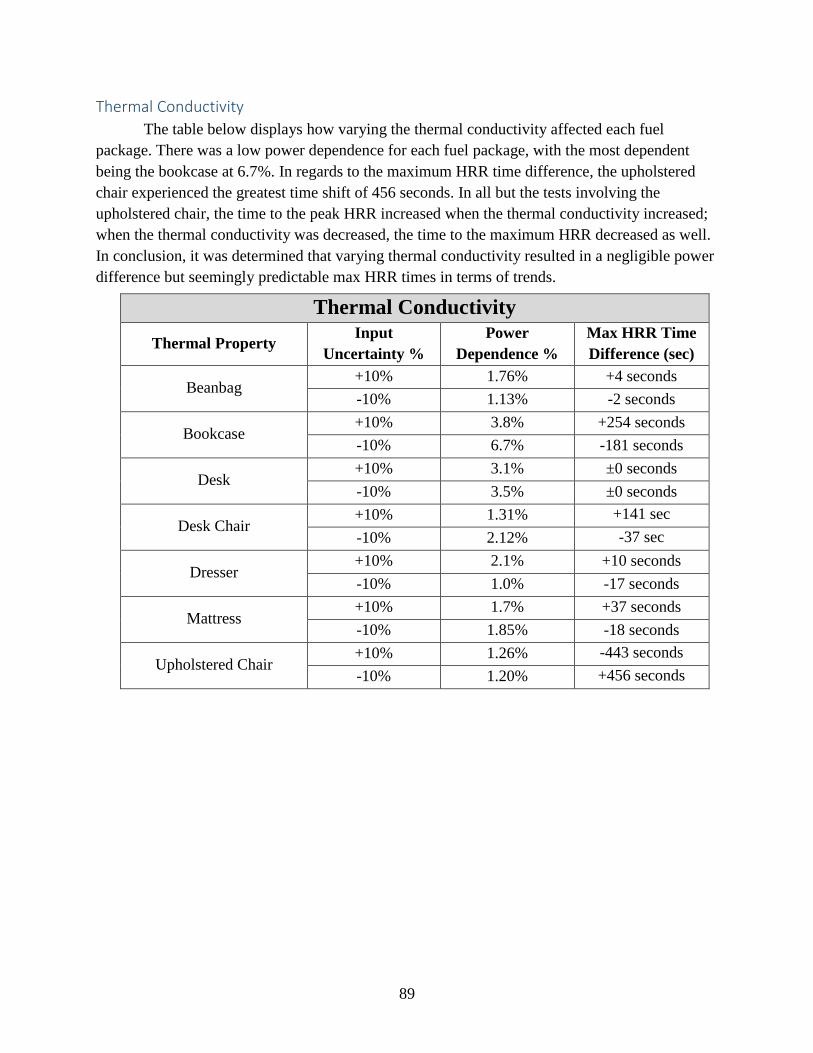
89
Thermal Conductivity
The table below displays how varying the thermal conductivity affected each fuel
package. There was a low power dependence for each fuel package, with the most dependent
being the bookcase at 6.7%. In regards to the maximum HRR time difference, the upholstered
chair experienced the greatest time shift of 456 seconds. In all but the tests involving the
upholstered chair, the time to the peak HRR increased when the thermal conductivity increased;
when the thermal conductivity was decreased, the time to the maximum HRR decreased as well.
In conclusion, it was determined that varying thermal conductivity resulted in a negligible power
difference but seemingly predictable max HRR times in terms of trends.
Thermal Conductivity
Thermal Property Input
Uncertainty %
Power
Dependence %
Max HRR Time
Difference (sec)
Beanbag +10% 1.76% +4 seconds
-10% 1.13% -2 seconds
Bookcase +10% 3.8% +254 seconds
-10% 6.7% -181 seconds
Desk +10% 3.1% ±0 seconds
-10% 3.5% ±0 seconds
Desk Chair +10% 1.31% +141 sec
-10% 2.12% -37 sec
Dresser +10% 2.1% +10 seconds
-10% 1.0% -17 seconds
Mattress +10% 1.7% +37 seconds
-10% 1.85% -18 seconds
Upholstered Chair +10% 1.26% -443 seconds
-10% 1.20% +456 seconds
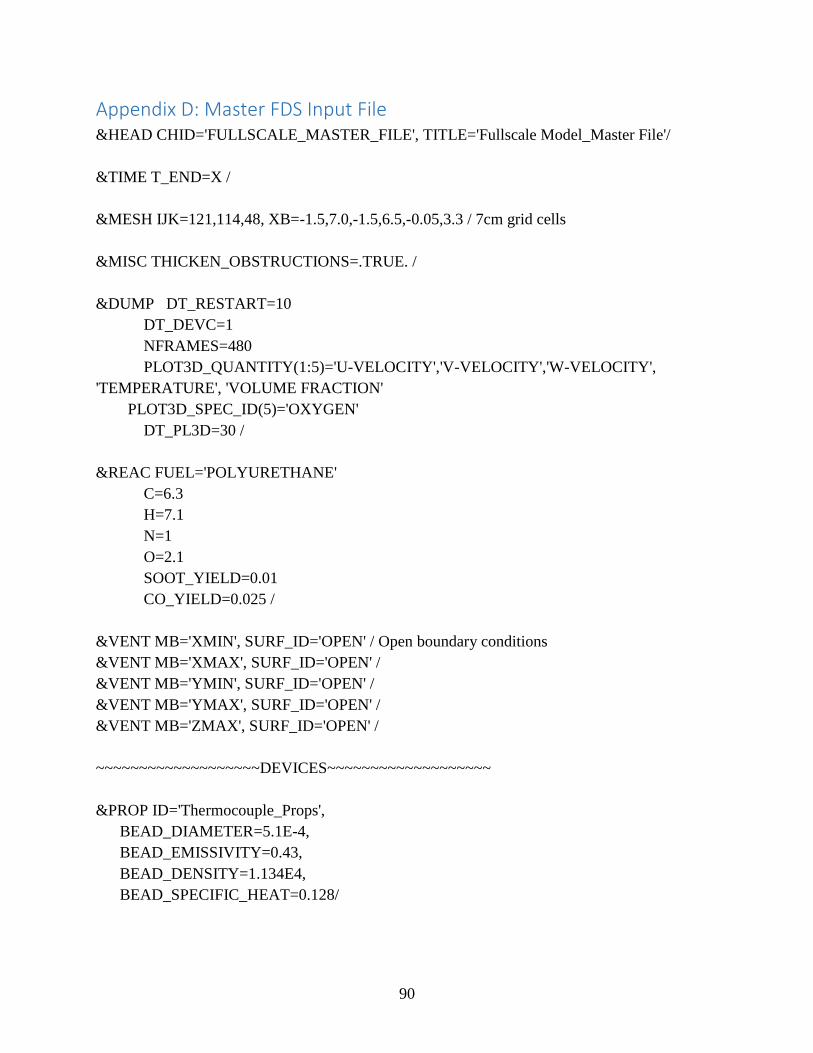
90
Appendix D: Master FDS Input File &HEAD CHID='FULLSCALE_MASTER_FILE', TITLE='Fullscale Model_Master File'/
&TIME T_END=X /
&MESH IJK=121,114,48, XB=-1.5,7.0,-1.5,6.5,-0.05,3.3 / 7cm grid cells
&MISC THICKEN_OBSTRUCTIONS=.TRUE. /
&DUMP DT_RESTART=10
DT_DEVC=1
NFRAMES=480
PLOT3D_QUANTITY(1:5)='U-VELOCITY','V-VELOCITY','W-VELOCITY',
'TEMPERATURE', 'VOLUME FRACTION'
PLOT3D_SPEC_ID(5)='OXYGEN'
DT_PL3D=30 /
&REAC FUEL='POLYURETHANE'
C=6.3
H=7.1
N=1
O=2.1
SOOT_YIELD=0.01
CO_YIELD=0.025 /
&VENT MB='XMIN', SURF_ID='OPEN' / Open boundary conditions
&VENT MB='XMAX', SURF_ID='OPEN' /
&VENT MB='YMIN', SURF_ID='OPEN' /
&VENT MB='YMAX', SURF_ID='OPEN' /
&VENT MB='ZMAX', SURF_ID='OPEN' /
~~~~~~~~~~~~~~~~~~~DEVICES~~~~~~~~~~~~~~~~~~~
&PROP ID='Thermocouple_Props',
BEAD_DIAMETER=5.1E-4,
BEAD_EMISSIVITY=0.43,
BEAD_DENSITY=1.134E4,
BEAD_SPECIFIC_HEAT=0.128/
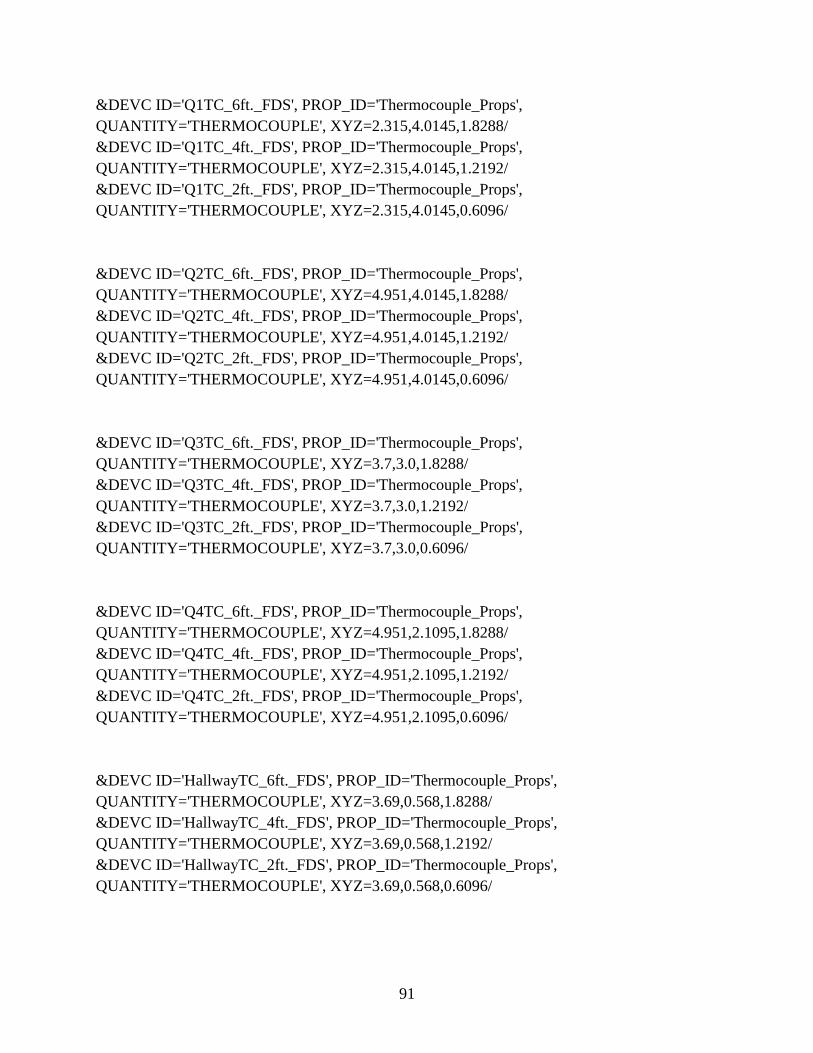
91
&DEVC ID='Q1TC_6ft._FDS', PROP_ID='Thermocouple_Props',
QUANTITY='THERMOCOUPLE', XYZ=2.315,4.0145,1.8288/
&DEVC ID='Q1TC_4ft._FDS', PROP_ID='Thermocouple_Props',
QUANTITY='THERMOCOUPLE', XYZ=2.315,4.0145,1.2192/
&DEVC ID='Q1TC_2ft._FDS', PROP_ID='Thermocouple_Props',
QUANTITY='THERMOCOUPLE', XYZ=2.315,4.0145,0.6096/
&DEVC ID='Q2TC_6ft._FDS', PROP_ID='Thermocouple_Props',
QUANTITY='THERMOCOUPLE', XYZ=4.951,4.0145,1.8288/
&DEVC ID='Q2TC_4ft._FDS', PROP_ID='Thermocouple_Props',
QUANTITY='THERMOCOUPLE', XYZ=4.951,4.0145,1.2192/
&DEVC ID='Q2TC_2ft._FDS', PROP_ID='Thermocouple_Props',
QUANTITY='THERMOCOUPLE', XYZ=4.951,4.0145,0.6096/
&DEVC ID='Q3TC_6ft._FDS', PROP_ID='Thermocouple_Props',
QUANTITY='THERMOCOUPLE', XYZ=3.7,3.0,1.8288/
&DEVC ID='Q3TC_4ft._FDS', PROP_ID='Thermocouple_Props',
QUANTITY='THERMOCOUPLE', XYZ=3.7,3.0,1.2192/
&DEVC ID='Q3TC_2ft._FDS', PROP_ID='Thermocouple_Props',
QUANTITY='THERMOCOUPLE', XYZ=3.7,3.0,0.6096/
&DEVC ID='Q4TC_6ft._FDS', PROP_ID='Thermocouple_Props',
QUANTITY='THERMOCOUPLE', XYZ=4.951,2.1095,1.8288/
&DEVC ID='Q4TC_4ft._FDS', PROP_ID='Thermocouple_Props',
QUANTITY='THERMOCOUPLE', XYZ=4.951,2.1095,1.2192/
&DEVC ID='Q4TC_2ft._FDS', PROP_ID='Thermocouple_Props',
QUANTITY='THERMOCOUPLE', XYZ=4.951,2.1095,0.6096/
&DEVC ID='HallwayTC_6ft._FDS', PROP_ID='Thermocouple_Props',
QUANTITY='THERMOCOUPLE', XYZ=3.69,0.568,1.8288/
&DEVC ID='HallwayTC_4ft._FDS', PROP_ID='Thermocouple_Props',
QUANTITY='THERMOCOUPLE', XYZ=3.69,0.568,1.2192/
&DEVC ID='HallwayTC_2ft._FDS', PROP_ID='Thermocouple_Props',
QUANTITY='THERMOCOUPLE', XYZ=3.69,0.568,0.6096/
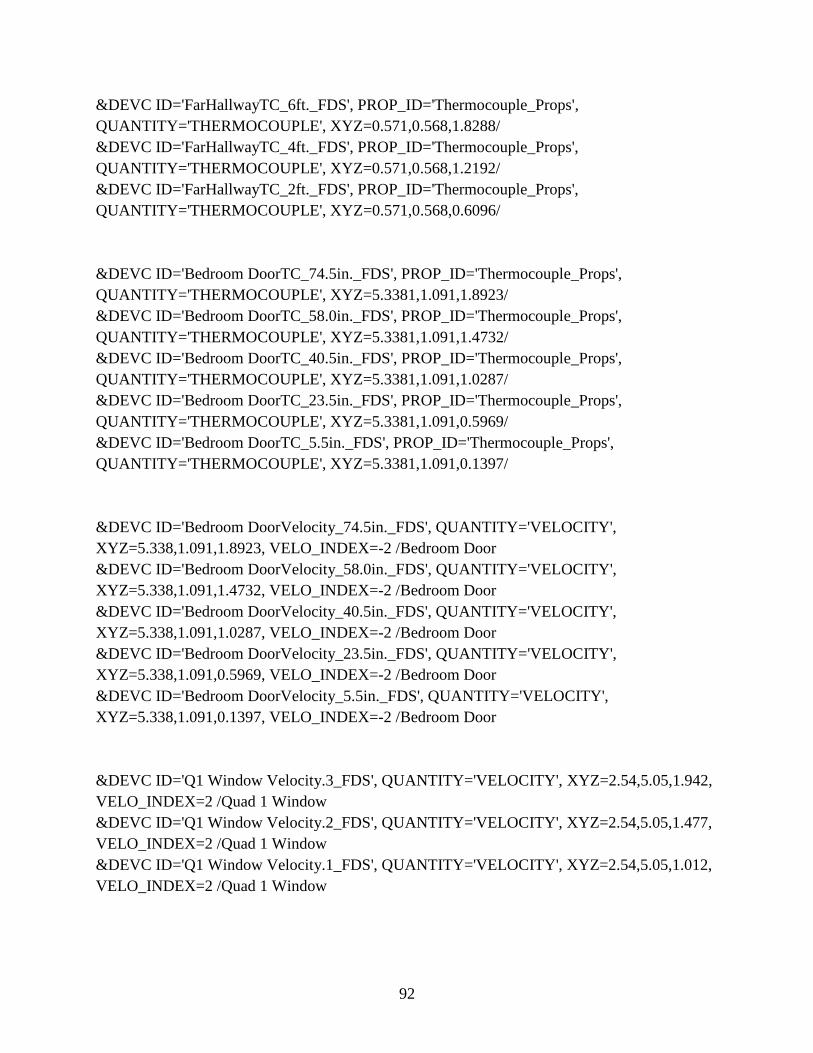
92
&DEVC ID='FarHallwayTC_6ft._FDS', PROP_ID='Thermocouple_Props',
QUANTITY='THERMOCOUPLE', XYZ=0.571,0.568,1.8288/
&DEVC ID='FarHallwayTC_4ft._FDS', PROP_ID='Thermocouple_Props',
QUANTITY='THERMOCOUPLE', XYZ=0.571,0.568,1.2192/
&DEVC ID='FarHallwayTC_2ft._FDS', PROP_ID='Thermocouple_Props',
QUANTITY='THERMOCOUPLE', XYZ=0.571,0.568,0.6096/
&DEVC ID='Bedroom DoorTC_74.5in._FDS', PROP_ID='Thermocouple_Props',
QUANTITY='THERMOCOUPLE', XYZ=5.3381,1.091,1.8923/
&DEVC ID='Bedroom DoorTC_58.0in._FDS', PROP_ID='Thermocouple_Props',
QUANTITY='THERMOCOUPLE', XYZ=5.3381,1.091,1.4732/
&DEVC ID='Bedroom DoorTC_40.5in._FDS', PROP_ID='Thermocouple_Props',
QUANTITY='THERMOCOUPLE', XYZ=5.3381,1.091,1.0287/
&DEVC ID='Bedroom DoorTC_23.5in._FDS', PROP_ID='Thermocouple_Props',
QUANTITY='THERMOCOUPLE', XYZ=5.3381,1.091,0.5969/
&DEVC ID='Bedroom DoorTC_5.5in._FDS', PROP_ID='Thermocouple_Props',
QUANTITY='THERMOCOUPLE', XYZ=5.3381,1.091,0.1397/
&DEVC ID='Bedroom DoorVelocity_74.5in._FDS', QUANTITY='VELOCITY',
XYZ=5.338,1.091,1.8923, VELO_INDEX=-2 /Bedroom Door
&DEVC ID='Bedroom DoorVelocity_58.0in._FDS', QUANTITY='VELOCITY',
XYZ=5.338,1.091,1.4732, VELO_INDEX=-2 /Bedroom Door
&DEVC ID='Bedroom DoorVelocity_40.5in._FDS', QUANTITY='VELOCITY',
XYZ=5.338,1.091,1.0287, VELO_INDEX=-2 /Bedroom Door
&DEVC ID='Bedroom DoorVelocity_23.5in._FDS', QUANTITY='VELOCITY',
XYZ=5.338,1.091,0.5969, VELO_INDEX=-2 /Bedroom Door
&DEVC ID='Bedroom DoorVelocity_5.5in._FDS', QUANTITY='VELOCITY',
XYZ=5.338,1.091,0.1397, VELO_INDEX=-2 /Bedroom Door
&DEVC ID='Q1 Window Velocity.3_FDS', QUANTITY='VELOCITY', XYZ=2.54,5.05,1.942,
VELO_INDEX=2 /Quad 1 Window
&DEVC ID='Q1 Window Velocity.2_FDS', QUANTITY='VELOCITY', XYZ=2.54,5.05,1.477,
VELO_INDEX=2 /Quad 1 Window
&DEVC ID='Q1 Window Velocity.1_FDS', QUANTITY='VELOCITY', XYZ=2.54,5.05,1.012,
VELO_INDEX=2 /Quad 1 Window

93
&DEVC ID='Q2 Window Velocity.3_FDS', QUANTITY='VELOCITY',
XYZ=4.8415,5.05,1.942, VELO_INDEX=2 /Quad 2 Window
&DEVC ID='Q2 Window Velocity.2_FDS', QUANTITY='VELOCITY',
XYZ=4.8415,5.05,1.477, VELO_INDEX=2 /Quad 2 Window
&DEVC ID='Q2 Window Velocity.1_FDS', QUANTITY='VELOCITY',
XYZ=4.8415,5.05,1.012, VELO_INDEX=2 /Quad 2 Window
&DEVC ID='HVACTC_FDS', PROP_ID='Thermocouple_Props',
QUANTITY='THERMOCOUPLE', XYZ=1.715,5.05,0.3032/HVAC UNIT
&DEVC ID='HVACVelocity_FDS', QUANTITY='VELOCITY', XYZ=1.715,5.05,0.3032,
VELO_INDEX=2 /HVAC UNIT
&DEVC ID='Quad 1_corner.1_FDS', PROP_ID='Thermocouple_Props',
QUANTITY='THERMOCOUPLE', XYZ=1.4905,4.7762,0.6096/Quad 1 Corner
&DEVC ID='Quad 1_corner.2_FDS', PROP_ID='Thermocouple_Props',
QUANTITY='THERMOCOUPLE', XYZ=1.4905,4.7762,1.2192/Quad 1 Corner
&DEVC ID='Quad 1_corner.3_FDS', PROP_ID='Thermocouple_Props',
QUANTITY='THERMOCOUPLE', XYZ=1.4905,4.7762,1.8288/Quad 1 Corner
&DEVC ID='Quad 1_corner.4_FDS', PROP_ID='Thermocouple_Props',
QUANTITY='THERMOCOUPLE', XYZ=1.4905,4.7762,2.4384/Quad 1 Corner
&DEVC ID='Quad 2_corner.1_FDS', PROP_ID='Thermocouple_Props',
QUANTITY='THERMOCOUPLE', XYZ=5.9092,4.7762,0.6096/Quad 2 Corner
&DEVC ID='Quad 2_corner.2_FDS', PROP_ID='Thermocouple_Props',
QUANTITY='THERMOCOUPLE', XYZ=5.9092,4.7762,1.2192/Quad 2 Corner
&DEVC ID='Quad 2_corner.3_FDS', PROP_ID='Thermocouple_Props',
QUANTITY='THERMOCOUPLE', XYZ=5.9092,4.7762,1.8288/Quad 2 Corner
&DEVC ID='Quad 2_corner.4_FDS', PROP_ID='Thermocouple_Props',
QUANTITY='THERMOCOUPLE', XYZ=5.9092,4.7762,2.4384/Quad 2 Corner
&DEVC ID='Quad 3_corner.1_FDS', PROP_ID='Thermocouple_Props',
QUANTITY='THERMOCOUPLE', XYZ=1.4905,1.4618,0.6096/Quad 3 Corner
&DEVC ID='Quad 3_corner.2_FDS', PROP_ID='Thermocouple_Props',
QUANTITY='THERMOCOUPLE', XYZ=1.4905,1.4618,1.2192/Quad 3 Corner
&DEVC ID='Quad 3_corner.3_FDS', PROP_ID='Thermocouple_Props',
QUANTITY='THERMOCOUPLE', XYZ=1.4905,1.4618,1.8288/Quad 3 Corner
94
&DEVC ID='Quad 3_corner.4_FDS', PROP_ID='Thermocouple_Props',
QUANTITY='THERMOCOUPLE', XYZ=1.4905,1.4618,2.4384/Quad 3 Corner
&DEVC ID='HEAT FLUX GAUGE Q1', QUANTITY='GAUGE HEAT FLUX', XYZ=1.2,
4.15, 1.5, IOR=1 /
&DEVC ID='HEAT FLUX GAUGE Q2', QUANTITY='GAUGE HEAT FLUX', XYZ=6.2, 4.1,
1.5, IOR=-1 /
&DEVC ID='HEAT FLUX GAUGE Q3', QUANTITY='GAUGE HEAT FLUX', XYZ=1.2, 2.3,
1.5, IOR=1 /
&DEVC ID='HEAT FLUX GAUGE Q4', QUANTITY='GAUGE HEAT FLUX', XYZ=6.2, 2.4,
1.5, IOR=-1 /
&DEVC ID='HEAT FLUX GAUGE H', QUANTITY='GAUGE HEAT FLUX', XYZ=4.1, 0.15,
1.5, IOR=2 /
&OBST XB=1.058, 1.138, 4.087, 4.167, 1.48, 1.52, COLOR='INVISIBLE' / Used For Heat Flux
Guage Q1
~~~~~~~~~~~~~~~~~~~WALLS & FLOOR~~~~~~~~~~~~~~~~~~~
&MATL ID='GYPSUM',
FYI='NBSIR 88-3752 - ATF NIST Multi-Floor Validation',
SPECIFIC_HEAT=1.09,
CONDUCTIVITY=0.17,
DENSITY=930.0/
&MATL ID='YELLOW PINE',
FYI='Quintiere, Fire Behavior - NIST NRC Validation',
SPECIFIC_HEAT=2.85,
CONDUCTIVITY=0.14,
DENSITY=640.0/
&SURF ID='Exterior Wall',
COLOR='SILVER',
BACKING='VOID',
MATL_ID(1,1)='GYPSUM',
MATL_ID(2,1)='YELLOW PINE',
MATL_ID(3,1)='GYPSUM',
MATL_MASS_FRACTION(1,1)=1.0,
MATL_MASS_FRACTION(2,1)=1.0,
95
MATL_MASS_FRACTION(3,1)=1.0,
THICKNESS(1:3)=0.0127,0.0880,0.0127/
&SURF ID='Interior Wall',
COLOR='SILVER',
BACKING='VOID',
MATL_ID(1,1)='GYPSUM',
MATL_ID(2,1)='YELLOW PINE',
MATL_ID(3,1)='GYPSUM',
MATL_MASS_FRACTION(1,1)=1.0,
MATL_MASS_FRACTION(2,1)=1.0,
MATL_MASS_FRACTION(3,1)=1.0,
THICKNESS(1:3)=0.0127,0.1146,0.0127/
&MATL ID='CARPET NYLON',
SPECIFIC_HEAT =0.87,
CONDUCTIVITY =0.33,
DENSITY =1169.0/
&SURF ID ='CARPET'
COLOR ='GOLDENROD'
MATL_ID ='CARPET NYLON'
THICKNESS =0.02
HRRPUA =86.667
IGNITION_TEMPERATURE =405.0/
&OBST XB=0.0,0.1143,0.1143,5.08,-0.05,2.44, SURF_ID='Exterior Wall', / Left Wall
&OBST XB=0.0,6.3283,0.0,0.1143,-0.05,2.44, SURF_ID='Exterior Wall', / Front Wall
&OBST XB=6.214,6.3283,0.1143,5.081,-0.05,2.44, COLOR='INVISIBLE', SURF_ID='Exterior
Wall', / Right Wall
&OBST XB=0.0,2.116,5.081,5.1953,-0.05,2.44, SURF_ID='Exterior Wall'/ Back Wall
&OBST XB=2.967,4.417,5.081,5.1953,-0.05,2.44, SURF_ID='Exterior Wall'/ Back Wall
&OBST XB=5.268,6.3283,5.081,5.1953,-0.05,2.44, SURF_ID='Exterior Wall'/ Back Wall
&OBST XB=2.116,2.967,5.081,5.1953,-0.05,0.857, SURF_ID='Exterior Wall' / Back Wall
&OBST XB=2.116,2.967,5.081,5.1953,2.097,2.44, SURF_ID='Exterior Wall' / Back Wall
&OBST XB=4.417,5.268,5.081,5.1953,-0.05,0.857, SURF_ID='Exterior Wall'/ Back Wall
&OBST XB=4.417,5.268,5.081,5.1953,2.097,2.44, SURF_ID='Exterior Wall' / Back Wall
&OBST XB=1.0457,6.214,1.025,1.157,0.0,2.44, SURF_ID='Interior Wall' / Long Hallway Wall
&OBST XB=1.0457,1.1857,1.157,3.478,0.0,2.44, SURF_ID='Interior Wall' / Short Hallway
Wall
96
&OBST XB=0.114,1.0457,3.033,3.173,0.0,2.44, SURF_ID='Interior Wall' / Long Closet Wall
&OBST XB=1.028,1.168,4.776,5.081,0.0,2.44, SURF_ID='Interior Wall' / Short Closet Wall
&OBST XB=0.1143,6.214,0.1143,5.081,-0.05,0.0, SURF_ID='CARPET' / Floor
&OBST XB=0.0,6.3283,0.0,5.1953,2.44,2.5, COLOR='INVISIBLE', SURF_ID='Exterior Wall',
BNDF_OBST=.FALSE. / Ceiling
~~~~~~~~~~~~~~~~~~~WINDOWS~~~~~~~~~~~~~~~~~~~
&MATL ID='GLASS',
SPECIFIC_HEAT=0.84,
CONDUCTIVITY=0.96,
DENSITY=2803.0 /
&SURF ID='WINDOWS',
COLOR='CYAN',
BACKING='VOID',
MATL_ID='GLASS',
MATL_MASS_FRACTION=1.0,
THICKNESS=0.0047625 /
&OBST XB=2.116,2.967,5.0773,5.1953,0.857,1.477, SURF_ID='WINDOWS',
DEVC_ID='Q1_WindowTop' / Quad 1 Window
&OBST XB=2.116,2.967,5.0773,5.1953,1.477,2.097, SURF_ID='WINDOWS',
DEVC_ID='Q1_WindowBottom' / Quad 1 Window Top Half
&DEVC XYZ=2.5415,5.05,1.167, ID='Q1_WindowTop', SETPOINT=450.,
QUANTITY='TEMPERATURE', INITIAL_STATE=.TRUE. /
&DEVC XYZ=2.5415,5.05,1.787, ID='Q1_WindowBottom', SETPOINT=450.,
QUANTITY='TEMPERATURE', INITIAL_STATE=.TRUE. /
&OBST XB=4.417,5.268,5.0773,5.1953,0.857,1.477, SURF_ID='WINDOWS',
DEVC_ID='Q2_WindowTop' / Quad 2 Window
&OBST XB=4.417,5.268,5.0773,5.1953,1.477,2.097, SURF_ID='WINDOWS',
DEVC_ID='Q2_WindowBottom' / Quad 2 Window Top Half
&DEVC XYZ=4.8425,5.05,1.167, ID='Q2_WindowTop', SETPOINT=450.,
QUANTITY='TEMPERATURE', INITIAL_STATE=.TRUE. /
&DEVC XYZ=4.8425,5.05,1.787, ID='Q2_WindowBottom', SETPOINT=450.,
QUANTITY='TEMPERATURE', INITIAL_STATE=.TRUE. /
97
~~~~~~~~~~~~~~~~~~~DOORS~~~~~~~~~~~~~~~~~~~
&MATL ID='AIR',
SPECIFIC_HEAT=1.005,
CONDUCTIVITY=0.0257,
DENSITY=1.205
SPEC_ID='OXYGEN'/
&MATL ID='MELAMINE',
SPECIFIC_HEAT=1.2,
CONDUCTIVITY=0.5,
DENSITY=1570.0/
&SURF ID='DOORS',
RGB=146,9,13,
BACKING='VOID',
MATL_ID(1,1)='MELAMINE',
MATL_ID(2,1)='AIR',
MATL_ID(3,1)='MELAMINE',
MATL_MASS_FRACTION(1,1)=1.0,
MATL_MASS_FRACTION(2,1)=1.0,
MATL_MASS_FRACTION(3,1)=1.0,
BURN_AWAY=.TRUE.
THICKNESS(1:3)=0.003,0.0762,0.003/
&HOLE XB=4.995,5.909,0.0,0.115,1.82799,2.0311, COLOR='TAN',
DEVC_ID='DoorTemp_1/10' / Front Door
&DEVC XYZ=5.452,0.115,1.9295, ID='DoorTemp_1/10', SETPOINT=398.,
QUANTITY='TEMPERATURE', INITIAL_STATE=.FALSE. /Far Hallway Top Device
&HOLE XB=4.995,5.909,0.0,0.115,1.62488,1.82799, COLOR='TAN 1',
DEVC_ID='DoorTemp_2/10' / Front Door
&DEVC XYZ=5.452,0.115,1.7264, ID='DoorTemp_2/10', SETPOINT=398.,
QUANTITY='TEMPERATURE', INITIAL_STATE=.FALSE. /Far Hallway Top Device
&HOLE XB=4.995,5.909,0.0,0.115,1.42177,1.62488, COLOR='TAN 2',
DEVC_ID='DoorTemp_3/10' / Front Door
98
&DEVC XYZ=5.452,0.115,1.5233, ID='DoorTemp_3/10', SETPOINT=398.,
QUANTITY='TEMPERATURE', INITIAL_STATE=.FALSE. /Far Hallway Top Device
&HOLE XB=4.995,5.909,0.0,0.115,1.21866,1.42177, COLOR='TAN 3',
DEVC_ID='DoorTemp_4/10' / Front Door
&DEVC XYZ=5.452,0.115,1.3202, ID='DoorTemp_4/10', SETPOINT=398.,
QUANTITY='TEMPERATURE', INITIAL_STATE=.FALSE. /Far Hallway Top Device
&HOLE XB=4.995,5.909,0.0,0.115,1.01555,1.21866, COLOR='TAN 4',
DEVC_ID='DoorTemp_5/10' / Front Door
&DEVC XYZ=5.452,0.115,1.2071, ID='DoorTemp_5/10', SETPOINT=398.,
QUANTITY='TEMPERATURE', INITIAL_STATE=.FALSE. /Far Hallway Top Device
&HOLE XB=4.995,5.909,0.0,0.115,0.81244,1.01555, COLOR='TAN',
DEVC_ID='DoorTemp_6/10' / Front Door
&DEVC XYZ=5.452,0.115,0.913995, ID='DoorTemp_6/10', SETPOINT=398.,
QUANTITY='TEMPERATURE', INITIAL_STATE=.FALSE. /Far Hallway Top Device
&HOLE XB=4.995,5.909,0.0,0.115,0.60933,0.81244, COLOR='TAN 1',
DEVC_ID='DoorTemp_7/10' / Front Door
&DEVC XYZ=5.452,0.115,0.710885, ID='DoorTemp_7/10', SETPOINT=398.,
QUANTITY='TEMPERATURE', INITIAL_STATE=.FALSE. /Far Hallway Top Device
&HOLE XB=4.995,5.909,0.0,0.115,0.40622,0.60933, COLOR='TAN 2',
DEVC_ID='DoorTemp_8/10' / Front Door
&DEVC XYZ=5.452,0.115,0.507775, ID='DoorTemp_8/10', SETPOINT=398.,
QUANTITY='TEMPERATURE', INITIAL_STATE=.FALSE. /Far Hallway Top Device
&HOLE XB=4.995,5.909,0.0,0.115,0.20311,0.40622, COLOR='TAN 3',
DEVC_ID='DoorTemp_9/10' / Front Door
&DEVC XYZ=5.452,0.115,0.30466, ID='DoorTemp_9/10', SETPOINT=398.,
QUANTITY='TEMPERATURE', INITIAL_STATE=.FALSE. /Far Hallway Top Device
&HOLE XB=4.995,5.909,0.0,0.115,0.0,0.20311, COLOR='TAN 4',
DEVC_ID='DoorTemp_10/10' / Front Door
&DEVC XYZ=5.452,0.115,0.1015, ID='DoorTemp_10/10', SETPOINT=398.,
QUANTITY='TEMPERATURE', INITIAL_STATE=.FALSE. /Far Hallway Top Device
&OBST XB=0.1143,1.0283,2.6482,2.725,0.0,2.0311, SURF_ID='DOORS'/ FRONT DOOR
99
&OBST XB=5.8322,5.909,1.157,2.071,0.0,2.0311, SURF_ID='DOORS'/ BEDROOM DOOR
&HOLE XB=4.995,5.909,1.024,1.16,0,2.0311/ Bedroom Door
&HOLE XB=0.0,0.118,1.811,2.725,0,2.0311/ Side Door
~~~~~~~~~~~~~~~~~~~HVAC~~~~~~~~~~~~~~~~~~~
&OBST XB=1.4,1.9,5.1953,5.6,0.16,0.43, COLOR='BLACK', SURF_ID='INERT'/ HVAC
&OBST XB=0.1,1.5,5.25,5.51,0.16,0.43, COLOR='BLACK', SURF_ID='INERT'/ HVAC_2
&HOLE XB=1.63,1.8,5.08,5.5001,0.2032,0.4032/ HVAC
&HOLE XB=0.0,1.8,5.3168,5.4692,0.2308,0.3903/ HVAC_2
~~~~~~~~~~~~~~~~~~~BEAN BAG~~~~~~~~~~~~~~~~~~~
&SPEC ID='POLYSTYRENE', FORMULA ='C8H8' /
&MATL ID='Polystyrene Beads'
SPECIFIC_HEAT=1.5
CONDUCTIVITY=0.034
DENSITY=25.
HEAT_OF_COMBUSTION=35600./
&SURF ID='BEANBAG'
COLOR='GREEN'
HRRPUA=152
BURN_AWAY=.TRUE.
IGNITION_TEMPERATURE=350.
MATL_ID='Polystyrene Beads'
THICKNESS=0.005/
&OBST XB= 1.1857, 1.8157, 1.457, 1.607, 0.00, 0.64, SURF_ID='BEANBAG' /
&OBST XB= 1.1857, 1.2857, 1.607, 2.067, 0.00, 0.44, SURF_ID='BEANBAG' /
&OBST XB= 1.68, 1.8167, 1.607, 2.067, 0.00, 0.44, SURF_ID='BEANBAG' /
&OBST XB= 1.2857, 1.7167, 1.457, 2.067, 0.00, 0.24, SURF_ID='BEANBAG' /
~~~~~~~~~~~~~~~~~~~BOOKCASE~~~~~~~~~~~~~~~~~~~
100
&MATL ID='PARTICLEBOARD'
SPEC_ID='CELLULOSE'
DENSITY=800.
CONDUCTIVITY=0.14
HEAT_OF_COMBUSTION=17.5
SPECIFIC_HEAT=1.3 /
&SURF ID='Bookcase'
COLOR='ORANGE'
HRRPUA=120.
MATL_ID='PARTICLEBOARD'
RAMP_Q='bookcase_ramp'
IGNITION_TEMPERATURE=230.
THICKNESS=0.8 /
&SURF ID='Bookcase_Back'
COLOR='ORANGE'
HRRPUA=120.
BURN_AWAY=.TRUE.
RAMP_Q='bookcase_ramp'
MATL_ID='PARTICLEBOARD'
IGNITION_TEMPERATURE=230.
THICKNESS=0.8 /
&RAMP ID='bookcase_ramp', T=107, F=1 /
&RAMP ID='bookcase_ramp', T=120, F=1.22 /
&RAMP ID='bookcase_ramp', T=140, F=1.28 /
&RAMP ID='bookcase_ramp', T=160, F=1.17 /
&RAMP ID='bookcase_ramp', T=180, F=1.15 /
&RAMP ID='bookcase_ramp', T=200, F=0.98 /
&RAMP ID='bookcase_ramp', T=220, F=0.91 /
&RAMP ID='bookcase_ramp', T=240, F=0.69 /
&RAMP ID='bookcase_ramp', T=260, F=0.55 /
&RAMP ID='bookcase_ramp', T=360, F=0.36 /
&RAMP ID='bookcase_ramp', T=390, F=0.27 /
&RAMP ID='bookcase_ramp', T=510, F=0.24 /
&RAMP ID='bookcase_ramp', T=540, F=0.29 /
&RAMP ID='bookcase_ramp', T=615, F=0.28 /
101
&OBST XB= 3.317, 4.017, 5.031, 5.081, 0.00, 1.06, COLOR='IVORY',
SURF_ID='Bookcase_Back' / Back End
&OBST XB= 3.267, 3.317, 4.751, 5.081, 0.00, 1.06, COLOR='IVORY', SURF_ID='Bookcase' /
Left End
&OBST XB= 4.017, 4.067, 4.751, 5.081, 0.00, 1.06, COLOR='IVORY', SURF_ID='Bookcase' /
Right End
&OBST XB= 3.317, 4.017, 4.751, 5.031, 1.01, 1.06, COLOR='IVORY', SURF_ID='Bookcase' /
Top
&OBST XB= 3.317, 4.017, 4.751, 5.031, 0.65, 0.70, COLOR='IVORY', SURF_ID='Bookcase' /
Top Shelf
&OBST XB= 3.317, 4.017, 4.751, 5.031, 0.34, 0.39, COLOR='IVORY', SURF_ID='Bookcase' /
Middle Shelf
&OBST XB= 3.317, 4.017, 4.751, 5.031, 0.00, 0.05, COLOR='IVORY', SURF_ID='Bookcase' /
Bottom
~~~~~~~~~~~~~~~~~~~DESK~~~~~~~~~~~~~~~~~~~
&MATL ID ='PARTICLEBOARD1'
SPECIFIC_HEAT =1.3
CONDUCTIVITY =0.14
DENSITY =800
SPEC_ID ='CELLULOSE'/
&SURF ID ='DESK'
COLOR ='WHITE'
MATL_ID ='PARTICLEBOARD1'
BURN_AWAY =.TRUE.
THICKNESS =0.025
HRRPUA =90.94
RAMP_Q ='DESK_ramp'
IGNITION_TEMPERATURE =232.2 /
&RAMP ID='DESK_ramp', T=144, F=1.630 /
&RAMP ID='DESK_ramp', T=377, F=1.750 /
&RAMP ID='DESK_ramp', T=960, F=0.341 /
&OBST XB= 3.595, 4.995, 1.157, 1.807, 0.695, 0.73, SURF_ID='DESK'/
&OBST XB=3.595, 3.645, 1.157, 1.807, 0.0, 0.695, SURF_ID='DESK'/
&OBST XB=3.945, 3.995, 1.157, 1.807, 0.0, 0.695, SURF_ID='DESK'/
102
&OBST XB= 4.945, 4.995, 1.157, 1.807, 0.00, 0.695, SURF_ID='DESK'/
&OBST XB=3.695, 3.995, 1.157, 1.807, 0.465, 0.5, SURF_ID='DESK' /
&OBST XB=3.695, 3.995, 1.157, 1.807, 0.0, 0.05, SURF_ID='DESK' /
&OBST XB=3.645, 3.945, 1.157, 1.807, 0.45, 0.5, SURF_ID='DESK'/
&OBST XB=3.645, 3.945, 1.157, 1.807, 0.0, 0.05, SURF_ID='DESK'/
&OBST XB=3.645, 3.945, 1.807, 1.857, 0.0, 0.7, SURF_ID='DESK'/
~~~~~~~~~~~~~~~~~~~DESK CHAIR~~~~~~~~~~~~~~~~~~~
&SPEC ID='POLYURETHANE'
FORMULA='C25H42N2O6' /
&SPEC ID='POLYESTER'
FORMULA='C10H8O4' /
&MATL ID='OAK'
CONDUCTIVITY=0.17
SPECIFIC_HEAT=2.38
DENSITY=545.
SPEC_ID='CELLULOSE'/
&MATL ID='PARTICLEBOARD_A'
CONDUCTIVITY=0.078
SPECIFIC_HEAT=1.3
DENSITY=590.
SPEC_ID='CELLULOSE'/
&MATL ID='FOAM'
CONDUCTIVITY=0.034
SPECIFIC_HEAT=1.4
DENSITY=29.
SPEC_ID='POLYURETHANE'/
&MATL ID='FABRIC'
CONDUCTIVITY=0.2
SPECIFIC_HEAT=1.3
DENSITY=1345.
SPEC_ID='POLYESTER'/
103
&SURF ID='SEAT_BOTTOM',
COLOR='KHAKI',
HRRPUA=704.0,
IGNITION_TEMPERATURE=268.0,
MATL_ID(1,1)='FABRIC',
MATL_ID(2,1:2)='PARTICLEBOARD_A','FOAM',
MATL_MASS_FRACTION(1,1)=1.0,
MATL_MASS_FRACTION(2,1:2)=0.2,0.8,
THICKNESS(1:2)=0.0009,0.5146
RAMP_Q='chair_ramp' /
&SURF ID='WOOD LEGS',
COLOR='BURNT SIENNA',
HRRPUA=8.7,
IGNITION_TEMPERATURE=260.0,
MATL_ID(1,1)='OAK',
MATL_MASS_FRACTION(1,1)=1.0,
THICKNESS(1)=0.07 /
&RAMP ID='chair_ramp', T=60, F=0.7 /
&RAMP ID='chair_ramp', T=90, F=0.62 /
&RAMP ID='chair_ramp', T=112, F=0.1 /
&RAMP ID='chair_ramp', T=180, F=0.07 /
&RAMP ID='chair_ramp', T=240, F=0.0 /
&RAMP ID='chair_ramp', T=600, F=0.0 /
&OBST XB= 4.247, 4.787, 1.437, 1.857, 0.36, 0.47, SURF_ID='SEAT_BOTTOM' /
&OBST XB= 4.247, 4.787, 1.857, 2.017, 0.36, 0.97, SURF_ID='SEAT_BOTTOM' /
&OBST XB= 4.247, 4.317, 1.947, 2.017, 0.00, 0.36, SURF_ID='WOOD LEGS' /
&OBST XB= 4.247, 4.317, 1.437, 1.507, 0.00, 0.36, SURF_ID='WOOD LEGS' /
&OBST XB= 4.717, 4.787, 1.947, 2.017, 0.00, 0.36, SURF_ID='WOOD LEGS' /
&OBST XB= 4.717, 4.787, 1.437, 1.507, 0.00, 0.36, SURF_ID='WOOD LEGS' /
~~~~~~~~~~~~~~~~~~~DRESSER~~~~~~~~~~~~~~~~~~~
&MATL ID ='WHITE PINE'
SPEC_ID ='CELLULOSE'
SPECIFIC_HEAT =2.5
104
CONDUCTIVITY =0.11
DENSITY =435
HEAT_OF_COMBUSTION =18500/
&SURF ID ='Dresser'
COLOR ='SEPIA'
MATL_ID ='WHITE PINE'
THICKNESS =0.04
HRRPUA =437.94
RAMP_Q ='DRESSER_RAMP'
IGNITION_TEMPERATURE =350/
&&RAMP ID='DRESSER_RAMP', T=299, F=1.610 /
&RAMP ID='DRESSER_RAMP', T=360, F=0.825 /
&RAMP ID='DRESSER_RAMP', T=450, F=0.750 /
&RAMP ID='DRESSER_RAMP', T=600, F=0.241 /
&RAMP ID='DRESSER_RAMP', T=900, F=0.151 /
&OBST XB=5.714, 6.214, 2.507, 2.577, 0.0, 0.93, SURF_ID='Dresser'/
&OBST XB=5.714, 6.214, 3.527, 3.597, 0.0, 0.93, SURF_ID='Dresser'/
&OBST XB=6.114, 6.214, 2.577, 3.527, 0.0, 0.93, SURF_ID='Dresser'/
&OBST XB=5.714, 6.214, 2.577, 3.527, 0.0, 0.06, SURF_ID='Dresser'/
&OBST XB=5.714, 5.764, 2.582, 3.527, 0.06, 0.325, SURF_ID='Dresser'/
&OBST XB=5.714, 6.214, 2.577, 3.527, 0.33, 0.36, SURF_ID='Dresser'/
&OBST XB=5.714, 5.764, 2.582, 3.527, 0.36, 0.625, SURF_ID='Dresser'/
&OBST XB=5.714, 6.214, 2.577, 3.527, 0.63, 0.66, SURF_ID='Dresser'/
&OBST XB=5.714, 5.764, 2.582, 3.527, 0.66, 0.925, SURF_ID='Dresser'/
&OBST XB=5.714, 6.214, 2.507, 3.597, 0.93,0.96, SURF_ID='Dresser'/
~~~~~~~~~~~~~~~~~~~MATTRESS~~~~~~~~~~~~~~~~~~~
&MATL ID='POLYURETHANE_CORE'
SPECIFIC_HEAT=1.4
CONDUCTIVITY=0.02
DENSITY=30
SPEC_ID='POLYURETHANE'
HEAT_OF_COMBUSTION=24200. /
&MATL ID='POLYESTER'
105
CONDUCTIVITY=0.05
SPECIFIC_HEAT=1.1
DENSITY=525
HEAT_OF_COMBUSTION=20300. /
&MATL ID='POLYURETHANE_COTTON'
SPECIFIC_HEAT=1.4
CONDUCTIVITY=0.02
SPEC_ID='POLYURETHANE'
DENSITY=575
HEAT_OF_COMBUSTION=24200. /
&SURF ID='MATTRESS'
COLOR='GRAY'
HRRPUA=275
BURN_AWAY=.TRUE.
BACKING='EXPOSED'
MATL_ID(1:2,1)='POLYESTER','POLYURETHANE_CORE'
THICKNESS(1:2)=0.00038,0.1
IGNITION_TEMPERATURE=245. /
&SURF ID='PILLOW'
COLOR='BLACK'
HRRPUA=325
MATL_ID='POLYURETHANE_COTTON'
THICKNESS=0.004
BACKING='EXPOSED'
BURN_AWAY=.TRUE.
IGNITION_TEMPERATURE=190. /
&SURF ID='BOX SPRING'
MATL_ID='WHITE PINE'
THICKNESS=0.025 /
&OBST XB= 1.95, 3.474, 1.157, 3.189, 0.4318, 0.635, SURF_ID='MATTRESS' /
&OBST XB= 2.00, 2.6604, 1.157, 1.665, 0.635, 0.7366 SURF_ID='PILLOW' /
&OBST XB= 2.7, 3.3604, 1.157, 1.665, 0.635, 0.7366 SURF_ID='PILLOW' /
&OBST XB= 1.95, 2.05, 1.157, 3.189, 0.2318, 0.4318, SURF_ID='BOX SPRING' /
&OBST XB= 3.374, 3.474, 1.157, 3.189, 0.2318, 0.4318, SURF_ID='BOX SPRING'/
106
&OBST XB= 2.05, 3.474, 1.157, 1.257, 0.2318, 0.4318, SURF_ID='BOX SPRING'/
&OBST XB= 2.05, 3.474, 3.089, 3.189, 0.2318, 0.4318, SURF_ID='BOX SPRING'/
&OBST XB= 2.05, 3.474, 2.073, 2.173, 0.2318, 0.4318, SURF_ID='BOX SPRING'/
~~~~~~~~~~~~~~~~~~~UPHOLSTERED CHAIR~~~~~~~~~~~~~~~~~~~
&MATL ID='PINEWOOD'
CONDUCTIVITY=0.15
SPECIFIC_HEAT=2.805
DENSITY=640.
SPEC_ID='CELLULOSE'/
&SURF ID='upholstered_SEAT_CUSHION',
COLOR='BURNT UMBER',
HRRPUA=457.29,
IGNITION_TEMPERATURE=407.0,
MATL_ID='FABRIC','FOAM'
THICKNESS=0.0009, 0.86
RAMP_Q='upholsteredchair_ramp'/
&SURF ID='upholstered_WOOD LEGS',
COLOR='MAROON',
HRRPUA=14.03,
IGNITION_TEMPERATURE=350.0,
MATL_ID='PINEWOOD',
THICKNESS=0.1
RAMP_Q='upholsteredchair_ramp'/
&RAMP ID='upholsteredchair_ramp', T=270, F=1.0 /
&RAMP ID='upholsteredchair_ramp', T=312, F=0.01 /
&RAMP ID='upholsteredchair_ramp', T=1320, F=0.0 /
&OBST XB=5.794, 6.074, 4.091, 4.951, 0.15, 0.9, SURF_ID='upholstered_SEAT_CUSHION'/
Couch, back cushions
&OBST XB=5.294, 5.794, 4.801, 4.951, 0.15, 0.66, SURF_ID='upholstered_SEAT_CUSHION'/
Couch, right armrest
&OBST XB=5.294, 5.794, 4.091, 4.241, 0.15, 0.66, SURF_ID='upholstered_SEAT_CUSHION'/
Couch, left armrest
107
&OBST XB=5.294, 5.794, 4.241, 4.801, 0.15, 0.3, SURF_ID='upholstered_SEAT_CUSHION'/
Couch, seat bottom
&OBST XB=5.294, 5.791, 4.244, 4.798, 0.303, 0.46,
SURF_ID='upholstered_SEAT_CUSHION'/ Couch, seat cushion
&OBST XB=5.294, 5.394, 4.801, 4.951, 0.0, 0.15, SURF_ID='upholstered_WOOD LEGS'/ F.R.
Leg
&OBST XB=5.294, 5.394, 4.091, 4.241, 0.0, 0.15, SURF_ID='upholstered_WOOD LEGS'/ F.L.
Leg
&OBST XB=5.974, 6.074, 4.801, 4.951, 0.0, 0.15, SURF_ID='upholstered_WOOD LEGS'/ B.R.
Leg
&OBST XB=5.974, 6.074, 4.091, 4.241, 0.0, 0.15, SURF_ID='upholstered_WOOD LEGS'/ B.L.
Leg
~~~~~~~~~~~~~~~~~~SIP~~~~~~~~~~~~~~~~~~
&SURF ID='SIP'
COLOR='MAGENTA'
HRRPUA=1105.7
RAMP_Q='fire_ramp' /
&RAMP ID='fire_ramp', T=0, F=0 /
&RAMP ID='fire_ramp', T=17, F=.75 /
&RAMP ID='fire_ramp', T=30, F=1 /
&RAMP ID='fire_ramp', T=40, F=.75 /
&RAMP ID='fire_ramp', T=60, F=0.675 /
&RAMP ID='fire_ramp', T=120, F=0.475 /
&RAMP ID='fire_ramp', T=180, F=0.4 /
&RAMP ID='fire_ramp', T=240, F=0.275 /
&RAMP ID='fire_ramp', T=300, F=0.225 /
&RAMP ID='fire_ramp', T=360, F=0.2 /
&RAMP ID='fire_ramp', T=420, F=0.2 /
&RAMP ID='fire_ramp', T=480, F=0.15 /
&RAMP ID='fire_ramp', T=540, F=0.125 /
&RAMP ID='fire_ramp', T=600, F=0.125 /
&RAMP ID='fire_ramp', T=660, F=0.1 /
&RAMP ID='fire_ramp', T=720, F=0.025 /
&RAMP ID='fire_ramp', T=780, F=0.020 /
&RAMP ID='fire_ramp', T=840, F=0.0 /
108
&OBST XB=5.214, 5.29, 4.306, 4.382, 0.00, 0.10, SURF_ID='SIP' /
~~~~~~~~SLICE/BOUNDARY FILES~~~~~~~~
&SLCF XB=2.5415,2.5415,1.157,6.081,0,2.44, QUANTITY='VELOCITY', VECTOR=.TRUE.
/ QUAD 1 WINDOW SLICE
&SLCF XB=2.5415,2.5415,1.157,6.081,0,2.44, QUANTITY='TEMPERATURE',
VECTOR=.TRUE. / QUAD 1 WINDOW SLICE
&SLCF XB=2.5415,2.5415,1.157,6.081,0,2.44, QUANTITY='VOLUME FRACTION',
SPEC_ID='OXYGEN', VECTOR=.TRUE. / QUAD 1 WINDOW SLICE
&SLCF XB=4.8425,4.8425,1.157,6.081,0,2.44, QUANTITY='VELOCITY', VECTOR=.TRUE.
/ QUAD 2 WINDOW SLICE
&SLCF XB=4.8425,4.8425,1.157,6.081,0,2.44, QUANTITY='TEMPERATURE',
VECTOR=.TRUE. / QUAD 2 WINDOW SLICE
&SLCF XB=4.8425,4.8425,1.157,6.081,0,2.44, QUANTITY='VOLUME FRACTION',
SPEC_ID='OXYGEN', VECTOR=.TRUE. / QUAD 2 WINDOW SLICE
&SLCF XB=5.338,5.338,-1.0,2.091,0,2.44, QUANTITY='VELOCITY', VECTOR=.TRUE. /
DOORS
&SLCF XB=5.338,5.338,-1.0,2.091,0,2.44, QUANTITY='TEMPERATURE',
VECTOR=.TRUE. / DOORS
&SLCF XB=5.338,5.338,-1.0,2.091,0,2.44, QUANTITY='VOLUME FRACTION',
SPEC_ID='OXYGEN', VECTOR=.TRUE. / DOORS
&SLCF XB=2.116,5.268,5.0,5.0,0.857,2.097, QUANTITY='VELOCITY', VECTOR=.TRUE. /
BOTH WINDOWS
&SLCF XB=2.116,5.268,5.0,5.0,0.857,2.097, QUANTITY='TEMPERATURE',
VECTOR=.TRUE. / BOTH WINDOWS
&SLCF XB=4.995,5.909,0.2,0.2,0,2.0311, QUANTITY='VELOCITY', VECTOR=.TRUE. /
FRONT DOOR
&SLCF XB=4.995,5.909,0.2,0.2,0,2.0311, QUANTITY='TEMPERATURE', VECTOR=.TRUE.
/ FRONT DOOR
&SLCF XB=0.0,6.3283,0.0,5.1953,1.8288,1.8288, QUANTITY='VELOCITY',
VECTOR=.TRUE. / 6ft Z-plane
&SLCF XB=0.0,6.3283,0.0,5.1953,1.8288,1.8288, QUANTITY='TEMPERATURE',
VECTOR=.TRUE. / 6ft Z-plane
109
&SLCF XB=0.0,6.3283,0.0,5.1953,1.8288,1.8288, QUANTITY='VOLUME FRACTION',
SPEC_ID='OXYGEN', VECTOR=.TRUE. / 6ft Z-plane
&SLCF XB=0.0,6.3283,0.0,5.1953,2.4,2.4, QUANTITY='VELOCITY', VECTOR=.TRUE. /
Ceiling Z-plane
&SLCF XB=0.0,6.3283,0.0,5.1953,2.4,2.4, QUANTITY='TEMPERATURE',
VECTOR=.TRUE. / Ceiling Z-plane
&SLCF XB=0.0,6.3283,0.0,5.1953,2.4,2.4, QUANTITY='VOLUME FRACTION',
SPEC_ID='OXYGEN', VECTOR=.TRUE. / Ceiling Z-plane
&BNDF QUANTITY='WALL TEMPERATURE'/
&BNDF QUANTITY='NET HEAT FLUX' /
&TAIL /