forecastx wizard tutorial 6.0
TRANSCRIPT

www.johngalt.com
ForecastX Wizard™ TutorialTutorialTutorialTutorial
125 S. Clark St., Suite 1950 Chicago, IL 60603 Phone: 312.701.9026 Fax: 312.701.9033 Email: [email protected]

Table of Contents ForecastX Wizard™ Tutorial
Privileged and Confidential. Copyright John Galt Solutions, Inc. Do not duplicate without permission. 1
Table of Contents
Part One: Introduction
Tutorial Overview
ForecastX Wizard™ Features and Functionality
ForecastX Wizard™ Technical and Statistical Methods
System Requirements and Installation
Part Two: Getting Started with the ForecastX Wizard™
One Step Forecasting
Data Cleansing
Group Forecasting
Event and Promotional Modeling
Part Three: Enhancing the Forecasting Process
Other ForecastX™ Products and Services – Who Is John Galt?
Purchase Order

Table of Contents ForecastX Wizard™ Tutorial
Privileged and Confidential. Copyright John Galt Solutions, Inc. Do not duplicate without permission. 2
ForecastX Wizard™ Define your forecasting process and build your baseline forecast today! The ForecastX Wizard is part of the Forecast Xpert Toolkit™. It is an easy to use tool that will assist you in defining and improving your forecasting process. This tutorial for the ForecastX Wizard will show you how effortless and easy it is to create accurate forecasts. This tutorial will help you take advantage of the power and accuracy of the ForecastX Wizard. The ForecastX Wizard has the ability to perform one-step forecasting utilizing the Procast™ Method. This method picks the best forecast technique for each data series and has been rated one the easiest to use by PC Magizine. INSEAD University’s M3 Competition rated ForecastX Wizard one of the most accurate forecasting tools in the world among all other forecasting products. Generally, this level of accuracy is achieved through complex steps such as rewriting the format of a particular data series, an extensive understanding of statistical methods, and having to import data into an outside forecasting tool. However, with ForecastX Wizard all levels of users – novices, intermediates and expert statisticians – can become Forecast Xpert™.
Key Features and Functionality ForecastX Wizard The range of functionality makes the ForecastX Wizard a solution that never stops growing with the end user. For instance, a non-statistician can use the Wizard to produce fast, accurate forecasts in an environment they are familiar with; Microsoft Excel. At the same time, an advanced mathematician can use the Wizard to determine all the seasonal indices and smoothing parameters of a data set. Features Functionality Full integration with Microsoft Excel Expert selection that includes new product No data preparation required Easy to use data cleansing One-step forecasting with expert selection Grouping and Allocation Unlimited batch forecasting Customize parameters within the forecast Management & audit trail reports Full Causal Regression Promotional modeling Safety Stock for replenishment forecasting Distribution Requirements Planning(DRP) Stocking levels for Slow Moving items Pivot table reporting for drill down analysis
ForecastX Wizard Benefits • Work directly in Excel for increased efficiency and analytical power • Spend valuable time defining the forecast instead of formatting your data • See where promotional plans stack up against best-case and worst-case scenarios • Perform profitability analysis with events and promotions • Plan successful new product launches • Involve business partners to improve the overall forecasting process and accuracy • Report how your forecast is going to be consume by with the DRP report • Build your baseline forecast effortlessly and efficiently
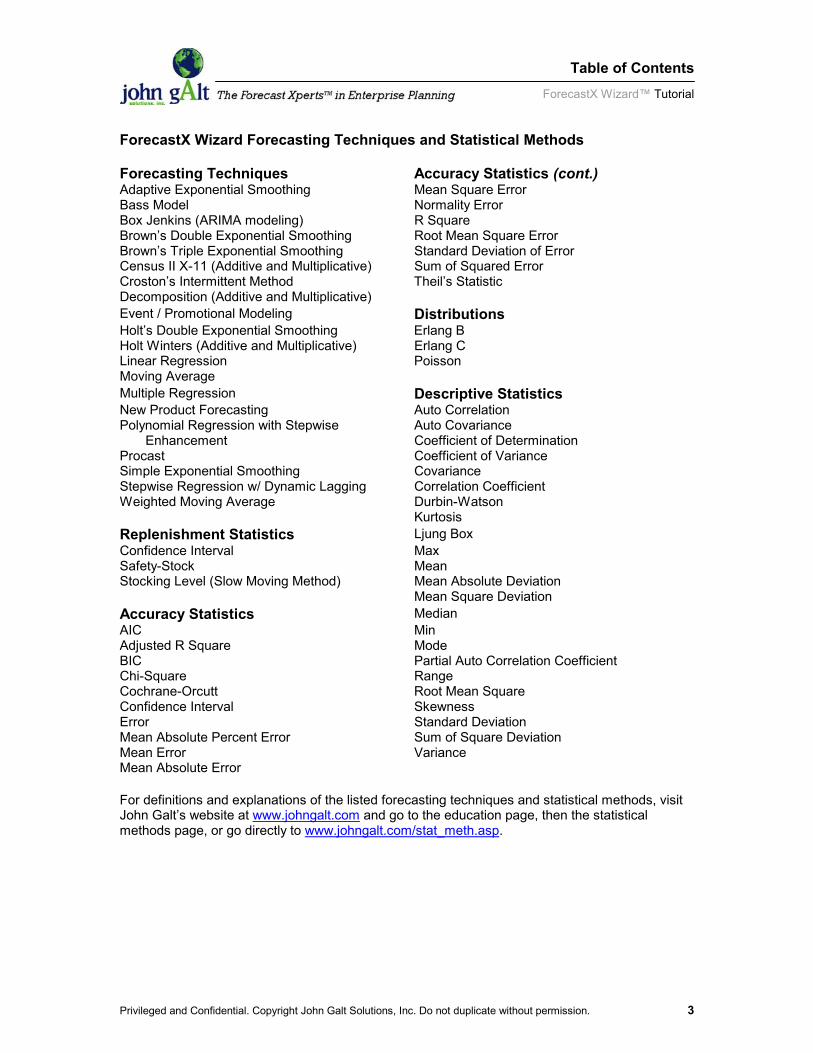
Table of Contents ForecastX Wizard™ Tutorial
Privileged and Confidential. Copyright John Galt Solutions, Inc. Do not duplicate without permission. 3
ForecastX Wizard Forecasting Techniques and Statistical Methods Forecasting Techniques Accuracy Statistics (cont.) Adaptive Exponential Smoothing Mean Square Error Bass Model Normality Error Box Jenkins (ARIMA modeling) R Square Brown’s Double Exponential Smoothing Root Mean Square Error Brown’s Triple Exponential Smoothing Standard Deviation of Error Census II X-11 (Additive and Multiplicative) Sum of Squared Error Croston’s Intermittent Method Theil’s Statistic Decomposition (Additive and Multiplicative) Event / Promotional Modeling Distributions Holt’s Double Exponential Smoothing Erlang B Holt Winters (Additive and Multiplicative) Erlang C Linear Regression Poisson Moving Average Multiple Regression Descriptive Statistics New Product Forecasting Auto Correlation Polynomial Regression with Stepwise Auto Covariance Enhancement Coefficient of Determination Procast Coefficient of Variance Simple Exponential Smoothing Covariance Stepwise Regression w/ Dynamic Lagging Correlation Coefficient Weighted Moving Average Durbin-Watson Kurtosis Replenishment Statistics Ljung Box Confidence Interval Max Safety-Stock Mean Stocking Level (Slow Moving Method) Mean Absolute Deviation Mean Square Deviation Accuracy Statistics Median AIC Min Adjusted R Square Mode BIC Partial Auto Correlation Coefficient Chi-Square Range Cochrane-Orcutt Root Mean Square Confidence Interval Skewness Error Standard Deviation Mean Absolute Percent Error Sum of Square Deviation Mean Error Variance Mean Absolute Error For definitions and explanations of the listed forecasting techniques and statistical methods, visit John Galt’s website at www.johngalt.com and go to the education page, then the statistical methods page, or go directly to www.johngalt.com/stat_meth.asp.

Table of Contents ForecastX Wizard™ Tutorial
Privileged and Confidential. Copyright John Galt Solutions, Inc. Do not duplicate without permission. 4
System Requirements for Using the ForecastX Wizard Pentium based machine Windows 95, or Higher A minimum of 32MB of memory (64MB recommended) Microsoft office 2000 or Higher
Installing ForecastX Wizard 1. Insert the ForecastX CD-ROM into your CD drive 2. Within Windows Explorer, select the CD drive 3. Double click the “ForecastXWizard.exe” 4. Follow the setup wizard as directed, when prompted, call John Galt at 312.701.9026 for an
installation key 5. When given a license key from a John Galt representative, enter it into the box labeled “key” 6. Click “Install Key”. Then follow the prompt by clicking “OK” 7. When you return to the “John Galt Install Key” screen, click “EXIT” 8. You should then see files transferring 9. ForecastX will then be installed successfully Once the ForecastX Wizard is installed you will see a folder open with several different Microsoft Excel spreadsheets. These spreadsheets will be used throughout this tutorial booklet. The ForecastX Wizard Icon should appear within your Microsoft Excel toolbar. If you don’t see the ForecastX Wizard icon, please contact a John Galt representative at [email protected] or 312.701.9026.
Getting Started with the ForecastX Wizard™ ForecastX Wizard™ Tutorial
Privileged and Confidential. Copyright John Galt Solutions, Inc. Do not duplicate without permission. 5
ForecastX Wizard Will Jump Start Your Forecasting Process ForecastX Wizard enables users to perform a one-step, expert selection forecast, known as Procast. The amount of data does not limit Procast at all; you can run Procast on a single data series or many series at once. The Wizard has no limits on the amount of data that it can be processed, it is only limited by the power of Microsoft Excel. Once Procast has been activated, the Wizard will determine the best forecasting technique for each data series in your particular data set. Procast chooses from among the most complex forecasting techniques list on Page 3. By clicking only once on the ForecastX Wizard icon, you can produce fast, accurate and easy-to-read results.
New Product Curve The ForecastX Wizard will also take new product growth curves into consideration. This technique is useful when planning new product launches and determining when the product launch ramp period will end.
Safety Stock and Confidence Levels ForecastX Wizard allows you to customize the safety stock levels and confidence limits. With the Safety Stock settings, you can set customer service levels and lead time. With the Confidence Level, you can set the confidence interval. Users can go to the Statistics tab and click on the “more” button to find these two options.
Collaboration through Reconciliation Use the ForecastX Wizard to begin defining your process, and building an internal collaborative network. With the reconciliation feature you have the ability to not only track the changes that are made by different departments, but reconcile those figures with the final forecast.
Stocking Level (Slow Moving Method) Forecast The Stocking Level Forecast is useful to forecast items that are slow moving and have sporadic demand streams. The results provide reliable forecast values and predictable Stocking levels, which enables you to meet the desired service level of orders met.
Distribution Requirements Planning (DRP) Reporting The ForecastX Wizard also supports the creation of demand requirement values. The ForecastX Wizard will use data included in the file for fields such as; initial onhand, minimum periods covered, reorder point, reorder quantity, reorder point flags, order lead time, safety stock and service levels for individual items. If the DRP fields are not included in the data file, default values can also be set. The resulting DRP information is displayed in the DRP report.

Getting Started with the ForecastX Wizard™ ForecastX Wizard™ Tutorial
Privileged and Confidential. Copyright John Galt Solutions, Inc. Do not duplicate without permission. 6
The One-Step Forecast with Procast Session 1: One-Step Forecasting with Procast
1) Open the “ForecastXTrainingSet.xls” spreadsheet that accompanies the ForecastX Wizard™,(the default location is C:\Program Files\ForecastX\Samples) and click on the sheet labeled “Procast”.
2) When the spreadsheet opens, select a cell that contains data. Click on the ForecastX Wizard icon within the Microsoft Excel toolbar to start the Wizard.
The Intelligent Data Recognizer looks at the data and determines the following:
• Organization: Automatically detects whether your data is in rows or columns
• Forecast Range: Determines the data range to be forecasted
• Dates: Determines whether your data contains dates and how those dates are formatted
• Labels: Determines that your data contains descriptive labels
• Paras: Determines the number of DRP fields that follow the labels
• Seasonality: Let ForecastX find the seasonality in your data or select it yourself
• Forecast: Set the number of periods to forecast out into the future You are now ready to create your first forecast!
1) Simply click the “Procast” button to complete your forecast. 2) When the forecast is complete, click the “Done” button.
ForecastX automatically produces a “Standard Report” that appears on a separate worksheet. The worksheet lists what forecasting method the ForecastX Wizard chose for each of the data series. The fitted values are listed in italics below the actual values for each series. As you scroll to the right on the spreadsheet, you will notice that the ForecastX Wizard has listed the forecast values in bold. To the right of the forecasted values, the ForecastX Wizard has produced four accuracy statistics that can help you determine how trustworthy the forecast is.
• Mean Absolute Percentage Error (MAPE) tells you the overall average of the error
measurements ForecastX produced. This value should be close to or below 20% to be considered accurate.

Getting Started with the ForecastX Wizard™ ForecastX Wizard™ Tutorial
Privileged and Confidential. Copyright John Galt Solutions, Inc. Do not duplicate without permission. 7
• R-Square lets you know how well the fitted values compare to the actual values, and should be considered accurate the closer it is to 100%.
• Mean gives you the average values of each series. • Standard Deviation tells you how far away each data point is from the average data
point in the data set. You have just produced an accurate, one-step forecast with Procast.
Data Cleansing As an advanced option, ForecastX Wizard users can use the Data Cleansing button to improve the accuracy of the forecast. Options found on the Data Cleansing Screen include:
• Replacement of Outliers • Replacement of Missing Values • Removal of Zeros • Apply Tracking Signal • Holdback Evaluation • Range Forecast

Getting Started with the ForecastX Wizard™ ForecastX Wizard™ Tutorial
Privileged and Confidential. Copyright John Galt Solutions, Inc. Do not duplicate without permission. 8
Group Forecasting The Group By tab provides Top Down and Bottom Up allocation. Top Down Allocation is a useful technique to use when data at a detail level does not provide an accurate forecast but the aggregate level provides stability for a more accurate forecast. The aggregate level forecast is then allocated down to the detail series. Using the same spreadsheet, “ForecastXTrainingSet.xls” and the “Procast” worksheet, open the ForecastX Wizard.
1) Click the ForecastX icon, and the “Data Capture” screen appears, click on the “Group By” tab
2) Under Group By, check the “Group Forecast” box
3) For Allocation Type, check the “Top Down” option
4) Under Group By, check the “Description” circle and make sure that “Column A” is showing in the pull down box
5) For the Allocation By section, check “Historical” and then click finish!
Reviewing the results, Notice that ForecastX Wizard created forecasts for Total Shirts and Total Pants as well as the detailed level forecasts.

Getting Started with the ForecastX Wizard™ ForecastX Wizard™ Tutorial
Privileged and Confidential. Copyright John Galt Solutions, Inc. Do not duplicate without permission. 9
Event and Promotional Modeling The Wizard can take special events and promotions into account while you’re developing your forecast. When you are able to identify major promotions that impact sales, you enhance the accuracy of the forecast. With the ForecastX Wizard, you can tag past events and tag when the event will occur in the future. The Wizard will take the past events, measure how it effected history and apply a lift factor to the forecast. Using the Excel file “ForecastXTrainingSet.xls”, click on the “Event Modeling” worksheet. Here you will see columns, Newspaper Sales and the Marketing Plan and the data associated with those sales.
1) Highlight the Months and Newspaper Sales data (rows 1-40, columns A & B) and open the ForecastX Wizard.
With the “Data Capture” screen open, notice that the Wizard has recognized that the data is arranged in columns, not rows.
2) Click on the “Reports” tab and select “Standard” and the check “Chart”.
3) Click “Finish” and review the forecast.

Getting Started with the ForecastX Wizard™ ForecastX Wizard™ Tutorial
Privileged and Confidential. Copyright John Galt Solutions, Inc. Do not duplicate without permission. 10
The Wizard creates the standard report and a graph of the results. You will notice that the forecasted results and error measurements reflect a forecast without any type of event modeling.
Using the same workbook, “ForecastXTrainingSet.xls”, and the “Event Modeling” worksheet, you can now see what happens when Event Modeling is used.
1) Highlight Months and Newspaper Sales (rows 1-40, columns A & B) and open the ForecastX Wizard.
2) With the “Data Capture” screen open, click on the “Forecast Method” tab.
3) Under Forecasting Techniques, use the pull down bar to select “Event Model”.
4) Under Event Flags, click inside the box. This will bring up the “Data Selection” screen.
5) Define the event flag data ranges by highlighting column C “Marketing Plan” and then
click “Done” which brings you back to the “Forecast Method” screen.
6) Click on the “Report” tab to bring up the “Report Options” screen. Uncheck the “Standard” report, check “Audit” and click “Finish!”.

Getting Started with the ForecastX Wizard™ ForecastX Wizard™ Tutorial
Privileged and Confidential. Copyright John Galt Solutions, Inc. Do not duplicate without permission. 11
Now we can understand the effect of the events on Newspaper Sales and see how our error measurements have improved. The Audit Trail report provides you with additional statistical data. By selecting the “More” tab on the “Statistics” screen, additional statistical choices may be added.
This report includes an event index, which represents each events lift factor over the base forecast.

Getting Started with the ForecastX Wizard™ ForecastX Wizard™ Tutorial
Privileged and Confidential. Copyright John Galt Solutions, Inc. Do not duplicate without permission. 12
Distribution Requirements Planning Report The Wizard uses Distribution Requirements Planning (DRP) information provided from the data file or established defaults to calculate values such as; safety stock, ending inventories, unsupported forecast and turns. DRP information is included on the DRP Report. This format provides a visual representation of the key values in the planning process. Open the Excel file “ForecastX_Samples.xls” and click on the “DRP Sample” worksheet. Here you will see columns of descriptive information, DRP fields of information and history information. The DRP fields include Onhand, PerCoverage, ReorderPoint, Reorder Qty and ROP flag.
1) Highlight the first cell of data and open the ForecastX Wizard.
2) On the “Data Capture” screen verify that the “Paras” Option is set to “5”.
3) Click on the “Reports” tab and select “DRP Report” and the “DRP Options” screen appears.
4) Assign the fields contained in the data file to those on the “DRP Options” screen. a. Assign the Onhand field to the “Initial Onhand” option. b. Assign the PerCoverage field to the “Min. Period Cov.” option. c. Assign the Reorder Qty field to the “Initial “Reorder Point” option. d. Assign the ROP Flag field to the “UseROP” option. e. Click the selection box for the “Order Lead Time – Same as Safety Stock Lead
Time” option.
5) Click “OK” to save the report parameters and return to the “Reports” screen.
7) Uncheck the “Standard” report and click “Finish!”.
8) When the forecast is complete, click “Done”.
9) A new workbook is created containing the DRP Report. Click on the new workbook to display.

Getting Started with the ForecastX Wizard™ ForecastX Wizard™ Tutorial
Privileged and Confidential. Copyright John Galt Solutions, Inc. Do not duplicate without permission. 13
This report provides all pertinent DRP information needed to make solid planning decisions about your business. It also allows you to understand the effect changes in safety stock and order lead time can have on the overall planning process and inventory levels. The Auto Filter option allows you to customize the data displayed on the report. For example, you can view just the “Turns” for “Pants” only.
1) Click on the “Category” pull down and select the “Pants” option.
2) Click on the “Type” pull down and select the “Turns” option. The report redisplays with only the turns information for pants.
Click the “Auto Filter” button to toggle this feature on or off.

Enhancing the Forecasting Process ForecastX Wizard™ Tutorial
Privileged and Confidential. Copyright John Galt Solutions, Inc. Do not duplicate without permission. 14
Who Is John Galt? For companies addressing their inventory and demand planning processes, John Galt offers comprehensive and cost effective Supply Chain Planning Solutions We provide superior business forecasting accuracy combined with a comprehensive view of the balance between supply and demand by integrating marketing, inventory and sales and operations planning. Together, we can help your company to decrease inventory cost, optimize production, and improve customer service. John Galt offers the ability to effectively realize, manage and understand your demand planning and business forecasting needs. By using our proven methodologies, services and products you will achieve desired results.
John Galt’s User Forum and User Group
John Galt has additional support for its product lines. Check out the Online User Forum and ask your sales representative about joining a User Group in your area:
• Interact with Other John Galt Users Via an Online Forum • Exchange Information and Brainstorm on Best Practices • Share Knowledge and Experiences in Forecasting, Demand Planning, and ForecastX
Products • Maximize your Knowledge and Investment

Enhancing the Forecasting Process ForecastX Wizard™ Tutorial
Privileged and Confidential. Copyright John Galt Solutions, Inc. Do not duplicate without permission. 15
The ForecastX Xpert Toolkit To help you with defining your company’s forecasting process and building your baseline forecast John Galt has created the Forecast Xpert Tool Kit. It includes:
1. The Forecast Wizard 6.0
2. Business Forecasting 2nd Edition by Dr. Barry Keating, University of Notre Dame and Dr. Holt Wilson, Central Michigan University
3. The Forecast Xpert Training Course, a 2 day class either onsite or at John Galt’s Training Facilities.
________________________________________________________________
John Galt’s Atlas Planning Suite Address all of your forecasting, demand planning and S&OP needs with one integrated suite
Key components: Demand Management Engine
Inventory Management
Rough Cut Capacity Planning
Promotional Performance Management,
Sales and Operation Planning
Sarbanes Oxley Reporting
and the Planning Portal.

Enhancing the Forecasting Process ForecastX Wizard™ Tutorial
Privileged and Confidential. Copyright John Galt Solutions, Inc. Do not duplicate without permission. 16
125 South Clark St., Suite 1950 Purchase Order No. _________ Chicago, IL 60603 Phone: 312.701.9026 Fax: 312.701.9033 Purchase Order Quantity Description Unit Price Total
Subtotal
S & H
Taxes
Total
30-Day Money Back Guarantee
Date __________________ Order Number __________________ Sales Representative__________________ Ship Via __________________
Notes/Remarks:
Vendor Name ____________________ Address ________________________ City _________St____Zip______ Phone ________________________
Ship To: Name ________________________________ Address________________________________ City _________________St____Zip______ Phone ________________________________