for personal use only - asx · company. we now have a flatter organisation structure and more...
TRANSCRIPT
1
COCA-COLA AMATIL LIMITED ABN 26 004 139 397
ASX Announcement 30 October 2014
CCA ANNOUNCES RESULTS OF STRATEGIC REVIEW
Coca-Cola Amatil (CCA) is today presenting the results of its strategic review to investors. The strategic review, announced at the Company’s Annual General Meeting in May, was conducted in response to deteriorating market conditions across the Group with the objective of restoring CCA to sustainable earnings growth.
Concrete progress has been made implementing strategies to strengthen the market leadership position of the Company in its two major markets, Australasia and Indonesia:
» CCA and The Coca-Cola Company announce another world-first Coca-Cola campaign in Australia and New Zealand with #colouryoursummer which kick starts a continuous cycle of up-weighted marketing investment aimed at “bringing back the magic” of Coca-Cola;
» The commitment to bringing innovative new products to the market comes to life in April 2015 with the launch of Coke Life in Australia and New Zealand;
» A next-generation digital technology platform will significantly enhance the route-to-market model and deliver a step change in customer service in Australia and New Zealand; and
» In Indonesia, CCA and The Coca-Cola Company have developed a plan to accelerate the growth of the Indonesian business to strengthen the Company’s market leadership position. TCCC will inject US$500 million into CCA Indonesia, taking a 29.4% equity interest in CCA Indonesia. Capex will be up-weighted to ~A$150m pa for the next 3-4 years to fund infrastructure expansion to enable the business to broaden its product offering, develop new consumption occasions and offer a greater range of affordable packages.
CCA’s Group Managing Director, Alison Watkins said, “The strategic review process has been comprehensive, structured and well-resourced and has confirmed our significant strengths and clarified our competitive advantages. We are very pleased to be able to present strong and material plans to our shareholders today which we believe will enable us to return to growth and generate attractive and sustainable returns for our shareholders.
“The plans have been developed reflecting three broad Group strategic themes:
» Strengthening our category leadership position in each of our markets; » Making a step change in our productivity and in-market execution; and » Building better alignment with The Coca-Cola Company.
“In parallel we’ve made changes to our organisational structure, leadership and to our partnership with The Coca-Cola Company. We now have a flatter organisation structure and more accountable Group Leadership Team. Each business has recent new leadership with sound experience and strong values. We have refreshed our vision and values within the organisation to provide a clear sense of direction and purpose to our employee base.”
For
per
sona
l use
onl
y
2
COCA-COLA AMATIL LIMITED ABN 26 004 139 397
The outcomes of the review for each business unit are as follows:
Stabilise earnings in Australasia and return to growth
The Australian beverage business will strengthen its category leadership position by rebuilding brand equity in Coca-Cola and with innovation geared toward “better for you” products in both CSDs and stills. Together with our partner The Coca-Cola Company, we are materially up-weighting marketing investment and developing more targeted recruitment strategies. Our new product development pipeline is strong and well developed with Coke Life, a lower calorie and naturally sweetened Coca-Cola offering, to be launched in April 2015.
We are reengineering the price pack architecture across channels with new frequency and entry level packs aimed at increasing affordability and meeting the desire for smaller packages while providing greater differentiation of packages across the channels. We are rolling out a next-generation digital technology platform which will significantly enhance the route-to-market model and deliver a step change in customer service. At the same time we are restructuring the cost base to deliver ongoing productivity gains and continue to expect to achieve savings of over $100 million over the next three years which will be deployed to fund increased brand building and revenue management initiatives.
We have commenced implementation with the major change initiatives to be in place by mid-2015 and we are confident of returning the business to delivering sustainable earnings growth.
Expand our market presence in Indonesia to realise the market’s potential
Indonesia is an exciting growth market for CCA. With consistent growth in demand from Indonesia’s emerging middle class we now have the opportunity to increase our appeal to a broader range of consumers to ensure we continue to be a leading player in the market over the longer-term. To achieve that position will require significant levels of investment into the market to capitalise on the growing demand.
In order to strengthen our market position, CCA has developed a joint system plan with The Coca-Cola Company to broaden its product offering with new products, new consumption occasions and a greater range of affordable packs. At the same time we will transform our route-to-market model to increase our relevance and availability to the traditional trade and broaden our customer base. We will also be targeting improved productivity and efficiency from our production and logistics by better leveraging our scale.
The Coca-Cola Company will inject US$500 million into CCA Indonesia, taking a 29.4% equity interest in CCA Indonesia and capex will be up-weighted to fund expansion of our production, warehousing and cold drink infrastructure. The objective is for CCAI to be able to self-fund growth from operating cash flows from 2020.
The plan has targets to progressively improve returns on capital over and above CCA Indonesia's cost of capital over the medium term.
Continue to build our alcoholic beverage portfolio in Australia and New Zealand
We will continue to build our alcoholic beverage portfolio by strengthening our product offering and customer servicing capability to the licensed channel. We will do this by leveraging CCA’s large-scale sales, manufacturing and distribution infrastructure assets. We have a number of strong alcoholic beverage brand owner partners as well as the opportunity to develop our CCA brands. Growth needs to be paced and our medium term focus will be to build credibility by winning with our existing partners.
For
per
sona
l use
onl
y
3
COCA-COLA AMATIL LIMITED ABN 26 004 139 397
Invest to restore SPC to a profitable, modern food business
We have a transformation plan to revitalise the brand portfolio and return the business to growth. We have a strong pipeline of innovative fruit-based snack products backed by a disciplined capex plan that will modernise our production facilities and establish a lower cost position.
Financial outlook
CCA is targeting to return to mid single-digit growth in earnings per share over the next few years with no further decline expected after 2014. Ms Watkins said, “We are confident that the combination of revenue and cost initiatives we have underway will restore the business to growth. The pace of recovery will however depend on the success of revenue initiatives in Australia and Indonesian economic factors.
“With free cash flow generation expected to remain strong, the business is well-placed to target a dividend payout ratio of over 80% over the next three years. We expect to maintain a conservative balance sheet position which provides us with flexibility to fund future growth opportunities.”
Capex is expected to be around $310 million pa for the next three years, below the level of Group depreciation. The core Australian and New Zealand business have been well capitalised with a base of high quality existing assets and excess production capacity as a result of high levels of capital investment over the last five years. Indonesian capex is expected to be around A$150 million pa for 3-4 years supported by The Coca-Cola Company’s US$500m capital injection. As previously announced, SPC will invest $100 million over next three years comprising a $78 million CCA investment and $22 million in funding from the Victorian government.
CCA will provide a trading update in early December. For further information, please contact: Analysts Media Kristina Devon Sally Loane Head of Investor Relations Director of Media & Public Affairs Ph: +61 2 9259 6185 Ph: +61 2 9259 6797 [email protected] [email protected]
For
per
sona
l use
onl
y

11
CCA Investor BriefingStrategic Review
30 October 2014
Alison Watkins Group Managing Director
2
Overview
» Comprehensive strategic review focused on generating attractive,
sustainable returns for shareholders
» Plans to restore performance completed and implementation underway
» Heads of agreement executed with The Coca-Cola Company (KO) to
accelerate Indonesia’s growth strategy, under which KO will invest
US$500m in return for a 29.4% equity interest in CCA Indonesia
» Strong balance sheet and cash flow to reward shareholders with strong
dividends plus flexibility to invest in growth in the medium term
For
per
sona
l use
onl
y
3
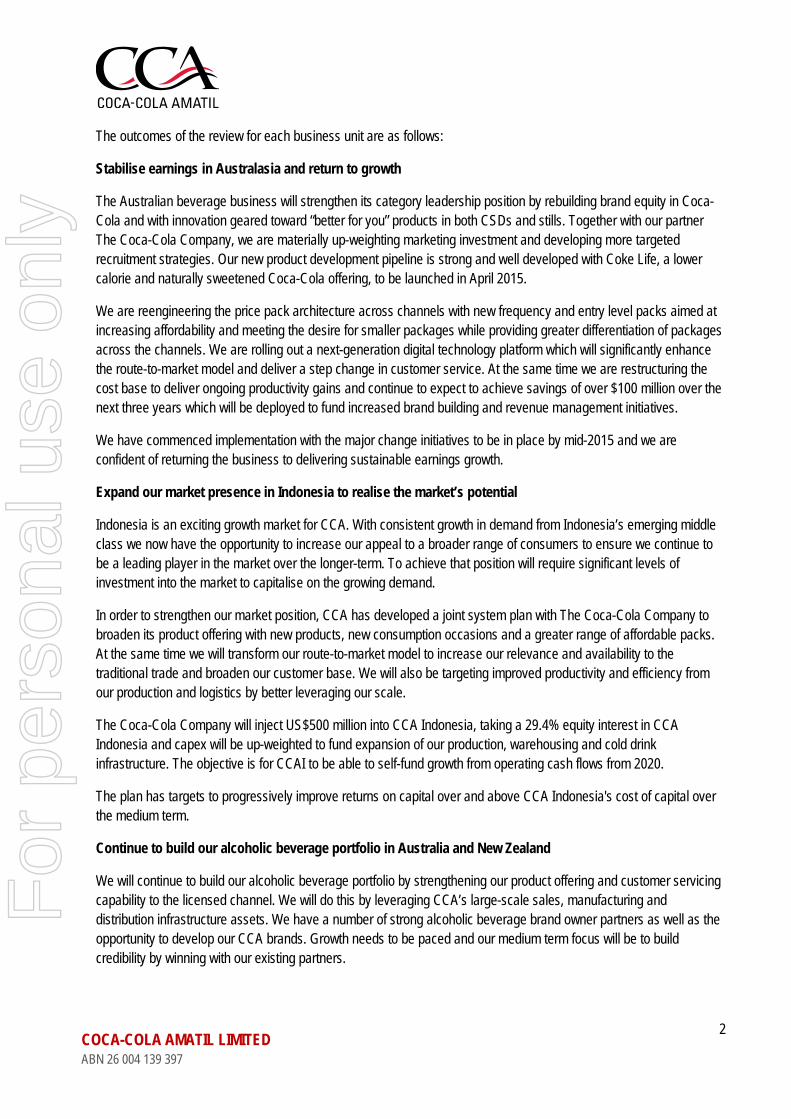
Comprehensive review of corporate structure and business units to ensure CCA returns to generating attractive, sustainable returns for shareholders
» Flatter structure, experienced leadership
» Barry O’Connell - MD Australia – Non-Alcoholic Beverages
» Shane Richardson –MD Alcohol & Coffee
» Chris Litchfield – MD New Zealand & Fiji
» Changes to local KO management team
Strengthened the leadership team
Defined reality for each business unit
Plans to restore performance completed
Long-term portfolio and corporate vision
» Confirmation of strong competitive advantages and sources on long-term value
» However, challenging headwinds for our businesses, particularly Australia & NZ, Indonesia and SPC
» Group strategic themes:
Strengthen category leadership position
Step change in productivity and in-market execution
Better alignment with KO
» Agreed investment plan for Indonesia with KO
» Strong, core developed market franchise territories – Australia & NZ – generating strong free cash flows
» Delivering on developing market potential –Indonesia & PNG
» Incremental growth from Alcohol and SPC
» Strong balance sheet to fund growth opportunities
4
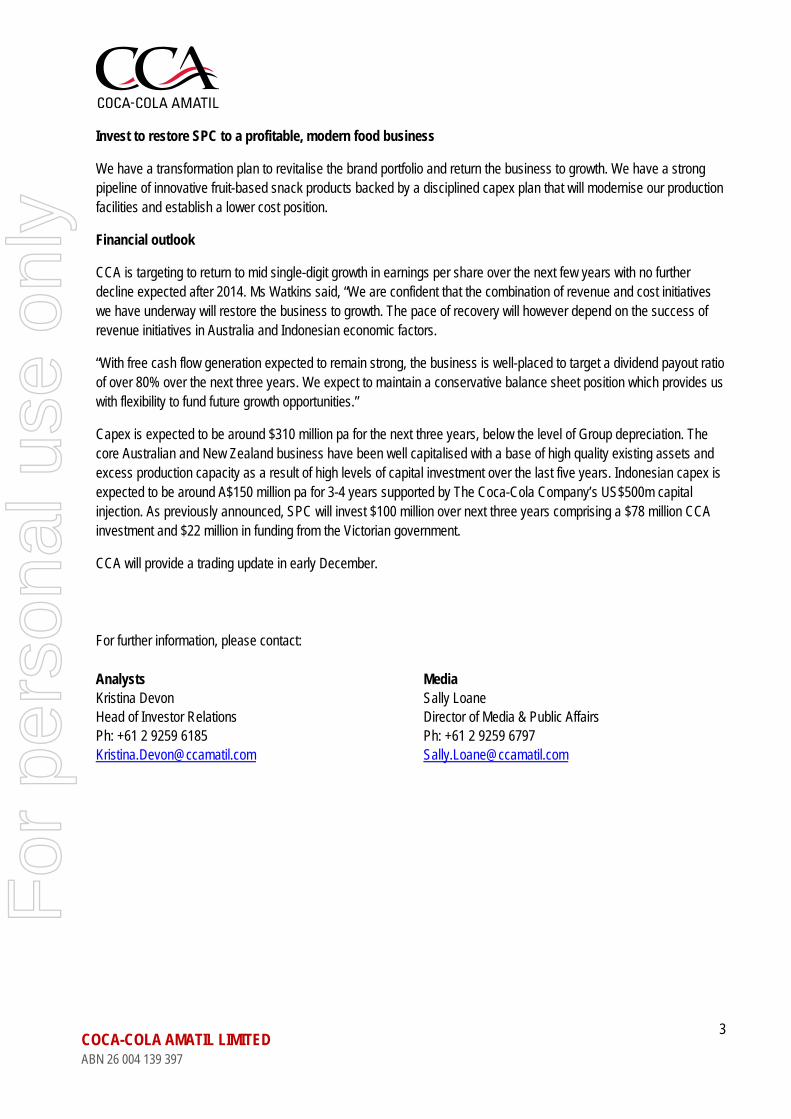
» Coca-Cola franchisee with leading brands in each major NARTD category in
Australia, NZ, Indonesia, PNG, Fiji & Samoa
» Route to market that provides scale and direct reach to many customers,
providing diversification and an ongoing opportunity to add value and own
relationships
» Large-scale, modern, low-cost manufacturing, sales and distribution
capability underpinned by over $1.7bn investment (or 1.7x depreciation)
since 2010 encompassing all major markets
» Growth businesses including Indonesia and Alcohol providing upside in our
portfolio
The strategic review confirms CCA has compelling competitive advantages in each of our markets
For
per
sona
l use
onl
y
5
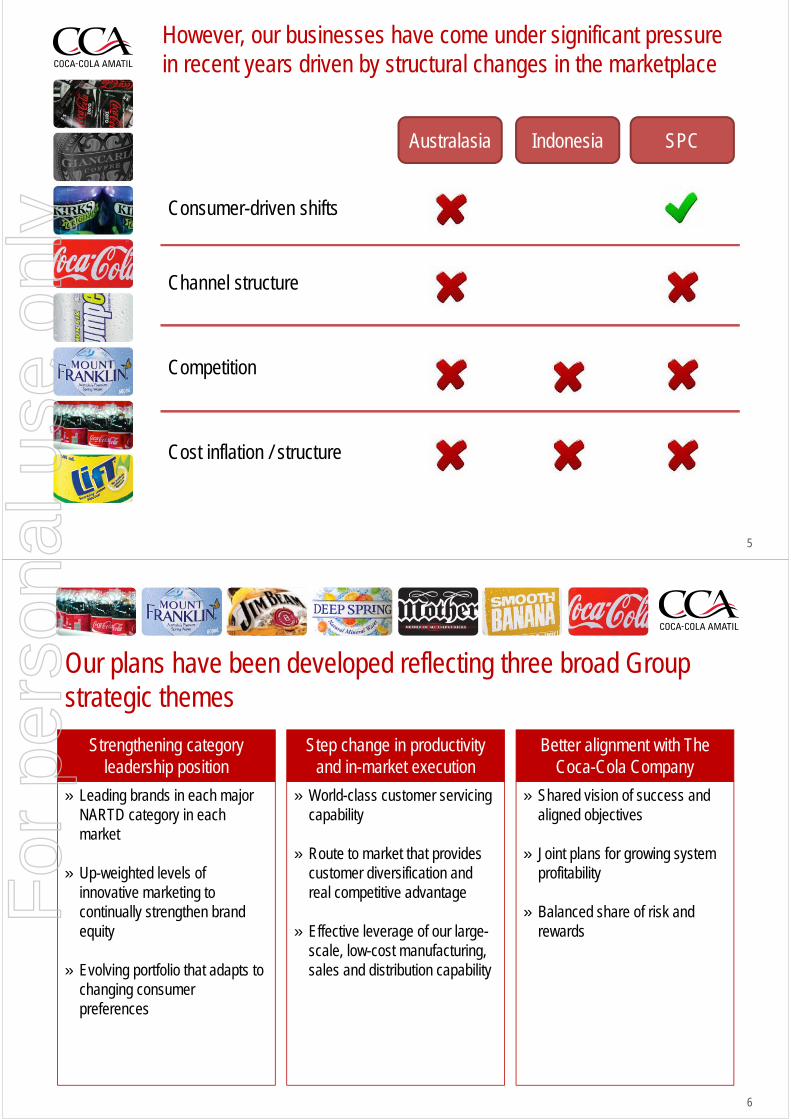
However, our businesses have come under significant pressure in recent years driven by structural changes in the marketplace
Australasia Indonesia SPC
Consumer-driven shifts
Channel structure
Competition
Cost inflation / structure
6
Our plans have been developed reflecting three broad Group strategic themes
Strengthening category leadership position
Step change in productivity and in-market execution
Better alignment with The Coca-Cola Company
» Leading brands in each major NARTD category in each market
» Up-weighted levels of innovative marketing to continually strengthen brand equity
» Evolving portfolio that adapts to changing consumer preferences
» World-class customer servicing capability
» Route to market that provides customer diversification and real competitive advantage
» Effective leverage of our large-scale, low-cost manufacturing, sales and distribution capability
» Shared vision of success and aligned objectives
» Joint plans for growing system profitability
» Balanced share of risk and rewards
For
per
sona
l use
onl
y
7
Our plans will strengthen the competitive position of each business with implementation underway
Australasia – Stabilise earnings and return to growth
» Strengthen our brand portfolio to increase our appeal to a wider range of consumers
» Optimise our revenue management by optimising price, pack architecture and strengthening our promotional management
» Redesign the route to market model to improve cost to serve and better leverage our scale
» Restructure our cost base to deliver ongoing productivity gains
» New Zealand – deliver steady earnings and volume growth
Indonesia – Expand our market presence in Indonesia to realise the market’s potential
» Improve product availability and affordability across different channels
» Build brand strength and channel relevance through multi-category portfolio
» Drive cost competitiveness from operating leverage, transformed route-to-market and reduced complexity
» Agreement for a US$500m equity investment by KO into CCA Indonesia to accelerate growth plan with aligned volume and return targets
Alcohol – Continue to build our alcoholic beverage portfolio in Australia and New Zealand
» Strengthen our product offering and customer servicing capability to the licensed channel by leveraging CCA’s large-scale sales, manufacturing and distribution infrastructure assets
SPC – Invest to restore SPC to a profitable, modern food business
» Strong transformation plan to revitalise the brand portfolio and return the business to growth
8
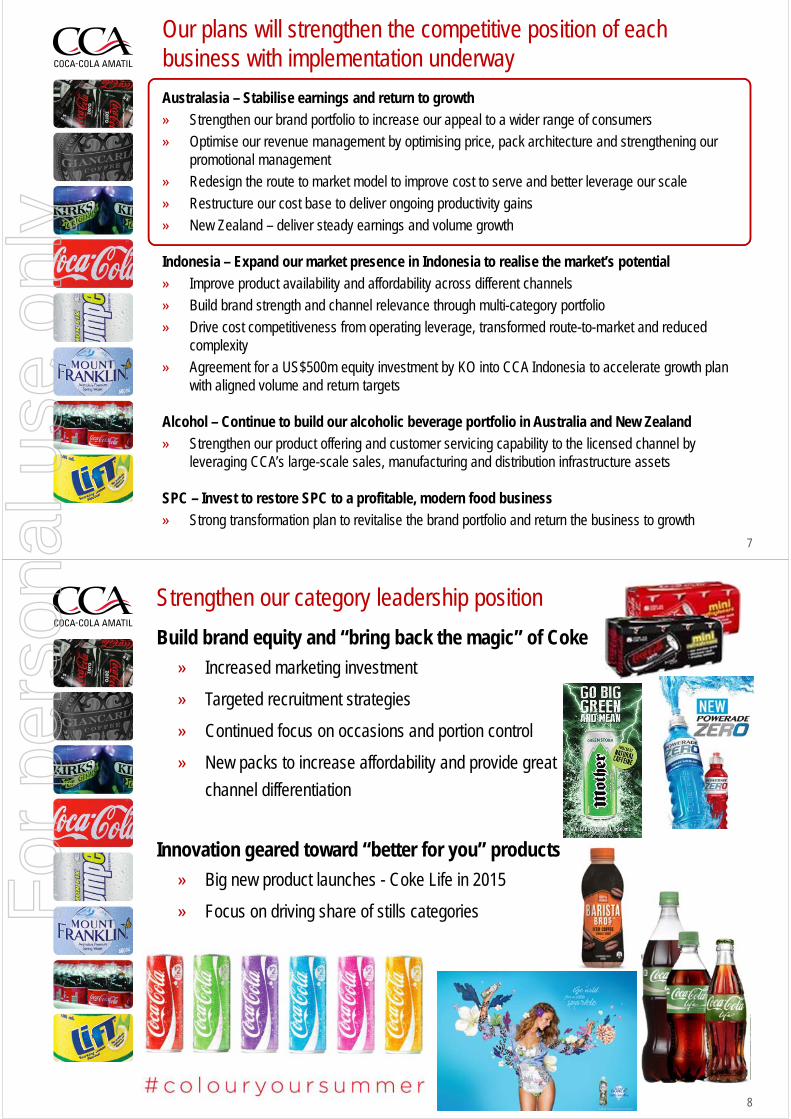
Strengthen our category leadership position
Build brand equity and “bring back the magic” of Coke
» Increased marketing investment
» Targeted recruitment strategies
» Continued focus on occasions and portion control
» New packs to increase affordability and provide great
channel differentiation
Innovation geared toward “better for you” products
» Big new product launches - Coke Life in 2015
» Focus on driving share of stills categoriesFor
per
sona
l use
onl
y
9
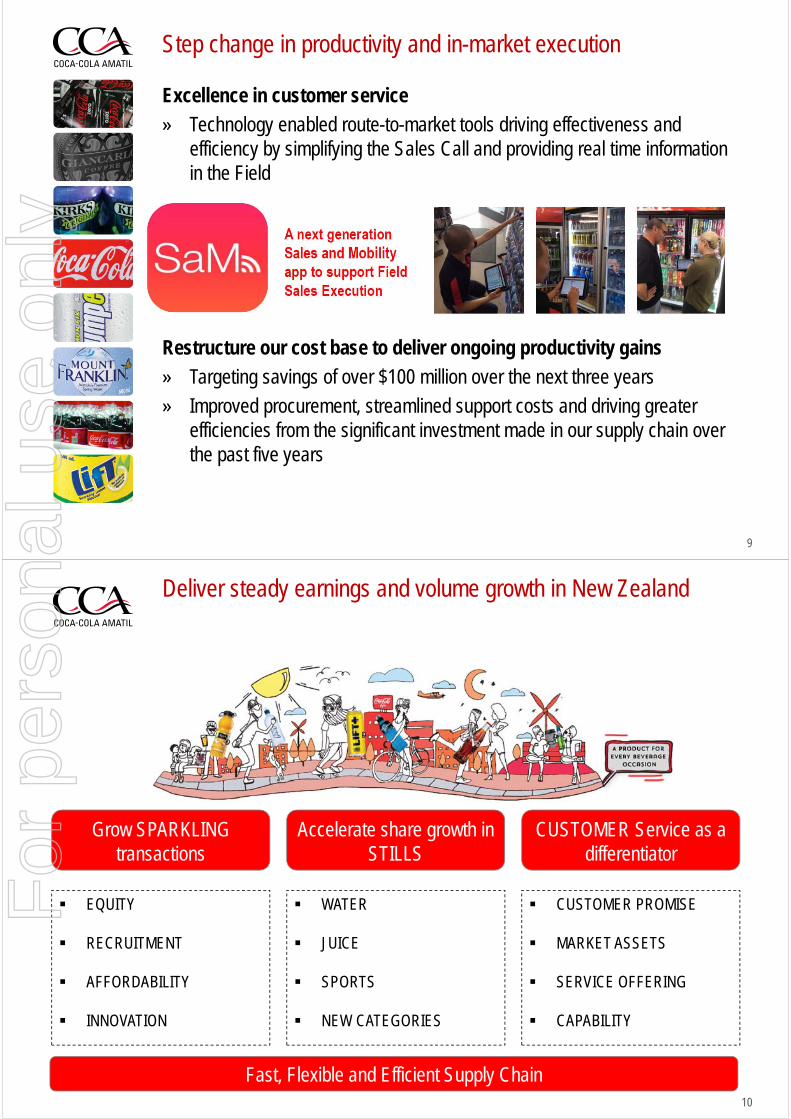
Step change in productivity and in-market execution
Excellence in customer service
» Technology enabled route-to-market tools driving effectiveness and efficiency by simplifying the Sales Call and providing real time information in the Field
Restructure our cost base to deliver ongoing productivity gains
» Targeting savings of over $100 million over the next three years
» Improved procurement, streamlined support costs and driving greater efficiencies from the significant investment made in our supply chain over the past five years
10
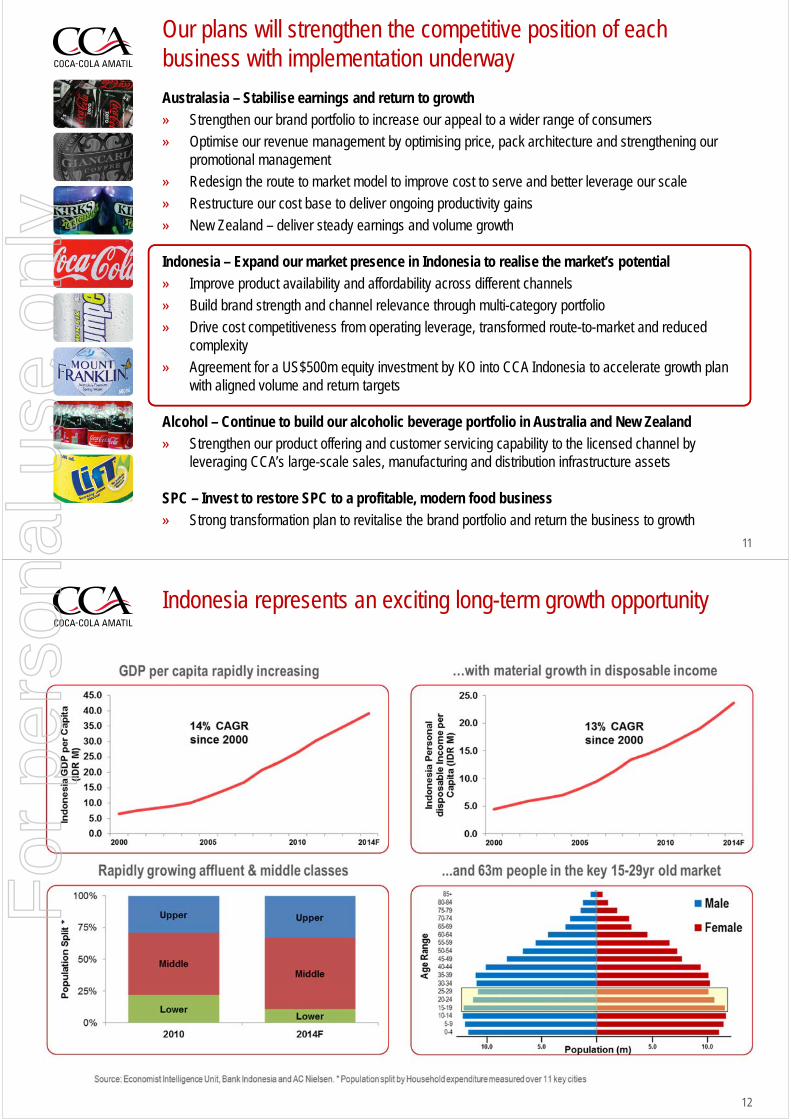
Deliver steady earnings and volume growth in New Zealand
Grow SPARKLING transactions
Accelerate share growth in STILLS
CUSTOMER Service as a differentiator
EQUITY
RECRUITMENT
AFFORDABILITY
INNOVATION
WATER
JUICE
SPORTS
NEW CATEGORIES
CUSTOMER PROMISE
MARKET ASSETS
SERVICE OFFERING
CAPABILITY
Fast, Flexible and Efficient Supply Chain
For
per
sona
l use
onl
y
11
Our plans will strengthen the competitive position of each business with implementation underway
Australasia – Stabilise earnings and return to growth
» Strengthen our brand portfolio to increase our appeal to a wider range of consumers
» Optimise our revenue management by optimising price, pack architecture and strengthening our promotional management
» Redesign the route to market model to improve cost to serve and better leverage our scale
» Restructure our cost base to deliver ongoing productivity gains
» New Zealand – deliver steady earnings and volume growth
Indonesia – Expand our market presence in Indonesia to realise the market’s potential
» Improve product availability and affordability across different channels
» Build brand strength and channel relevance through multi-category portfolio
» Drive cost competitiveness from operating leverage, transformed route-to-market and reduced complexity
» Agreement for a US$500m equity investment by KO into CCA Indonesia to accelerate growth plan with aligned volume and return targets
Alcohol – Continue to build our alcoholic beverage portfolio in Australia and New Zealand
» Strengthen our product offering and customer servicing capability to the licensed channel by leveraging CCA’s large-scale sales, manufacturing and distribution infrastructure assets
SPC – Invest to restore SPC to a profitable, modern food business
» Strong transformation plan to revitalise the brand portfolio and return the business to growth
12
Indonesia represents an exciting long-term growth opportunity
For
per
sona
l use
onl
y

13
Industry dynamics have changed with strong and consistent growth in demand from Indonesia’s emerging middle class
CCA’s strategy over the past 5-6 years has been shifting focus towards the wealthier income demographic
» Rapid emergence of modern foodstore retailing during the early to mid 2000s provided CCA with a platform to engage with the wealthier income demographic (representing 20-40m consumers). CCA benefitted from selling higher margin products to less price sensitive consumers
With consistent growth in demand from Indonesia’s emerging middle class we have the opportunity to increase our appeal to a broader range of consumers to ensure we continue to be a leading player in the market
» Strong GDP growth has seen the emergence of new competitors and stimulated strong demand for beverages in the middle income demographic (representing >100m consumers)
» We have tested the market by launching some lower priced packs – cups, multi-serve PET, smaller pack sizes and other products – with demand exceeding expectations
» However, to realise the opportunity will require up-weighted levels of capital investment over the medium term
14
Joint system plan to strengthen Indonesian competitive position and drive attractive shareholder returns
CCA has developed a plan with KO to expand our offering across the market to target these consumers. KO will inject US$500m equity into CCA Indonesia (CCAI) and capex will be up-weighted to ~A$150m pa for the next 3-4 years to fund infrastructure expansion
» Improve product availability and affordability across different channels
» Build brand strength and channel relevance through multi-category portfolio
» Drive cost competitiveness from operating leverage, transformed route-to-market and reduced complexity
» Accelerated capex for production, warehousing and cold drink infrastructure of around A$150m pa for around the next 3-4 years supported by KO US$500m equity injection
» Achieves closer alignment of interests between CCA and KO through joint ownership and the plan includes specific targets for:
» Targeting a strong market position in non-alcoholic ready to drink beverages and a market leadership position in sparkling beverages; and
» Generating returns progressively to reach the cost of capital for CCAI by 2020.
For
per
sona
l use
onl
y

15
Transaction overview
» KO to invest US$500 million in new equity in CCA Indonesia which provides financial headroom to implement the growth plan
» CCAI to accelerate investment in production, warehousing and cold drink infrastructure in Indonesia for around the next 3-4 years
» CCAI targeting to be able to self-fund growth from operating cash flows from 2020
» KO to take 29.4% equity interest in CCA Indonesia with CCA to retain 70.6% ownership as well as management control
» KO investment in CCA Indonesia implies enterprise valuation of A$1.6 billion (US$1.38 billion)1
» New Board to be formed with majority representation from CCA, including the Chairman
» Certain reserve matters requiring unanimous Board approval include changes to the objectives or plan
» CCA to appoint Managing Director, subject to KO consent right
» Other conditions typical of a joint ownership structure, including pre-emptive rights and rights regarding changes to share capital
Notes:
1. Based on estimated CCA Indonesia net debt of US$180 million at 31 December 2014
16
Deal specifics – next steps
Process to completion
» Conditions precedent to completion include
» CCA shareholder approval
» KO Board approval
» Indonesian regulatory approvals
» An Extraordinary General Meeting of CCA shareholders will be called for February
2015
» KO excluded from voting on the relevant resolution
» Shareholders to be provided with a notice of meeting, explanatory memorandum and
independent expert's report setting out the key considerations for CCA shareholdersFor
per
sona
l use
onl
y
17
Our plans will strengthen the competitive position of each business with implementation underway
Australasia – Stabilise earnings and return to growth
» Strengthen our brand portfolio to increase our appeal to a wider range of consumers
» Optimise our revenue management by optimising price, pack architecture and strengthening our promotional management
» Redesign the route to market model to improve cost to serve and better leverage our scale
» Restructure our cost base to deliver ongoing productivity gains
» New Zealand – deliver steady earnings and volume growth
Indonesia – Expand our market presence in Indonesia to realise the market’s potential
» Improve product availability and affordability across different channels
» Build brand strength and channel relevance through multi-category portfolio
» Drive cost competitiveness from operating leverage, transformed route-to-market and reduced complexity
» Agreement for a US$500m equity investment by KO into CCA Indonesia to accelerate growth plan with aligned volume and return targets
Alcohol – Continue to build our alcoholic beverage portfolio in Australia and New Zealand
» Strengthen our product offering and customer servicing capability to the licensed channel by leveraging CCA’s large-scale sales, manufacturing and distribution infrastructure assets
SPC – Invest to restore SPC to a profitable, modern food business
» Strong transformation plan to revitalise the brand portfolio and return the business to growth
18
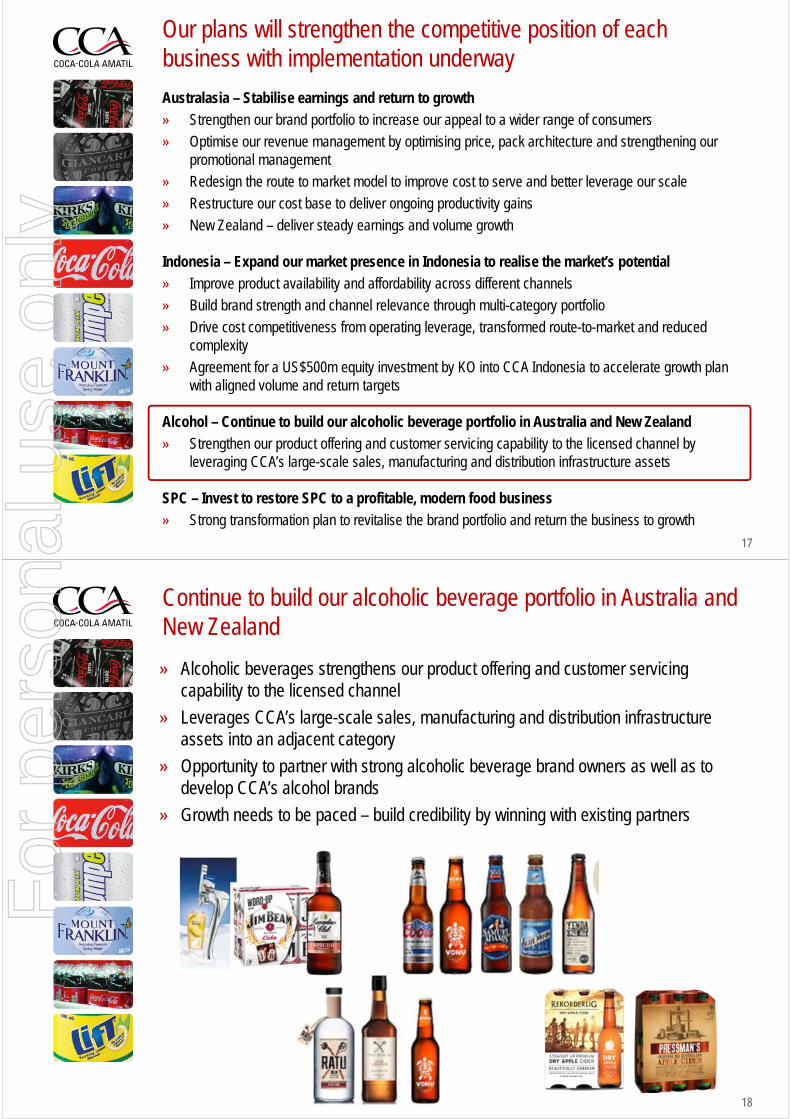
Continue to build our alcoholic beverage portfolio in Australia and New Zealand
» Alcoholic beverages strengthens our product offering and customer servicing capability to the licensed channel
» Leverages CCA’s large-scale sales, manufacturing and distribution infrastructure assets into an adjacent category
» Opportunity to partner with strong alcoholic beverage brand owners as well as to develop CCA’s alcohol brands
» Growth needs to be paced – build credibility by winning with existing partners
For
per
sona
l use
onl
y
19
Our plans will strengthen the competitive position of each business with implementation underway
Australasia – Stabilise earnings and return to growth
» Strengthen our brand portfolio to increase our appeal to a wider range of consumers
» Optimise our revenue management by optimising price, pack architecture and strengthening our promotional management
» Redesign the route to market model to improve cost to serve and better leverage our scale
» Restructure our cost base to deliver ongoing productivity gains
» New Zealand – deliver steady earnings and volume growth
Indonesia – Expand our market presence in Indonesia to realise the market’s potential
» Improve product availability and affordability across different channels
» Build brand strength and channel relevance through multi-category portfolio
» Drive cost competitiveness from operating leverage, transformed route-to-market and reduced complexity
» Agreement for a US$500m equity investment by KO into CCA Indonesia to accelerate growth plan with aligned volume and return targets
Alcohol – Continue to build our alcoholic beverage portfolio in Australia and New Zealand
» Strengthen our product offering and customer servicing capability to the licensed channel by leveraging CCA’s large-scale sales, manufacturing and distribution infrastructure assets
SPC – Invest to restore SPC to a profitable, modern food business
» Strong transformation plan to revitalise the brand portfolio and return the business to growth
20
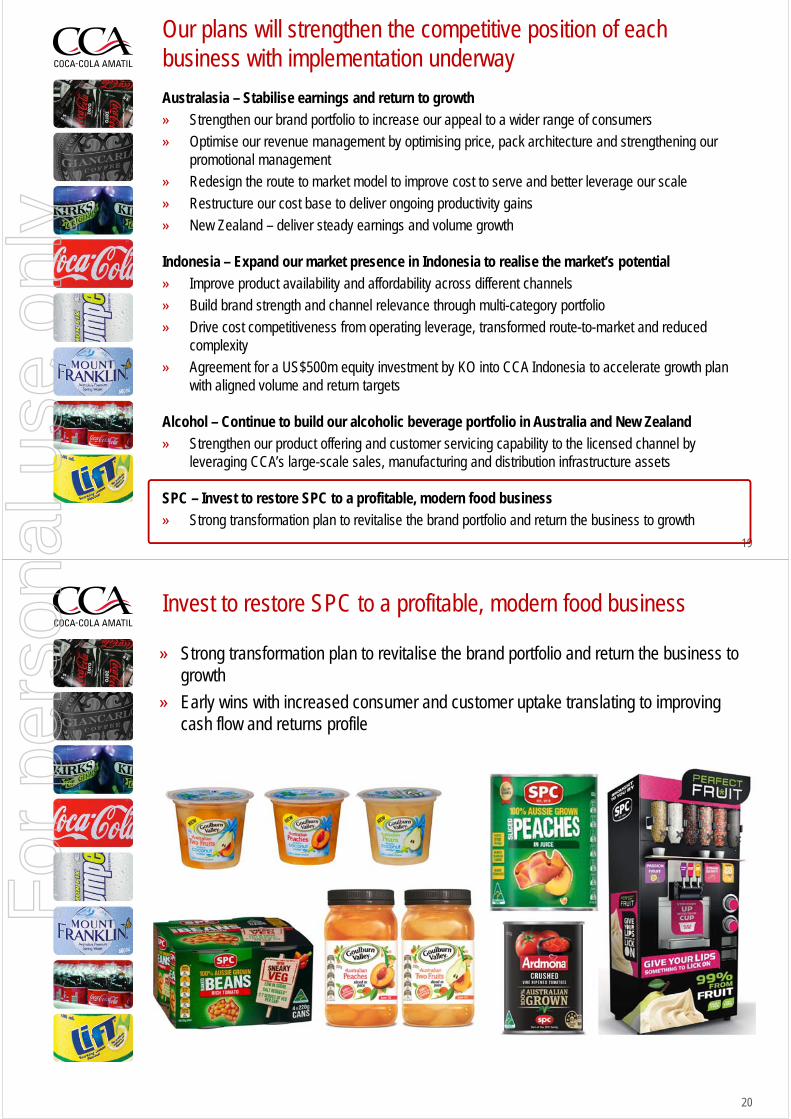
Invest to restore SPC to a profitable, modern food business
» Strong transformation plan to revitalise the brand portfolio and return the business to growth
» Early wins with increased consumer and customer uptake translating to improving cash flow and returns profile
For
per
sona
l use
onl
y
Our vision for CCA gives us a clear and optimistic picture of success
22
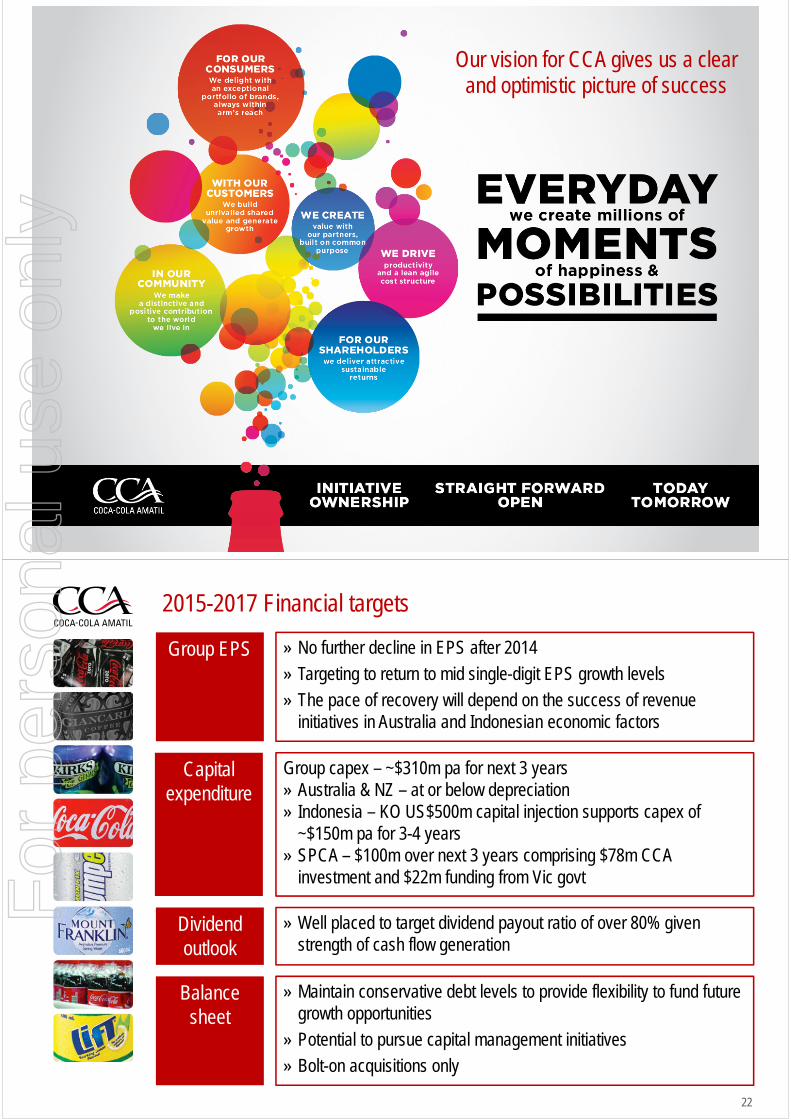
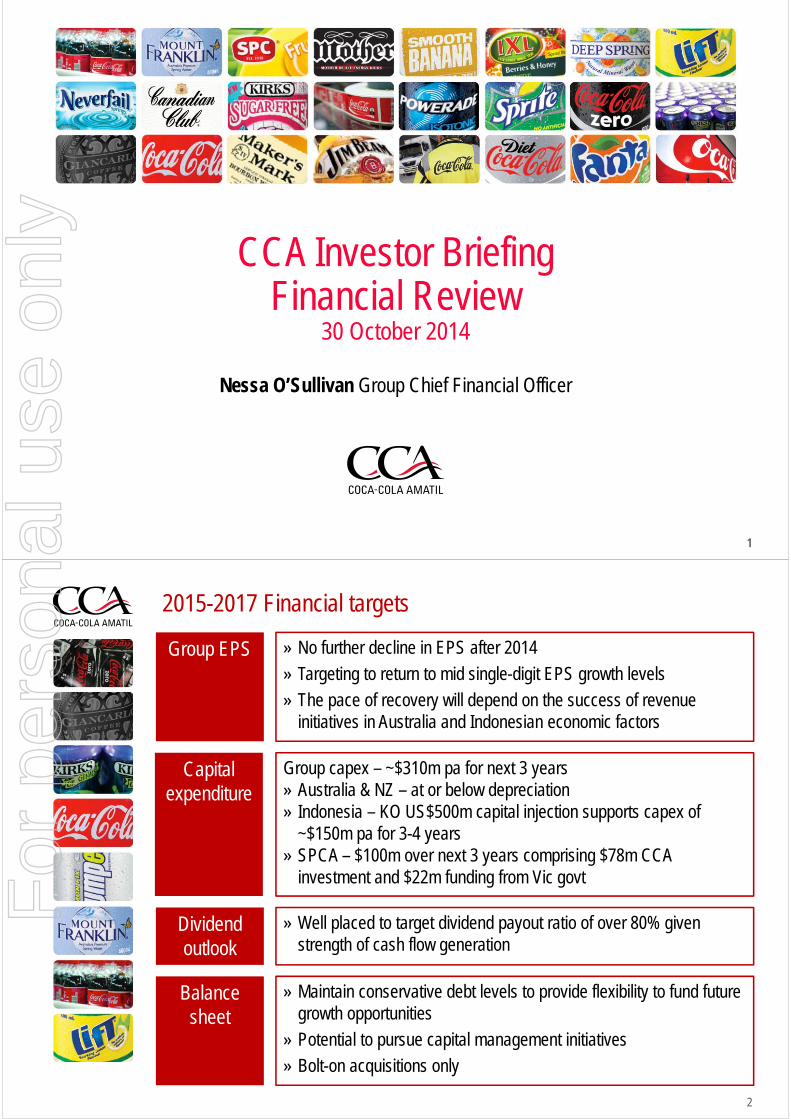
2015-2017 Financial targets
Group EPS
Capital expenditure
» No further decline in EPS after 2014
» Targeting to return to mid single-digit EPS growth levels
» The pace of recovery will depend on the success of revenue initiatives in Australia and Indonesian economic factors
Group capex – ~$310m pa for next 3 years» Australia & NZ – at or below depreciation» Indonesia – KO US$500m capital injection supports capex of
~$150m pa for 3-4 years» SPCA – $100m over next 3 years comprising $78m CCA
investment and $22m funding from Vic govt
Dividend outlook
» Well placed to target dividend payout ratio of over 80% given strength of cash flow generation
Balance sheet
» Maintain conservative debt levels to provide flexibility to fund future growth opportunities
» Potential to pursue capital management initiatives
» Bolt-on acquisitions only
For
per
sona
l use
onl
y
2323
DisclaimerCCA advises that these presentation slides contain forward looking statements which may be subject to significant uncertainties outside of CCA’s control.
No representation is made as to the accuracy or reliability of forward looking statements or the assumptions on which they are based.
Actual future events may vary from these forward looking statements and you are cautioned not to place undue reliance on any forward looking statement.
For
per
sona
l use
onl
y
11
Nessa O’Sullivan Group Chief Financial Officer
CCA Investor BriefingFinancial Review
30 October 2014
2
2015-2017 Financial targets
Group EPS
Capital expenditure
» No further decline in EPS after 2014
» Targeting to return to mid single-digit EPS growth levels
» The pace of recovery will depend on the success of revenue initiatives in Australia and Indonesian economic factors
Group capex – ~$310m pa for next 3 years» Australia & NZ – at or below depreciation» Indonesia – KO US$500m capital injection supports capex of
~$150m pa for 3-4 years» SPCA – $100m over next 3 years comprising $78m CCA
investment and $22m funding from Vic govt
Dividend outlook
» Well placed to target dividend payout ratio of over 80% given strength of cash flow generation
Balance sheet
» Maintain conservative debt levels to provide flexibility to fund future growth opportunities
» Potential to pursue capital management initiatives
» Bolt-on acquisitions only
For
per
sona
l use
onl
y
3
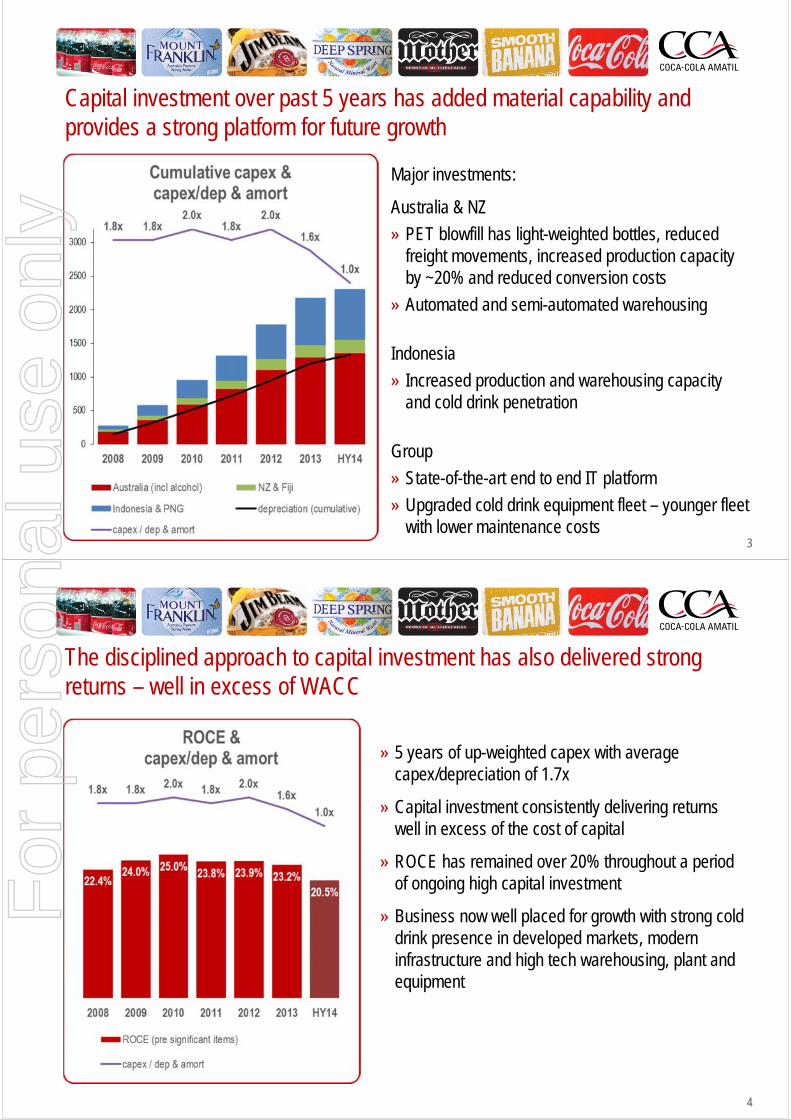
Capital investment over past 5 years has added material capability and provides a strong platform for future growth
Major investments:
Australia & NZ
» PET blowfill has light-weighted bottles, reduced freight movements, increased production capacity by ~20% and reduced conversion costs
» Automated and semi-automated warehousing
Indonesia
» Increased production and warehousing capacity and cold drink penetration
Group
» State-of-the-art end to end IT platform
» Upgraded cold drink equipment fleet – younger fleet with lower maintenance costs
4
The disciplined approach to capital investment has also delivered strong returns – well in excess of WACC
» 5 years of up-weighted capex with average capex/depreciation of 1.7x
» Capital investment consistently delivering returns well in excess of the cost of capital
» ROCE has remained over 20% throughout a period of ongoing high capital investment
» Business now well placed for growth with strong cold drink presence in developed markets, modern infrastructure and high tech warehousing, plant and equipment
For
per
sona
l use
onl
y
5
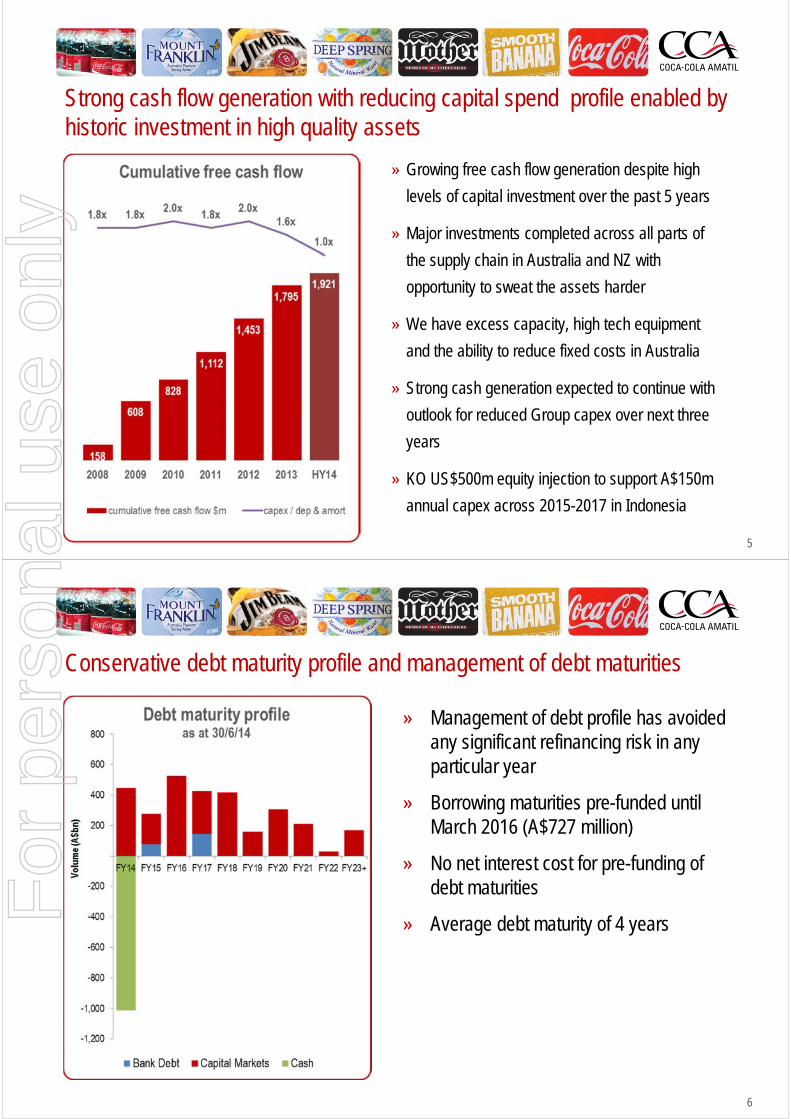
Strong cash flow generation with reducing capital spend profile enabled by historic investment in high quality assets
» Growing free cash flow generation despite high
levels of capital investment over the past 5 years
» Major investments completed across all parts of
the supply chain in Australia and NZ with
opportunity to sweat the assets harder
» We have excess capacity, high tech equipment
and the ability to reduce fixed costs in Australia
» Strong cash generation expected to continue with
outlook for reduced Group capex over next three
years
» KO US$500m equity injection to support A$150m
annual capex across 2015-2017 in Indonesia
6
Conservative debt maturity profile and management of debt maturities
» Management of debt profile has avoided any significant refinancing risk in any particular year
» Borrowing maturities pre-funded until March 2016 (A$727 million)
» No net interest cost for pre-funding of debt maturities
» Average debt maturity of 4 yearsFor
per
sona
l use
onl
y
7
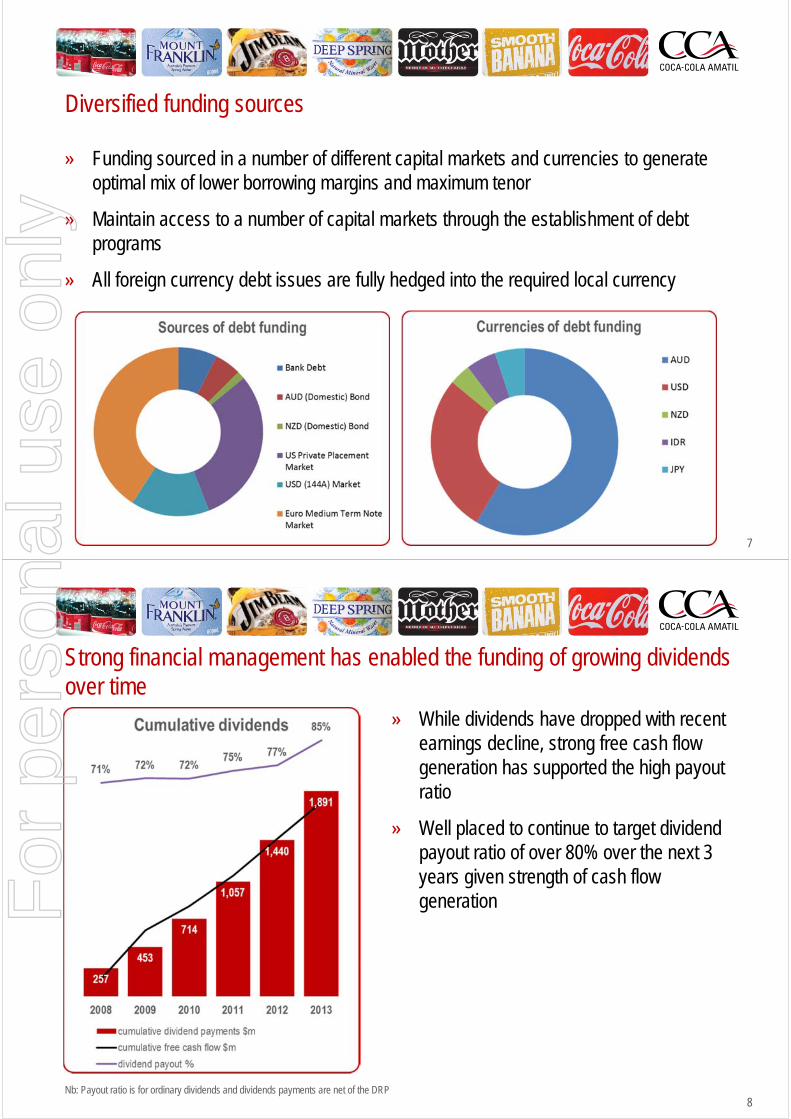
Diversified funding sources
» Funding sourced in a number of different capital markets and currencies to generate optimal mix of lower borrowing margins and maximum tenor
» Maintain access to a number of capital markets through the establishment of debt programs
» All foreign currency debt issues are fully hedged into the required local currency
8
Strong financial management has enabled the funding of growing dividends over time
» While dividends have dropped with recent earnings decline, strong free cash flow generation has supported the high payout ratio
» Well placed to continue to target dividend payout ratio of over 80% over the next 3 years given strength of cash flow generation
Nb: Payout ratio is for ordinary dividends and dividends payments are net of the DRP
For
per
sona
l use
onl
y
9
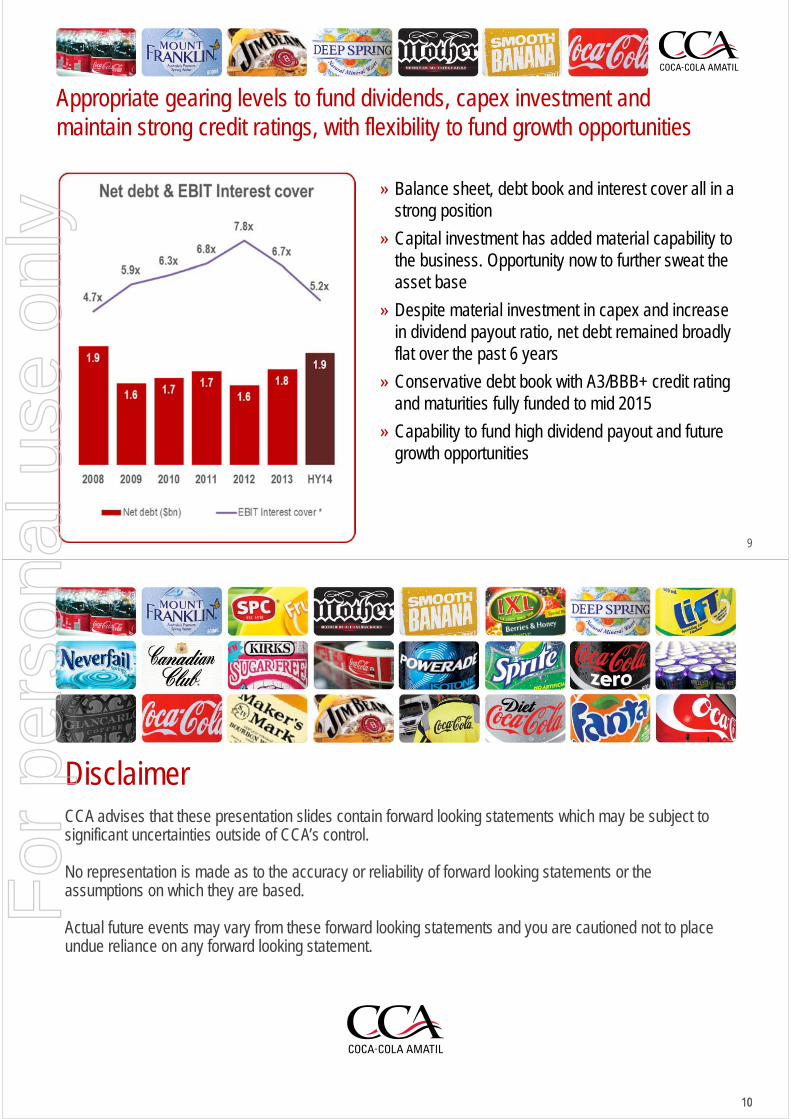
Appropriate gearing levels to fund dividends, capex investment and maintain strong credit ratings, with flexibility to fund growth opportunities
» Balance sheet, debt book and interest cover all in a strong position
» Capital investment has added material capability to the business. Opportunity now to further sweat the asset base
» Despite material investment in capex and increase in dividend payout ratio, net debt remained broadly flat over the past 6 years
» Conservative debt book with A3/BBB+ credit rating and maturities fully funded to mid 2015
» Capability to fund high dividend payout and future growth opportunities
1010
DisclaimerCCA advises that these presentation slides contain forward looking statements which may be subject to significant uncertainties outside of CCA’s control.
No representation is made as to the accuracy or reliability of forward looking statements or the assumptions on which they are based.
Actual future events may vary from these forward looking statements and you are cautioned not to place undue reliance on any forward looking statement.
For
per
sona
l use
onl
y
11
CCA Investor BriefingStrategic Review
30 October 2014
Barry O’Connell Managing Director – Australian Beverages
There are no silver bullets but rather a strategic plan based on “doing what’s right for the business” over the long term
• Consumer driven and customer focused
• Intelligent cost out, reallocated against growth prioritise
• Building organisational capability, culture & engagement
Addressing fundamental structural challenges, stabilising earnings & setting CCA up for sustainable growth
Addressing fundamental structural challenges, stabilising earnings & setting CCA up for sustainable growth
Perspective
Leveraging our significant strengths
Recognising the need move quickly and consider other options
Extensive change management approach
• Scale & nimbleness
• Different business models
• Portfolio & brands
• Infrastructure (Manufacturing, RTM & Chilled Equipment)
• People & customer relationships
• Aligning stakeholders around our journey
• Establish a professional Project Management Office
• Continuous focus on engagement
2
For
per
sona
l use
onl
y
How we are building for the future
• Concluded Beverage Landscape leading to a well considered and focused strategy around new beverage category options
• Formation of dedicated revenue management team
• Introduction of new suite of tools for trade spend management – grocery & route, trading terms & conditions & compliance
• Building an unrivalled competence in RTM with technology as a cornerstone enabling greater targeting, increased and more cost effective customer interactions
• RTM as an ongoing discipline
• Establishing strong cost culture, continuous benchmarking as a way of life and building a lean and agile business model
It’s not just what we are doing today but also about how we are laying the foundations for tomorrow
It’s not just what we are doing today but also about how we are laying the foundations for tomorrow
Perspective
3
What we are doing today
• Re-engaging with consumers via Up-weighted brand investment and cut through advertising & NPD in existing categories
• Optimising our revenue management by maximising opportunities in price, pack architecture and by strengthening our promotional management
• Redesigning our route to market model to improve cost service and better leverage our scale
• Re-allocation of redundant costs to drive growth
4
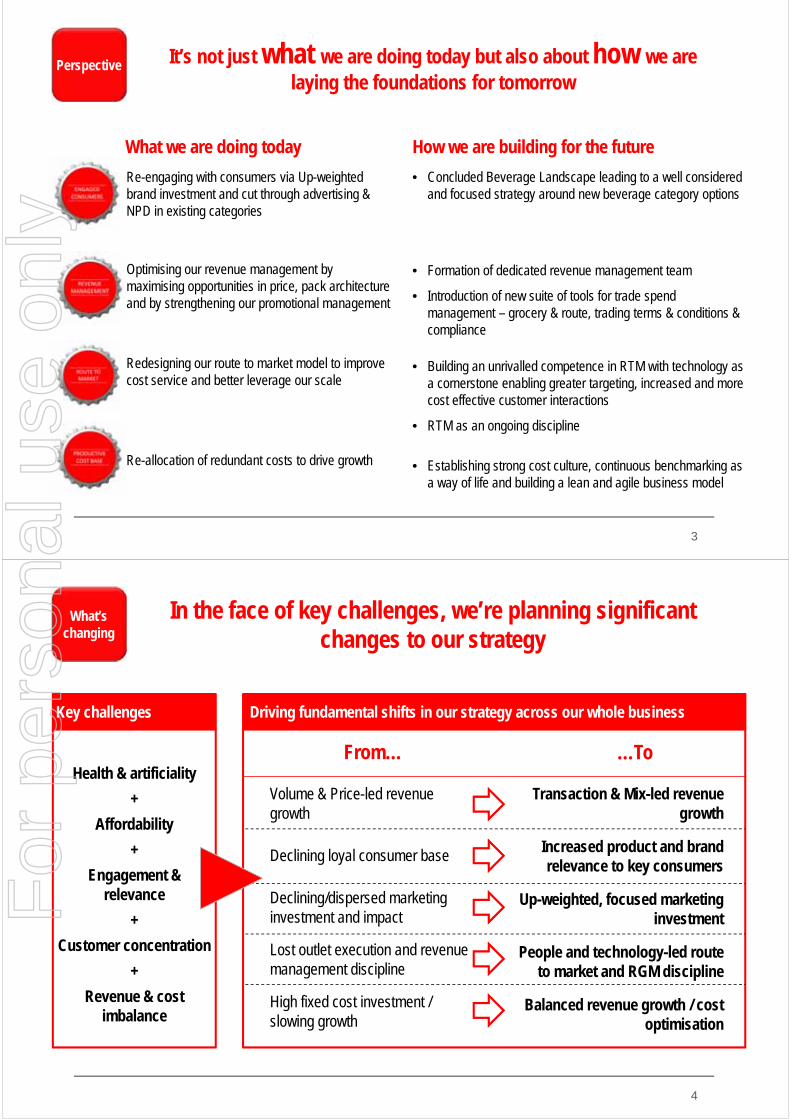
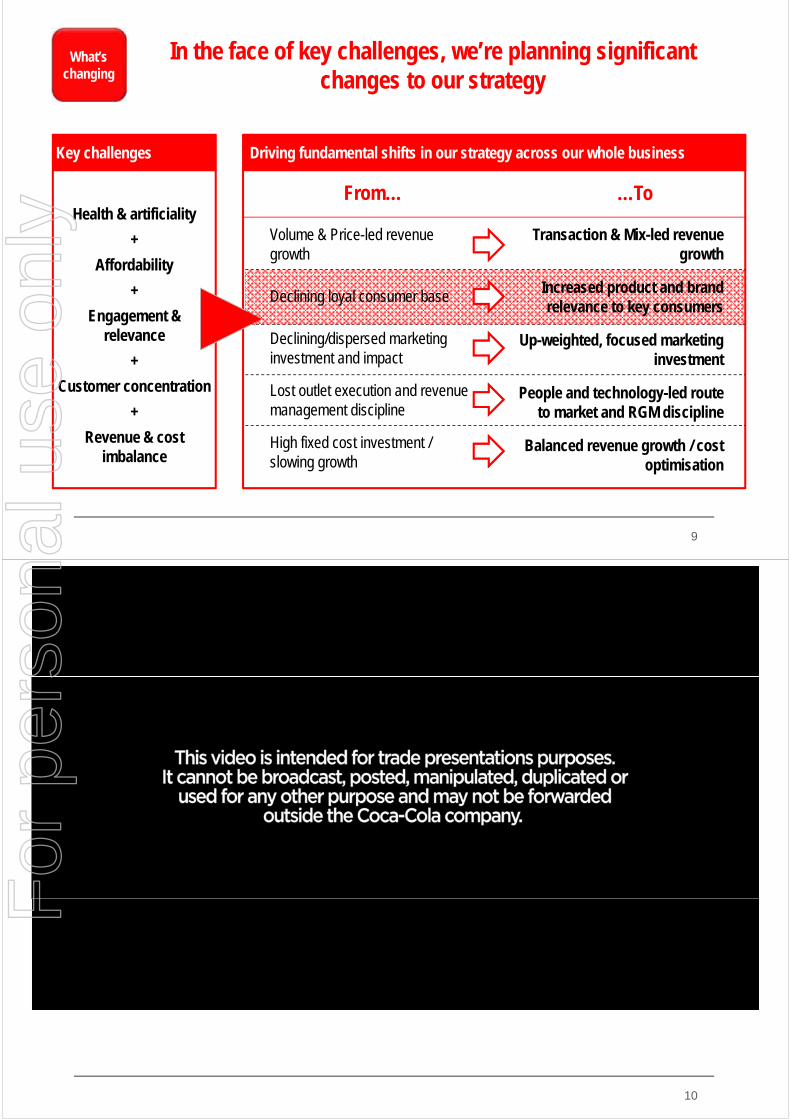
In the face of key challenges, we’re planning significant changes to our strategy
In the face of key challenges, we’re planning significant changes to our strategy
What’s changing
Key challenges
Health & artificiality
+
Affordability
+
Engagement &relevance
+
Customer concentration
+
Revenue & cost imbalance
Driving fundamental shifts in our strategy across our whole business
Volume & Price-led revenue growth
Declining loyal consumer base
Declining/dispersed marketing investment and impact
Lost outlet execution and revenue management discipline
High fixed cost investment / slowing growth
From… …To
Transaction & Mix-led revenue growth
Increased product and brand relevance to key consumers
Up-weighted, focused marketing investment
People and technology-led route to market and RGM discipline
Balanced revenue growth / cost optimisation
For
per
sona
l use
onl
y
5
In the face of key challenges, we’re planning significant changes to our strategy
In the face of key challenges, we’re planning significant changes to our strategy
What’s changing
Key challenges
Health & artificiality
+
Affordability
+
Engagement &relevance
+
Customer concentration
+
Revenue & cost imbalance
Driving fundamental shifts in our strategy across our whole business
Declining loyal consumer base
Declining/dispersed marketing investment and impact
Lost outlet execution and revenue management discipline
High fixed cost investment / slowing growth
From… …To
Increased product and brand relevance to key consumers
Up-weighted, focused marketing investment
People and technology-led route to market and RGM discipline
Balanced revenue growth / cost optimisation
Volume & Price-led revenue growth
Transaction & Mix-led revenue growth
6
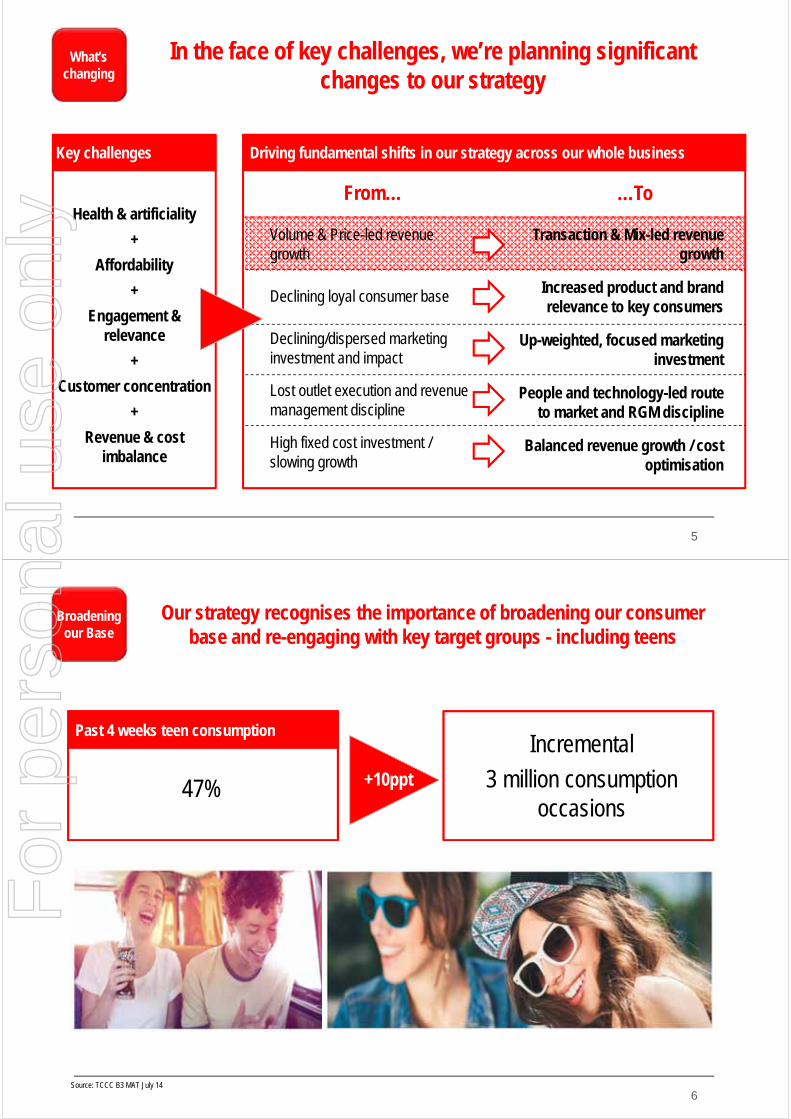
Our strategy recognises the importance of broadening our consumer base and re-engaging with key target groups - including teens
Our strategy recognises the importance of broadening our consumer base and re-engaging with key target groups - including teens
Broadening our Base
Past 4 weeks teen consumption
Source: TCCC B3 MAT July 14
Incremental
3 million consumption occasions
47% +10ppt
For
per
sona
l use
onl
y
7
A focus on new entry and frequency packs using proprietary formats and targeting magic price points
A focus on new entry and frequency packs using proprietary formats and targeting magic price points
A focus on transactions
250ml can entry pack
Small size PET entry pack
Mid-size PET frequency pack
• Extensive consumer research to determine optimal pack/price.
• Launch of new 250ml entry pack at single gold coin price point
• Further in-market trials of several options, starting next month.
• A focus on entry (portion size & affordability) and frequency packs
• Next step planned for mid 2015 marked by 100year anniversary of the contour bottle
8
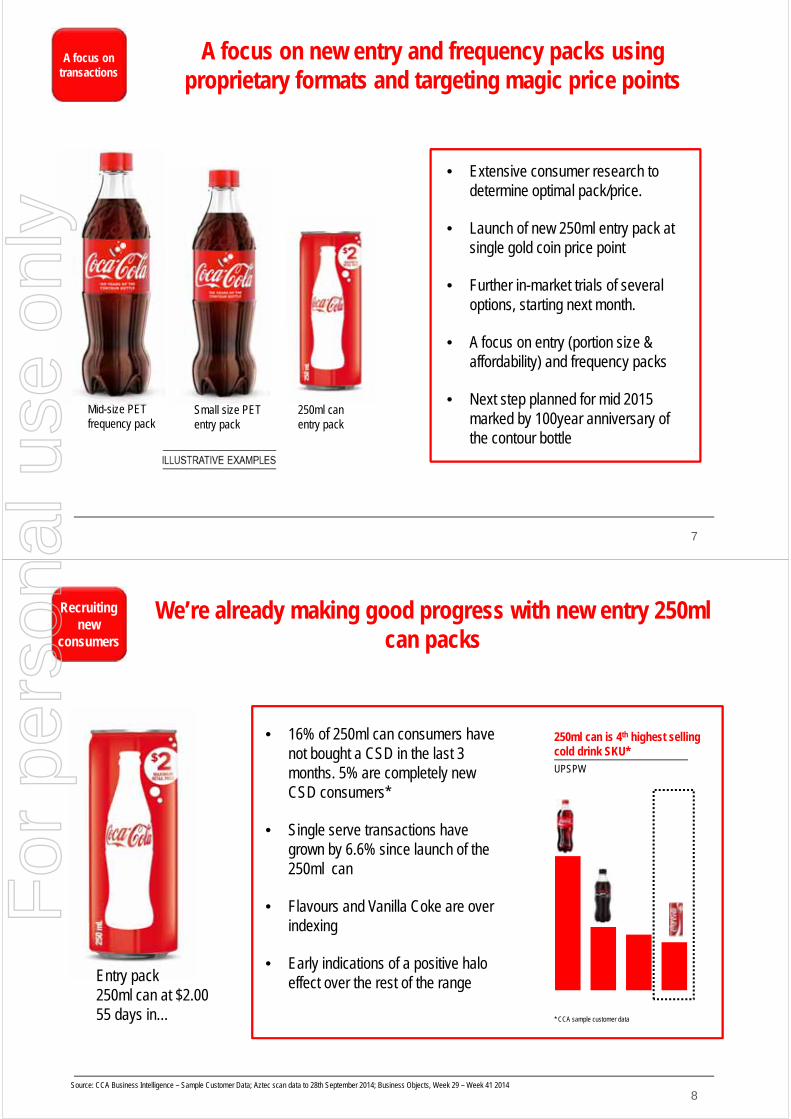
We’re already making good progress with new entry 250ml can packs
We’re already making good progress with new entry 250ml can packs
Recruiting new
consumers
Source: CCA Business Intelligence – Sample Customer Data; Aztec scan data to 28th September 2014; Business Objects, Week 29 – Week 41 2014
Entry pack250ml can at $2.0055 days in…
• 16% of 250ml can consumers have not bought a CSD in the last 3 months. 5% are completely new CSD consumers*
• Single serve transactions have grown by 6.6% since launch of the 250ml can
• Flavours and Vanilla Coke are over indexing
• Early indications of a positive halo effect over the rest of the range
250ml can is 4th highest selling cold drink SKU*UPSPW
* CCA sample customer data
For
per
sona
l use
onl
y
9
In the face of key challenges, we’re planning significant changes to our strategy
In the face of key challenges, we’re planning significant changes to our strategy
What’s changing
Key challenges
Health & artificiality
+
Affordability
+
Engagement &relevance
+
Customer concentration
+
Revenue & cost imbalance
Driving fundamental shifts in our strategy across our whole business
Volume & Price-led revenue growth
Declining/dispersed marketing investment and impact
Lost outlet execution and revenue management discipline
High fixed cost investment / slowing growth
From… …To
Transaction & Mix-led revenue growth
Up-weighted, focused marketing investment
People and technology-led route to market and RGM discipline
Balanced revenue growth / cost optimisation
Declining loyal consumer base Increased product and brand relevance to key consumers
10
For
per
sona
l use
onl
y
11
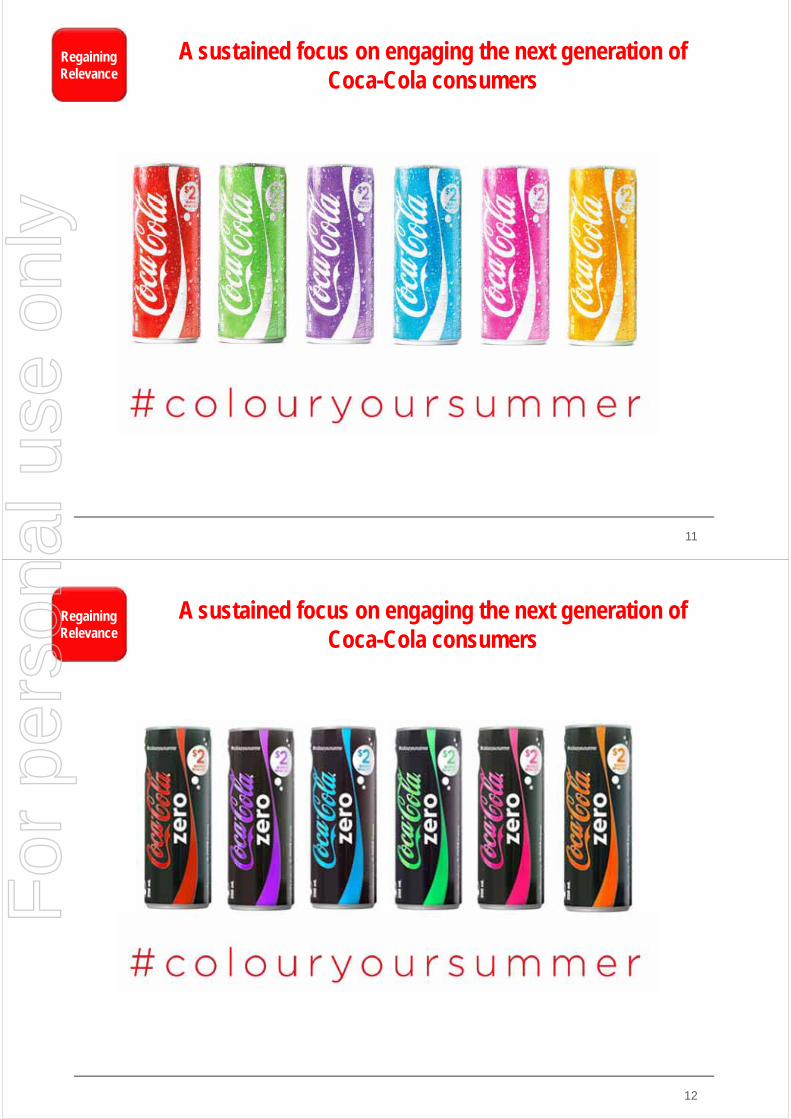
A sustained focus on engaging the next generation of Coca-Cola consumers
A sustained focus on engaging the next generation of Coca-Cola consumers
Regaining Relevance
#colouryoursummer
12
A sustained focus on engaging the next generation of Coca-Cola consumers
A sustained focus on engaging the next generation of Coca-Cola consumers
Regaining Relevance
#colouryoursummer
For
per
sona
l use
onl
y
13
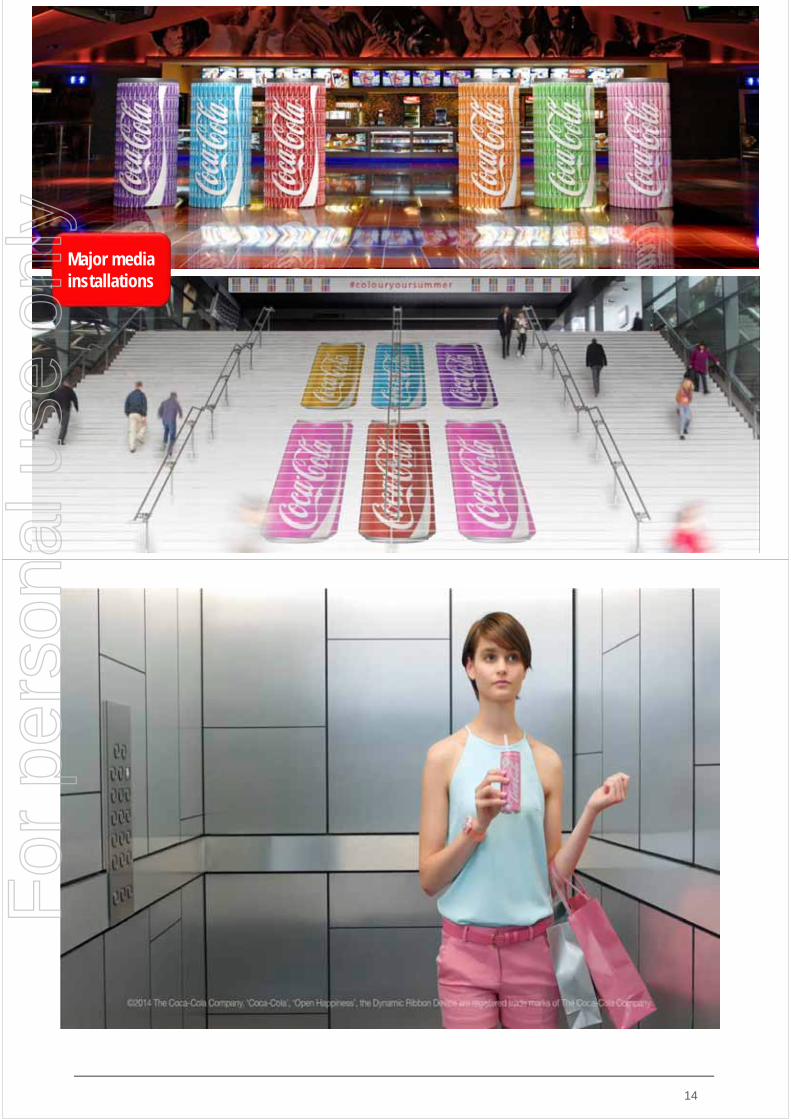
Major media installations
14
For
per
sona
l use
onl
y
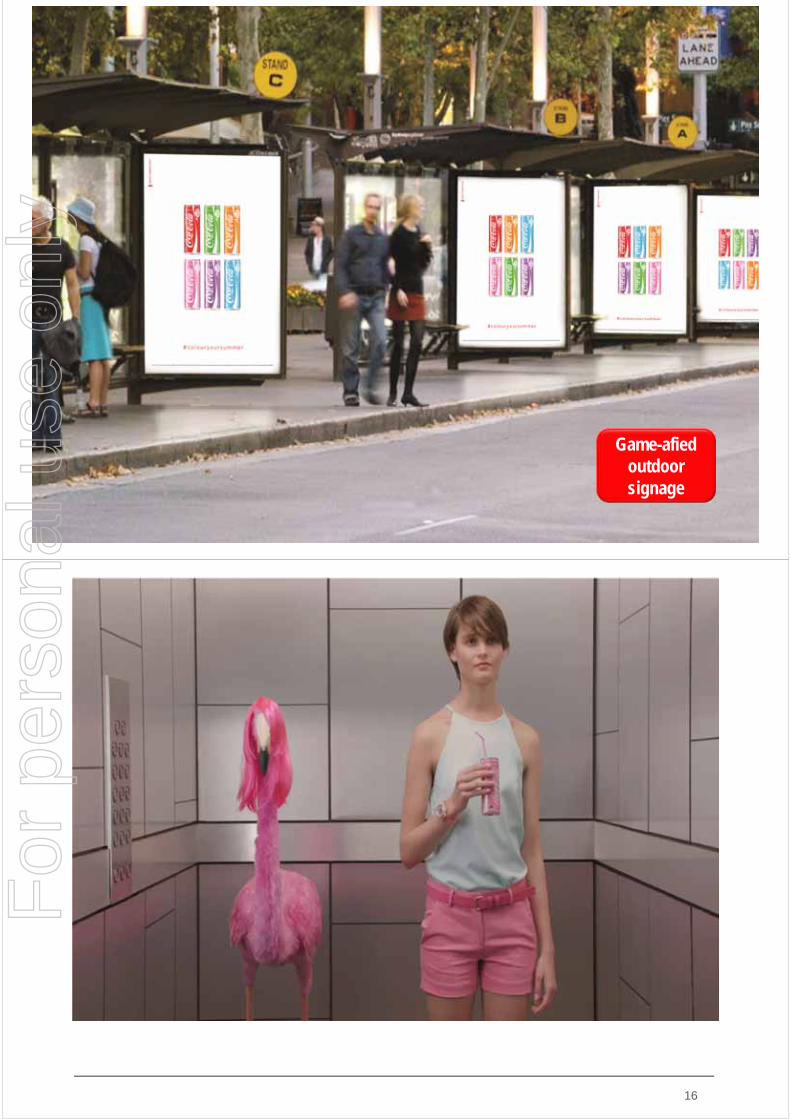
15
Game-afiedoutdoor signage
16
For
per
sona
l use
onl
y
17
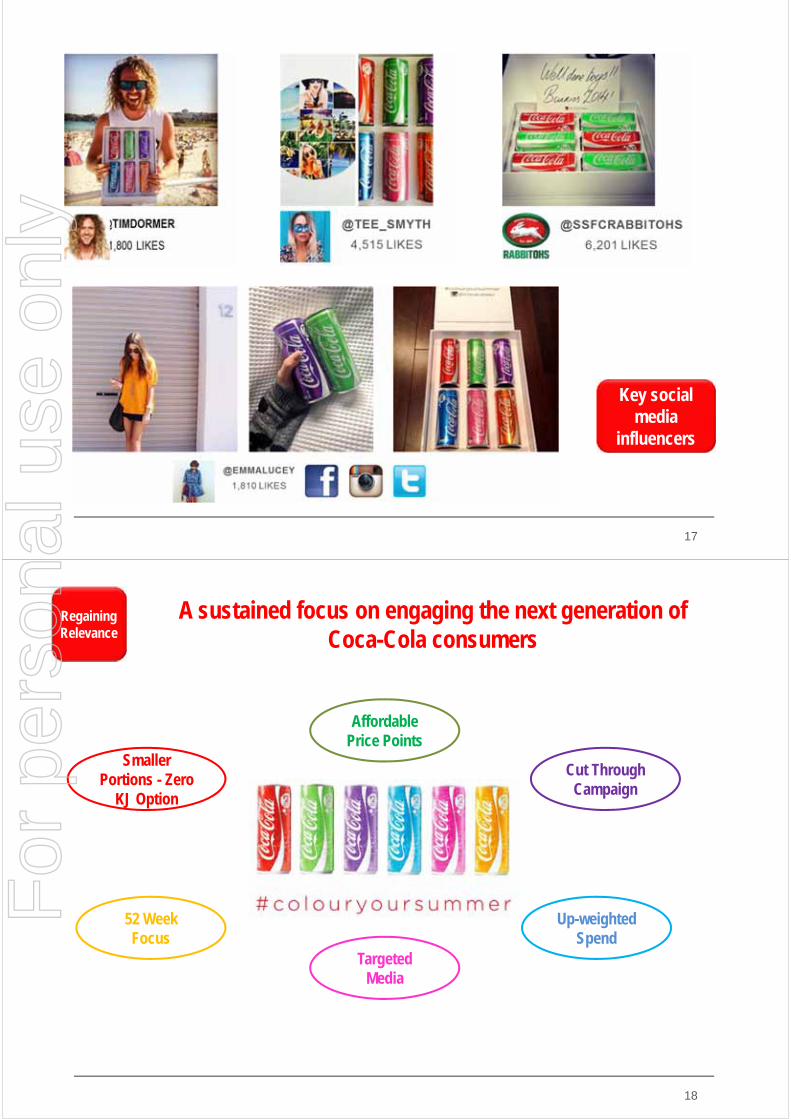
Key social media
influencers
18
A sustained focus on engaging the next generation of Coca-Cola consumers
A sustained focus on engaging the next generation of Coca-Cola consumers
Regaining Relevance
Smaller Portions - Zero
KJ Option
Affordable Price Points
Cut Through Campaign
52 Week Focus
Up-weighted Spend
Targeted Media
For
per
sona
l use
onl
y
19
Our strategy recognises the importance of broadening our consumer base and re-engaging with key target groups - including families
Our strategy recognises the importance of broadening our consumer base and re-engaging with key target groups - including families
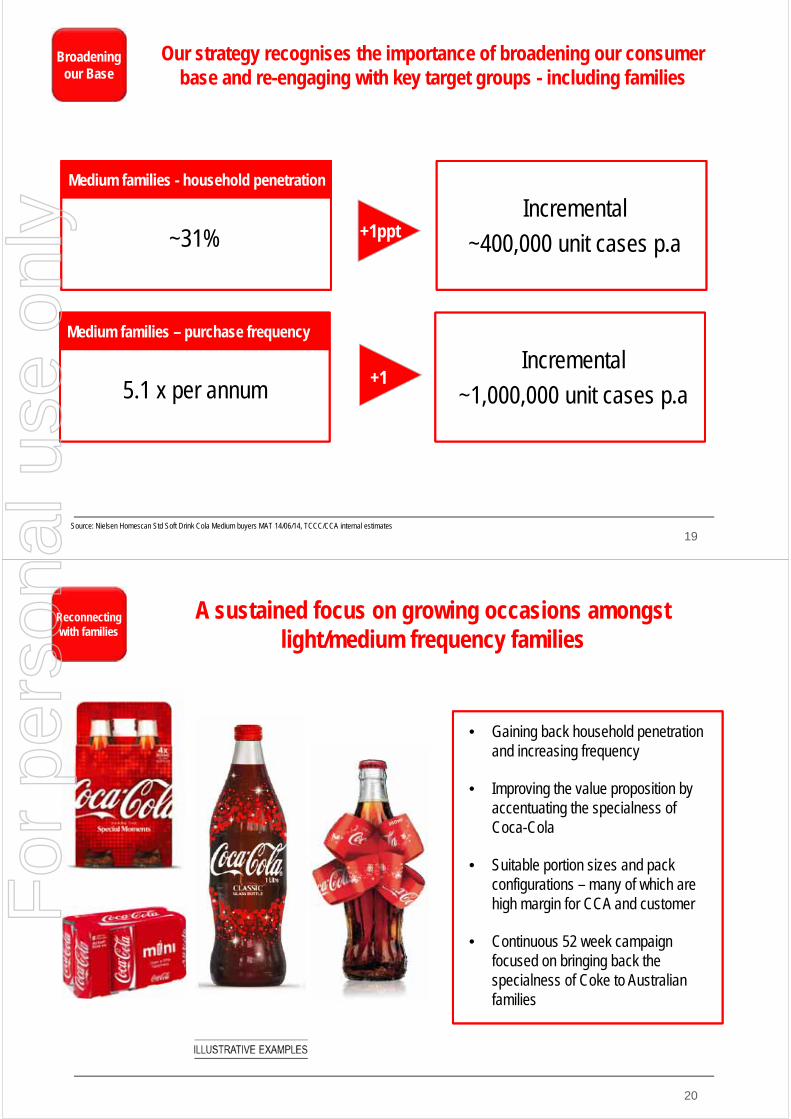
Broadening our Base
Medium families - household penetration
Source: Nielsen Homescan Std Soft Drink Cola Medium buyers MAT 14/06/14, TCCC/CCA internal estimates
Incremental
~400,000 unit cases p.a
Medium families – purchase frequency
Incremental
~1,000,000 unit cases p.a5.1 x per annum
~31% +1ppt
+1
20
A sustained focus on growing occasions amongst light/medium frequency families
A sustained focus on growing occasions amongst light/medium frequency families
Reconnecting with families
• Gaining back household penetration and increasing frequency
• Improving the value proposition by accentuating the specialness of Coca-Cola
• Suitable portion sizes and pack configurations – many of which are high margin for CCA and customer
• Continuous 52 week campaign focused on bringing back the specialness of Coke to Australian families
For
per
sona
l use
onl
y

21
The introduction of new “naturally sweetened” beverages, including Coke Life with full Coca-Cola taste
The introduction of new “naturally sweetened” beverages, including Coke Life with full Coca-Cola taste
No compromise
taste
Source: Argentina post launch consumer tracker 2013
• We’ll launch multiple naturally sweetened options during 2015-2017, including Coke Life
• We will use the UK Coke Life version of a full Coke taste and 35% less calories
• We already have significant customer interest and support
• We expect a positive effect across the whole Coca-Cola TM
Post launch opinion of Coca-Cola brand (Argentina launch)
% respondents
8
56
36 Better
Same
Worse
22
TCCC is a world leader in the application of natural sweetener technology
TCCC is a world leader in the application of natural sweetener technology
Leading sweetener technology
Source: The Coca-Cola Company
• New technology and natural sweetener blends are allowing a closer match to the taste of sucrose
• Already the Coke Life blend is very close.
• The Coca-Cola Company is investing heavily in the development of even closer matches in the future Sweet Taste
Swee
t Int
ensi
ty
Sucrose
Typical Stevia Sweetener
Coke Life Stevia Sweetener
For
per
sona
l use
onl
y
23
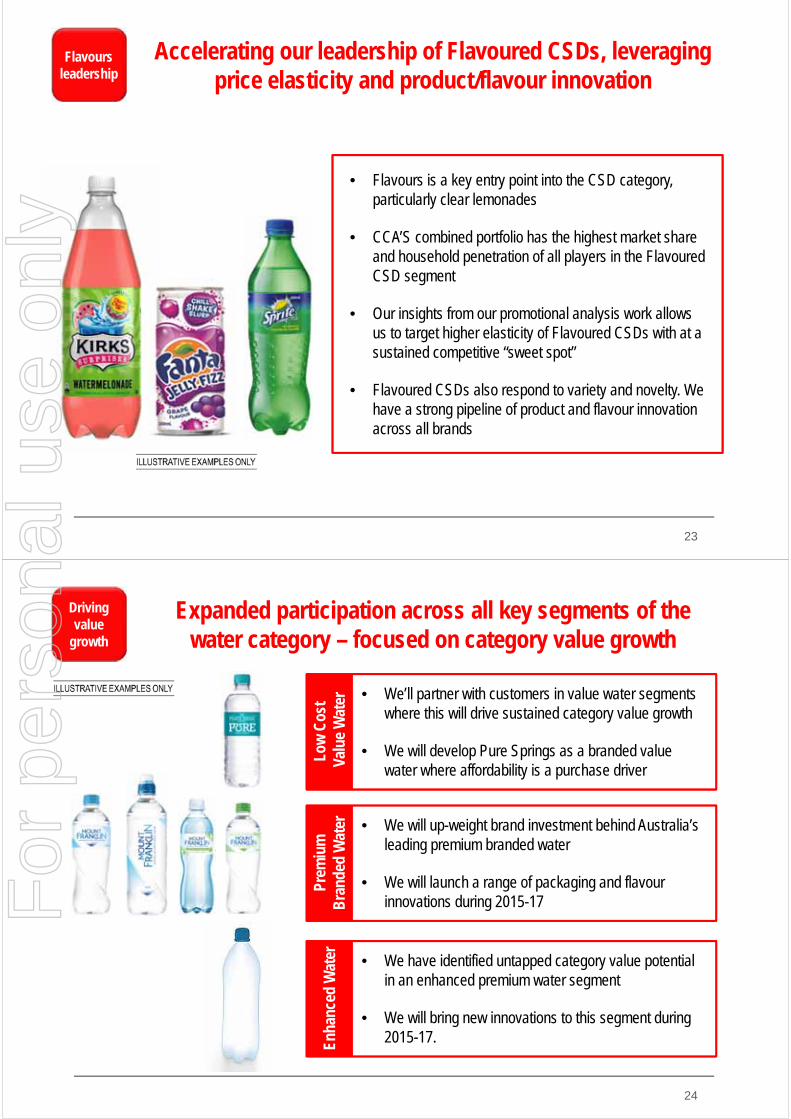
Accelerating our leadership of Flavoured CSDs, leveraging price elasticity and product/flavour innovation
Accelerating our leadership of Flavoured CSDs, leveraging price elasticity and product/flavour innovation
Flavours leadership
• Flavours is a key entry point into the CSD category, particularly clear lemonades
• CCA’S combined portfolio has the highest market share and household penetration of all players in the Flavoured CSD segment
• Our insights from our promotional analysis work allows us to target higher elasticity of Flavoured CSDs with at a sustained competitive “sweet spot”
• Flavoured CSDs also respond to variety and novelty. We have a strong pipeline of product and flavour innovation across all brands
24
Expanded participation across all key segments of the water category – focused on category value growth
Expanded participation across all key segments of the water category – focused on category value growth
Driving value
growth
Low
Cos
tVa
lue
Wat
erPr
emiu
m
Bra
nded
Wat
erEn
hanc
ed W
ater
• We’ll partner with customers in value water segments where this will drive sustained category value growth
• We will develop Pure Springs as a branded value water where affordability is a purchase driver
• We will up-weight brand investment behind Australia’s leading premium branded water
• We will launch a range of packaging and flavour innovations during 2015-17
• We have identified untapped category value potential in an enhanced premium water segment
• We will bring new innovations to this segment during 2015-17.
For
per
sona
l use
onl
y
25
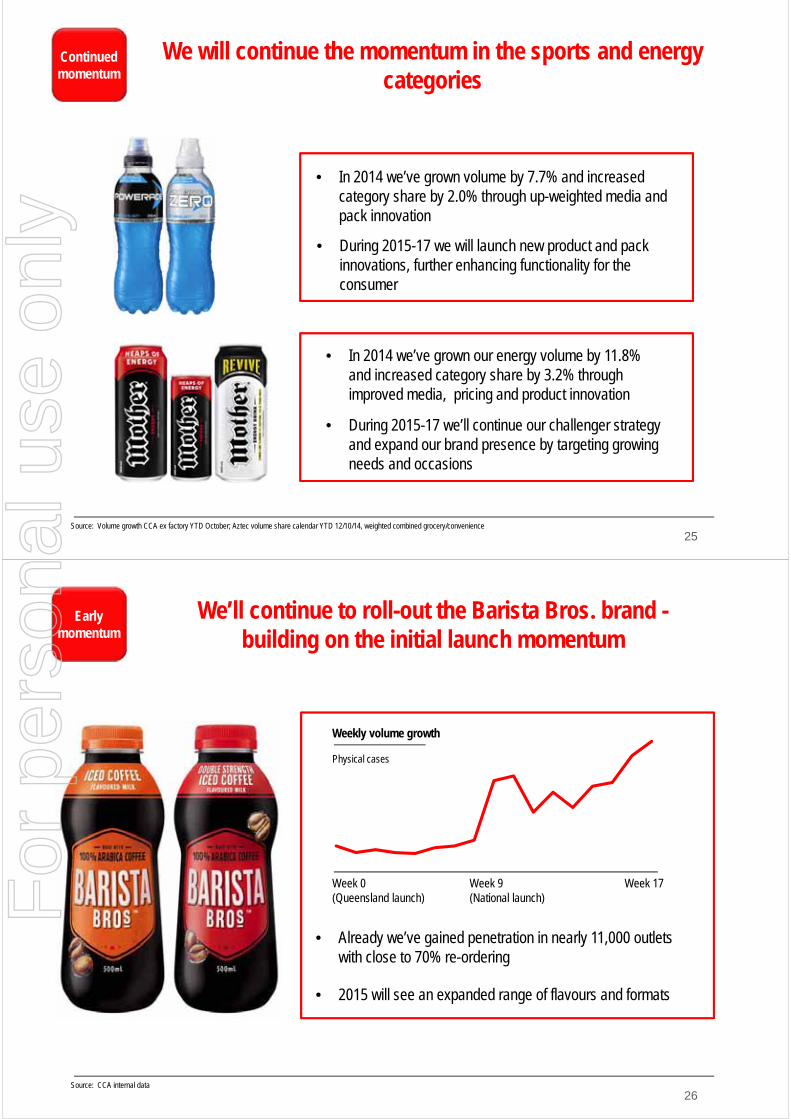
We will continue the momentum in the sports and energy categories
We will continue the momentum in the sports and energy categories
Continued momentum
Source: Volume growth CCA ex factory YTD October; Aztec volume share calendar YTD 12/10/14, weighted combined grocery/convenience
• In 2014 we’ve grown volume by 7.7% and increased category share by 2.0% through up-weighted media and pack innovation
• During 2015-17 we will launch new product and pack innovations, further enhancing functionality for the consumer
• In 2014 we’ve grown our energy volume by 11.8% and increased category share by 3.2% through improved media, pricing and product innovation
• During 2015-17 we’ll continue our challenger strategy and expand our brand presence by targeting growing needs and occasions
26
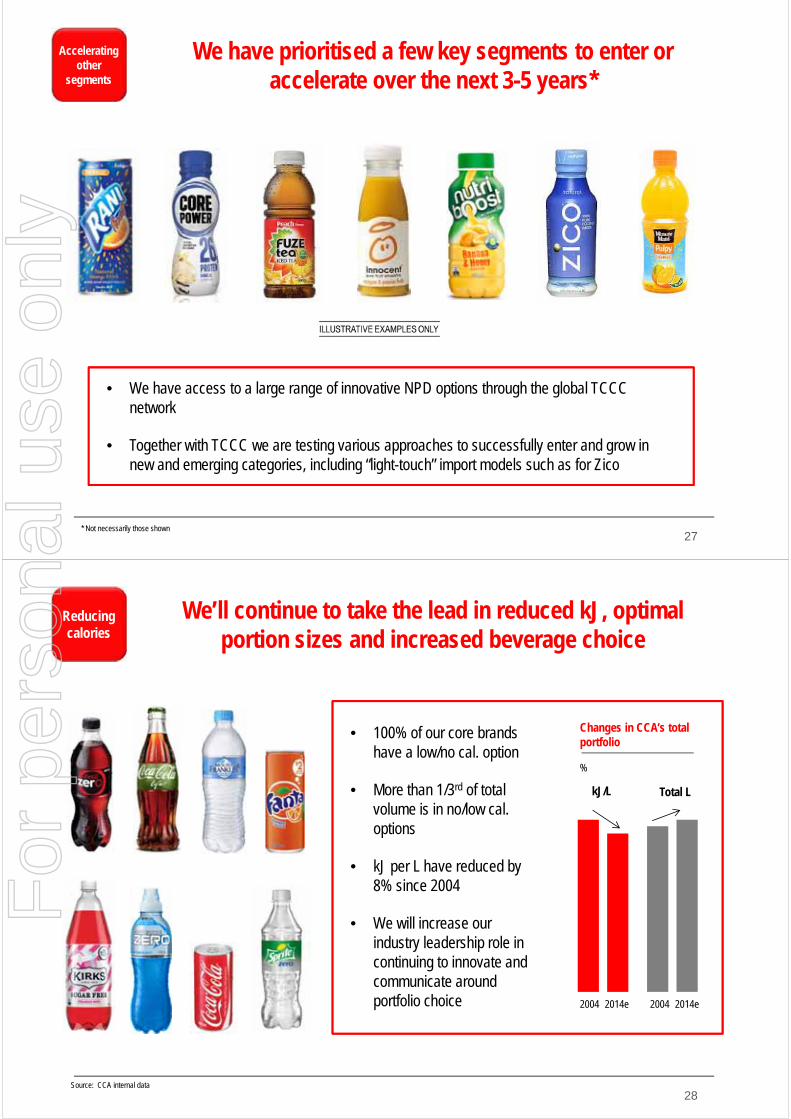
We’ll continue to roll-out the Barista Bros. brand -building on the initial launch momentum
We’ll continue to roll-out the Barista Bros. brand -building on the initial launch momentum
Early momentum
Source: CCA internal data
• Already we’ve gained penetration in nearly 11,000 outlets with close to 70% re-ordering
• 2015 will see an expanded range of flavours and formats
Weekly volume growth
Physical cases
Week 0(Queensland launch)
Week 9(National launch)
Week 17For
per
sona
l use
onl
y
27
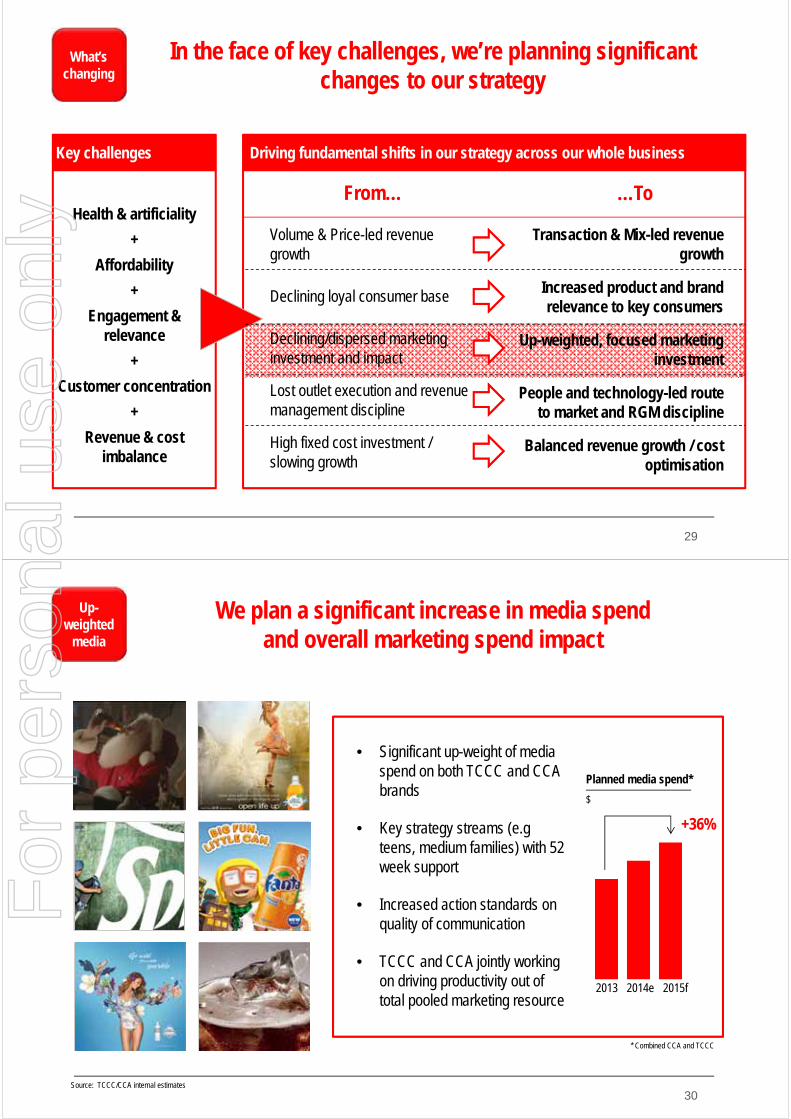
We have prioritised a few key segments to enter or accelerate over the next 3-5 years*
We have prioritised a few key segments to enter or accelerate over the next 3-5 years*
Accelerating other
segments
• We have access to a large range of innovative NPD options through the global TCCC network
• Together with TCCC we are testing various approaches to successfully enter and grow in new and emerging categories, including “light-touch” import models such as for Zico
* Not necessarily those shown
28
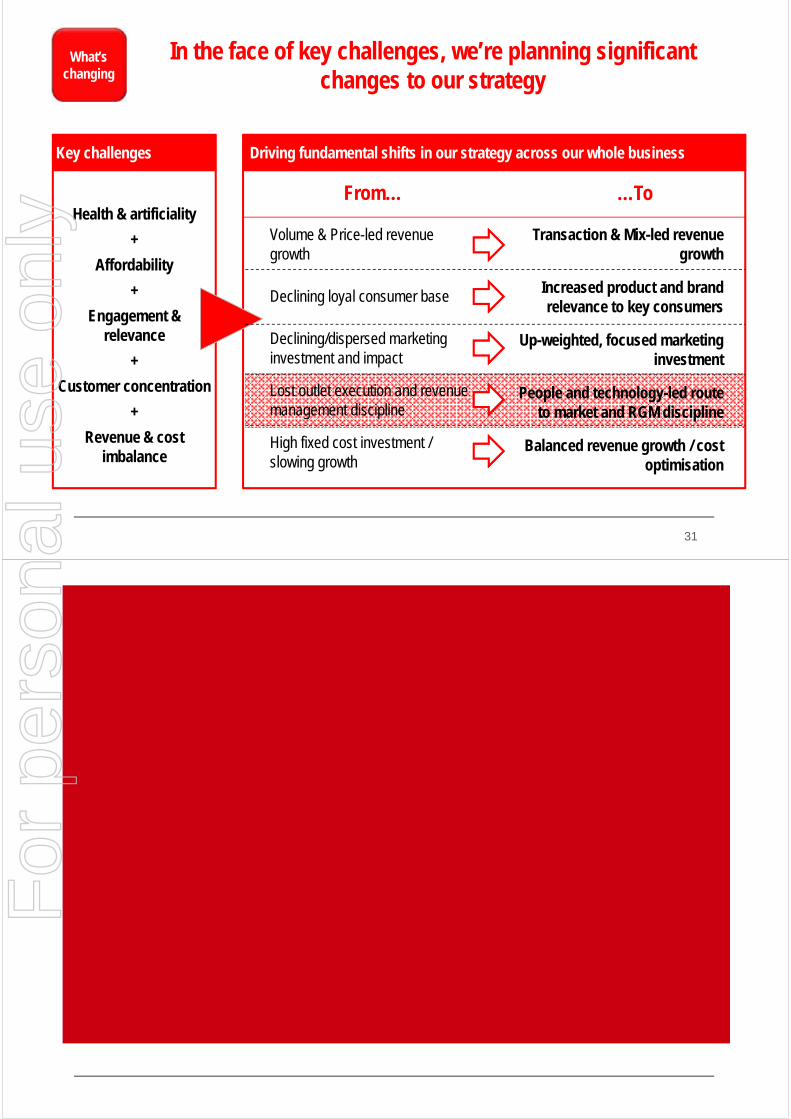
We’ll continue to take the lead in reduced kJ, optimal portion sizes and increased beverage choice
We’ll continue to take the lead in reduced kJ, optimal portion sizes and increased beverage choice
Reducing calories
Source: CCA internal data
• 100% of our core brands have a low/no cal. option
• More than 1/3rd of total volume is in no/low cal. options
• kJ per L have reduced by 8% since 2004
• We will increase our industry leadership role in continuing to innovate and communicate around portfolio choice
Changes in CCA’s total portfolio
%
2004 2014e 2004 2014e
kJ/L Total L
For
per
sona
l use
onl
y
29
In the face of key challenges, we’re planning significant changes to our strategy
In the face of key challenges, we’re planning significant changes to our strategy
What’s changing
Key challenges
Health & artificiality
+
Affordability
+
Engagement &relevance
+
Customer concentration
+
Revenue & cost imbalance
Driving fundamental shifts in our strategy across our whole business
Volume & Price-led revenue growth
Lost outlet execution and revenue management discipline
High fixed cost investment / slowing growth
From… …To
Transaction & Mix-led revenue growth
People and technology-led route to market and RGM discipline
Balanced revenue growth / cost optimisation
Declining loyal consumer base Increased product and brand relevance to key consumers
Declining/dispersed marketing investment and impact
Up-weighted, focused marketing investment
30
We plan a significant increase in media spendand overall marketing spend impact
We plan a significant increase in media spendand overall marketing spend impact
Up-weighted
media
Source: TCCC/CCA internal estimates
• Significant up-weight of media spend on both TCCC and CCA brands
• Key strategy streams (e.gteens, medium families) with 52 week support
• Increased action standards on quality of communication
• TCCC and CCA jointly working on driving productivity out of total pooled marketing resource
Planned media spend*
$
+36%
2013 2014e 2015f
* Combined CCA and TCCC
For
per
sona
l use
onl
y
31
In the face of key challenges, we’re planning significant changes to our strategy
In the face of key challenges, we’re planning significant changes to our strategy
What’s changing
Key challenges
Health & artificiality
+
Affordability
+
Engagement &relevance
+
Customer concentration
+
Revenue & cost imbalance
Driving fundamental shifts in our strategy across our whole business
Volume & Price-led revenue growth
High fixed cost investment / slowing growth
From… …To
Transaction & Mix-led revenue growth
Balanced revenue growth / cost optimisation
Declining loyal consumer base Increased product and brand relevance to key consumers
Declining/dispersed marketing investment and impact
Up-weighted, focused marketing investment
Lost outlet execution and revenue management discipline
People and technology-led route to market and RGM discipline
For
per
sona
l use
onl
y
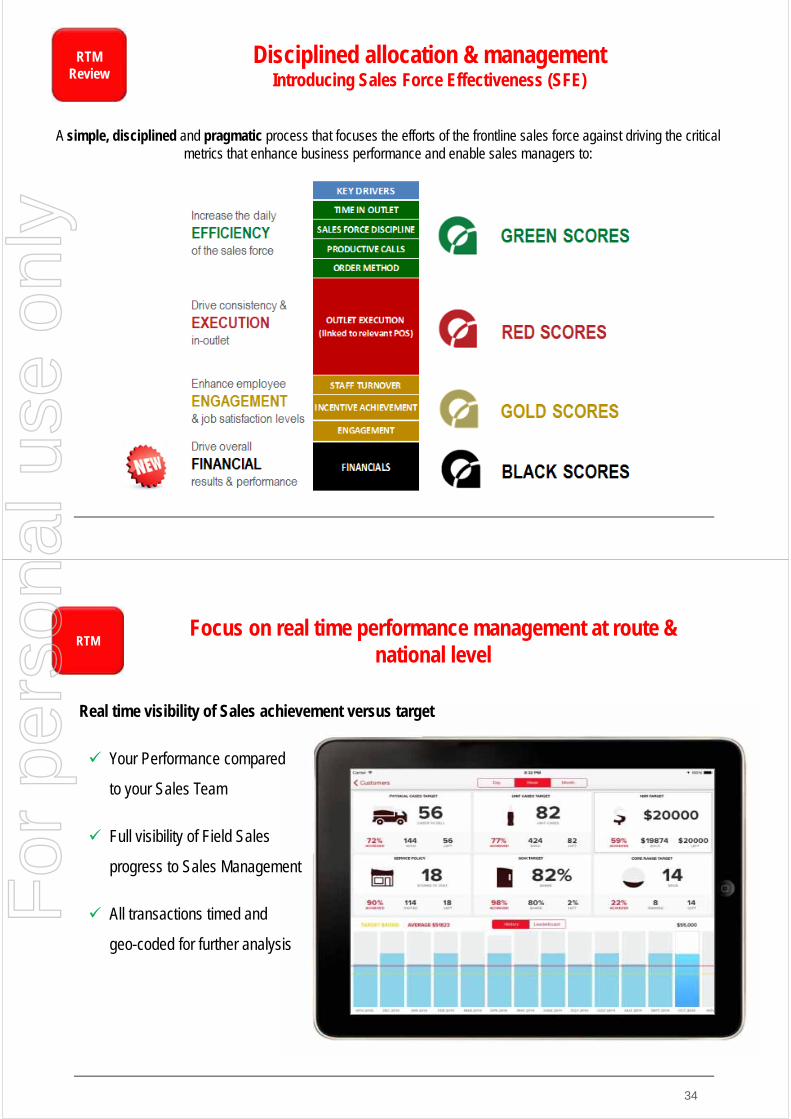
A simple, disciplined and pragmatic process that focuses the efforts of the frontline sales force against driving the critical metrics that enhance business performance and enable sales managers to:
RTM Review
Disciplined allocation & managementIntroducing Sales Force Effectiveness (SFE)
Disciplined allocation & managementIntroducing Sales Force Effectiveness (SFE)
Focus on real time performance management at route & national level
Focus on real time performance management at route & national level
34
RTM
Real time visibility of Sales achievement versus target
Your Performance compared
to your Sales Team
Full visibility of Field Sales
progress to Sales Management
All transactions timed and
geo-coded for further analysis
For
per
sona
l use
onl
y
35
Identifying opportunities at outlet level with accompanying profit stories
Identifying opportunities at outlet level with accompanying profit stories
RTM
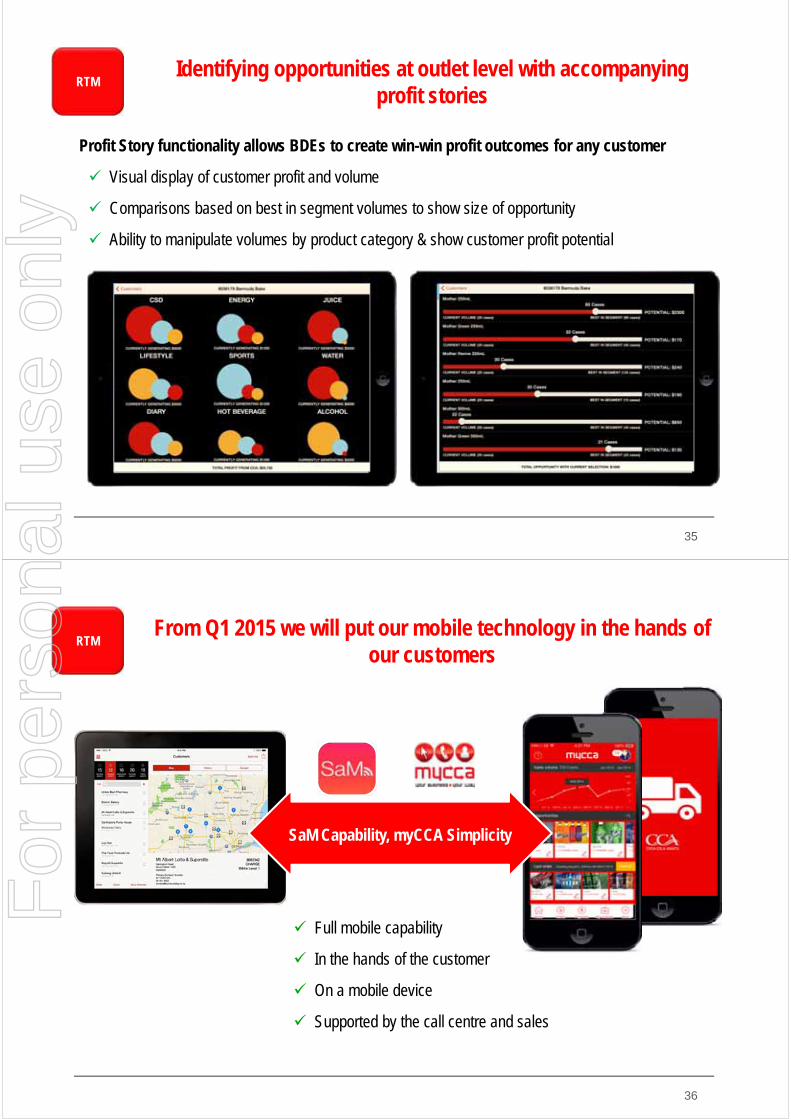
Profit Story functionality allows BDEs to create win-win profit outcomes for any customer
Visual display of customer profit and volume
Comparisons based on best in segment volumes to show size of opportunity
Ability to manipulate volumes by product category & show customer profit potential
36
From Q1 2015 we will put our mobile technology in the hands of our customers
From Q1 2015 we will put our mobile technology in the hands of our customers
RTM
SaM Capability, myCCA Simplicity
Full mobile capability
In the hands of the customer
On a mobile device
Supported by the call centre and sales
For
per
sona
l use
onl
y
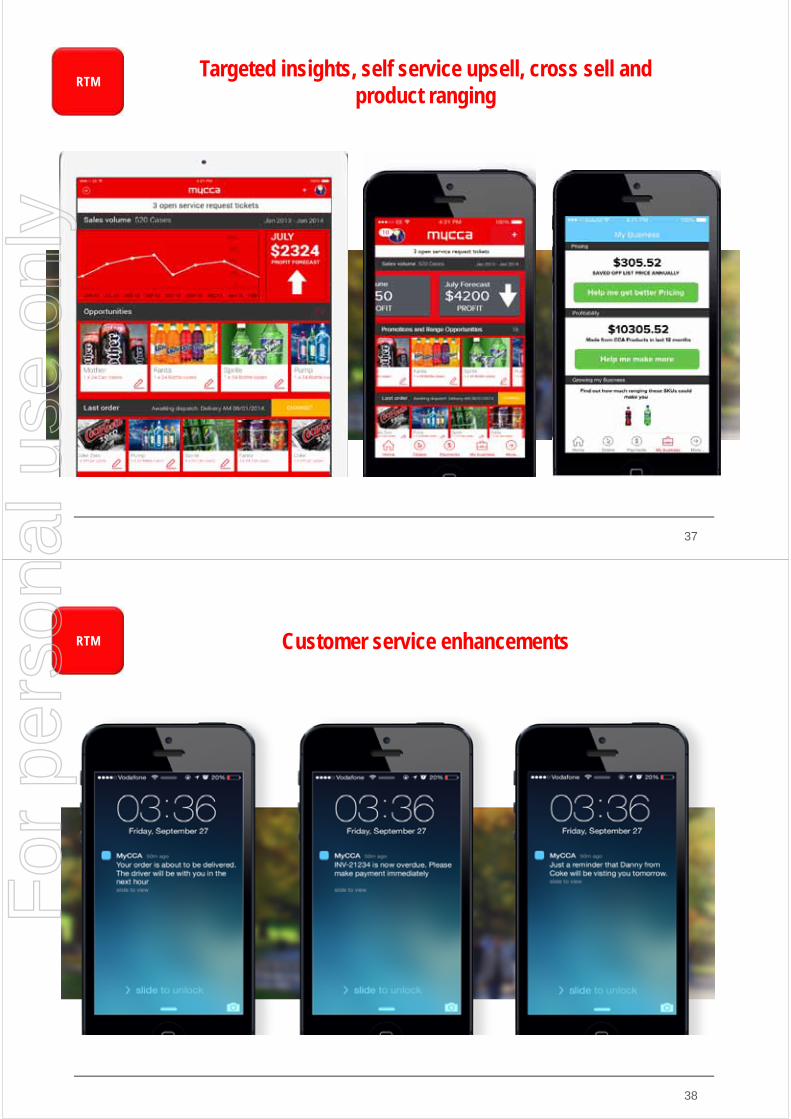
Targeted insights, self service upsell, cross sell and product ranging
Targeted insights, self service upsell, cross sell and product ranging
RTM
37
Customer service enhancementsCustomer service enhancementsRTM
38
For
per
sona
l use
onl
y
Technology will also enable a range of improvements toour current pricing architecture
Technology will also enable a range of improvements toour current pricing architecture
Other RTM initiatives
• Re-design route discount architecture to ensure more disciplined pricing, rewarding customers for execution and performance, via IT enabled compliance tracking and a value-linked discount qualification model
• Limit sub-wholesaling from national accounts via systems and processes to identify extraordinary ordering spikes, block ‘illegitimate’ orders, and provide alternate offers
• Address route promotions/pricing to reduce can leakage from grocery by introducing systems and processes to identify, target and provide alternate offers to relevant customers
Improve route discount
architecture
Limitsub-
wholesaling
Addresscan leakage
39
40
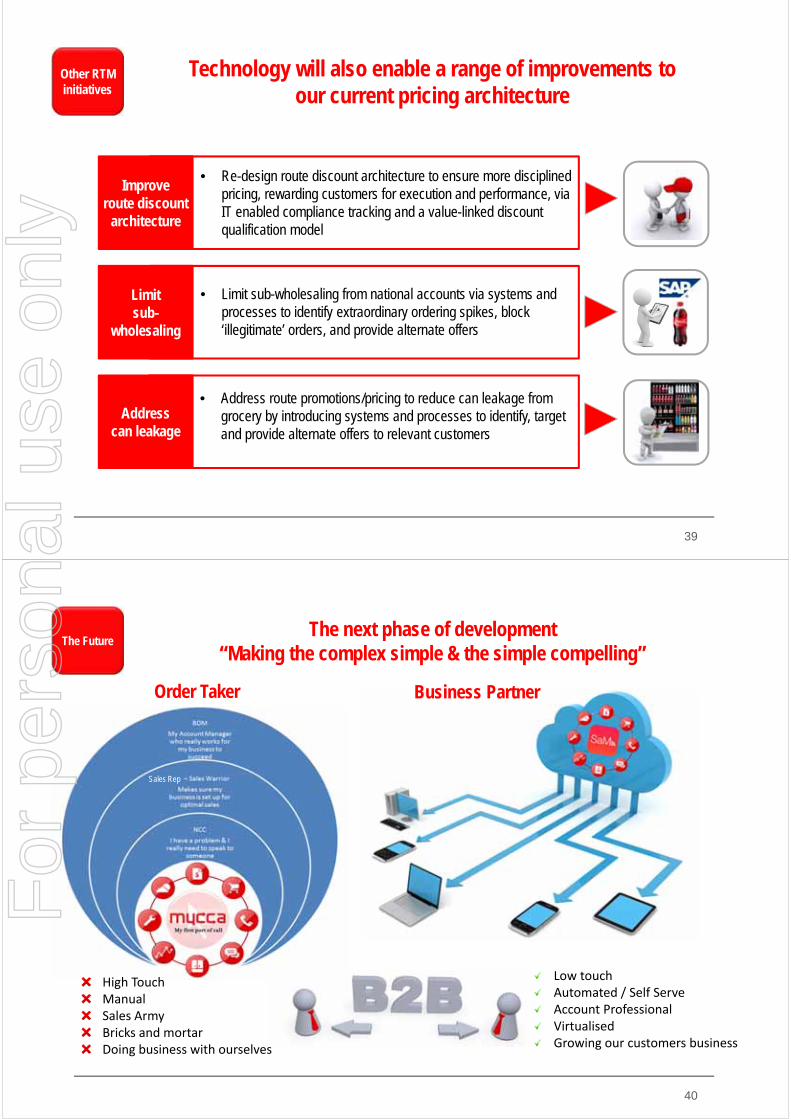
The next phase of development“Making the complex simple & the simple compelling”
The next phase of development“Making the complex simple & the simple compelling”
The Future
Sales Rep
High TouchManualSales ArmyBricks and mortarDoing business with ourselves
Low touchAutomated / Self ServeAccount ProfessionalVirtualisedGrowing our customers business
Order Taker Business Partner
For
per
sona
l use
onl
y

41
The future is here - Q1 2015The future is here - Q1 2015The Future
• Targeted insights at the fingertips of the customer, with comparison volume opportunities in the area
• Deliver a whole new best in class mobile self service proposition
• Self service payments coupled with account analysis
• Manage your own details, rate our performance, contact us on‐line
• We will let you know when we will be there, we will notify you when we have an issue
• Self service upsell, cross sell and product ranging, sku buying history by image
42
In the face of key challenges, we’re planning significant changes to our strategy
In the face of key challenges, we’re planning significant changes to our strategy
What’s changing
Key challenges
Health & artificiality
+
Affordability
+
Engagement &relevance
+
Customer concentration
+
Revenue & cost imbalance
Driving fundamental shifts in our strategy across our whole business
Volume & Price-led revenue growth
From… …To
Transaction & Mix-led revenue growth
Declining loyal consumer base Increased product and brand relevance to key consumers
Declining/dispersed marketing investment and impact
Up-weighted, focused marketing investment
Lost outlet execution and revenue management discipline
People and technology-led route to market and RGM discipline
High fixed cost investment / slowing growth
Balanced revenue growth / cost optimisation
For
per
sona
l use
onl
y
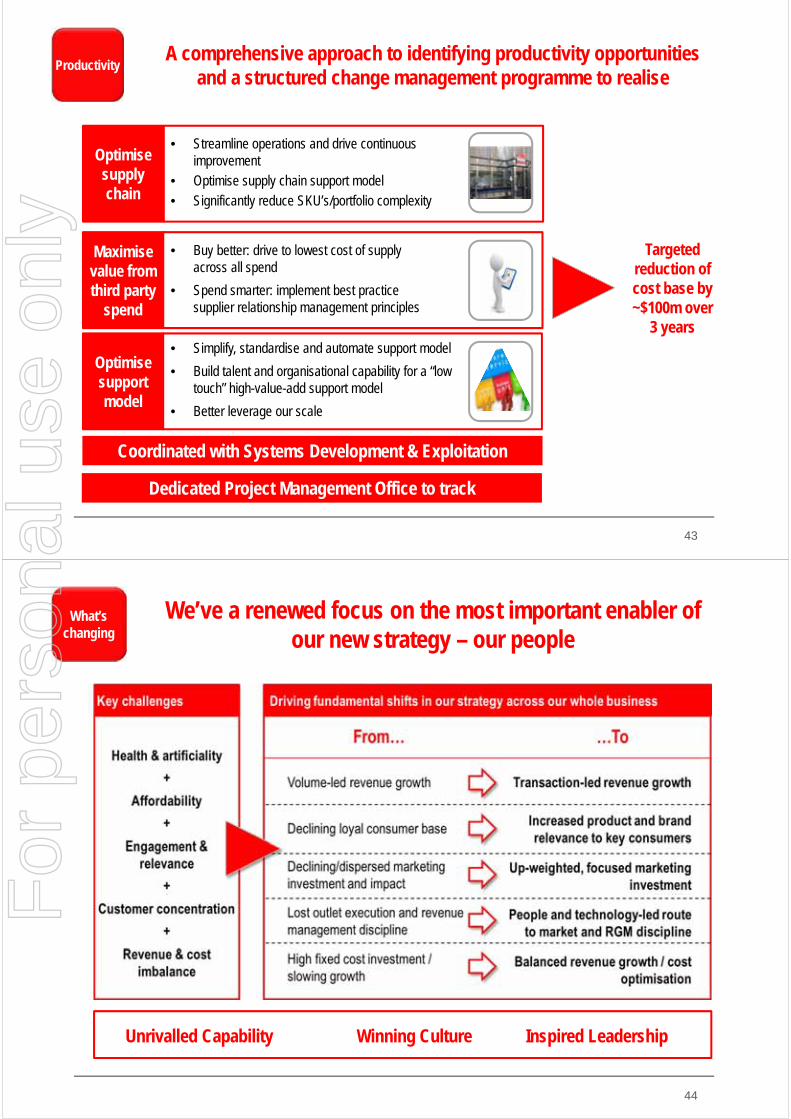
ProductivityA comprehensive approach to identifying productivity opportunities
and a structured change management programme to realiseA comprehensive approach to identifying productivity opportunities
and a structured change management programme to realise
Optimise supply chain
• Streamline operations and drive continuous improvement
• Optimise supply chain support model• Significantly reduce SKU’s/portfolio complexity
Maximise value from third party
spend
• Buy better: drive to lowest cost of supply across all spend
• Spend smarter: implement best practice supplier relationship management principles
Optimise support model
• Simplify, standardise and automate support model
• Build talent and organisational capability for a “low touch” high-value-add support model
• Better leverage our scale
Targeted reduction of cost base by ~$100m over
3 years
43
Coordinated with Systems Development & Exploitation
Dedicated Project Management Office to track
44
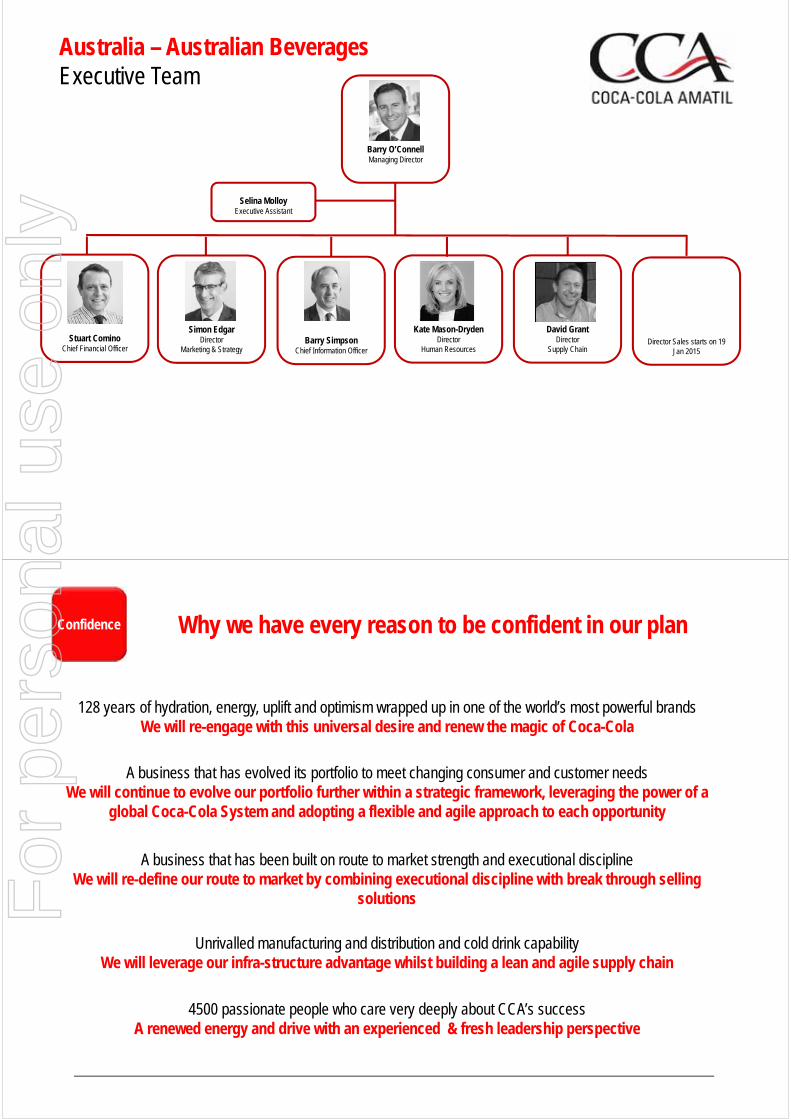
We’ve a renewed focus on the most important enabler of our new strategy – our people
We’ve a renewed focus on the most important enabler of our new strategy – our people
What’s changing
Inspired LeadershipWinning CultureUnrivalled Capability
For
per
sona
l use
onl
y
Selina MolloyExecutive Assistant
Stuart CominoChief Financial Officer
Simon EdgarDirector
Marketing & StrategyDirector Sales starts on 19
Jan 2015
David GrantDirector
Supply ChainBarry Simpson
Chief Information Officer
Barry O’ConnellManaging Director
Australia – Australian Beverages Executive Team
Kate Mason-DrydenDirector
Human Resources
128 years of hydration, energy, uplift and optimism wrapped up in one of the world’s most powerful brandsWe will re-engage with this universal desire and renew the magic of Coca-Cola
Why we have every reason to be confident in our planWhy we have every reason to be confident in our planConfidence
4500 passionate people who care very deeply about CCA’s successA renewed energy and drive with an experienced & fresh leadership perspective
Unrivalled manufacturing and distribution and cold drink capabilityWe will leverage our infra-structure advantage whilst building a lean and agile supply chain
A business that has been built on route to market strength and executional disciplineWe will re-define our route to market by combining executional discipline with break through selling
solutions
A business that has evolved its portfolio to meet changing consumer and customer needsWe will continue to evolve our portfolio further within a strategic framework, leveraging the power of a
global Coca-Cola System and adopting a flexible and agile approach to each opportunity
For
per
sona
l use
onl
y
4747
CCA Investor BriefingStrategic Review
30 October 2014
Barry O’Connell Managing Director – Australian Beverages
4848
DisclaimerCCA advises that these presentation slides contain forward looking statements which may be subject to significant uncertainties outside of CCA’s control.
No representation is made as to the accuracy or reliability of forward looking statements or the assumptions on which they are based.
Actual future events may vary from these forward looking statements and you are cautioned not to place undue reliance on any forward looking statement.
For
per
sona
l use
onl
y

11
CCA Investor BriefingNew Zealand
30 October 2014
Chris Litchfield Managing Director – New Zealand & Fiji
2
A Product for Every Beverage Occasion & Brands Loved & Trusted by NZ
A Product for Every Beverage Occasion & Brands Loved & Trusted by NZ
New Zealand
For
per
sona
l use
onl
y

3
The Plan: Build a strong, diverse beverage portfolio, leveraging our scale, efficiency & route to market
The Plan: Build a strong, diverse beverage portfolio, leveraging our scale, efficiency & route to market
New Zealand
Grow SPARKLING transactions
Accelerate share growth in STILLS
CUSTOMER Service as a differentiator
BRAND LOVE
ENGAGEMENT
AFFORDABILITY
INNOVATION
WATER
JUICE
SPORTS
NEW CATEGORIES
CUSTOMER PROMISE
MARKET ASSETS
SERVICE OFFERING
CAPABILITY
Fast, Flexible and Efficient Supply Chain
4
Transitioning from a Pricing & Cost Out led earnings phase to a Volume based growth agenda
Transitioning from a Pricing & Cost Out led earnings phase to a Volume based growth agenda
New Zealand
-3.5%
-2.0%
-0.5%
1.0%
2.5%
4.0%
2009-12 2013-14 2015-17
CA
GR
% C
hang
e
Volume muc's NSR $
Volume based Growth PlansPrice and Cost Out led results
Recession & Earthquake
Recoveryphase
Build for growth
Growth initiatives:
• Sparkling frequency• KFC / Pizza Hut• Juice Plant• Stills ExpansionF
or p
erso
nal u
se o
nly
5
Our Proven Market Execution Capability and ability to Innovate have driven our share of growth
Our Proven Market Execution Capability and ability to Innovate have driven our share of growth
New Zealand
PRODUCTS PACKS COMMUNICATION
EXECUTION
L&P3 yearCAGR+8.9%
6
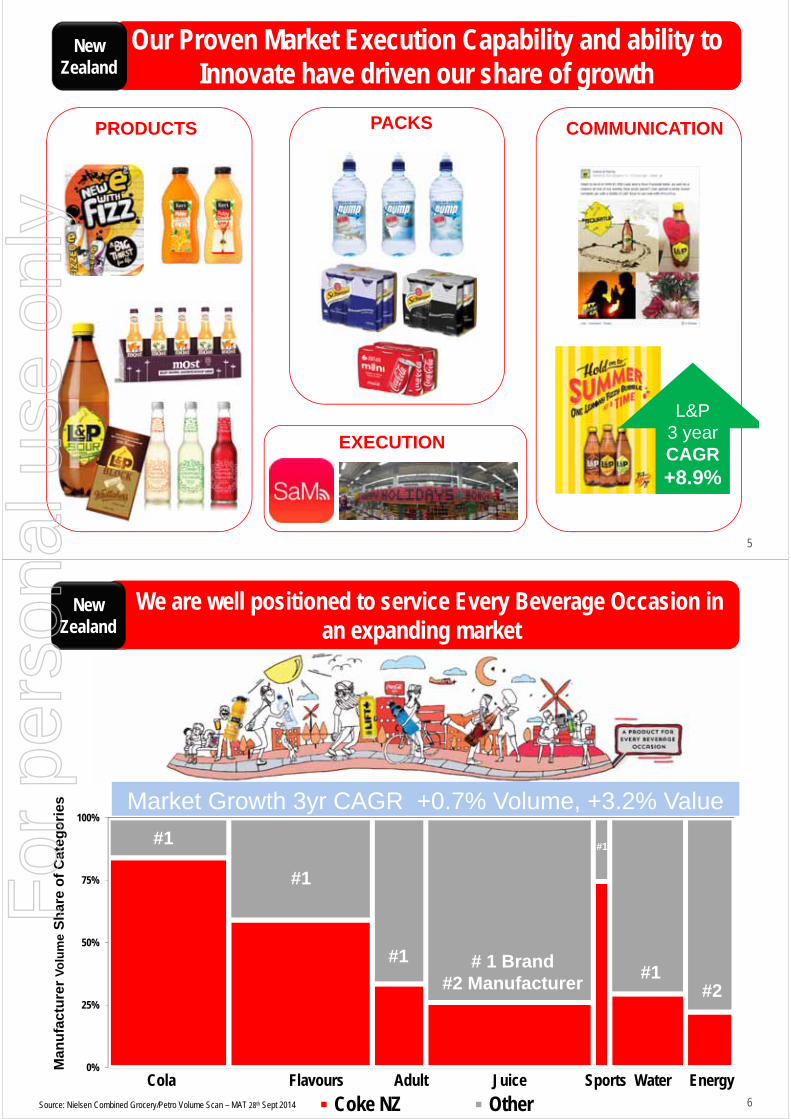
We are well positioned to service Every Beverage Occasion in an expanding market
We are well positioned to service Every Beverage Occasion in an expanding market
0%
25%
50%
75%
100%
Coke NZ OtherCola Flavours Adult Juice Sports Water Energy
New Zealand
Source: Nielsen Combined Grocery/Petro Volume Scan – MAT 28th Sept 2014
Category Volume Share of NARTD
Man
ufa
ctu
rer
Vo
lum
eS
har
e o
f C
ateg
ori
es
#1
#1
#1#1
#1
# 1 Brand#2 Manufacturer #2
Market Growth 3yr CAGR +0.7% Volume, +3.2% Value
For
per
sona
l use
onl
y

7
Our brand strength enables us to compete for the available and expanding profit pools within beverage
Our brand strength enables us to compete for the available and expanding profit pools within beverage
New Zealand
8
The Plan: Build a strong, diverse beverage portfolio, leveraging our scale, efficiency & route to market
The Plan: Build a strong, diverse beverage portfolio, leveraging our scale, efficiency & route to market
New Zealand
Grow SPARKLING transactions
Accelerate share growth in STILLS
CUSTOMER Service as a differentiator
BRAND LOVE
ENGAGEMENT
AFFORDABILITY
INNOVATION
WATER
JUICE
SPORTS
NEW CATEGORIES
CUSTOMER PROMISE
MARKET ASSETS
SERVICE OFFERING
CAPABILITY
Fast, Flexible and Efficient Supply Chain
For
per
sona
l use
onl
y
9
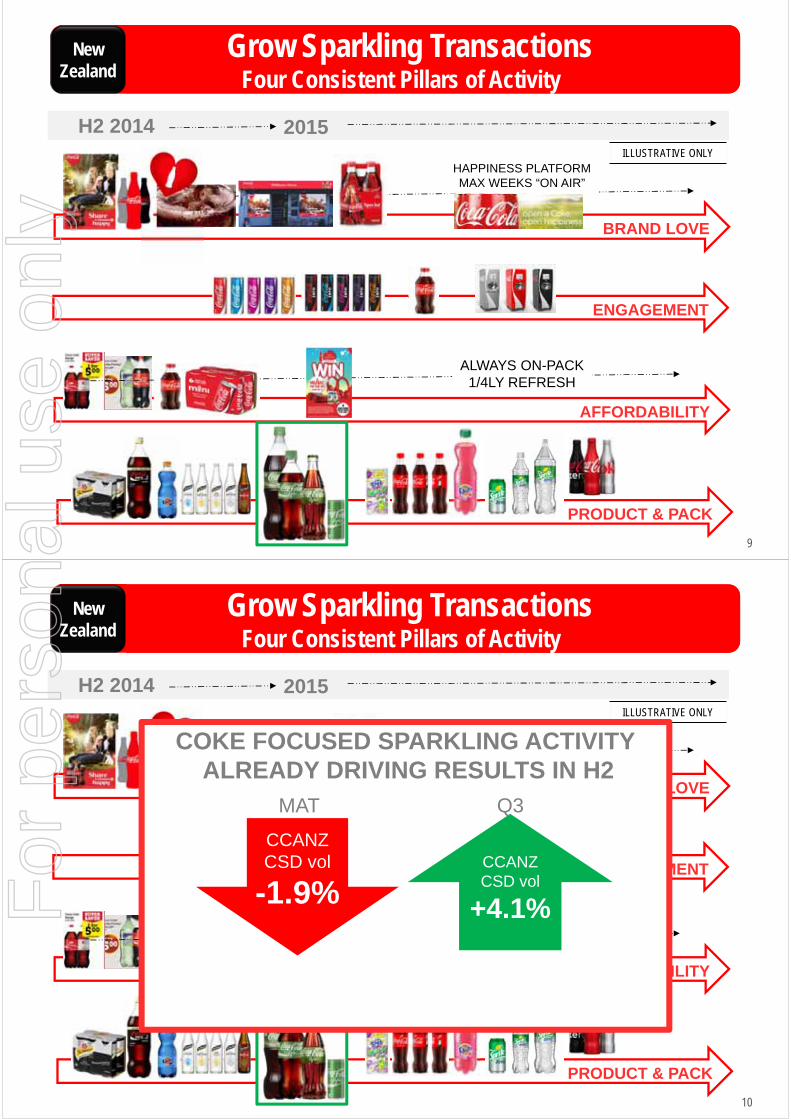
Grow Sparkling TransactionsFour Consistent Pillars of Activity
Grow Sparkling TransactionsFour Consistent Pillars of Activity
New Zealand
H2 2014 2015
ENGAGEMENT
AFFORDABILITY
ALWAYS ON-PACK1/4LY REFRESH
BRAND LOVE
HAPPINESS PLATFORMMAX WEEKS “ON AIR”
PRODUCT & PACK
ILLUSTRATIVE ONLY
10
ILLUSTRATIVE ONLY
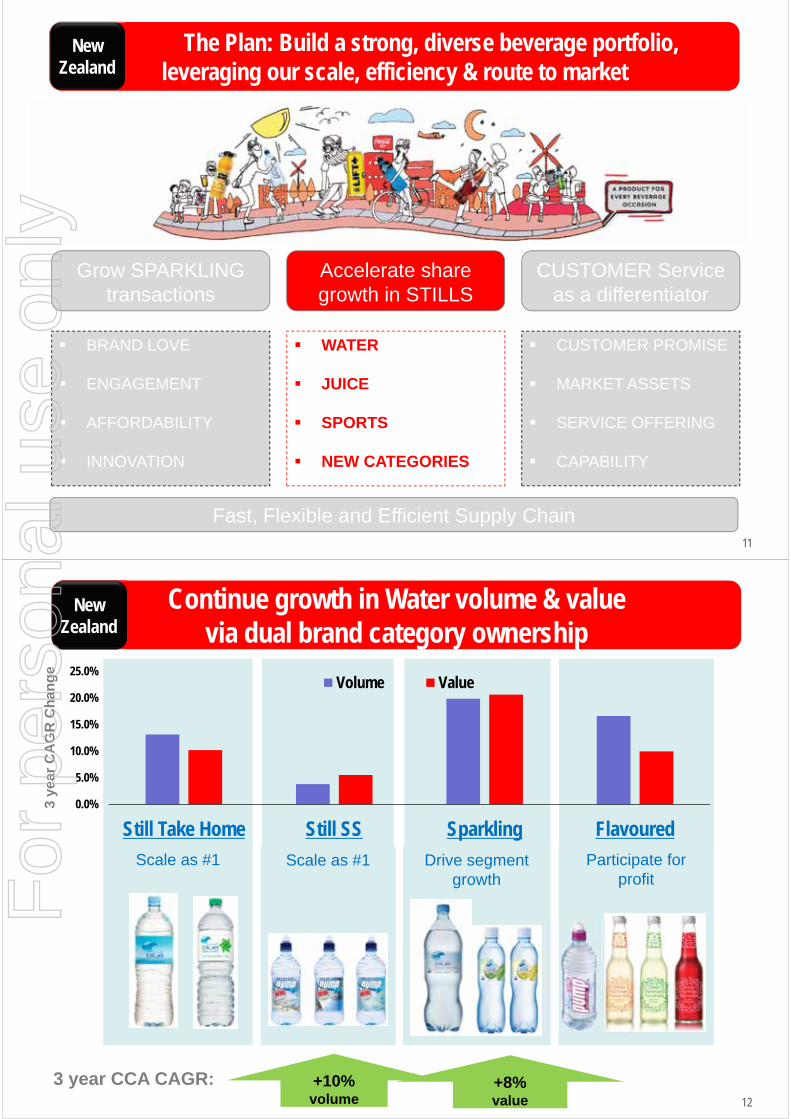
Grow Sparkling TransactionsFour Consistent Pillars of Activity
Grow Sparkling TransactionsFour Consistent Pillars of Activity
New Zealand
H2 2014 2015
ENGAGEMENT
AFFORDABILITY
ALWAYS ON-PACK1/4LY REFRESH
BRAND LOVE
HAPPINESS PLATFORMMAX WEEKS “ON AIR”
PRODUCT & PACK
COKE FOCUSED SPARKLING ACTIVITYALREADY DRIVING RESULTS IN H2
CCANZ CSD vol
+4.1%
CCANZ CSD vol
-1.9%
MAT Q3
For
per
sona
l use
onl
y
11
The Plan: Build a strong, diverse beverage portfolio, leveraging our scale, efficiency & route to market
The Plan: Build a strong, diverse beverage portfolio, leveraging our scale, efficiency & route to market
New Zealand
Grow SPARKLING transactions
Accelerate share growth in STILLS
CUSTOMER Service as a differentiator
BRAND LOVE
ENGAGEMENT
AFFORDABILITY
INNOVATION
WATER
JUICE
SPORTS
NEW CATEGORIES
CUSTOMER PROMISE
MARKET ASSETS
SERVICE OFFERING
CAPABILITY
Fast, Flexible and Efficient Supply Chain
12
Scale as #1 Drive segmentgrowth
Scale as #1 Participate for profit
Continue growth in Water volume & valuevia dual brand category ownership
Continue growth in Water volume & valuevia dual brand category ownership
New Zealand
3 year CCA CAGR:
0.0%
5.0%
10.0%
15.0%
20.0%
25.0%
Still Take Home Still SS Sparkling Flavoured
Volume Value
3 ye
ar C
AG
R C
han
ge
+10%volume
+8%value
For
per
sona
l use
onl
y
13
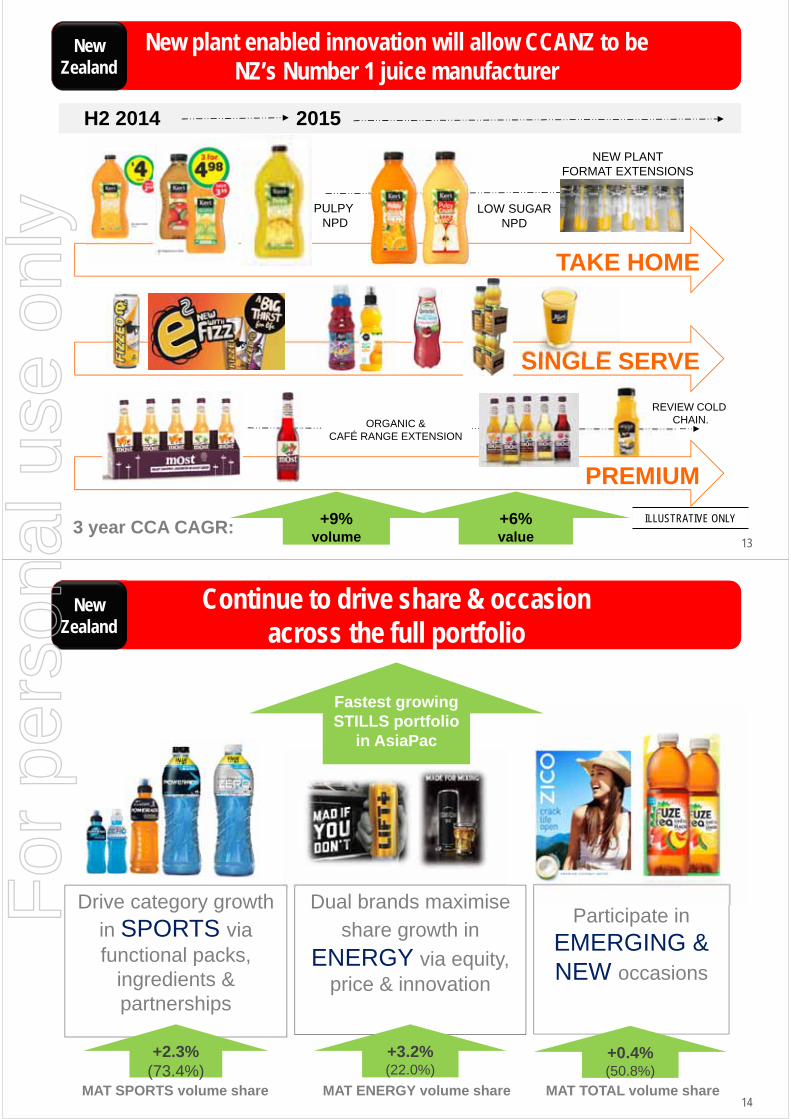
New plant enabled innovation will allow CCANZ to be NZ’s Number 1 juice manufacturer
New plant enabled innovation will allow CCANZ to be NZ’s Number 1 juice manufacturer
New Zealand
H2 2014 2015
+9%volume
+6%value
3 year CCA CAGR:
PREMIUM
ORGANIC &CAFÉ RANGE EXTENSION
REVIEW COLD CHAIN.
TAKE HOME
PULPY NPD
NEW PLANTFORMAT EXTENSIONS
LOW SUGARNPD
SINGLE SERVE
ILLUSTRATIVE ONLY
14
Continue to drive share & occasionacross the full portfolio
Continue to drive share & occasionacross the full portfolio
New Zealand
Drive category growth
in SPORTS via functional packs,
ingredients & partnerships
Dual brands maximise
share growth in
ENERGY via equity, price & innovation
Participate in
EMERGING & NEW occasions
Fastest growingSTILLS portfolio
in AsiaPac
+2.3%(73.4%)
+3.2%(22.0%)
MAT ENERGY volume shareMAT SPORTS volume share
+0.4%(50.8%)
MAT TOTAL volume share
For
per
sona
l use
onl
y
15
The Plan: Build a strong, diverse beverage portfolio, leveraging our scale, efficiency & route to market
The Plan: Build a strong, diverse beverage portfolio, leveraging our scale, efficiency & route to market
New Zealand
Grow SPARKLING transactions
Accelerate share growth in STILLS
CUSTOMER Service as a differentiator
BRAND LOVE
ENGAGEMENT
AFFORDABILITY
INNOVATION
WATER
JUICE
SPORTS
NEW CATEGORIES
CUSTOMER PROMISE
MARKET ASSETS
SERVICE OFFERING
CAPABILITY
Fast, Flexible and Efficient Supply Chain
16
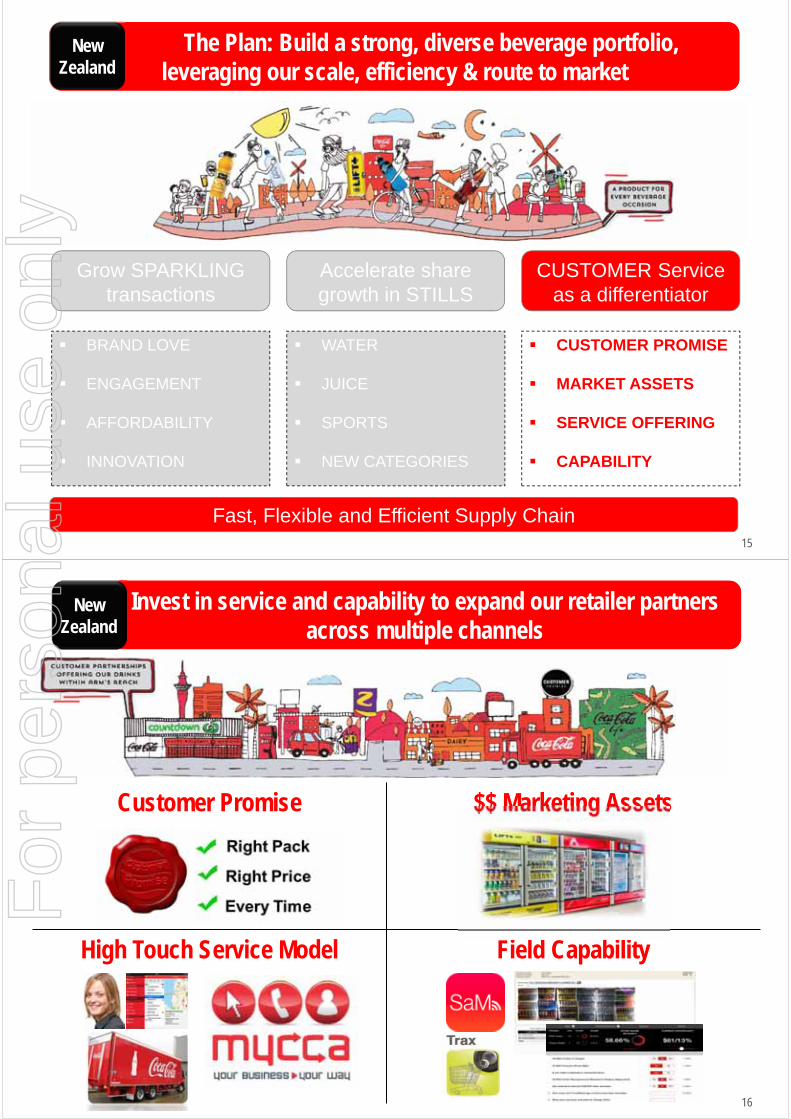
Invest in service and capability to expand our retailer partners across multiple channels
Invest in service and capability to expand our retailer partners across multiple channels
New Zealand
Customer Promise $$ Marketing Assets
High Touch Service Model Field Capability
For
per
sona
l use
onl
y
17
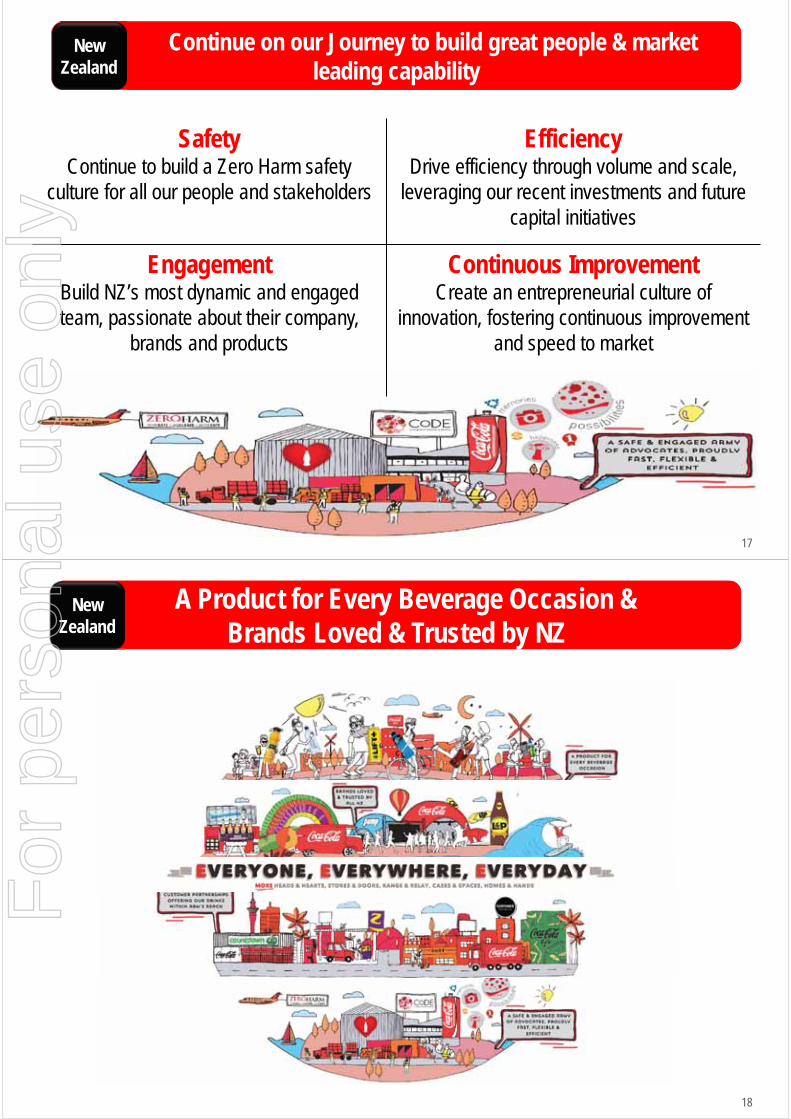
SafetyContinue to build a Zero Harm safety
culture for all our people and stakeholders
EfficiencyDrive efficiency through volume and scale,
leveraging our recent investments and future capital initiatives
EngagementBuild NZ’s most dynamic and engaged team, passionate about their company,
brands and products
Continuous ImprovementCreate an entrepreneurial culture of
innovation, fostering continuous improvementand speed to market
Continue on our Journey to build great people & market leading capability
Continue on our Journey to build great people & market leading capability
New Zealand
18
A Product for Every Beverage Occasion & Brands Loved & Trusted by NZ
A Product for Every Beverage Occasion & Brands Loved & Trusted by NZ
New Zealand
For
per
sona
l use
onl
y
1919
DisclaimerCCA advises that these presentation slides contain forward looking statements which may be subject to significant uncertainties outside of CCA’s control.
No representation is made as to the accuracy or reliability of forward looking statements or the assumptions on which they are based.
Actual future events may vary from these forward looking statements and you are cautioned not to place undue reliance on any forward looking statement.
For
per
sona
l use
onl
y
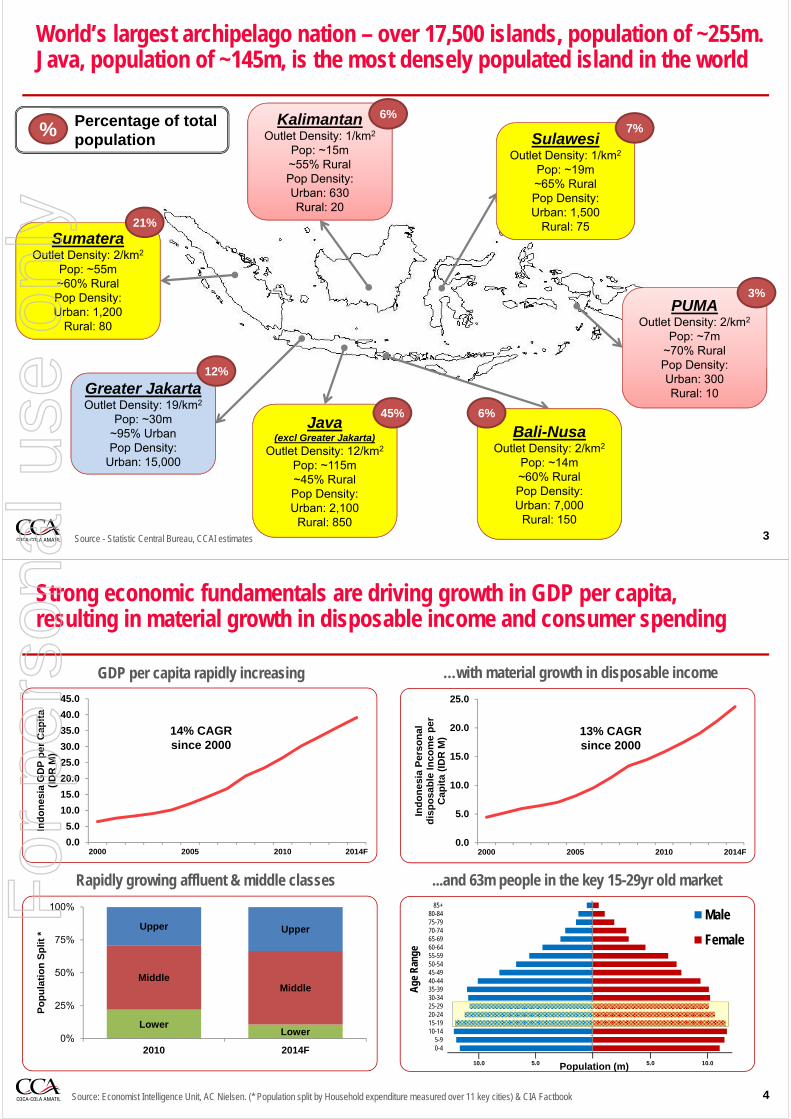
Kadir Gunduz Managing Director, Indonesia & PNG
CCA Investor BriefingIndonesia30 October 2014
Indonesian Strategy Update
• Indonesia is a big, long-term opportunity
– Large population, favourable demographics, strong GDP growth
– Large manufacturing footprint, extensive distribution network and wide product range, puts us in a strong position to capture this opportunity
• The operating environment however continues to be challenging
– Increasingly fragmented competitive landscape
– Difficult but typical emerging market macro conditions putting significant pressure on costs, e.g. inflation, FX
• We are investing (as a system) in Indonesia to win, transforming our business to further leverage our existing footprint, to be in a leading position and to be leaner and more competitive
‒ Transform route-to-market model
‒ Refine revenue management
‒ Cost-out, drive efficiency and productivity
• We are following a road map strategy. Early signs are positive
2
For
per
sona
l use
onl
y
World’s largest archipelago nation – over 17,500 islands, population of ~255m. Java, population of ~145m, is the most densely populated island in the world
3Source - Statistic Central Bureau, CCAI estimates
Greater JakartaOutlet Density: 19/km2
Pop: ~30m~95% UrbanPop Density:
Urban: 15,000
SumateraOutlet Density: 2/km2
Pop: ~55m~60% RuralPop Density:Urban: 1,200
Rural: 80
KalimantanOutlet Density: 1/km2
Pop: ~15m~55% RuralPop Density:Urban: 630Rural: 20
Java (excl Greater Jakarta)
Outlet Density: 12/km2
Pop: ~115m~45% RuralPop Density:Urban: 2,100
Rural: 850
Bali-NusaOutlet Density: 2/km2
Pop: ~14m~60% RuralPop Density:Urban: 7,000
Rural: 150
SulawesiOutlet Density: 1/km2
Pop: ~19m~65% RuralPop Density:Urban: 1,500
Rural: 7521%
12%
45% 6%
6%7%
PUMAOutlet Density: 2/km2
Pop: ~7m~70% RuralPop Density:Urban: 300Rural: 10
3%
% Percentage of total population
Strong economic fundamentals are driving growth in GDP per capita, resulting in material growth in disposable income and consumer spending
4
Rapidly growing affluent & middle classes ...and 63m people in the key 15-29yr old market
…with material growth in disposable income
Source: Economist Intelligence Unit, AC Nielsen. (* Population split by Household expenditure measured over 11 key cities) & CIA Factbook
GDP per capita rapidly increasing
0.0
5.0
10.0
15.0
20.0
25.0
30.0
35.0
40.0
45.0
2000 2005 2010 2014F
Ind
on
esia
GD
P p
er C
apit
a (I
DR
M)
0.0
5.0
10.0
15.0
20.0
25.0
2000 2005 2010 2014F
Ind
on
esia
Per
son
al
dis
po
sab
le In
com
e p
er
Cap
ita
(ID
R M
)
14% CAGR since 2000
13% CAGR since 2000
LowerLower
MiddleMiddle
Upper Upper
0%
25%
50%
75%
100%
2010 2014F
Po
pu
lati
on
Sp
lit *
0-45-9
10-1415-1920-2425-2930-3435-3940-4445-4950-5455-5960-6465-6970-7475-7980-84
85+
Age
Ran
ge
Male
Female
10.0 5.0 5.0 10.0Population (m)
For
per
sona
l use
onl
y
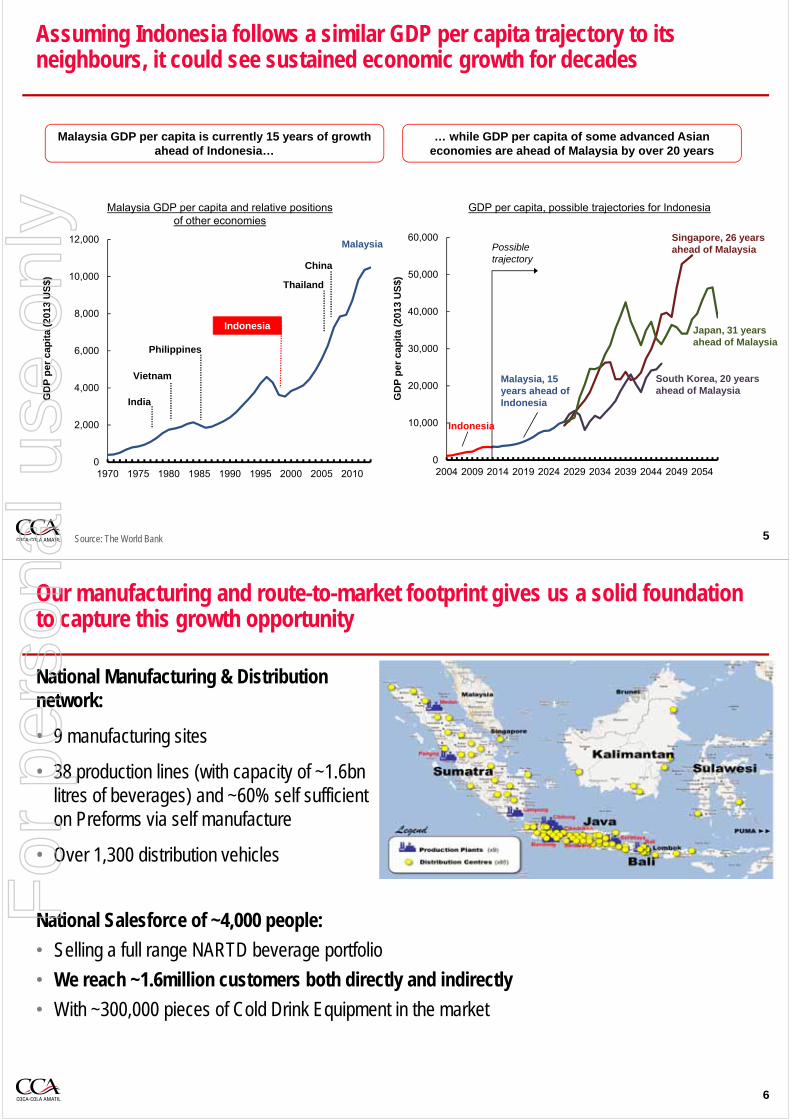
Assuming Indonesia follows a similar GDP per capita trajectory to its neighbours, it could see sustained economic growth for decades
0
2,000
4,000
6,000
8,000
10,000
12,000
1970 1975 1980 1985 1990 1995 2000 2005 2010
5
Indonesia
India
Vietnam
Philippines
Malaysia
Thailand
China
0
10,000
20,000
30,000
40,000
50,000
60,000
2004 2009 2014 2019 2024 2029 2034 2039 2044 2049 2054
Possibletrajectory
Indonesia
Malaysia, 15 years ahead of Indonesia
Singapore, 26 yearsahead of Malaysia
Japan, 31 yearsahead of Malaysia
South Korea, 20 yearsahead of Malaysia
Malaysia GDP per capita and relative positions of other economies
GDP per capita, possible trajectories for Indonesia
Source: The World Bank
Malaysia GDP per capita is currently 15 years of growth ahead of Indonesia…
… while GDP per capita of some advanced Asian economies are ahead of Malaysia by over 20 years
GD
P p
er c
apit
a (2
013
US
$)
GD
P p
er c
apit
a (2
013
US
$)
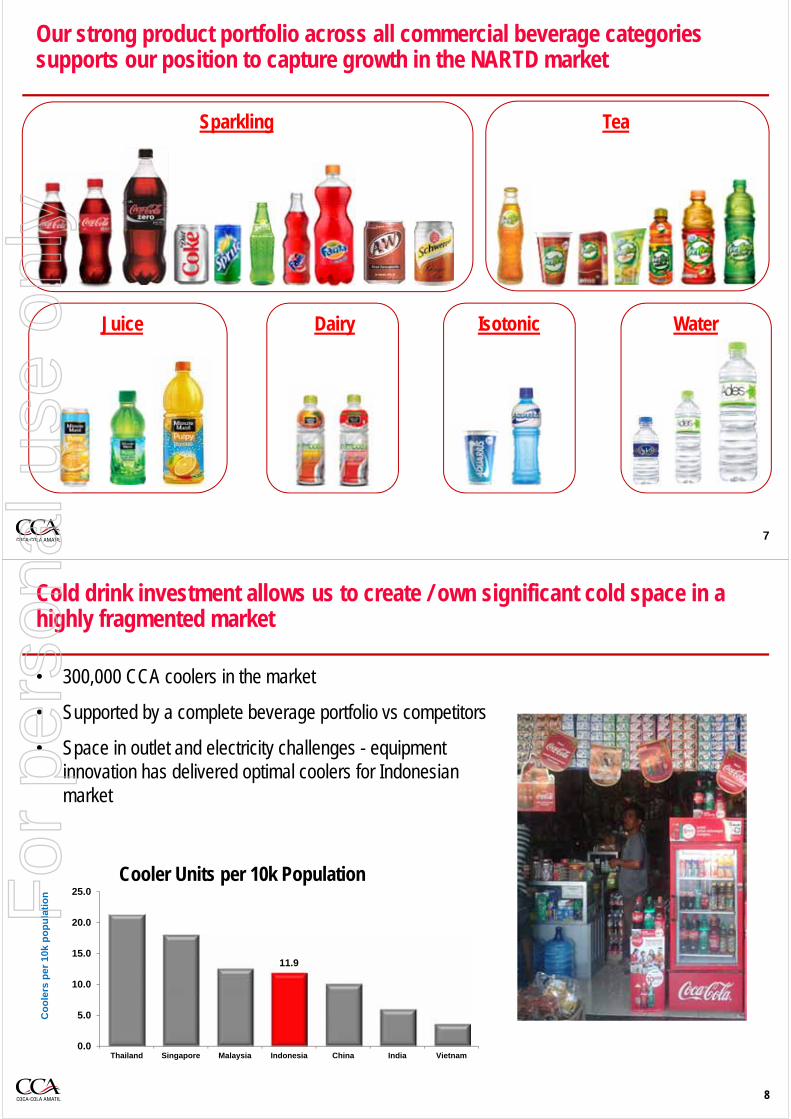
Our manufacturing and route-to-market footprint gives us a solid foundation to capture this growth opportunity
National Manufacturing & Distribution network:
• 9 manufacturing sites
• 38 production lines (with capacity of ~1.6bn litres of beverages) and ~60% self sufficient on Preforms via self manufacture
• Over 1,300 distribution vehicles
6
National Salesforce of ~4,000 people:
• Selling a full range NARTD beverage portfolio
• We reach ~1.6million customers both directly and indirectly
• With ~300,000 pieces of Cold Drink Equipment in the market
For
per
sona
l use
onl
y
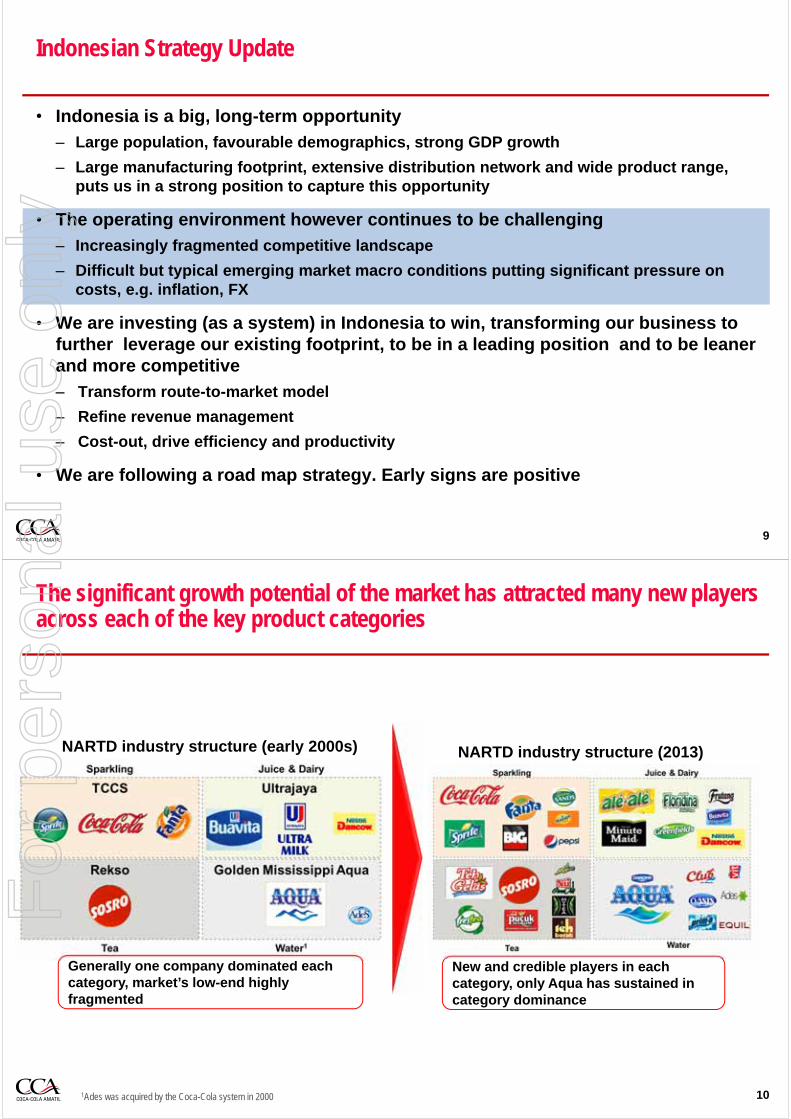
Our strong product portfolio across all commercial beverage categories supports our position to capture growth in the NARTD market
7
Sparkling
WaterJuice
Tea
IsotonicDairy
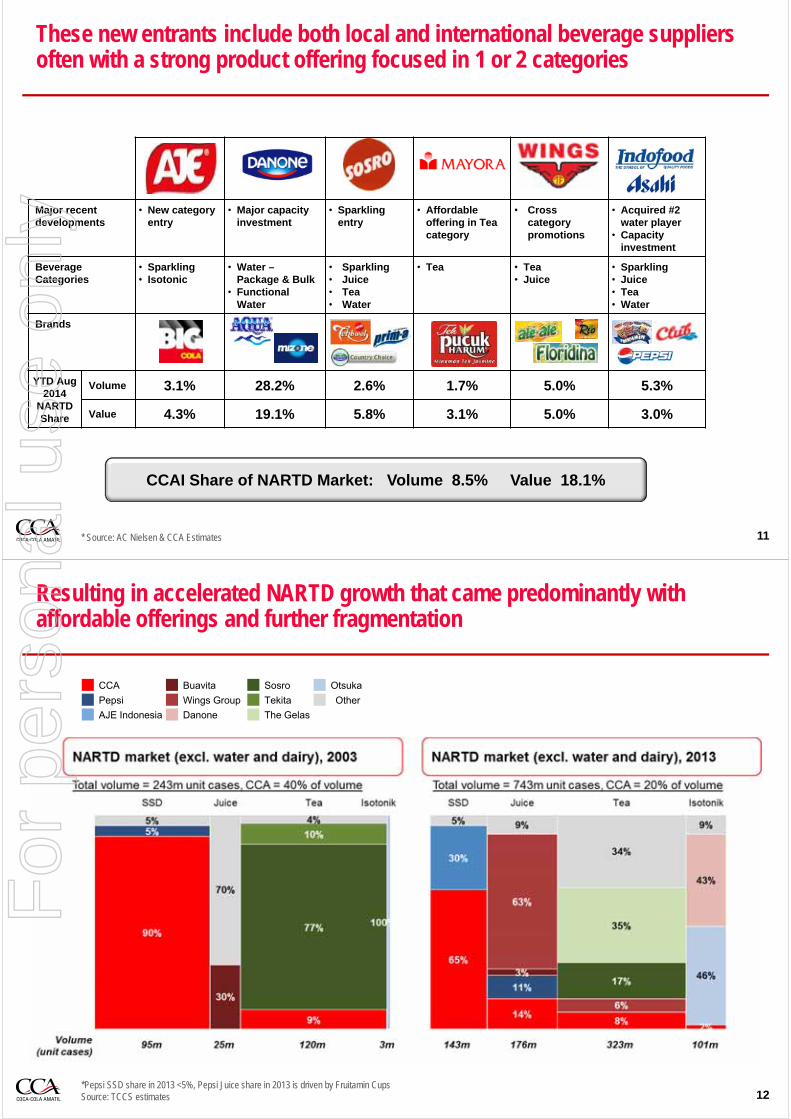
Cold drink investment allows us to create / own significant cold space in a highly fragmented market
• 300,000 CCA coolers in the market
• Supported by a complete beverage portfolio vs competitors
• Space in outlet and electricity challenges - equipment innovation has delivered optimal coolers for Indonesian market
8
11.9
0.0
5.0
10.0
15.0
20.0
25.0
Thailand Singapore Malaysia Indonesia China India Vietnam
Co
ole
rs p
er 1
0k p
op
ula
tio
n
Cooler Units per 10k PopulationFor
per
sona
l use
onl
y
• Indonesia is a big, long-term opportunity
– Large population, favourable demographics, strong GDP growth
– Large manufacturing footprint, extensive distribution network and wide product range, puts us in a strong position to capture this opportunity
• The operating environment however continues to be challenging
– Increasingly fragmented competitive landscape
– Difficult but typical emerging market macro conditions putting significant pressure on costs, e.g. inflation, FX
• We are investing (as a system) in Indonesia to win, transforming our business to further leverage our existing footprint, to be in a leading position and to be leaner and more competitive
‒ Transform route-to-market model
‒ Refine revenue management
‒ Cost-out, drive efficiency and productivity
• We are following a road map strategy. Early signs are positive
9
Indonesian Strategy Update
The significant growth potential of the market has attracted many new players across each of the key product categories
10
Generally one company dominated each category, market’s low-end highly fragmented
NARTD industry structure (early 2000s)
New and credible players in each category, only Aqua has sustained in category dominance
NARTD industry structure (2013)
1Ades was acquired by the Coca-Cola system in 2000
For
per
sona
l use
onl
y
These new entrants include both local and international beverage suppliers often with a strong product offering focused in 1 or 2 categories
11* Source: AC Nielsen & CCA Estimates
Major recentdevelopments
• New category entry
• Major capacityinvestment
• Sparkling entry
• Affordable offering in Tea category
• Cross category promotions
• Acquired #2 water player
• Capacityinvestment
Beverage Categories
• Sparkling• Isotonic
• Water –Package & Bulk
• Functional Water
• Sparkling• Juice• Tea• Water
• Tea • Tea• Juice
• Sparkling• Juice• Tea• Water
Brands
YTD Aug 2014
NARTD Share
Volume 3.1% 28.2% 2.6% 1.7% 5.0% 5.3%
Value 4.3% 19.1% 5.8% 3.1% 5.0% 3.0%
CCAI Share of NARTD Market: Volume 8.5% Value 18.1%
Resulting in accelerated NARTD growth that came predominantly with affordable offerings and further fragmentation
12*Pepsi SSD share in 2013 <5%, Pepsi Juice share in 2013 is driven by Fruitamin CupsSource: TCCS estimates
SosroCCA
Pepsi
AJE Indonesia
OtsukaBuavita
Wings Group
Danone
OtherTekita
The Gelas
For
per
sona
l use
onl
y
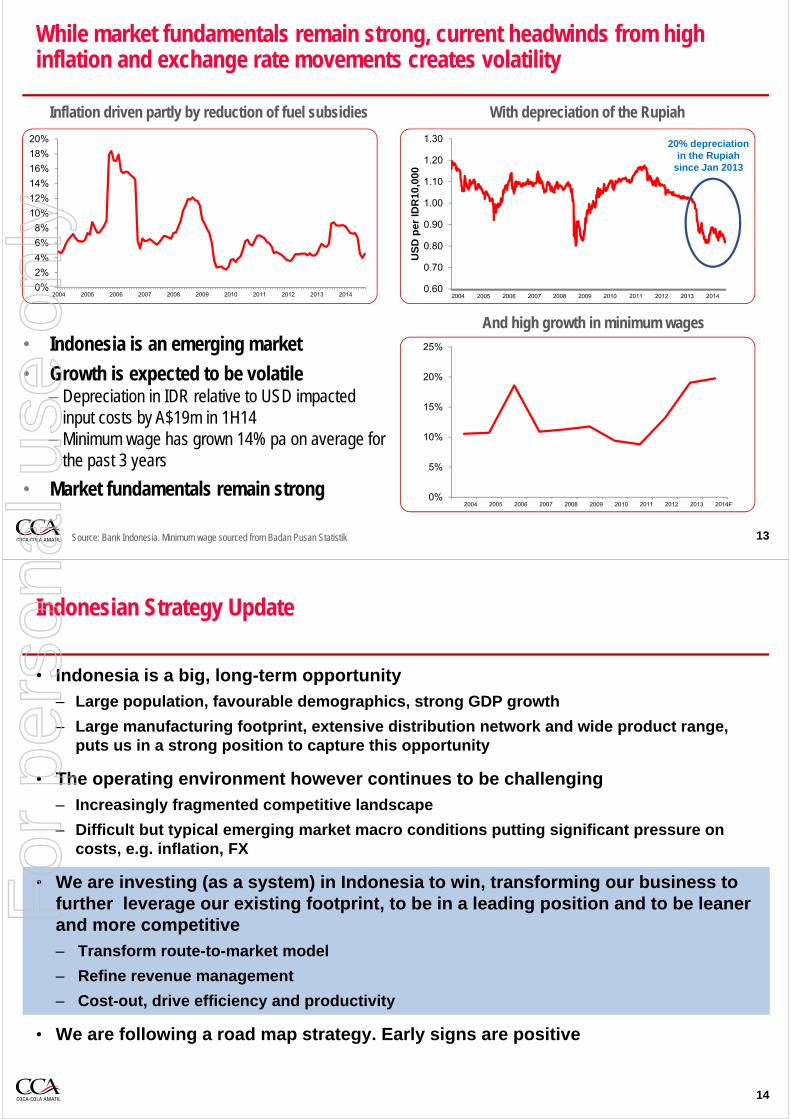
While market fundamentals remain strong, current headwinds from high inflation and exchange rate movements creates volatility
13
0%
2%
4%
6%
8%
10%
12%
14%
16%
18%
20%
2004 2005 2006 2007 2008 2009 2010 2011 2012 2013 2014
Inflation driven partly by reduction of fuel subsidies
0.60
0.70
0.80
0.90
1.00
1.10
1.20
1.30
US
D p
er I
DR
10,0
00
With depreciation of the Rupiah
0%
5%
10%
15%
20%
25%
And high growth in minimum wages
Source: Bank Indonesia. Minimum wage sourced from Badan Pusan Statistik
• Indonesia is an emerging market
• Growth is expected to be volatile– Depreciation in IDR relative to USD impacted
input costs by A$19m in 1H14– Minimum wage has grown 14% pa on average for
the past 3 years
• Market fundamentals remain strong
20% depreciation in the Rupiah
since Jan 2013
• Indonesia is a big, long-term opportunity
– Large population, favourable demographics, strong GDP growth
– Large manufacturing footprint, extensive distribution network and wide product range, puts us in a strong position to capture this opportunity
• The operating environment however continues to be challenging
– Increasingly fragmented competitive landscape
– Difficult but typical emerging market macro conditions putting significant pressure on costs, e.g. inflation, FX
• We are investing (as a system) in Indonesia to win, transforming our business to further leverage our existing footprint, to be in a leading position and to be leaner and more competitive
‒ Transform route-to-market model
‒ Refine revenue management
‒ Cost-out, drive efficiency and productivity
• We are following a road map strategy. Early signs are positive
14
Indonesian Strategy Update
For
per
sona
l use
onl
y
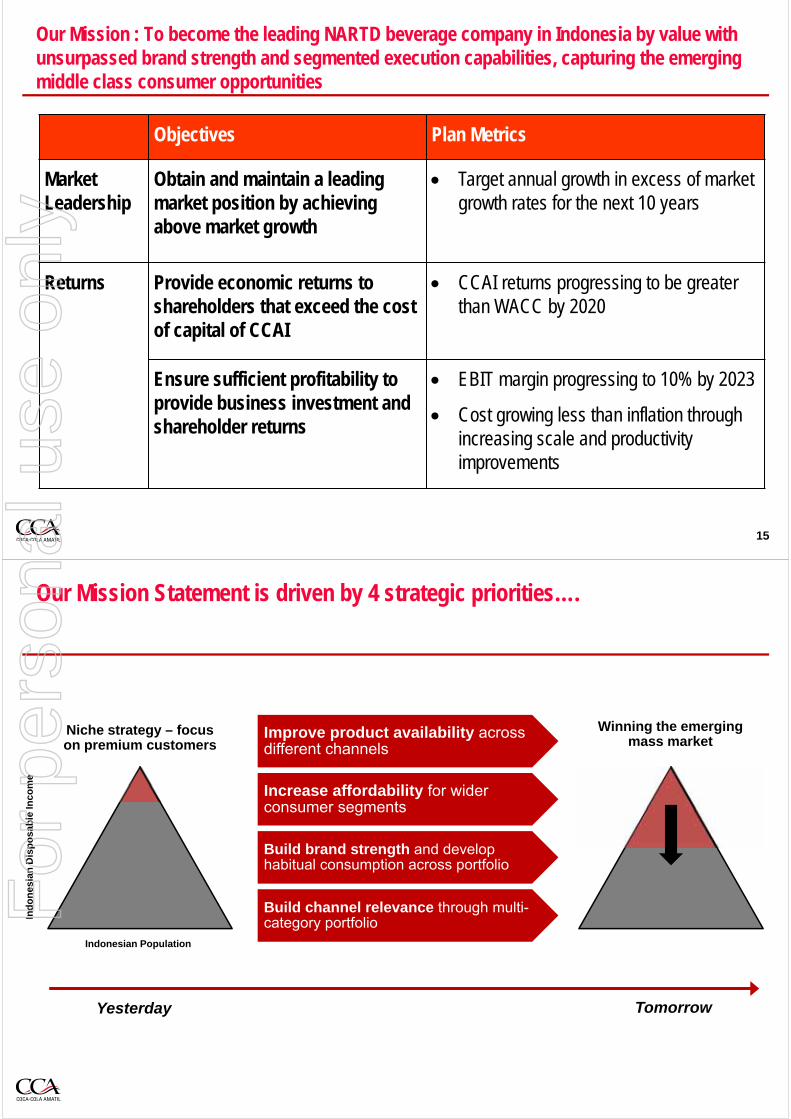
Our Mission : To become the leading NARTD beverage company in Indonesia by value with unsurpassed brand strength and segmented execution capabilities, capturing the emerging middle class consumer opportunities
15
Objectives Plan Metrics
MarketLeadership
Obtain and maintain a leading market position by achieving above market growth
Target annual growth in excess of market growth rates for the next 10 years
Returns Provide economic returns to shareholders that exceed the cost of capital of CCAI
CCAI returns progressing to be greater than WACC by 2020
Ensure sufficient profitability to provide business investment and shareholder returns
EBIT margin progressing to 10% by 2023
Cost growing less than inflation through increasing scale and productivity improvements
Our Mission Statement is driven by 4 strategic priorities….
Niche strategy – focus on premium customers
Winning the emerging mass market
Yesterday Tomorrow
Improve product availability across different channels
Increase affordability for wider consumer segments
Build brand strength and develop habitual consumption across portfolio
Build channel relevance through multi-category portfolio
Indonesian Population
Ind
on
esia
n D
isp
osa
ble
Inco
me
For
per
sona
l use
onl
y
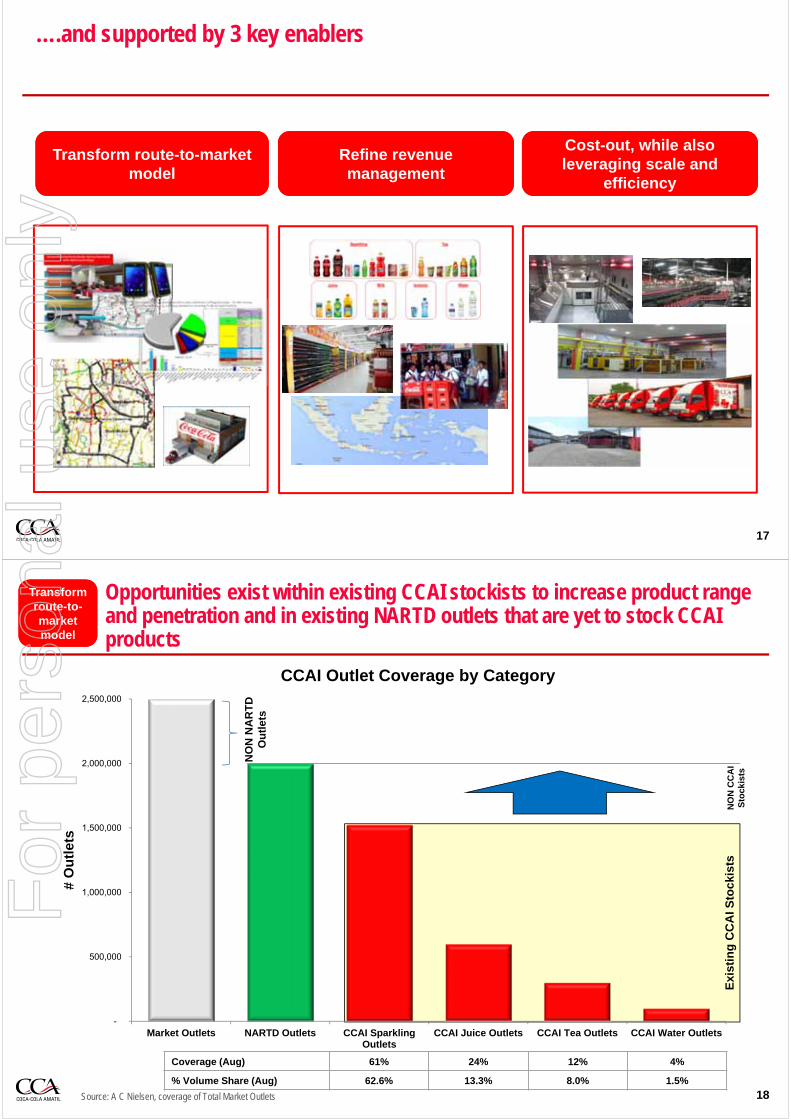
….and supported by 3 key enablers
17
Transform route-to-market model
Refine revenue management
Cost-out, while also leveraging scale and
efficiency
-
500,000
1,000,000
1,500,000
2,000,000
2,500,000
Market Outlets NARTD Outlets CCAI SparklingOutlets
CCAI Juice Outlets CCAI Tea Outlets CCAI Water Outlets
# O
utl
ets
CCAI Outlet Coverage by Category
Opportunities exist within existing CCAI stockists to increase product range and penetration and in existing NARTD outlets that are yet to stock CCAI products
18Source: A C Nielsen, coverage of Total Market Outlets
Exi
stin
g C
CA
I Sto
ckis
tsN
ON
CC
AI
Sto
ckis
ts
NO
N N
AR
TD
O
utl
ets
Coverage (Aug) 61% 24% 12% 4%
% Volume Share (Aug) 62.6% 13.3% 8.0% 1.5%
Transform route-to-market model
Transform route-to-market model
For
per
sona
l use
onl
y
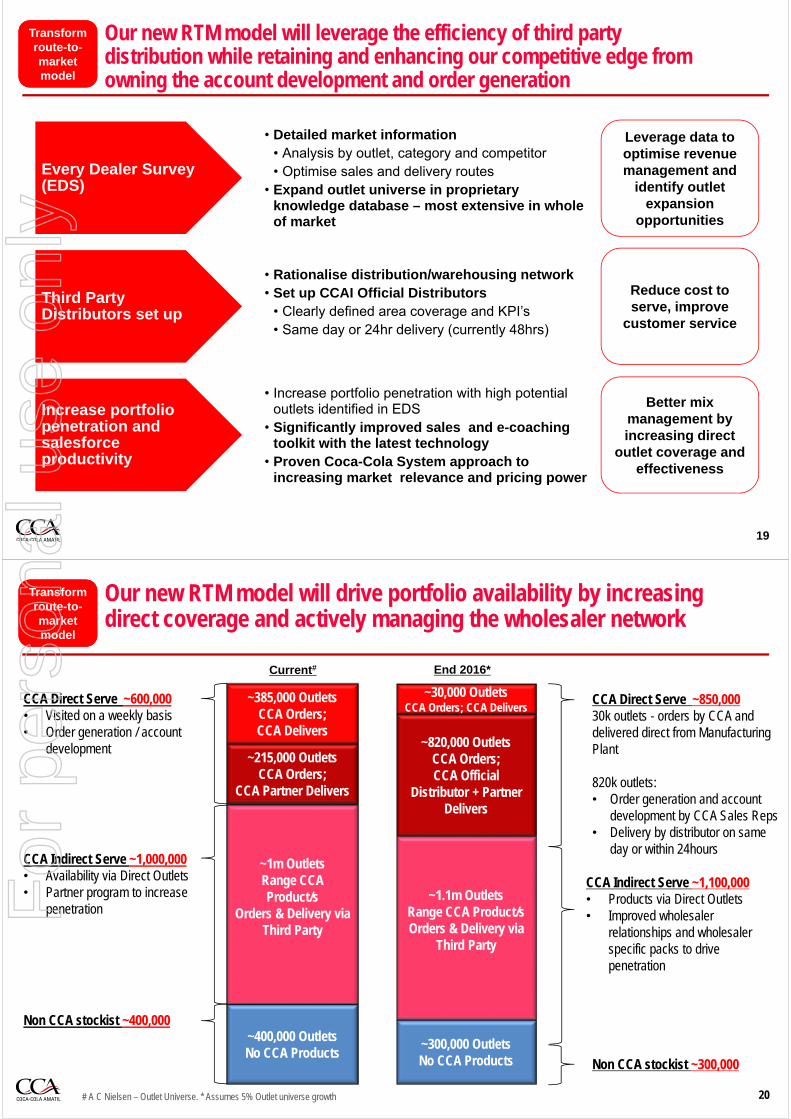
Our new RTM model will leverage the efficiency of third party distribution while retaining and enhancing our competitive edge from owning the account development and order generation
19
• Detailed market information• Analysis by outlet, category and competitor• Optimise sales and delivery routes
• Expand outlet universe in proprietary knowledge database – most extensive in whole of market
Every Dealer Survey (EDS)
• Rationalise distribution/warehousing network• Set up CCAI Official Distributors
• Clearly defined area coverage and KPI’s• Same day or 24hr delivery (currently 48hrs)
Third Party Distributors set up
• Increase portfolio penetration with high potential outlets identified in EDS
• Significantly improved sales and e-coaching toolkit with the latest technology
• Proven Coca-Cola System approach to increasing market relevance and pricing power
Increase portfolio penetration and salesforce productivity
Leverage data to optimise revenue management and
identify outlet expansion
opportunities
Reduce cost to serve, improve
customer service
Better mix management by increasing direct
outlet coverage and effectiveness
Transform route-to-market model
Transform route-to-market model
Our new RTM model will drive portfolio availability by increasing direct coverage and actively managing the wholesaler network
20# A C Nielsen – Outlet Universe. * Assumes 5% Outlet universe growth
~1m OutletsRange CCA Product/s
Orders & Delivery via Third Party
~400,000 OutletsNo CCA Products
~385,000 OutletsCCA Orders; CCA Delivers
~215,000 OutletsCCA Orders;
CCA Partner Delivers
CCA Indirect Serve ~1,000,000• Availability via Direct Outlets• Partner program to increase
penetration
CCA Direct Serve ~600,000• Visited on a weekly basis• Order generation / account
development
Non CCA stockist ~400,000
Transform route-to-market model
Transform route-to-market model
~1.1m OutletsRange CCA Product/sOrders & Delivery via
Third Party
~30,000 OutletsCCA Orders; CCA Delivers
~820,000 OutletsCCA Orders; CCA Official
Distributor + Partner Delivers
CCA Direct Serve ~850,00030k outlets - orders by CCA and delivered direct from Manufacturing Plant
820k outlets:• Order generation and account
development by CCA Sales Reps• Delivery by distributor on same
day or within 24hours
CCA Indirect Serve ~1,100,000• Products via Direct Outlets• Improved wholesaler
relationships and wholesaler specific packs to drive penetration
Current# End 2016*
~300,000 OutletsNo CCA Products Non CCA stockist ~300,000
For
per
sona
l use
onl
y
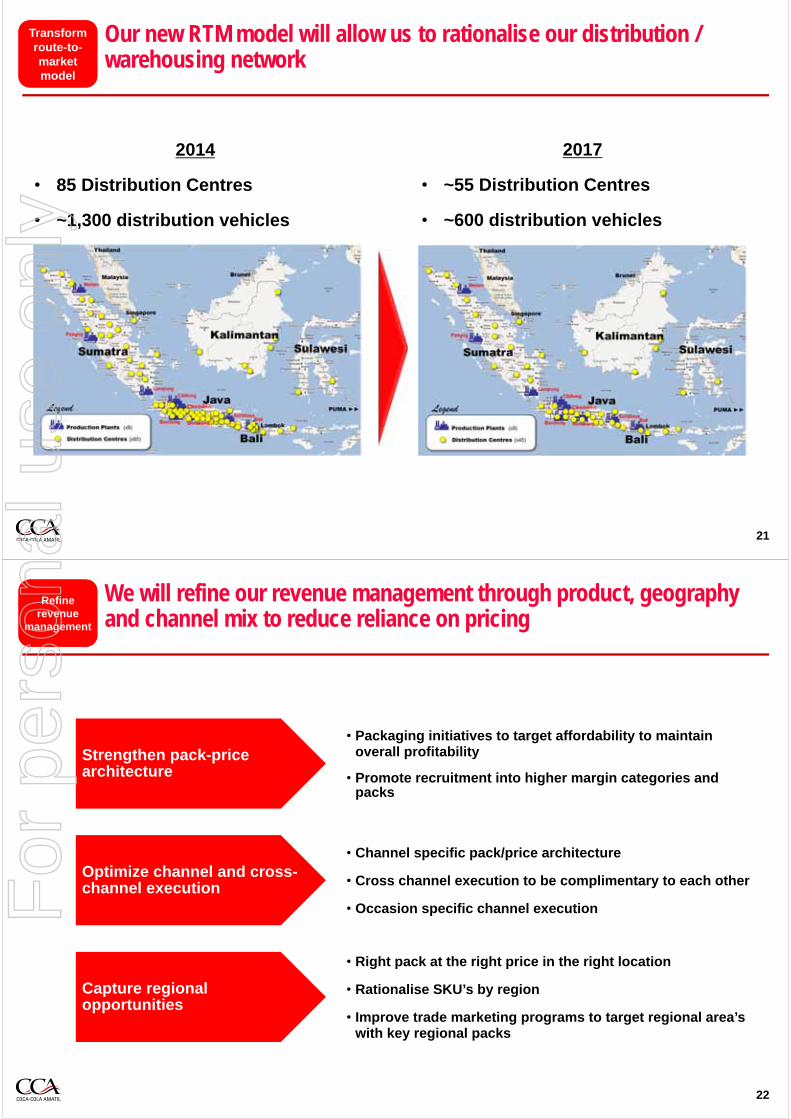
Our new RTM model will allow us to rationalise our distribution / warehousing network
21
2017
• ~55 Distribution Centres
• ~600 distribution vehicles
2014
• 85 Distribution Centres
• ~1,300 distribution vehicles
Transform route-to-market model
Transform route-to-market model
We will refine our revenue management through product, geography and channel mix to reduce reliance on pricing
22
Refinerevenue
management
Refinerevenue
management
• Packaging initiatives to target affordability to maintain overall profitability
• Promote recruitment into higher margin categories and packs
Strengthen pack-price architecture
• Channel specific pack/price architecture
• Cross channel execution to be complimentary to each other
• Occasion specific channel execution
Optimize channel and cross-channel execution
• Right pack at the right price in the right location
• Rationalise SKU’s by region
• Improve trade marketing programs to target regional area’s with key regional packs
Capture regional opportunities
For
per
sona
l use
onl
y
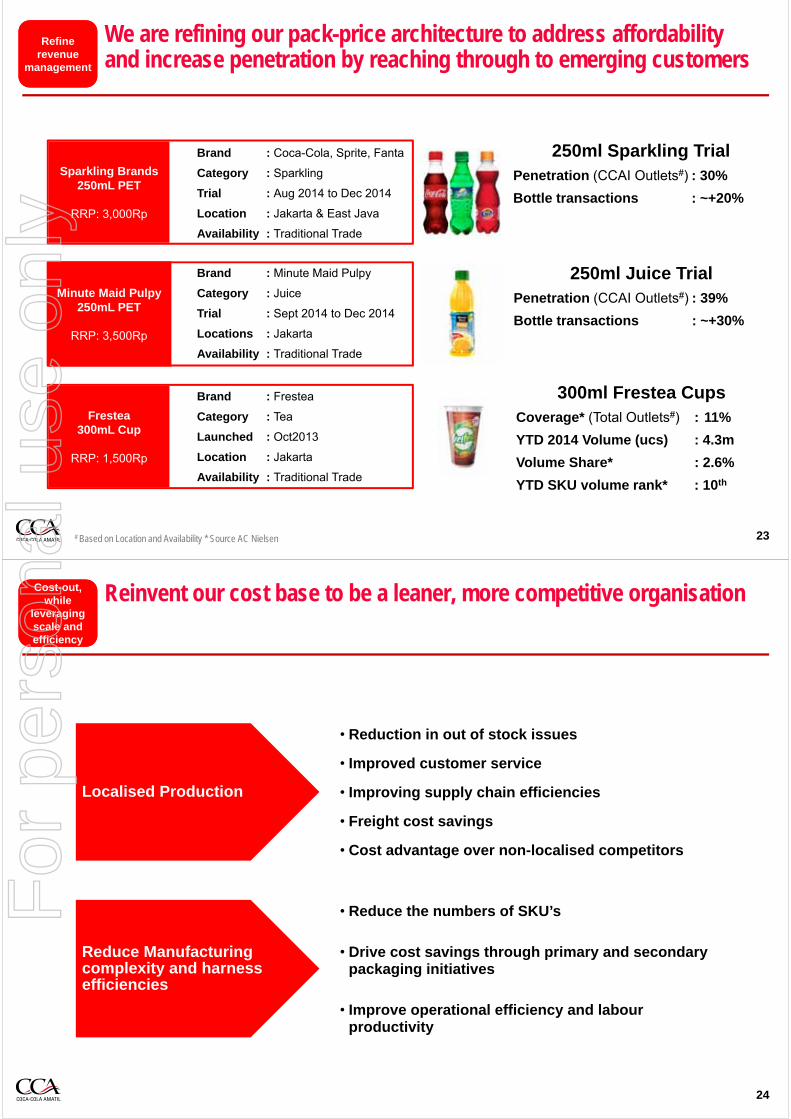
We are refining our pack-price architecture to address affordability and increase penetration by reaching through to emerging customers
23
Refinerevenue
management
Refinerevenue
management
Brand : Minute Maid Pulpy
Category : Juice
Trial : Sept 2014 to Dec 2014
Locations : Jakarta
Availability : Traditional Trade
Minute Maid Pulpy250mL PET
RRP: 3,500Rp
250ml Juice TrialPenetration (CCAI Outlets#) : 39%
Bottle transactions : ~+30%
Brand : Coca-Cola, Sprite, Fanta
Category : Sparkling
Trial : Aug 2014 to Dec 2014
Location : Jakarta & East Java
Availability : Traditional Trade
Sparkling Brands250mL PET
RRP: 3,000Rp
Brand : Frestea
Category : Tea
Launched : Oct2013
Location : Jakarta
Availability : Traditional Trade
Frestea300mL Cup
RRP: 1,500Rp
300ml Frestea CupsCoverage* (Total Outlets#) : 11%
YTD 2014 Volume (ucs) : 4.3m
Volume Share* : 2.6%
YTD SKU volume rank* : 10th
# Based on Location and Availability * Source AC Nielsen
250ml Sparkling TrialPenetration (CCAI Outlets#) : 30%
Bottle transactions : ~+20%
Reinvent our cost base to be a leaner, more competitive organisation
24
Cost-out, while
leveraging scale and efficiency
Cost-out, while
leveraging scale and efficiency
• Reduction in out of stock issues
• Improved customer service
• Improving supply chain efficiencies
• Freight cost savings
• Cost advantage over non-localised competitors
Localised Production
• Reduce the numbers of SKU’s
• Drive cost savings through primary and secondary packaging initiatives
• Improve operational efficiency and labourproductivity
Reduce Manufacturing complexity and harness efficiencies
For
per
sona
l use
onl
y
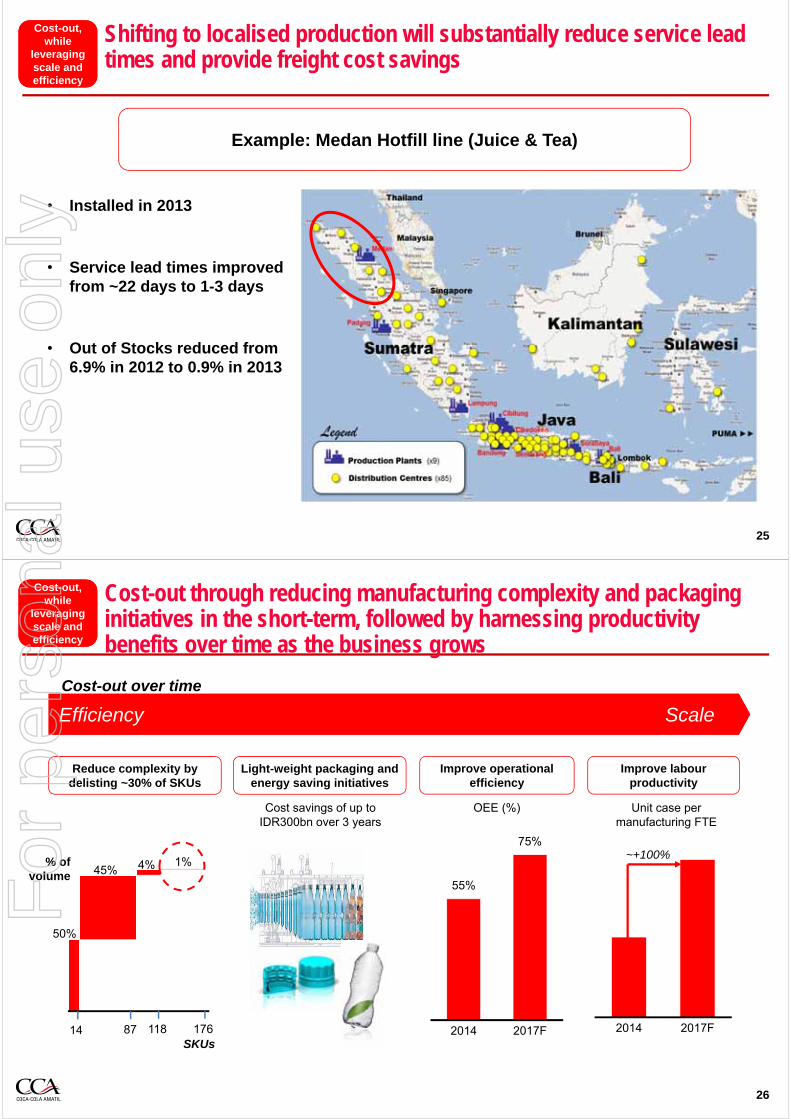
Shifting to localised production will substantially reduce service leadtimes and provide freight cost savings
25
Cost-out, while
leveraging scale and efficiency
Cost-out, while
leveraging scale and efficiency
• Installed in 2013
• Service lead times improvedfrom ~22 days to 1-3 days
• Out of Stocks reduced from 6.9% in 2012 to 0.9% in 2013
Example: Medan Hotfill line (Juice & Tea)
Cost-out through reducing manufacturing complexity and packaging initiatives in the short-term, followed by harnessing productivity benefits over time as the business grows
55%
75%
2014 2017F
26
Cost-out, while
leveraging scale and efficiency
Cost-out, while
leveraging scale and efficiency
OEE (%) Unit case per manufacturing FTE
2014 2017F
50%
45% 4% 1%
14 87 118 176SKUs
% of volume
Reduce complexity by delisting ~30% of SKUs
Improve operational efficiency
Improve labour productivity
~+100%
Efficiency Scale
Cost-out over time
Light-weight packaging and energy saving initiatives
Cost savings of up to IDR300bn over 3 years
For
per
sona
l use
onl
y

Portfolio Priorities: Win in Sparkling, Juice and RTD Tea
27
Build Brand Strength
Build Brand Strength
Sparkling: Develop Consumption Occasions
28
Build Brand Strength
Build Brand Strength
For
per
sona
l use
onl
y
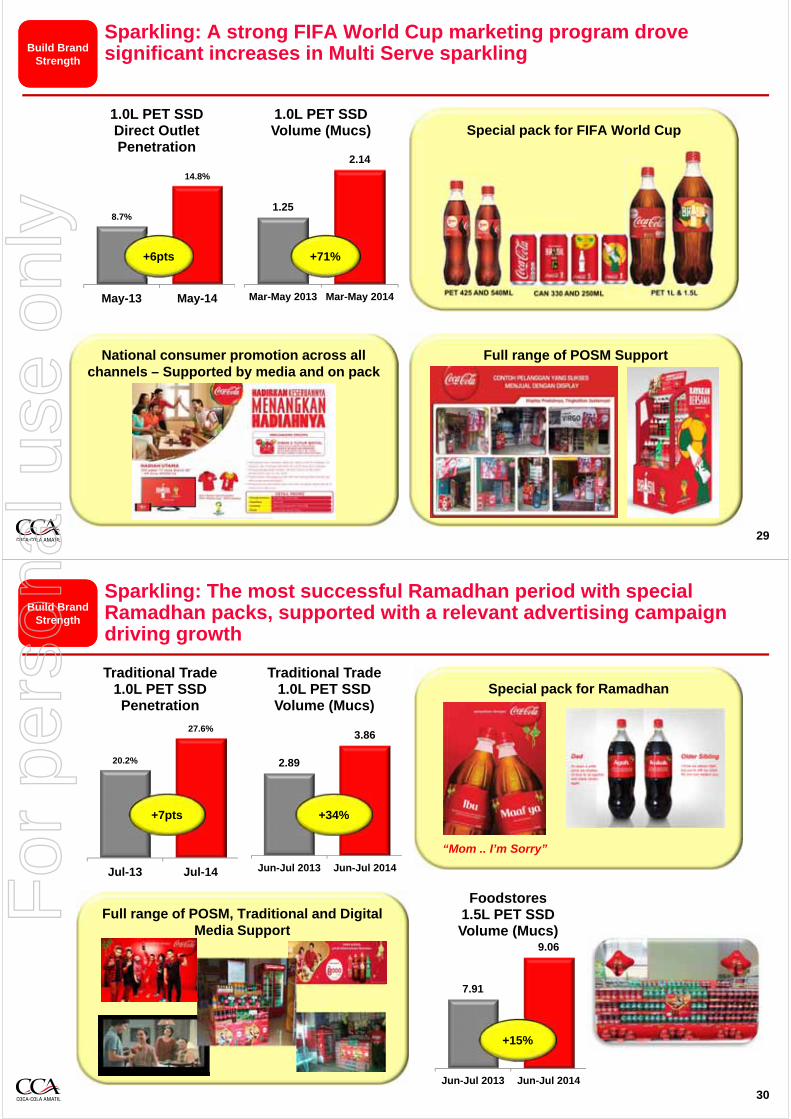
Sparkling: A strong FIFA World Cup marketing program drove significant increases in Multi Serve sparkling
29
National consumer promotion across all channels – Supported by media and on pack
Special pack for FIFA World Cup
Full range of POSM Support
8.7%
14.8%
May-13 May-14
1.0L PET SSD Direct Outlet Penetration
1.25
2.14
Mar-May 2013 Mar-May 2014
1.0L PET SSD Volume (Mucs)
+6pts +71%
Build Brand Strength
Build Brand Strength
Sparkling: The most successful Ramadhan period with special Ramadhan packs, supported with a relevant advertising campaign driving growth
30
20.2%
27.6%
Jul-13 Jul-14
Traditional Trade 1.0L PET SSD Penetration
2.89
3.86
Jun-Jul 2013 Jun-Jul 2014
Traditional Trade 1.0L PET SSD Volume (Mucs)
+7pts +34%
Special pack for Ramadhan
Full range of POSM, Traditional and Digital Media Support
“Mom .. I’m Sorry”
Build Brand Strength
Build Brand Strength
7.91
9.06
Jun-Jul 2013 Jun-Jul 2014
Foodstores1.5L PET SSD Volume (Mucs)
+15%
For
per
sona
l use
onl
y
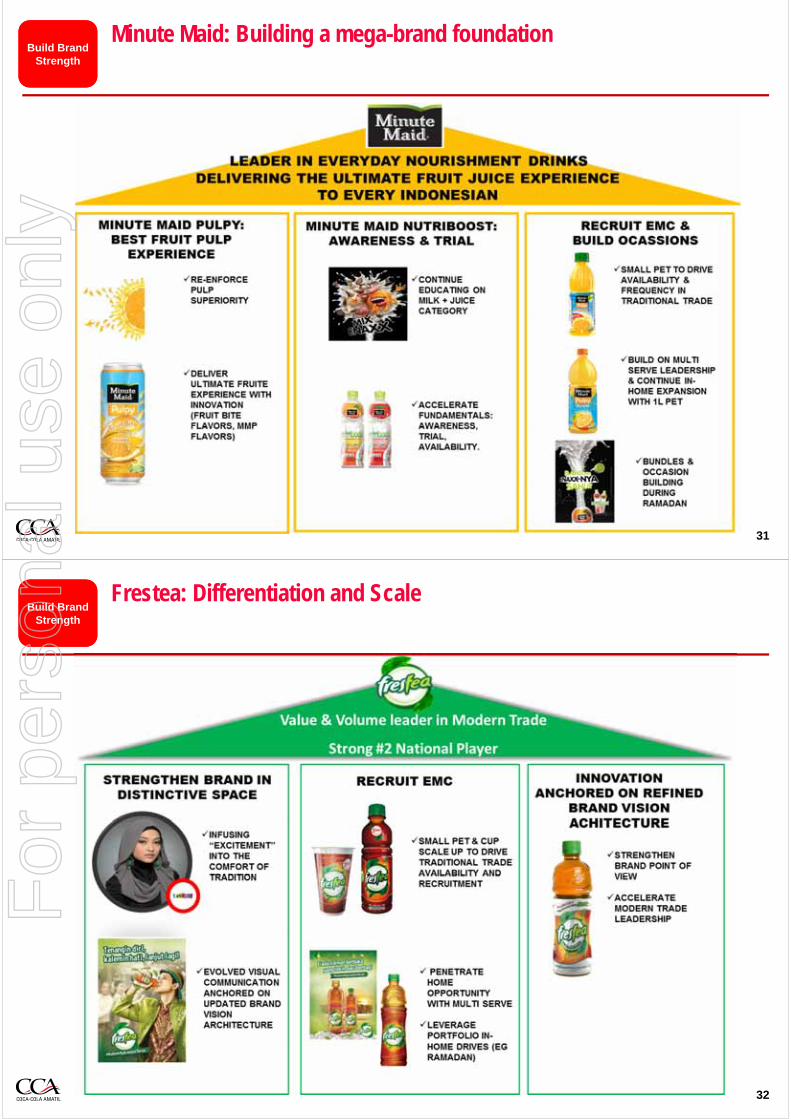
Minute Maid: Building a mega-brand foundation
31
Build Brand Strength
Build Brand Strength
Frestea: Differentiation and Scale
32
Build Brand Strength
Build Brand Strength
For
per
sona
l use
onl
y
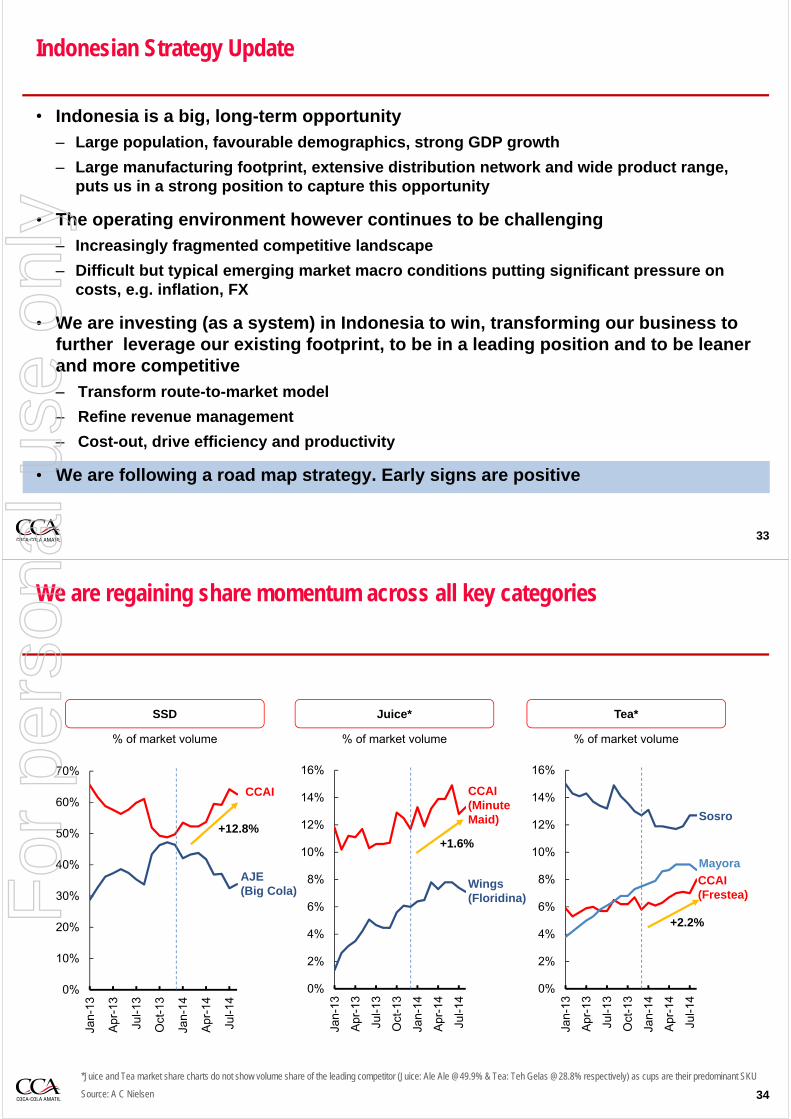
• Indonesia is a big, long-term opportunity
– Large population, favourable demographics, strong GDP growth
– Large manufacturing footprint, extensive distribution network and wide product range, puts us in a strong position to capture this opportunity
• The operating environment however continues to be challenging
– Increasingly fragmented competitive landscape
– Difficult but typical emerging market macro conditions putting significant pressure on costs, e.g. inflation, FX
• We are investing (as a system) in Indonesia to win, transforming our business to further leverage our existing footprint, to be in a leading position and to be leaner and more competitive
‒ Transform route-to-market model
‒ Refine revenue management
‒ Cost-out, drive efficiency and productivity
• We are following a road map strategy. Early signs are positive
33
Indonesian Strategy Update
We are regaining share momentum across all key categories
0%
10%
20%
30%
40%
50%
60%
70%
Jan-
13
Apr
-13
Jul-1
3
Oct
-13
Jan-
14
Apr
-14
Jul-1
4
34
*Juice and Tea market share charts do not show volume share of the leading competitor (Juice: Ale Ale @49.9% & Tea: Teh Gelas @28.8% respectively) as cups are their predominant SKU
Source: A C Nielsen
CCAI
AJE(Big Cola)
CCAI (MinuteMaid)
Wings (Floridina)
CCAI(Frestea)
Sosro
Mayora
0%
2%
4%
6%
8%
10%
12%
14%
16%
Jan-
13
Apr
-13
Jul-1
3
Oct
-13
Jan-
14
Apr
-14
Jul-1
4
0%
2%
4%
6%
8%
10%
12%
14%
16%
Jan-
13
Apr
-13
Jul-1
3
Oct
-13
Jan-
14
Apr
-14
Jul-1
4
+12.8%+1.6%
+2.2%
SSD Juice* Tea*
% of market volume % of market volume % of market volume
For
per
sona
l use
onl
y

In 2013 our revenue per case was in decline. We have arrested this trend in2014
75
80
85
90
95
100
105
110
115
0
Seasonal decline in NSR rates driven by pack mix during
festive period
Trading revenue per unit case, 2013 - YTD 2014
Trad
ing
Rev
enu
e p
er U
C (
all
pro
du
cts)
Ind
ex,
Jan
-13
= 1
00
Trading revenue per uc
35
2013• Mix/NPD’s• Pricing Initiatives to counter competition
2014• Pricing initiatives offsetting the
unfavorable mix impact
Transformation will be driven by Route to Market, Revenue Management and Scale Driven Productivity Efficiencies which will deliver sustainable earnings growth
36
• Delivery/warehousing rationalisation
• Increase salesforce selling skills
• Improve market execution
Transform Route to Market model
• Strengthen pack price architecture
• Optimize execution within and across channels
• Capture more regional opportunities
Refine Revenue Management
• Localized manufacturing to improve customer service, reduce costs
• Drive manufacturing efficiencies via portfolio and process rationalization
• Packaging initiatives to take cost out of the business
Cost-out, while also leveraging scale and efficiency
SummarySummary
Directly Served Outlets +250,000 by end of 2016
Portfolio Coverage +10%
Volume in excess of market growth
Rate per case is maintained despite negative mix impact
Cost increase is less than rate of inflation,
Cost per case is declined
2014-2017
For
per
sona
l use
onl
y
Disclaimer
CCA advises that these presentation slides contain forward looking statements which may be subject to significant uncertainties outside of CCA’s control.
No representation is made as to the accuracy or reliability of forward looking statements or the assumptions on which they are based.
Actual future events may vary from these forward looking statements and you are cautioned not to place undue reliance on any forward looking statement.
For
per
sona
l use
onl
y
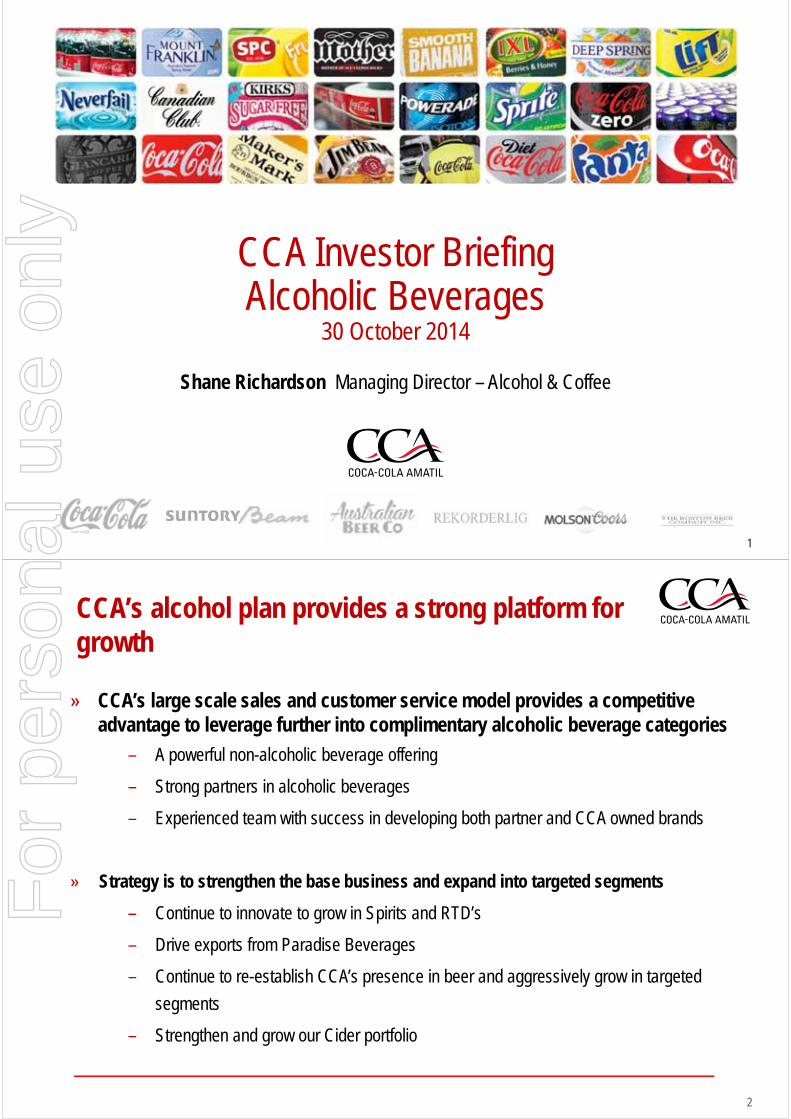
11
CCA Investor BriefingAlcoholic Beverages
30 October 2014
Shane Richardson Managing Director – Alcohol & Coffee
2
CCA’s alcohol plan provides a strong platform for growth
» CCA’s large scale sales and customer service model provides a competitive advantage to leverage further into complimentary alcoholic beverage categories
– A powerful non-alcoholic beverage offering
– Strong partners in alcoholic beverages
– Experienced team with success in developing both partner and CCA owned brands
» Strategy is to strengthen the base business and expand into targeted segments
– Continue to innovate to grow in Spirits and RTD’s
– Drive exports from Paradise Beverages
– Continue to re-establish CCA’s presence in beer and aggressively grow in targeted
segments
– Strengthen and grow our Cider portfolio
For
per
sona
l use
onl
y
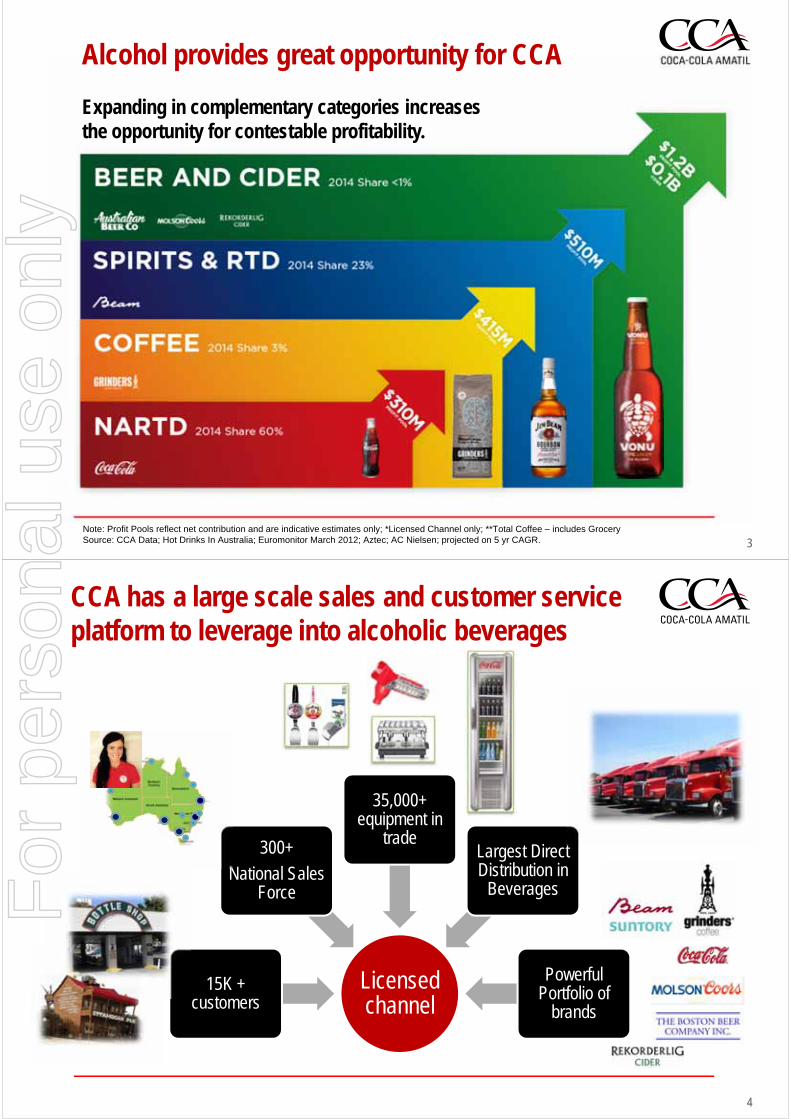
3Note: Profit Pools reflect net contribution and are indicative estimates only; *Licensed Channel only; **Total Coffee – includes GrocerySource: CCA Data; Hot Drinks In Australia; Euromonitor March 2012; Aztec; AC Nielsen; projected on 5 yr CAGR.
Alcohol provides great opportunity for CCA
Expanding in complementary categories increases the opportunity for contestable profitability.
4
CCA has a large scale sales and customer service platform to leverage into alcoholic beverages
Licensed channel
15K + customers
300+ National Sales
Force
35,000+ equipment in
tradeLargest Direct Distribution in
Beverages
Powerful Portfolio of
brands
For
per
sona
l use
onl
y
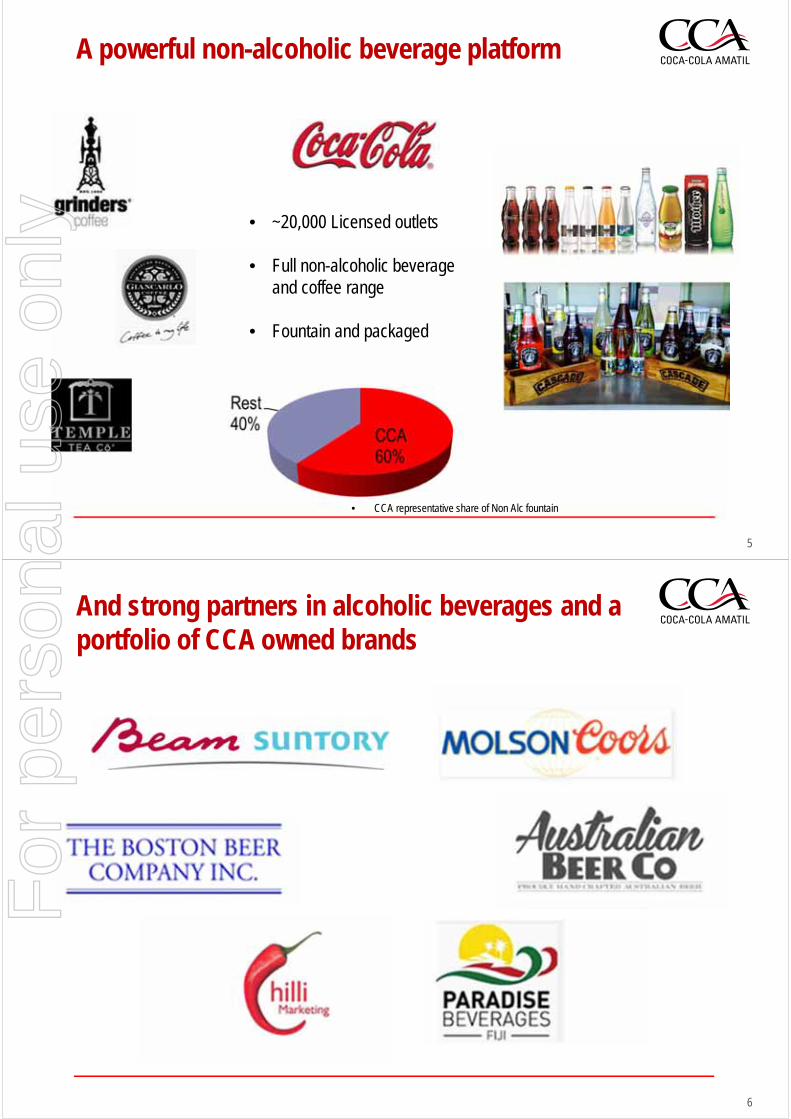
5
A powerful non-alcoholic beverage platform
• ~20,000 Licensed outlets
• Full non-alcoholic beverage and coffee range
• Fountain and packaged
• CCA representative share of Non Alc fountain
6
And strong partners in alcoholic beverages and a portfolio of CCA owned brands
For
per
sona
l use
onl
y
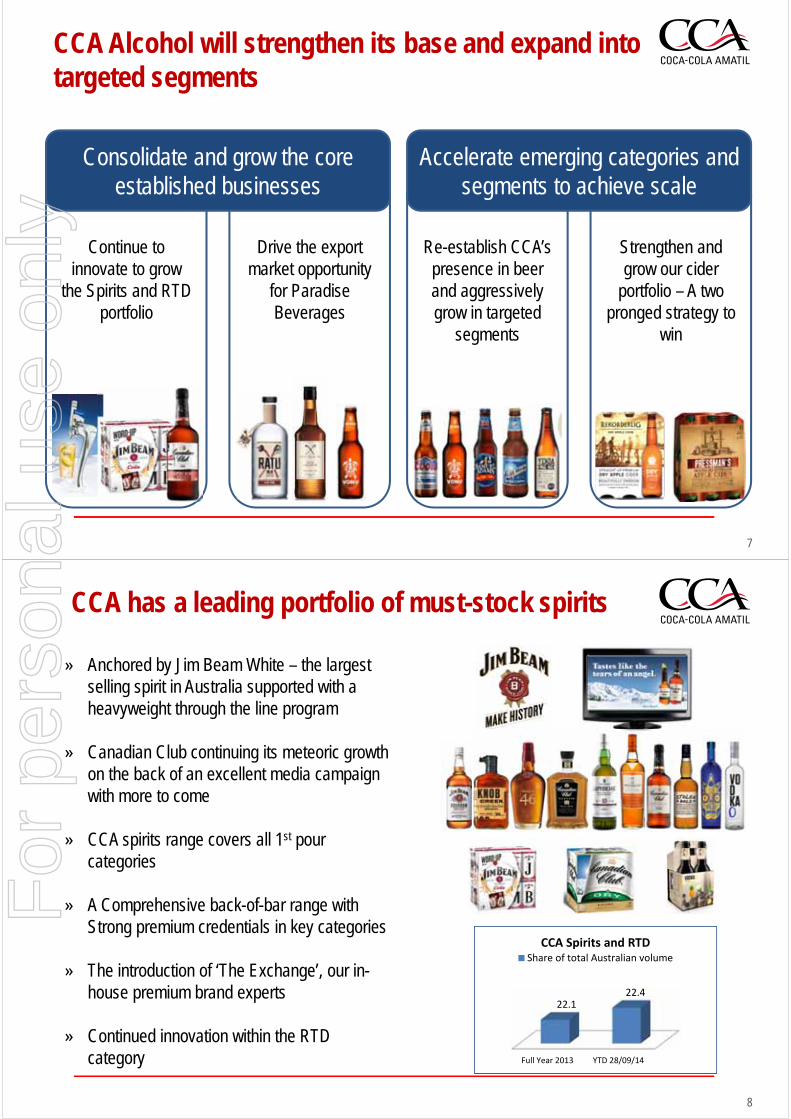
7
Continue to innovate to grow
the Spirits and RTD portfolio
Drive the export market opportunity
for Paradise Beverages
Consolidate and grow the core established businesses
Strengthen and grow our cider
portfolio – A two pronged strategy to
win
CCA Alcohol will strengthen its base and expand into targeted segments
Re-establish CCA’s presence in beer and aggressively grow in targeted
segments
Accelerate emerging categories and segments to achieve scale
8
CCA has a leading portfolio of must-stock spirits
» Anchored by Jim Beam White – the largest selling spirit in Australia supported with a heavyweight through the line program
» Canadian Club continuing its meteoric growth on the back of an excellent media campaign with more to come
» CCA spirits range covers all 1st pour categories
» A Comprehensive back-of-bar range with Strong premium credentials in key categories
» The introduction of ‘The Exchange’, our in-house premium brand experts
» Continued innovation within the RTD category Full Year 2013 YTD 28/09/14
22.122.4
CCA Spirits and RTDShare of total Australian volume
For
per
sona
l use
onl
y
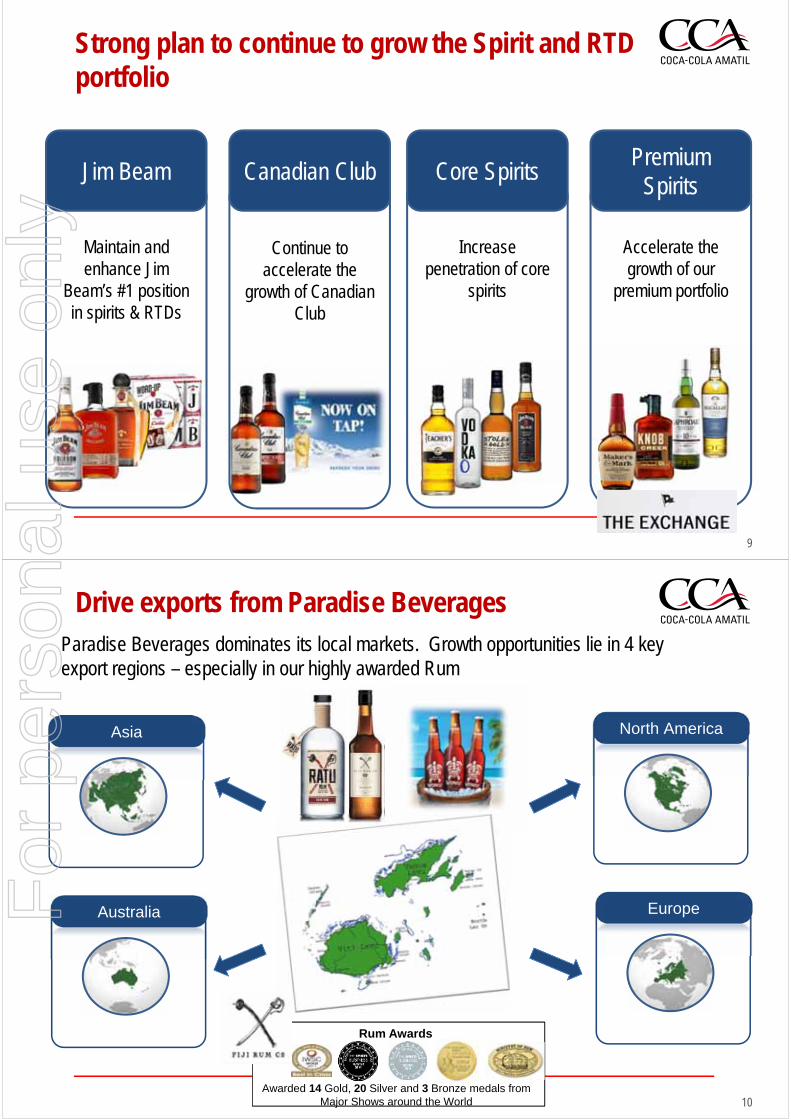
9
Strong plan to continue to grow the Spirit and RTD portfolio
Maintain and enhance Jim
Beam’s #1 position in spirits & RTDs
Continue to accelerate the
growth of Canadian Club
Jim Beam
Accelerate the growth of our
premium portfolio
Increase penetration of core
spirits
Core SpiritsCanadian ClubPremium
Spirits
10
Drive exports from Paradise Beverages
Awarded 14 Gold, 20 Silver and 3 Bronze medals from Major Shows around the World
Rum Awards
Asia
Australia
North America
Europe
Paradise Beverages dominates its local markets. Growth opportunities lie in 4 key export regions – especially in our highly awarded Rum
For
per
sona
l use
onl
y
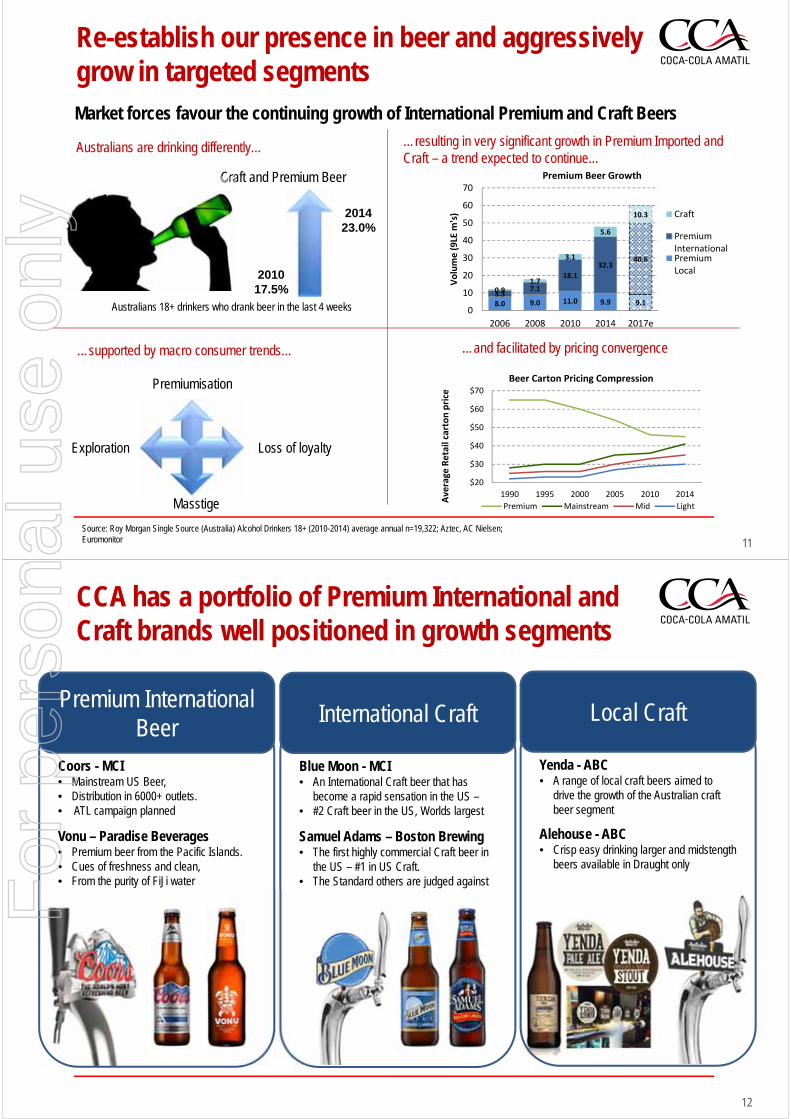
11
Re-establish our presence in beer and aggressively grow in targeted segments
Source: Roy Morgan Single Source (Australia) Alcohol Drinkers 18+ (2010-2014) average annual n=19,322; Aztec, AC Nielsen;Euromonitor
Australians are drinking differently…
…supported by macro consumer trends… …and facilitated by pricing convergence
Market forces favour the continuing growth of International Premium and Craft Beers
…resulting in very significant growth in Premium Imported and Craft – a trend expected to continue…
201017.5%
Craft and Premium Beer
201423.0%
Australians 18+ drinkers who drank beer in the last 4 weeks
Premiumisation
Loss of loyalty
Masstige
Exploration
$20
$30
$40
$50
$60
$70
1990 1995 2000 2005 2010 2014
Average
Retail carton price
Beer Carton Pricing Compression
Premium Mainstream Mid Light
8.0 9.0 11.0 9.9 9.13.3
7.1
18.1
32.340.6
0.91.7
3.1
5.6
10.3
0
10
20
30
40
50
60
70
2006 2008 2010 2014 2017e
Volume (9LE m
's)
Premium Beer Growth
Craft
PremiumInternationalPremiumLocal
12
CCA has a portfolio of Premium International and Craft brands well positioned in growth segments
Coors - MCI• Mainstream US Beer,• Distribution in 6000+ outlets.• ATL campaign planned
Vonu – Paradise Beverages• Premium beer from the Pacific Islands.• Cues of freshness and clean, • From the purity of FiJi water
Premium International Beer
Blue Moon - MCI• An International Craft beer that has
become a rapid sensation in the US –• #2 Craft beer in the US, Worlds largest
Samuel Adams – Boston Brewing• The first highly commercial Craft beer in
the US – #1 in US Craft. • The Standard others are judged against
International Craft
Yenda - ABC• A range of local craft beers aimed to
drive the growth of the Australian craft beer segment
Alehouse - ABC• Crisp easy drinking larger and midstength
beers available in Draught only
Local Craft
For
per
sona
l use
onl
y
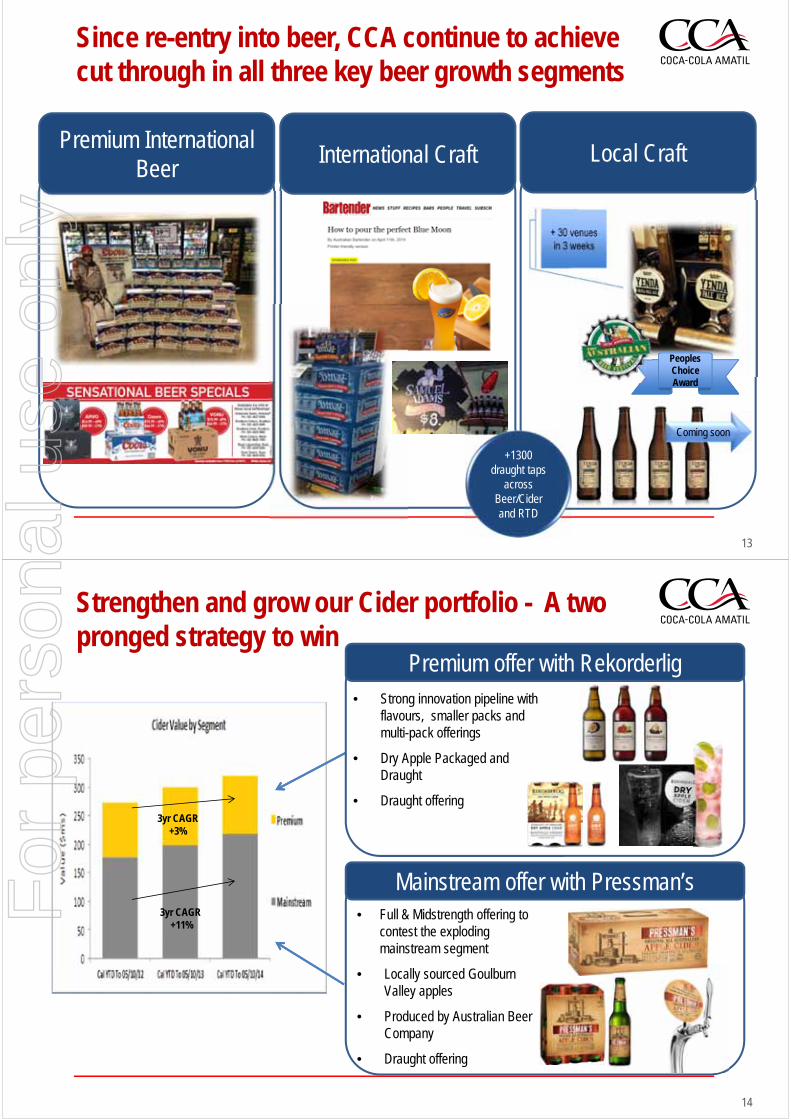
13
Since re-entry into beer, CCA continue to achieve cut through in all three key beer growth segments
Premium International Beer
International Craft Local Craft
Award
Peoples Choice Award
Coming soon
+1300 draught taps
across Beer/Cider and RTD
14
Strengthen and grow our Cider portfolio - A two pronged strategy to win
• Full & Midstrength offering to contest the exploding mainstream segment
• Locally sourced Goulburn Valley apples
• Produced by Australian Beer Company
• Draught offering
3yr CAGR +3%
3yr CAGR+11%
• Strong innovation pipeline with flavours, smaller packs and multi-pack offerings
• Dry Apple Packaged and Draught
• Draught offering
Mainstream offer with Pressman’s
Premium offer with Rekorderlig
For
per
sona
l use
onl
y
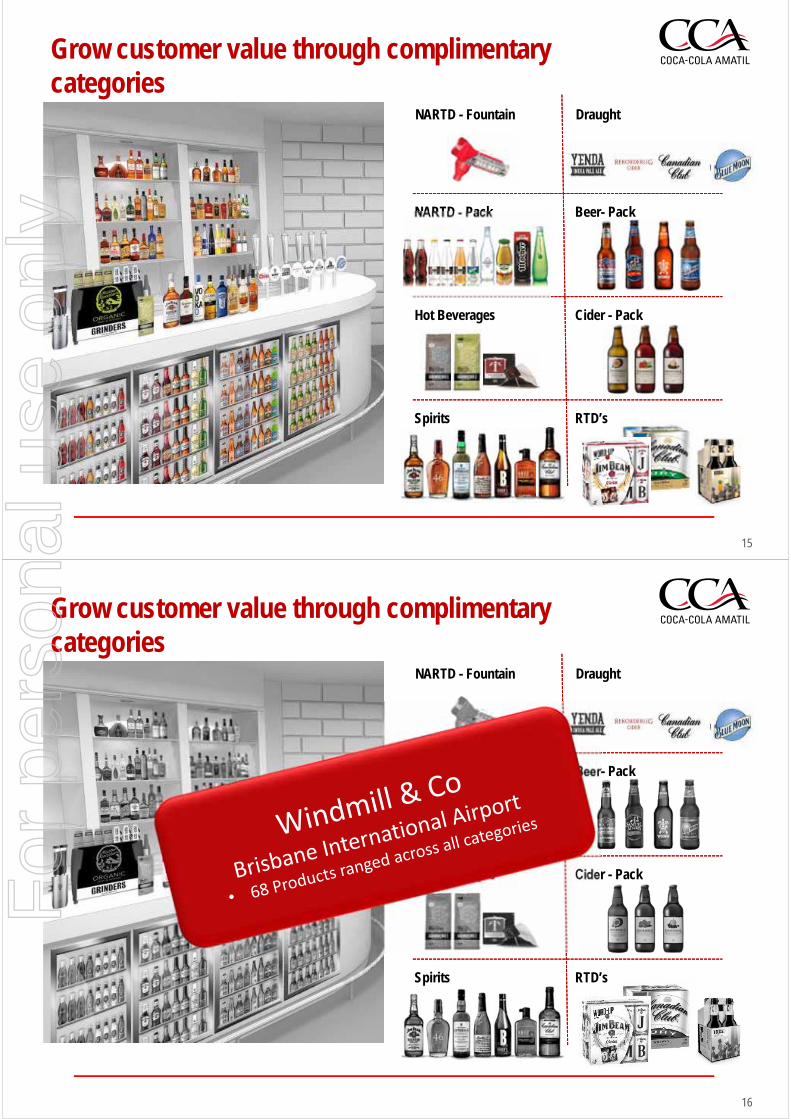
15
NARTD - Fountain
NARTD - Pack
Hot Beverages
Draught
Beer- Pack
Cider - Pack
Spirits RTD’s
Grow customer value through complimentary categories
16
NARTD - Fountain
NARTD - Pack
Hot Beverages
Draught
Beer- Pack
Cider - Pack
Spirits RTD’s
Grow customer value through complimentary categories
For
per
sona
l use
onl
y

1717
DisclaimerCCA advises that these presentation slides contain forward looking statements which may be subject to significant uncertainties outside of CCA’s control.
No representation is made as to the accuracy or reliability of forward looking statements or the assumptions on which they are based.
Actual future events may vary from these forward looking statements and you are cautioned not to place undue reliance on any forward looking statement.
For
per
sona
l use
onl
y
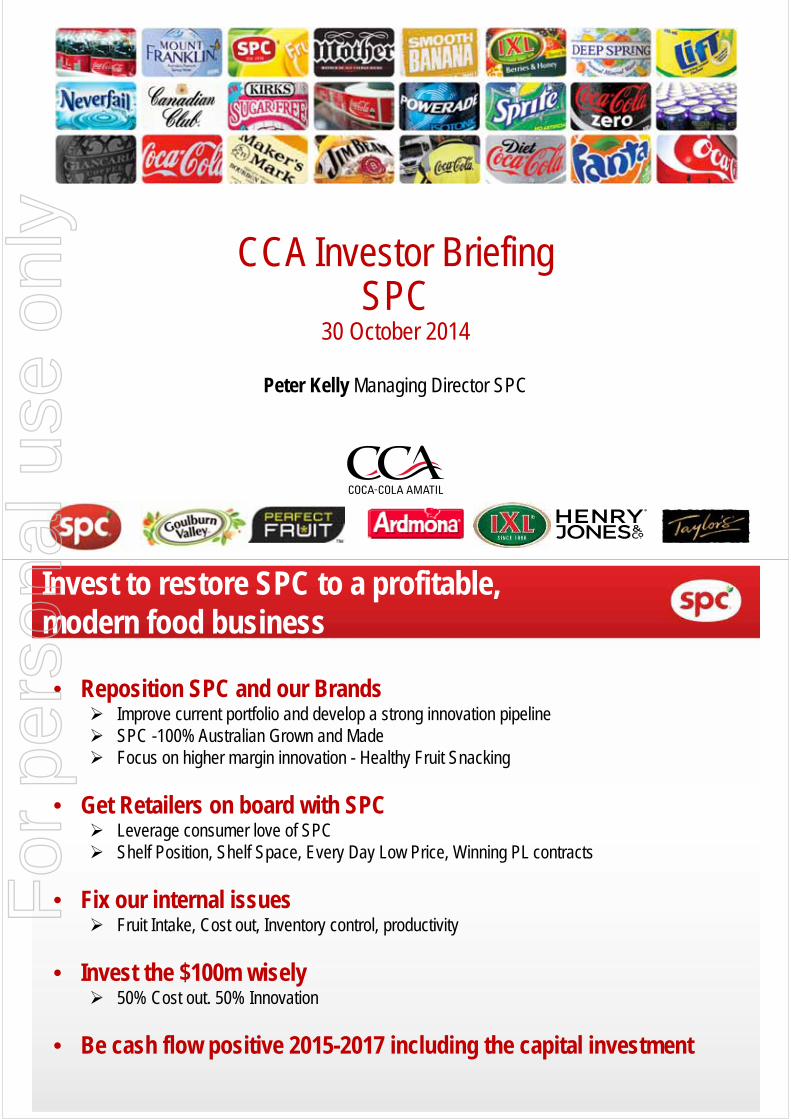
11
Peter Kelly Managing Director SPC
CCA Investor BriefingSPC
30 October 2014
Invest to restore SPC to a profitable,modern food business
• Reposition SPC and our Brands Improve current portfolio and develop a strong innovation pipeline SPC -100% Australian Grown and Made Focus on higher margin innovation - Healthy Fruit Snacking
• Get Retailers on board with SPC Leverage consumer love of SPC Shelf Position, Shelf Space, Every Day Low Price, Winning PL contracts
• Fix our internal issues Fruit Intake, Cost out, Inventory control, productivity
• Invest the $100m wisely 50% Cost out. 50% Innovation
• Be cash flow positive 2015-2017 including the capital investment
For
per
sona
l use
onl
y
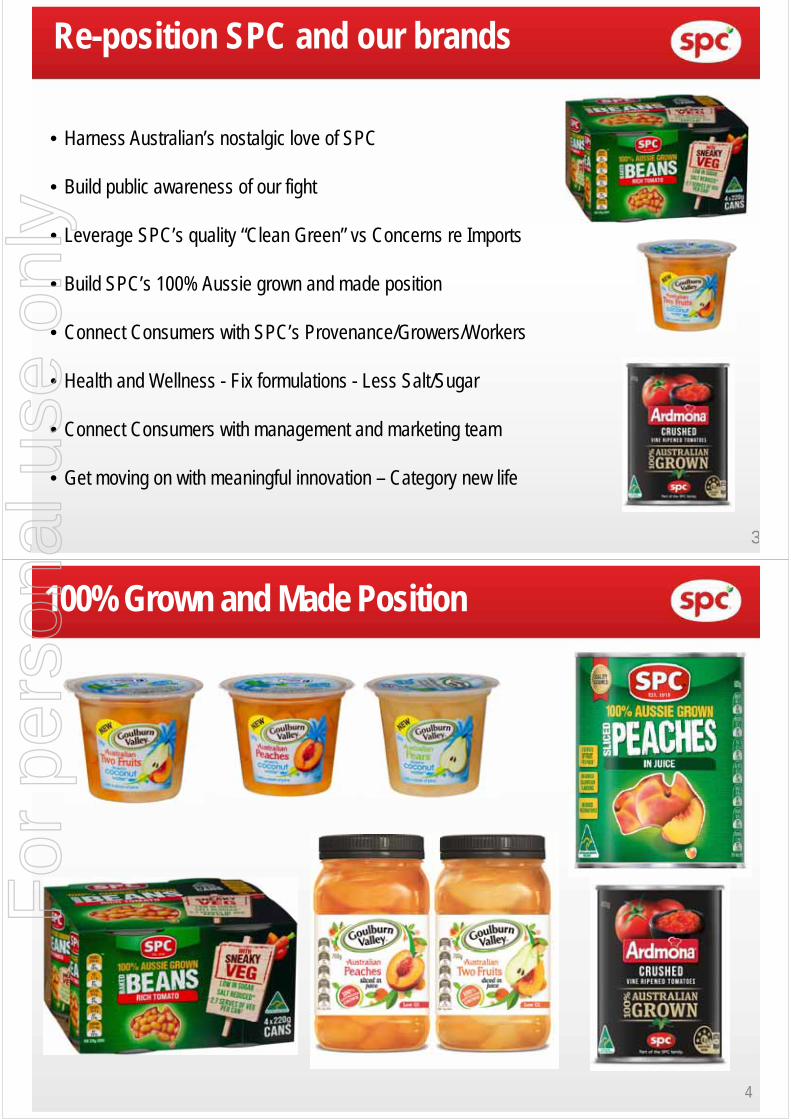
3
Re-position SPC and our brands
• Harness Australian’s nostalgic love of SPC
• Build public awareness of our fight
• Leverage SPC’s quality “Clean Green” vs Concerns re Imports
• Build SPC’s 100% Aussie grown and made position
• Connect Consumers with SPC’s Provenance/Growers/Workers
• Health and Wellness - Fix formulations - Less Salt/Sugar
• Connect Consumers with management and marketing team
• Get moving on with meaningful innovation – Category new life
100% Grown and Made Position
4
For
per
sona
l use
onl
y
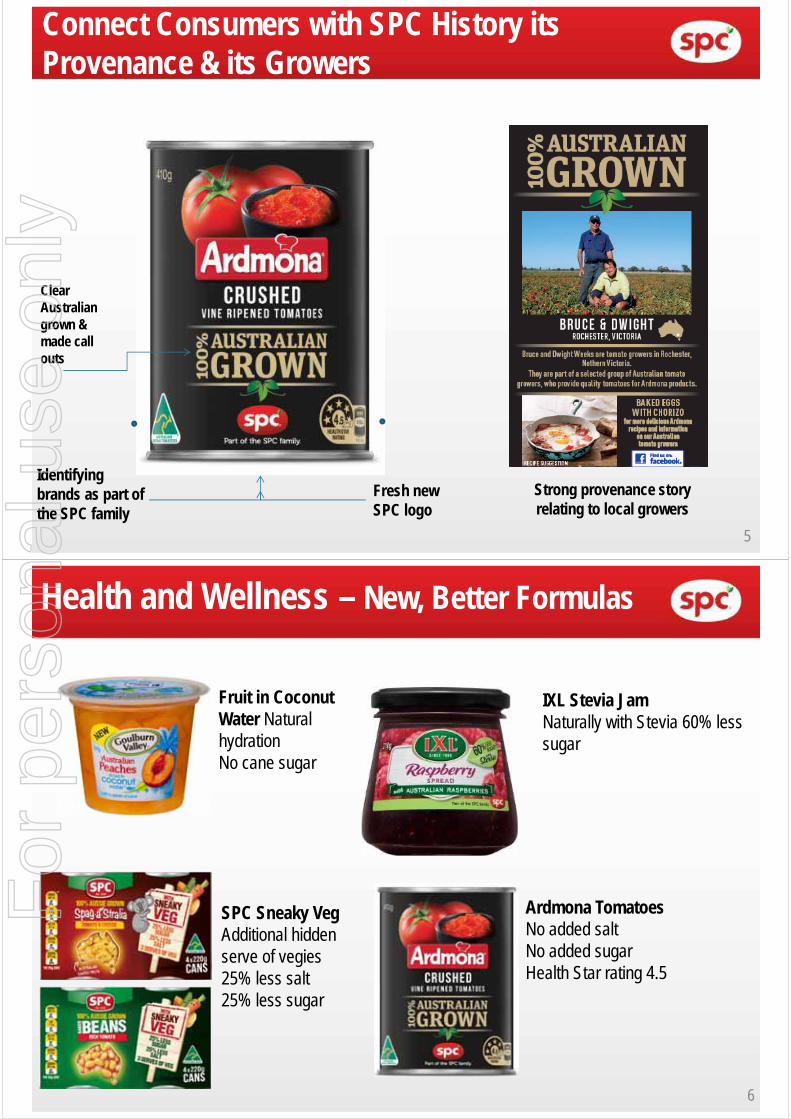
Connect Consumers with SPC History its Provenance & its Growers
Identifying brands as part of the SPC family
Clear Australian grown & made call outs
Fresh new SPC logo
Strong provenance story relating to local growers
5
6
Health and Wellness – New, Better Formulas
Fruit in Coconut Water Natural hydration No cane sugar
IXL Stevia Jam Naturally with Stevia 60% less sugar
Ardmona TomatoesNo added saltNo added sugar Health Star rating 4.5
SPC Sneaky Veg Additional hidden serve of vegies25% less salt25% less sugar
For
per
sona
l use
onl
y
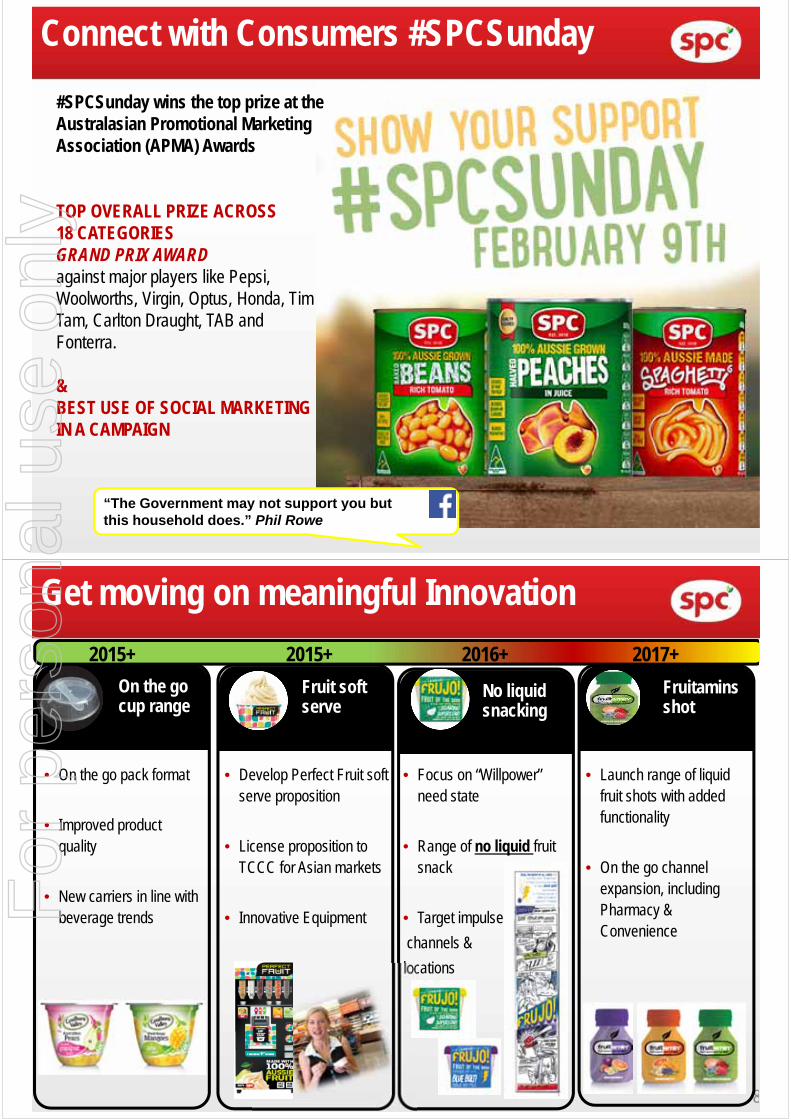
“The Government may not support you but this household does.” Phil Rowe
Connect with Consumers #SPCSunday
#SPCSunday wins the top prize at the Australasian Promotional Marketing Association (APMA) Awards
TOP OVERALL PRIZE ACROSS 18 CATEGORIES GRAND PRIX AWARD against major players like Pepsi, Woolworths, Virgin, Optus, Honda, Tim Tam, Carlton Draught, TAB and Fonterra.
& BEST USE OF SOCIAL MARKETING IN A CAMPAIGN
8
Get moving on meaningful Innovation
On the go cup range
Reframe snack fruit via creating consumer & category purpose
Fruit soft serve
No liquid snacking
Fruitamins shot
• On the go pack format
• Improved product quality
• New carriers in line with beverage trends
• Develop Perfect Fruit soft serve proposition
• License proposition to TCCC for Asian markets
• Innovative Equipment
• Focus on “Willpower” need state
• Range of no liquid fruit snack
• Target impulse
channels &
locations
• Launch range of liquid fruit shots with added functionality
• On the go channel expansion, including Pharmacy & Convenience
2015+ 2015+ 2016+ 2017+
For
per
sona
l use
onl
y
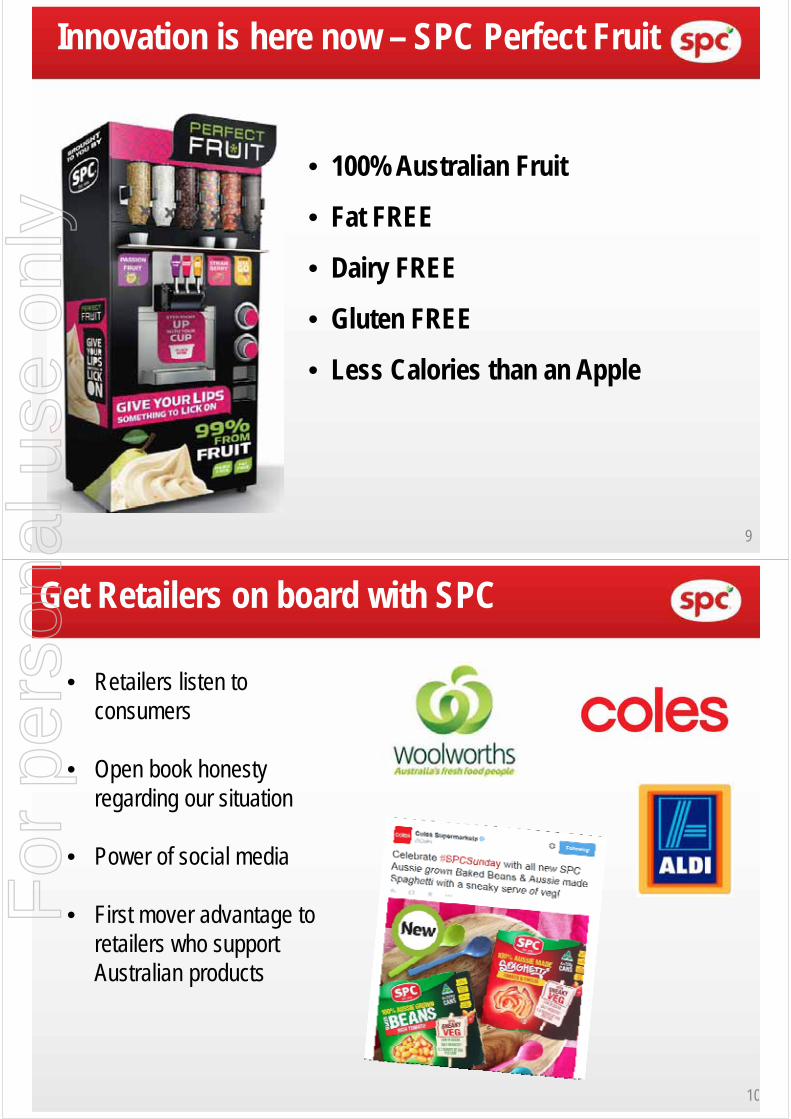
Innovation is here now – SPC Perfect Fruit
9
• 100% Australian Fruit
• Fat FREE
• Dairy FREE
• Gluten FREE
• Less Calories than an Apple
10
Get Retailers on board with SPC
• Retailers listen to consumers
• Open book honesty regarding our situation
• Power of social media
• First mover advantage to retailers who support Australian products
For
per
sona
l use
onl
y
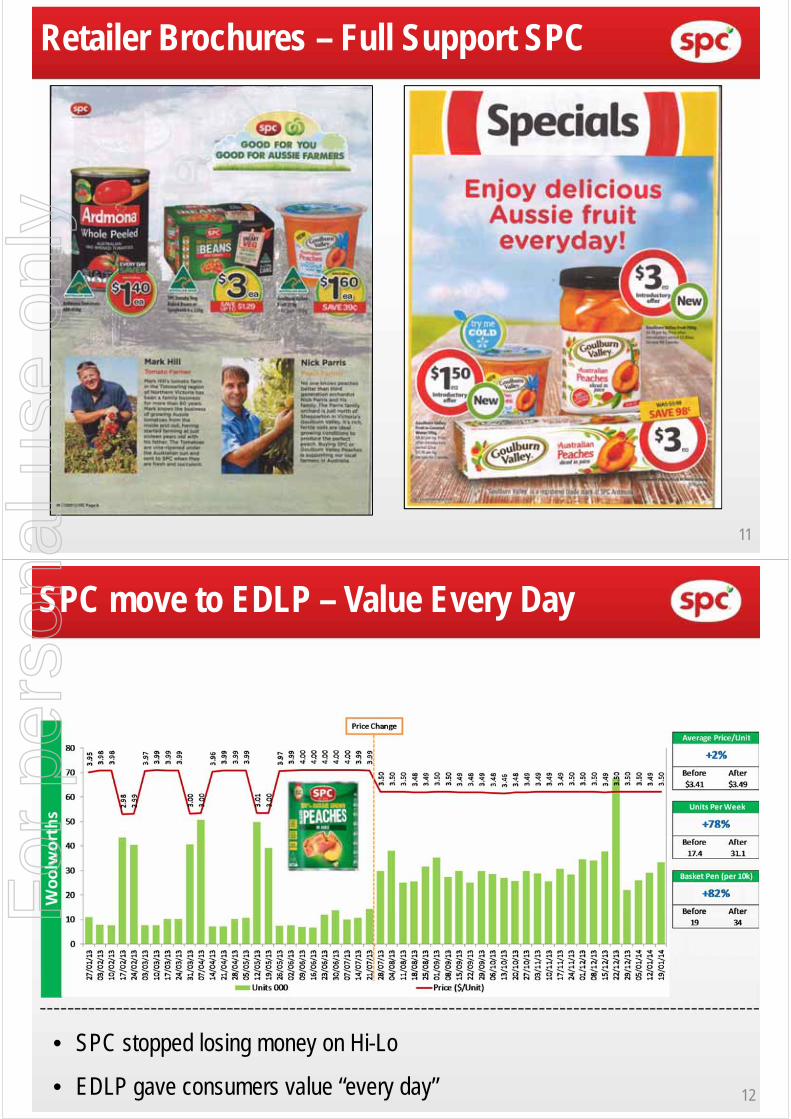
11
Retailer Brochures – Full Support SPC
12
SPC move to EDLP – Value Every Day
• SPC stopped losing money on Hi-Lo
• EDLP gave consumers value “every day”
For
per
sona
l use
onl
y
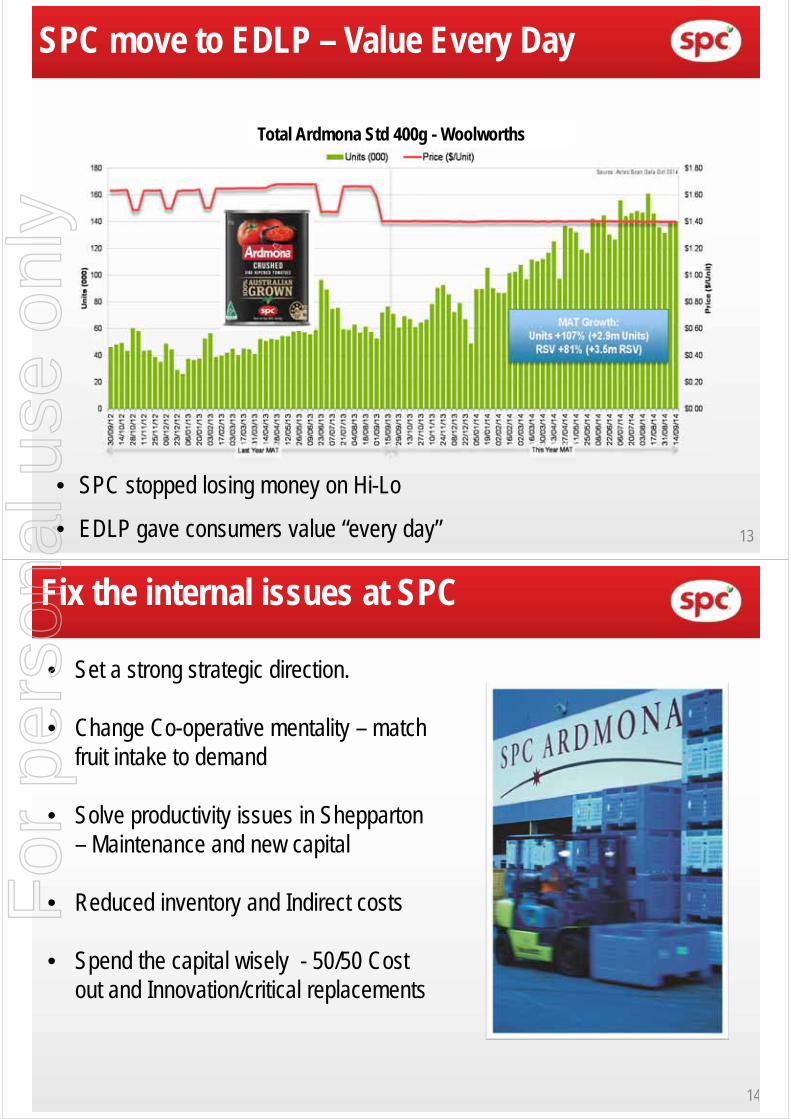
13
SPC move to EDLP – Value Every Day
• SPC stopped losing money on Hi-Lo
• EDLP gave consumers value “every day”
Total Ardmona Std 400g - Woolworths
14
Fix the internal issues at SPC
• Set a strong strategic direction.
• Change Co-operative mentality – match fruit intake to demand
• Solve productivity issues in Shepparton – Maintenance and new capital
• Reduced inventory and Indirect costs
• Spend the capital wisely - 50/50 Cost out and Innovation/critical replacements
For
per
sona
l use
onl
y
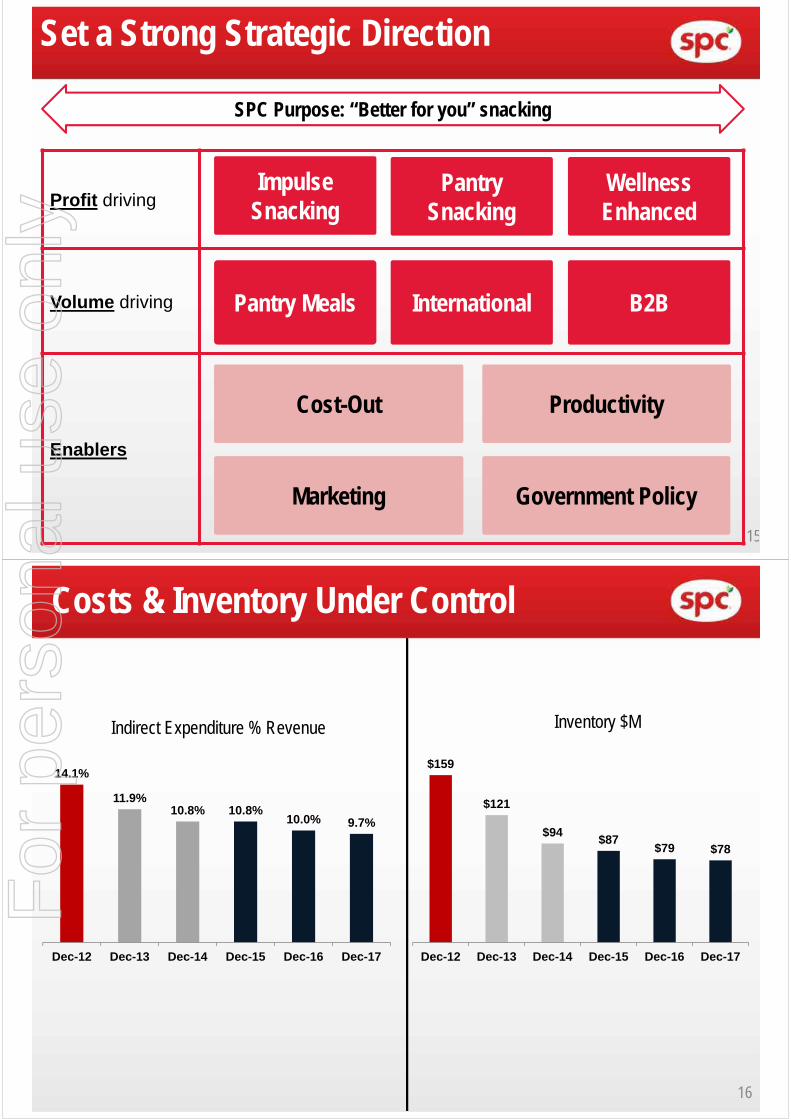
15
Set a Strong Strategic Direction
Profit driving
Volume driving
Enablers
Impulse Snacking
Pantry Snacking
WellnessEnhanced
Pantry Meals International B2B
SPC Purpose: “Better for you” snacking
Cost-Out
Marketing
Productivity
Government Policy
Costs & Inventory Under Control
Indirect Expenditure % Revenue
14.1%
11.9%10.8% 10.8%
10.0% 9.7%
Dec-12 Dec-13 Dec-14 Dec-15 Dec-16 Dec-17
$159
$121
$94$87
$79 $78
Dec-12 Dec-13 Dec-14 Dec-15 Dec-16 Dec-17
Inventory $M
16
For
per
sona
l use
onl
y
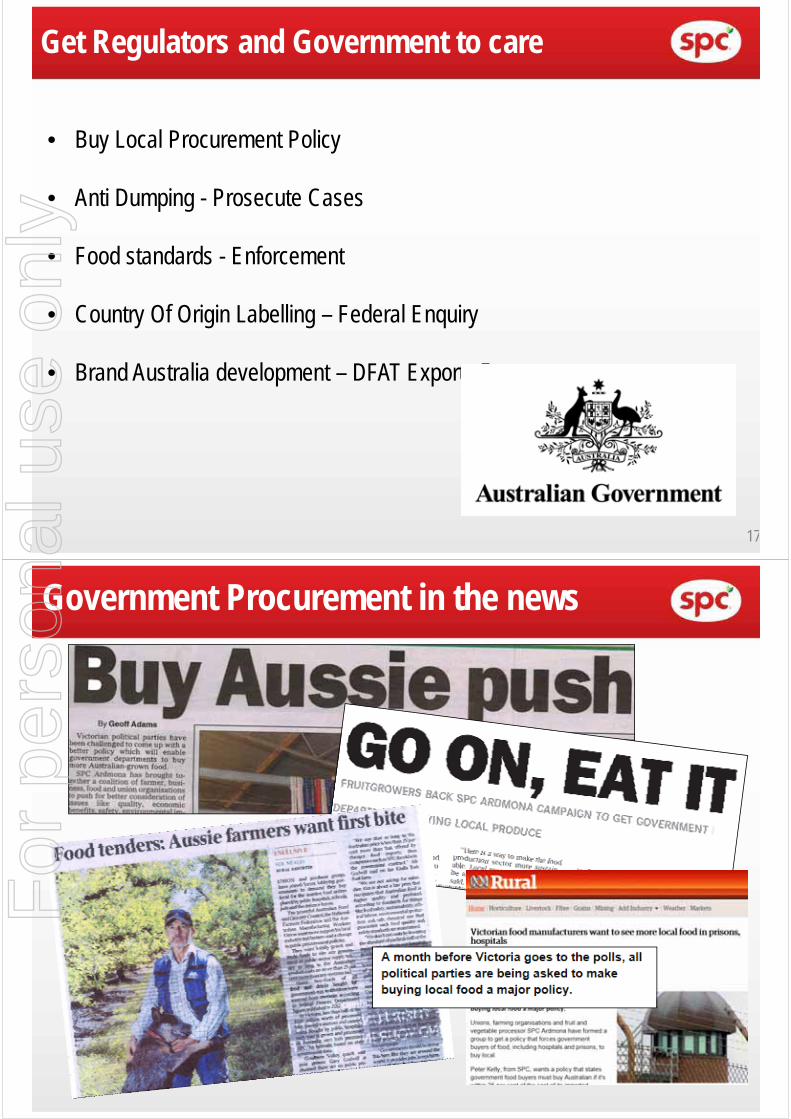
17
Get Regulators and Government to care
• Buy Local Procurement Policy
• Anti Dumping - Prosecute Cases
• Food standards - Enforcement
• Country Of Origin Labelling – Federal Enquiry
• Brand Australia development – DFAT Exports Focus
Government Procurement in the news
For
per
sona
l use
onl
y
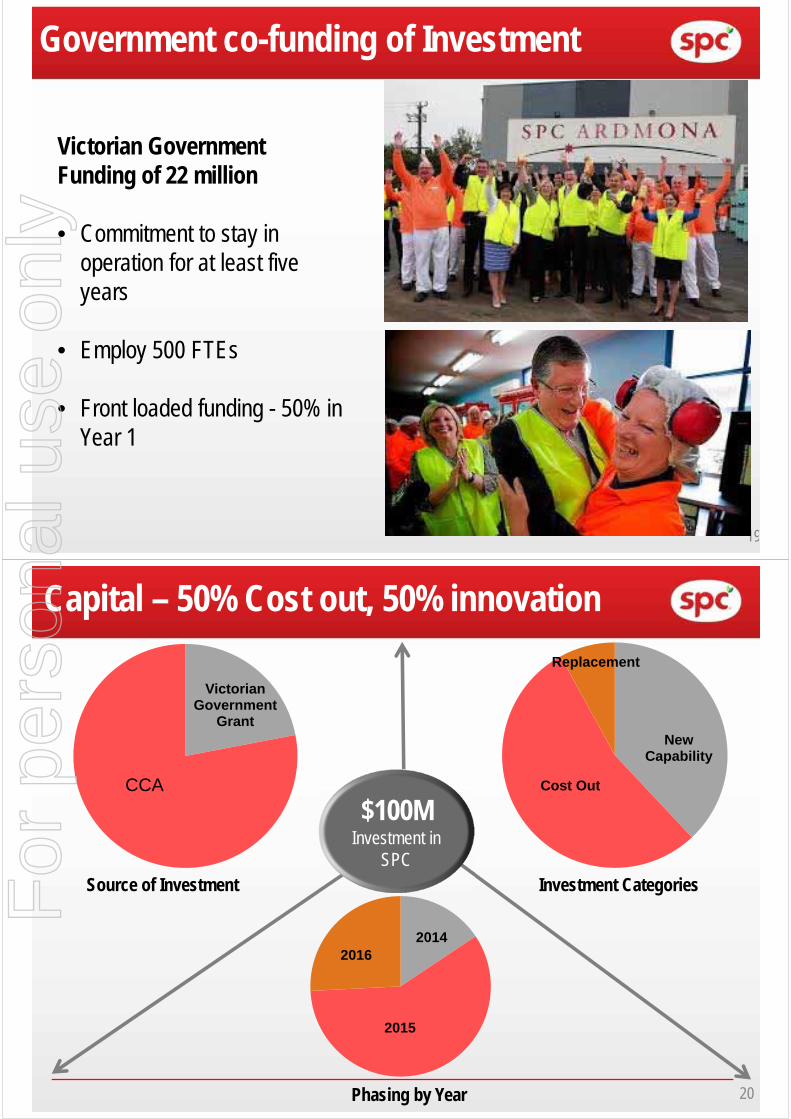
19
Government co-funding of Investment
Victorian Government Funding of 22 million
• Commitment to stay in operation for at least five years
• Employ 500 FTEs
• Front loaded funding - 50% in Year 1
Capital – 50% Cost out, 50% innovation
$100M Investment in
SPCSource of Investment Investment Categories
Phasing by Year
New Capability
Cost Out
Replacement
2014
2015
2016
Victorian Government
Grant
CCA
20
For
per
sona
l use
onl
y
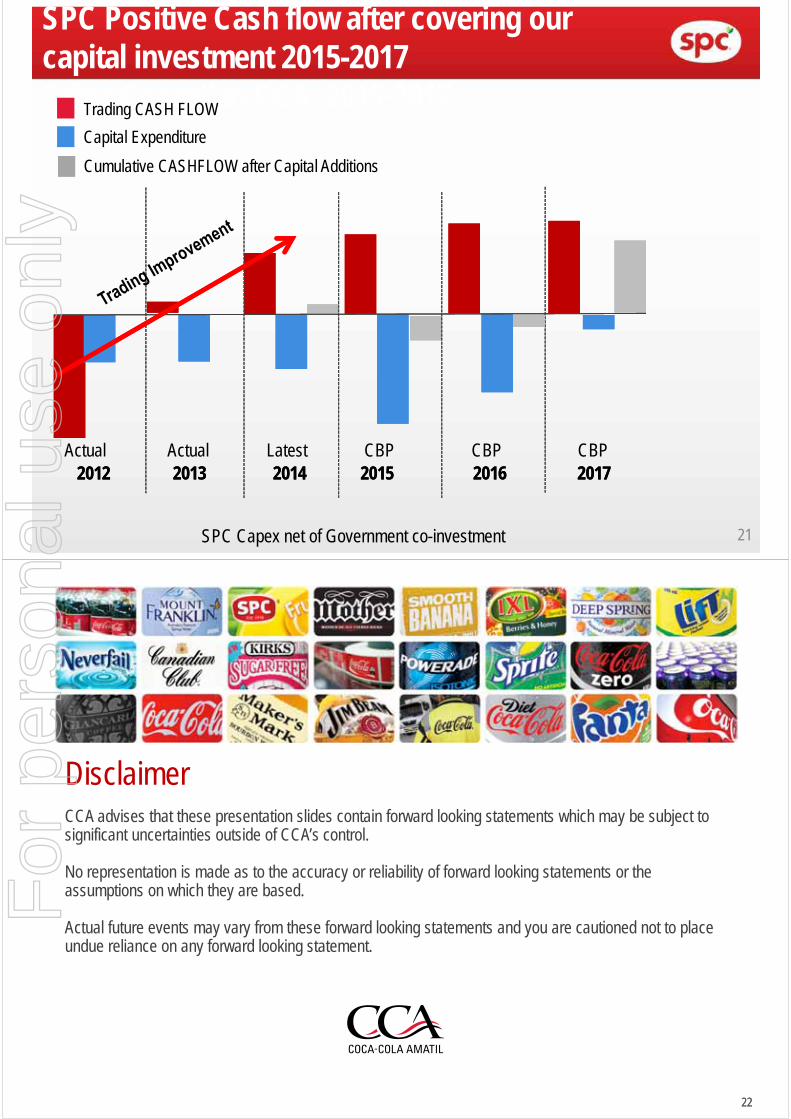
SPC Positive Cash flow after covering our capital investment 2015-2017 “after Capex” to CCA 2015-2017Trading CASH FLOW
Cumulative CASHFLOW after Capital Additions
Capital Expenditure
2012 2013 2014 2015 2016 20172012 2013 2014 2015 2016 2017Actual Actual Latest CBP CBP CBP
SPC Capex net of Government co-investment 21
2222
DisclaimerCCA advises that these presentation slides contain forward looking statements which may be subject to significant uncertainties outside of CCA’s control.
No representation is made as to the accuracy or reliability of forward looking statements or the assumptions on which they are based.
Actual future events may vary from these forward looking statements and you are cautioned not to place undue reliance on any forward looking statement.
For
per
sona
l use
onl
y