for personal use only briefing presentation)2015/02/19 · liquor (sqm) – ex hotels 209,293 coles...
TRANSCRIPT

12015 Half-Year Results |
2015 Half-Year resultsSupplementary information
19 February 2015
(To be read in conjunction with the 2015 Half-Year results briefing presentation)
For
per
sona
l use
onl
y

22015 Half-Year Results |
Presentation outline
Item Page
Coles 3
Home Improvement & Office Supplies 7
Kmart 12
Target 16
Chemicals, Energy & Fertilisers 21
Resources 27
Industrial & Safety 36
Balance Sheet & Cash Flow 39
For
per
sona
l use
onl
y

32015 Half-Year Results |
ColesF
or p
erso
nal u
se o
nly

42015 Half-Year Results |
Selling Area Supermarkets (sqm) 1,728,445
Liquor (sqm) – ex hotels 209,293
Coles networkAs at 31 December 2014
771 Supermarkets
853 Liquor stores
91 Hotels
652 Convenience
6 7
243 2274
160 77227
56 73588 5110
202
16
6944
125
210178
15
11
200
For
per
sona
l use
onl
y

52015 Half-Year Results |
Store network movements
Open at 30 June
2014 Opened ClosedRe-
branded
Open at 31 Dec 2014
SupermarketsColes 745 14 (4) 10 765
Bi-Lo 17 - (1) (10) 6
Total Supermarkets 762 14 (5) - 771Liquor1st Choice 98 3 (1) - 100
Vintage Cellars 77 5 (2) - 80
Liquorland 656 30 (13) - 673
Hotels 90 1 - - 91
Total Liquor 921 39 (16) - 944Convenience 642 12 (2) - 652
For
per
sona
l use
onl
y

62015 Half-Year Results |
Revenue reconciliation
2014 20136 months ended 31 December ($m)
Food & Liquor Convenience Total
Food & Liquor Convenience Total
Segment revenue (Gregorian)1 15,559 3,924 19,483 14,770 4,176 18,946
Less: Other revenue (141) (7) (148) (146) 6 (152)
Headline sales (Gregorian) 15,418 3,917 19,335 14,624 4,170 18,794
Add: Gregorian adjustment2 379 83 462 371 96 467
Headline sales revenue (Retail)3 15,797 4,000 19,797 14,995 4,266 19,261 1 Segment revenue for Food & Liquor includes property revenue for the half-year ended 31 December 2014 of $15 million & for the half-year ended 31 December 2013 of $13 million. 2 Adjustment to headline sales revenue to reflect retail period. 3 Retail period relates to the 27 week period 30 June 2014 to 4 January 2015 for the half-year ended 31 December 2014 & to the 27 week period 1 July 2013 to 5 January 2014 for the half-year ended 31 December 2013.
For
per
sona
l use
onl
y
72015 Half-Year Results |
Home Improvement & Office SuppliesF
or p
erso
nal u
se o
nly
82015 Half-Year Results |
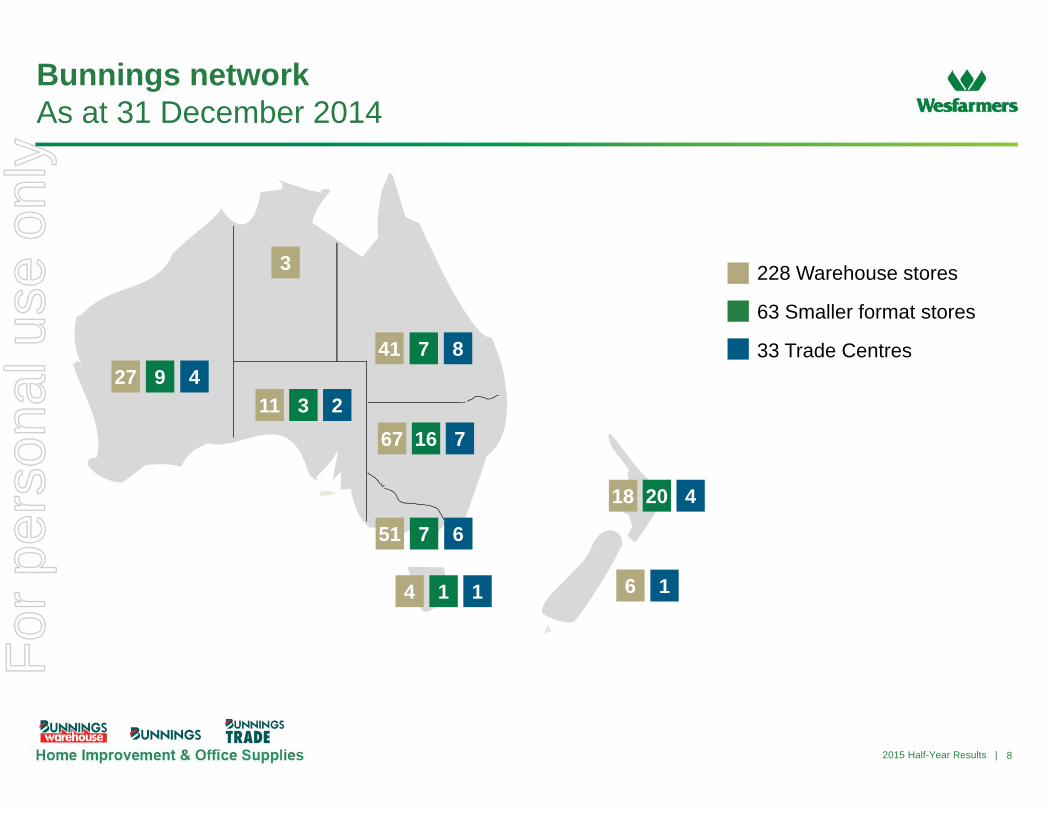
Bunnings networkAs at 31 December 2014
3
67 716
41 7
327
51 7
4
6
228 Warehouse stores
63 Smaller format stores
33 Trade Centres9 4
211
8
1 1
42018
16
For
per
sona
l use
onl
y

92015 Half-Year Results |
Officeworks networkAs at 31 December 2014
1
50 1
28 1
815
49 1
2
11
1153 Officeworks Stores
4 Fulfilment Centres
1 Service Centres
1 Print Hub
For
per
sona
l use
onl
y

102015 Half-Year Results |
Store network movements
Open at 1 July 2014 Opened Closed
Open at 31 Dec 2014
Under construction
at 31 Dec 2014
Home Improvement
Bunnings Warehouse 223 8 (3) 228 19
Bunnings smaller formats 64 1 (2) 63 3
Bunnings Trade Centres 33 3 (3) 33 0
Office Supplies
Officeworks 151 3 (1) 153 2
Harris Technology 1 - (1) - -
For
per
sona
l use
onl
y
112015 Half-Year Results |
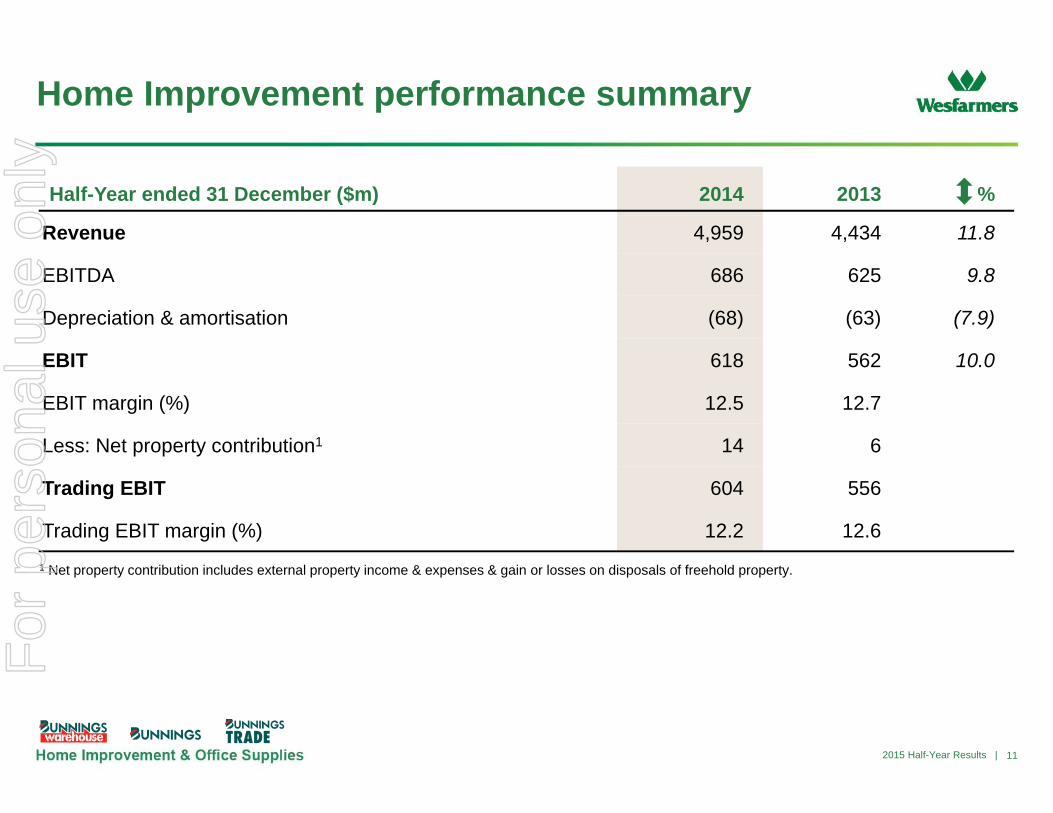
Home Improvement performance summary
Half-Year ended 31 December ($m) 2014 2013 %
Revenue 4,959 4,434 11.8
EBITDA 686 625 9.8
Depreciation & amortisation (68) (63) (7.9)
EBIT 618 562 10.0
EBIT margin (%) 12.5 12.7
Less: Net property contribution1 14 6
Trading EBIT 604 556
Trading EBIT margin (%) 12.2 12.61 Net property contribution includes external property income & expenses & gain or losses on disposals of freehold property.
For
per
sona
l use
onl
y

122015 Half-Year Results |
KmartF
or p
erso
nal u
se o
nly

132015 Half-Year Results |
Kmart networkAs at 31 December 2014
200 Kmart stores
246 KTAS centres3
75
53
15
5
2522
2
18
41
52
45 68
4 4
14
For
per
sona
l use
onl
y

142015 Half-Year Results |
Store network movements
Open at 1 July 2014 Opened Closed
Open at 31 Dec 2014
Kmart 192 8 - 200
Kmart Tyre & Auto 243 5 (2) 246
For
per
sona
l use
onl
y

152015 Half-Year Results |
Revenue reconciliation
Half-year ended 31 December ($m) 2014 2013
Segment revenue (Gregorian) 2,442 2,321
Less: Non sales revenue (2) (3)
Headline sales (Gregorian) 2,440 2,318
Add: Gregorian adjustment1 50 47
Headline sales revenue (Retail2) 2,490 2,3651 Adjustment to headline sales revenue to reflect retail period end. 2 Retail period relates to the 27 week period 30 June 2014 to 4 January 2015 and the 27 week period 1 July 2013 to 5 January 2014.
For
per
sona
l use
onl
y

162015 Half-Year Results |
TargetF
or p
erso
nal u
se o
nly

172015 Half-Year Results |
Target networkAs at 31 December 2014
2
58
32
17
48
5
2132
43
26
1
12
1
11
183 Large
126 Small
For
per
sona
l use
onl
y

182015 Half-Year Results |
Store network movements
Open at 1 July 2014 Opened Closed
Open at 31 Dec 2014
Under construction at
31 Dec 2014
Large 180 5 (2) 183 -
Small 128 4 (6) 126 -
For
per
sona
l use
onl
y

192015 Half-Year Results |
Revenue reconciliation
Half-year ended 31 December ($m) 2014 2013
Segment revenue (Gregorian) 1,935 1,965
Less: Non sales revenue - -
Headline sales (Gregorian) 1,935 1,965
Add: Gregorian adjustment1 42 48
Headline sales revenue (Retail2) 1,977 2,0131 Adjustment to headline sales revenue to reflect retail period end. 2 Retail period relates to the 27 week period 29 June 2014 to 3 January 2015 and the 27 week period 30 June 2013 to 4 January 2014.
For
per
sona
l use
onl
y

202015 Half-Year Results |
Fixing the basics (FY14-15)
• Improve availability • Enhance online functionality • Improve service & refresh stores
• Reduce SKUs
• Refresh in-house design & trend capability
• Restructure sourcing team & consolidate supplier base
• Simplify store rostering model • Rationalise supply chain network • Optimise support structure
• Top team & structure for transformation in place
• Embed new values & performance management
Growth & efficiency (FY16-17)
• Maximise SKUs on replenishment • Roll-out renewal program
• Right range in the right store
• Shorter lead times • Consistent fit & quality
• Reinvest sourcing benefits in price
• Realise benefits of investment in systems & processes
• Recruitment, development & performance aligned to values
The Target difference (FY18)
• Integrated ‘bricks & clicks’ • Differentiated store format • Outstanding customer service
• Edited ranges
• On-trend & known for fashion & style backed by good quality
• Amazing low prices for the fashion & quality provided
• Lean, flexible & sustainable operations
• Our values are embedded, driving a high performance culture that has transformed our business
A clear plan for FY15 & beyond
Target transformation planF
or p
erso
nal u
se o
nly

212015 Half-Year Results |
Chemicals, Energy & FertilisersF
or p
erso
nal u
se o
nly

222015 Half-Year Results |
Fertiliser sales
Strong Nitrogen sales resulting in 63% higher sales volumes in 1H15
244 227 220 160260
610 714 713 779
0
200
400
600
800
1,000
1,200
FY2011 FY2012 FY2013 FY2014 FY2015
kt
2nd Half 1st Half
For
per
sona
l use
onl
y

232015 Half-Year Results |
Global fertiliser & ammonia pricing
0
100
200
300
400
500
600
700
800
Dec-09 Jun-10 Dec-10 Jun-11 Dec-11 Jun-12 Dec-12 Jun-13 Dec-13 Jun-14 Dec-14
US$/t
Urea (FOB Middle East) DAP (FOB US Gulf) Ammonia (FOB Middle East)
Continued volatility in Fertiliser pricing
For
per
sona
l use
onl
y
242015 Half-Year Results |
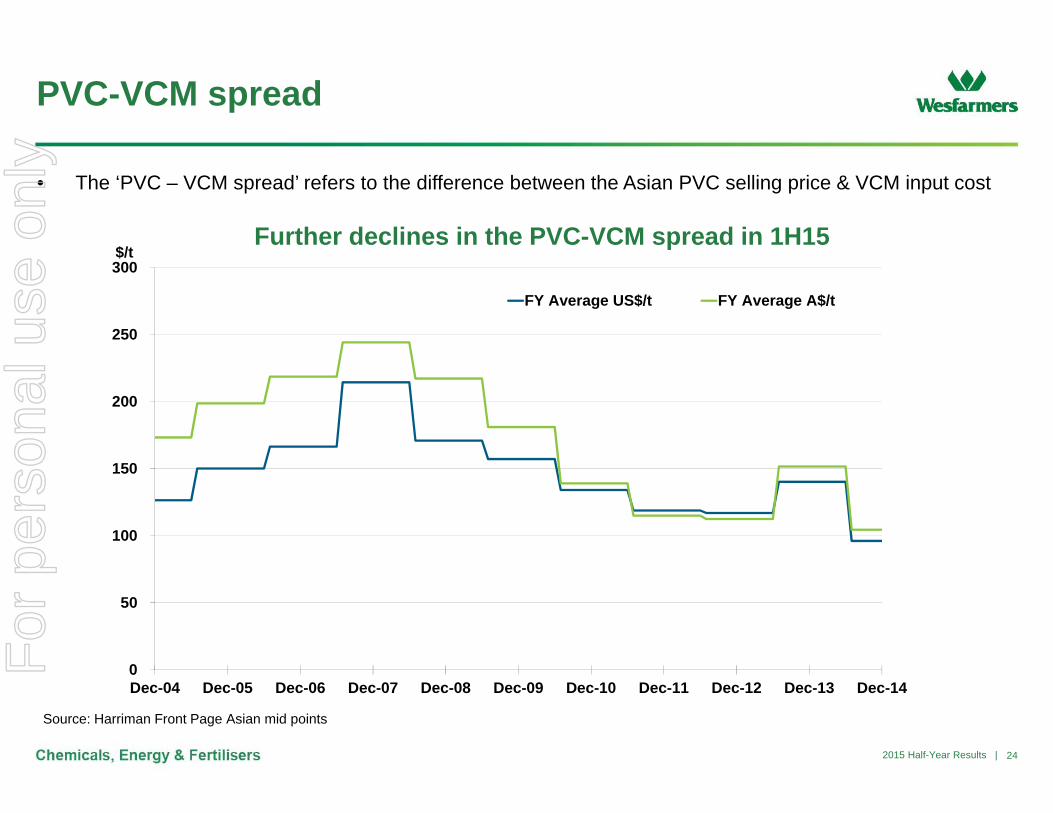
PVC-VCM spread
Source: Harriman Front Page Asian mid points
• The ‘PVC – VCM spread’ refers to the difference between the Asian PVC selling price & VCM input cost
Further declines in the PVC-VCM spread in 1H15
0
50
100
150
200
250
300
Dec-04 Dec-05 Dec-06 Dec-07 Dec-08 Dec-09 Dec-10 Dec-11 Dec-12 Dec-13 Dec-14
$/t
FY Average US$/t FY Average A$/t
For
per
sona
l use
onl
y

252015 Half-Year Results |
World LPG prices – Saudi CP
Significant & sharp decline in 1H15
0
200
400
600
800
1,000
1,200
1,400
Dec-04 Dec-05 Dec-06 Dec-07 Dec-08 Dec-09 Dec-10 Dec-11 Dec-12 Dec-13 Dec-14
Saudi CP US$/t (propane)
Saudi CP A$/t (propane)
$/t
For
per
sona
l use
onl
y

262015 Half-Year Results |
LPG production
Further declines in content leading to 17% lower production in 1H15
0.5
0.6
0.7
0.8
0.9
0
50
100
150
200
FY09 FY10 FY11 FY14 FY15
Ave t/TJkt
H1 WLPG production (kt) H2 WLPG production (kt)H1 average LPG content (t/TJ) FY average LPG content (t/TJ)F
or p
erso
nal u
se o
nly

272015 Half-Year Results |
ResourcesF
or p
erso
nal u
se o
nly

282015 Half-Year Results |
Business environment
• Continued challenging global trading conditions for coal producers
• Metallurgical coal market remains in near term over supply
– Significant supply side volume reduction & mine closure announcements yet to impact price
– Demand side volatility remains, driven by China
• Curragh March 2015 quarter export metallurgical coal pricing settlement
– Weighted average US$ export prices for metallurgical coal down ~1% on December 2014 quarter
• Recent A$:US$ exchange rate decline
• Continued trend from steel makers towards lower quality metallurgical coals to reduce costs
• Long-term metallurgical coal outlook fundamentals remain sound
– Driven by demand growth in India & China
For
per
sona
l use
onl
y

292015 Half-Year Results |
Australian coal market prices
Source: Energy Publishing, Tex Report, Macquarie Research, CRU
0
50
100
150
200
250
300
350
400
2004 2005 2006 2007 2008 2009 2010 2011 2012 2013 2014 20150
50
100
150
200
250
2004 2005 2006 2007 2008 2009 2010 2011 2012 2013 2014 2015
Australian steaming coal prices Australian hard coking coal pricesUS$/tonne (nominal) FOB Australia (annual verse spot)
JPU Reference Price Spot Price
US$/tonne (nominal) FOB Australia (annual verse spot)
Annual Reference Price Quarterly Benchmark Reference Price Spot Price
For
per
sona
l use
onl
y

302015 Half-Year Results |
Curragh export metallurgical sales product mix
1H FY15 Actual4.3 million tonnes
FY15 Forecast8.0 - 9.0 million tonnes
For
per
sona
l use
onl
y

312015 Half-Year Results |
Coal production volumes
Mine Ownership Coal Type
Half-Year Ended (‘000 tonnes)
Dec 2014 Dec 2013
Curragh, QLD 100% Metallurgical 4,580 4,029
Steaming 1,543 1,740
Bengalla, NSW1 40% Steaming 1,658 1,685
Total1 7,781 7,4541 Wesfarmers attributable production.
For
per
sona
l use
onl
y

322015 Half-Year Results |
Coal sales volumes
1 Curragh metallurgical coal sales excludes traded coal.2 Wesfarmers attributable sales.
Mine Ownership Coal Type
Half-Year Ended (‘000 tonnes)
Dec 2014 Dec 2013
Curragh, QLD1 100% Metallurgical 4,271 4,053
Steaming 1,542 1,829
Bengalla, NSW2 40% Steaming 1,726 1,787
Total1 7,539 7,669
For
per
sona
l use
onl
y

332015 Half-Year Results |
FX hedging profile: 31 December 2014
Curragh
Year end 30
Jun
Current US$ sold forward
(US$m)
AverageA$ / US$
hedge rate
2015 282 0.87
2016 430 0.88
2017 258 0.86
2018 108 0.81
Bengalla
Year end 30 Jun
Current US$ sold forward
(US$m)
AverageA$ / US$
hedge rate
2015 79 0.89
2016 154 0.89
2017 81 0.86
2018 40 0.81
1 2015 represents six month period ending 30 June 2015.2 Incremental hedging activity is continuing in line with market conditions.
For
per
sona
l use
onl
y

342015 Half-Year Results |
Resources financial summary
Half-Year ended 31 December 2014 2013 Commentary
Production tonnes – (‘000 tonnes) Record metallurgical coal production achieved at Curragh for the first half Curragh & Bengalla1 7,781 7,454
Revenue ($m)
Produced 681 761
Traded 8 3
Total 689 764 Lower average export prices, partially offset by higher sales volumes
Government royalties ($m)
Stanwell rebate (34) (62) Lower rolling 12 month average coal price for 1H15
Other (46) (59) Comparatively weaker exchange rate in 1H15 offset the impact of reduced revenues
Total (80) (121)
Mining & other costs ($m)
Total traded cost (7) (3)
Mining & other costs2 (494) (505)
Total (501) (508) Curragh unit mine cash costs for 1H15 ~ 6% lower than 1H14
Depreciation & amortisation ($m) (73) (76)
EBIT ($m) 35 591 Bengalla reported at 40% share.2 Simple unit cost averages will be impacted by tonnage & cost structure variances between mines.
For
per
sona
l use
onl
y

352015 Half-Year Results |
• On 28 November 2014, Rio Tinto announced that it had increased its assessment of total ROM coal reserves for the Bengalla mine to 271 million tonnes.1 Wesfarmers is evaluating Rio Tinto’s updated assessment preparatory to its own usual annual 30 June resources and reserves statement.
• The information in Rio Tinto’s announcement of 28 November 2014 which is cross referenced in this statement that relates to coal reserves is based on, and fairly represents, information compiled by Mr Andrew Prentice and Mr Richard Ruddock.
– Mr Prentice is a Competent Person who is a member of the Australasian Institute of Mining and Metallurgy and is employed by Rio Tinto Coal Australia Pty Ltd. Mr Prentice has sufficient experience that is relevant to the style of mineralisation and type of deposit under consideration and to the activity being undertaken to qualify as a Competent Person as defined in the 2012 Edition of the ‘Australasian Code for Reporting of Exploration Results, Mineral Resources and Ore Reserves’. Mr Prentice consents to the inclusion in this statement of the matters based on his information in the form and context in which it appears.
– Mr Ruddock is a Competent Person who is a member of the Australasian Institute of Mining and Metallurgy and is employed by Rio Tinto Coal Australia Pty Ltd. Mr Ruddock has sufficient experience that is relevant to the style of mineralisation and type of deposit under consideration and to the activity being undertaken to qualify as a Competent Person as defined in the 2012 Edition of the ‘Australasian Code for Reporting of Exploration Results, Mineral Resources and Ore Reserves’. Mr Ruddock consents to the inclusion in this statement of the matters based on his information in the form and context in which it appears.
Coal Reserves and Resources Notes
1 Comprising 165 million tonnes of proved coal reserves and 106 million tonnes of probable coal reserves (at 27.4MJ/kg and 0.5% sulphur content). For full details see Rio Tinto’s announcement at http://www.asx.com.au/asxpdf/20141128/pdf/42v31ywb30jrn2.pdf. F
or p
erso
nal u
se o
nly

362015 Half-Year Results |
Industrial & SafetyF
or p
erso
nal u
se o
nly

372015 Half-Year Results |
Generalists Safety Specialists Industrial SpecialistsThe broadest range of
industrial & safety supplies and services at competitive
prices.
Ensuring every person is safe, every day, through market leading products & service
solutions.
Depth of expertise in technical fields critical to
customer operations.
Our business portfolio
Workwear GroupPride in what you do,
starts with what you wear.
For
per
sona
l use
onl
y

382015 Half-Year Results |
37 Protector Alsafe
23 NZ Safety
16 Greencap
3 Safety Source
Safety Specialists
11 Coregas + 165 distribution points
22 Bullivants
7 Packaging House
70 Blackwoods (incl Indonesia)
20 Blackwoods Protector
Distribution network: 471 locationsAs at 31 December 2014
Generalists
251 branches, 165 gas distribution points & 55 Workwear franchise locations
Industrial Specialists (+ )
Indonesia
Note: Blackwoods includes Bakers and Total Fasteners locations; Greencap includes NSCA locations.
Workwear Group (+ )
37 Workwear Group + 55 franchised
5 Fastener & Welding Specialists
UK
1
410 88
190
79
45
37
618 9
3
12 31
1216 125
3 32
720 244
34 51
1216 1411
13
131
3
15
10
11
456
43
16
35
UAE1
1
55
165
For
per
sona
l use
onl
y

392015 Half-Year Results |
Presentation outlineBalance Sheet & Cash Flow
For
per
sona
l use
onl
y

402015 Half-Year Results |
Overview of the Group balance sheet
($m)11H14
Restated2 FY14 1H15 CommentaryInventories 5,781 5,336 6,080
Detailed working capital discussion provided on slide 41.
Receivables & prepayments 1,672 1,805 1,644
Trade & other payables (5,933) (5,424) (6,383)
Other 521 403 501
Net working capital 2,041 2,120 1,842
Property, plant & equipment 9,957 9,952 10,123 Increased net capital expenditure from Retail businesses.Lower intangibles following non-cash impairment of Target’s goodwill, partially offset by goodwill on the acquisition of Workwear Group.
Intangibles 19,608 18,956 19,150
Other assets 704 721 705
Provisions & other liabilities (2,649) (2,884) (3,031)
Higher due to acquisition of Workwear Group, higher unredeemed loyalty points & gift cards, liquor restructuring & higher self-insurance costs post Insurance division sale (both 2H14), partially offset by Coles meat contract unwind.
Total capital employed 29,661 28,865 28,789
Net financial debt3 (5,489) (3,050) (4,508) Higher on June 2014 due to December 2014 capital management distribution.
Higher on 1H14 due to lower tax payable (move to monthly instalments) & higher deferred tax assets.
Net tax balances 15 172 464
Total net assets 24,187 25,987 24,7441 The above balances reflect the management balance sheet, which is based on different classification & groupings than the balance sheet in the Appendix 4D.2 1H14 restated for the removal of Insurance assets & liabilities (discontinued operations).3 Net debt net of interest rate swap liabilities.
For
per
sona
l use
onl
y

412015 Half-Year Results |
Balance sheet – working capital
($m)11H14
Restated2 FY14 1H15 Commentary
Inventories 5,781 5,336 6,080
• Retail divisions seasonally higher against June• Inventory increased by $299m (1H15 v 1H14)
HIOS: Higher inventory following store network expansionWIS: Increase due to acquisition of Workwear GroupWesCEF: Higher Fertilisers & Kleenheat inventories
Receivables & prepayments 1,672 1,805 1,644
• Receivables decreased by $28m (1H15 v 1H14)• Receipt of ALWA sale proceeds partially offset commercial
sales growth (Home Improvement)
Trade & other payables (5,933) (5,424) (6,383)
• Retail divisions seasonally higher against June• Payables increased by $450m (1H15 v 1H14)• Sales growth in retail & timing of creditor payments
(Coles)
Other 521 403 501
Net working capital 2,041 2,120 1,842 • Net decrease in net working capital of $199m (1H15 v 1H14)
1 The above table refers to balance sheet movements only. Working capital movements as shown on slide 49 of the presentation exclude non-cash movements which are included in the table above.
2 1H14 restated for the removal of Insurance division assets & liabilities (discontinued operations).
For
per
sona
l use
onl
y

For
per
sona
l use
onl
y