for personal use only · 2020. 9. 10. · building on fy2020 completed commercial “proof of ......
TRANSCRIPT

Investor Presentation – September 2020
For
per
sona
l use
onl
y
This presentation is given on behalf of Ava Risk Group Limited (AVA)
Information in this presentation is for general information purposes only, and is not an offer or invitation for subscription,purchase, or recommendation of securities in AVA. Certain statements in this document regarding the Company’s financialposition, business strategy and objectives may contain forward-looking statements (rather than being based on historical orcurrent facts).Any forward-looking statements are based on the current beliefs of the Company’s management as well as assumptions madeby, and information currently available to, the Company’s management. Forward-looking statements are inherently uncertainand must be read accordingly. There can be no assurance that the underlying assumptions will prove to be valid.All data presented in this document reflects the current views of the Company with respect to future events. Forward-lookingstatements are subject to risks, uncertainties and assumptions relating to the operations, results of operations, growth strategyand liquidity of the Company. To the maximum extent permitted by law, the Company, its officers, employees and agents donot assume any obligation to release any updates or revisions to the information (including any forward looking statements) inthis presentation to reflect any change to expectations or assumptions, and disclaim all responsibility and liability for any lossarising from reliance on this presentation or its content
Forward Looking Statements
2
For
per
sona
l use
onl
y
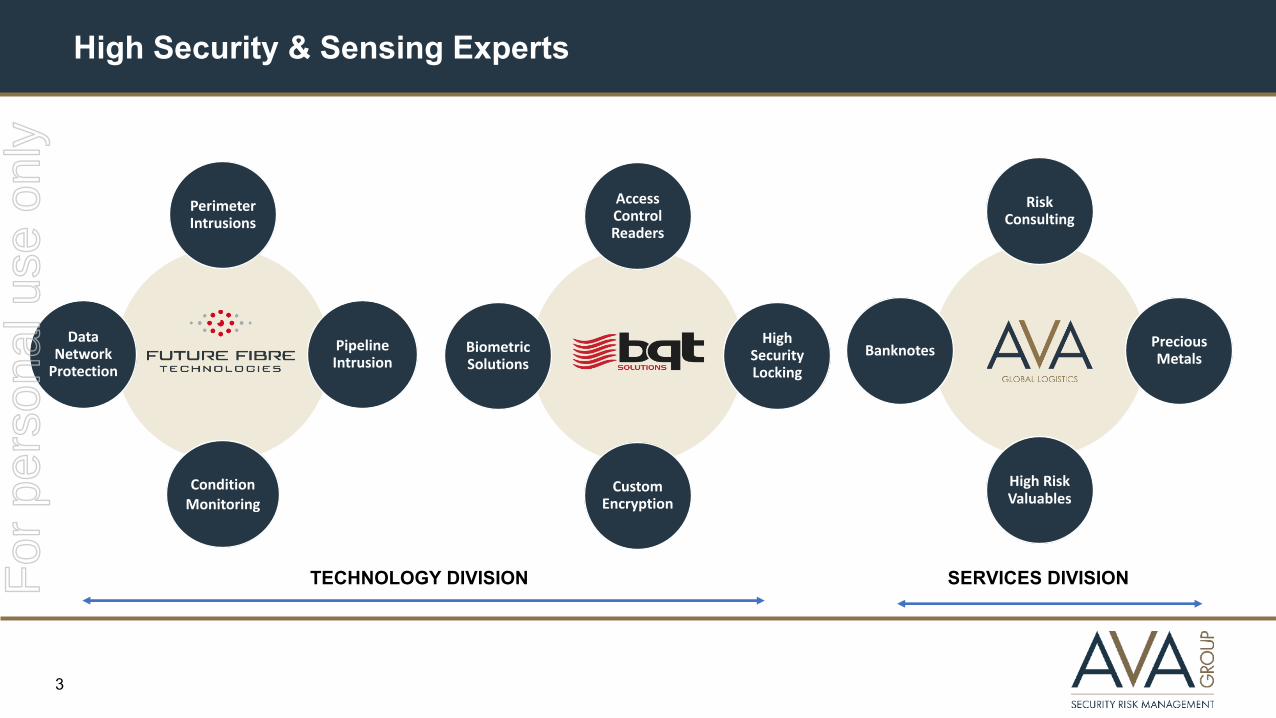
High Security & Sensing Experts
Perimeter Intrusions
Pipeline Intrusion
Condition Monitoring
Data Network
Protection
Access Control Readers
High Security Locking
Custom Encryption
Biometric Solutions
Risk Consulting
Precious Metals
High Risk Valuables
Banknotes
TECHNOLOGY DIVISION SERVICES DIVISION
3
For
per
sona
l use
onl
y

Complimentary Mix of Revenue Streams & Margins
2,500+ Systems
Deployed
$1b Addressable
Market
Products & Services Model
65-80% Gross
Margin
3,500+ Sites
$600m Addressable
Market
COTS & Custom Product
45-60% Gross
Margin
Partners in 100+
Countries
$1b Addressable
Market
Recurring Services Model
21-27% Gross
Margin
TECHNOLOGY DIVISION SERVICES DIVISION
4
For
per
sona
l use
onl
y
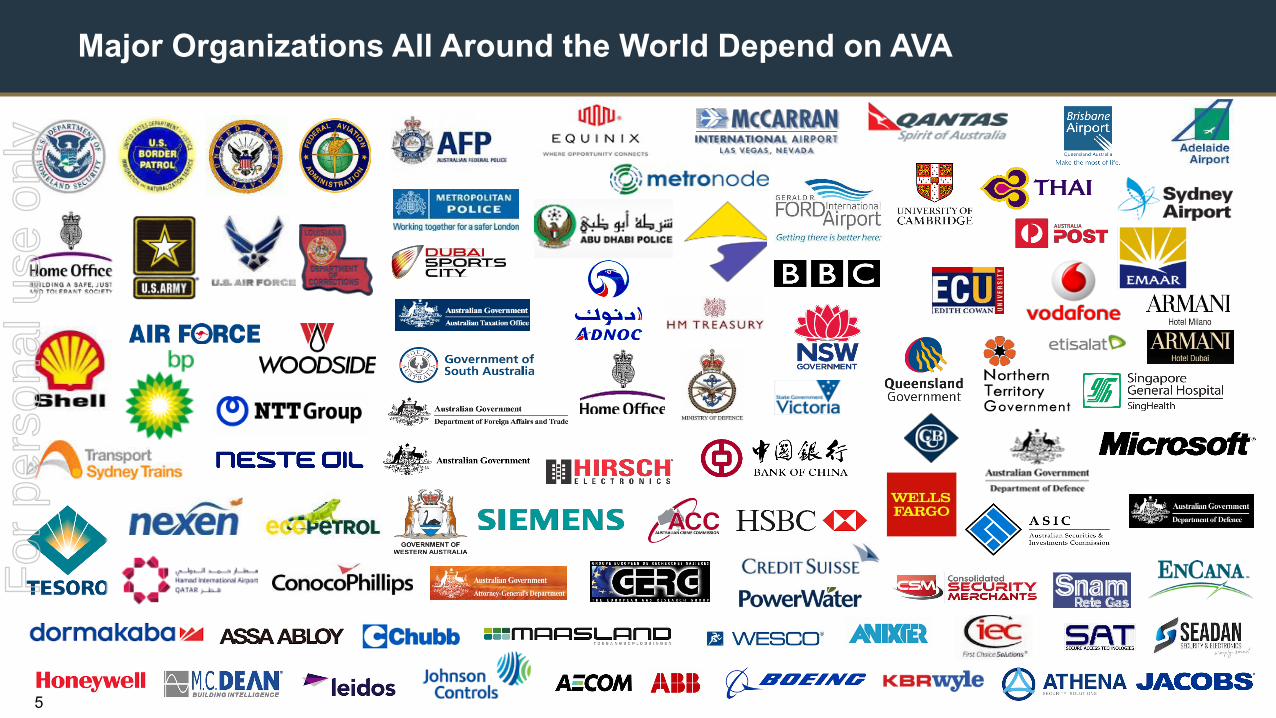
Major Organizations All Around the World Depend on AVA
5
For
per
sona
l use
onl
y

FY2020 Highlights
• FY2020 revenues $46.1m, increased by 46% over PCP• Services Division contributed $25.1m, up 58% over PCP• Technology Division contributed $21.1m, up 34% over PCP
PCP = Previous Corresponding Period
HIGHLY SCALABLE MODEL
STRONG COMPETITIVE ADVANTAGE
STRONG REVENUE GROWTH
GLOBAL EXPANSION OPPORTUNITIES
• FY2020 generated $6.0m net operating cashflow and Gross Margins increased by 5% to 48%, underpinning a highly scalable cost base with ‘land and expand’ revenue model
• Multiple new customer wins in both Services and Technology Divisions• Significant conversion of repeat customers upgrading products on multiple sites
• Highly defensible competitive position, breadth of product range, performance and blue-chip customer base
• Experienced leadership team, with broad global industry knowledge and deep market sector understanding
• Expanding technology and services sales efforts into several new attractive markets globally • Highly competent global sales force with significant pipeline of known technology projects, and
increasing addressable customer spend for provision of valuable logistics services• Thousands of products installed in more than 70 countries
6
For
per
sona
l use
onl
y

FY2020 Results & Growth Strategy
• Continued strong revenue growth with large qualified sales pipeline and addressable client spend• FY2020 revenues increased by more than 46% over PCP from $31.6m to $46.1m• Well funded for growth with $7.7m cash at bank
PCP = Previous Corresponding Period
GROWING PROFITS
SUCCESSFUL NEW PRODUCT LAUNCHES
STRONG REVENUE GROWTH
GROWTH STRATEGY
• FY2020 EBITDA $7.4m from negative $2.9m in PCP ($10.3m improvement)• FY2020 licensing contribution from IMOD contract $4.8m, with a further circa $11.7m+ licensing
income to be delivered in FY2021
• $49m+ qualified sales opportunities for our new Aura IQ conveyor health monitoring solution with multiple commercial “Proof of Value” (POV) deployments.
• Remote installation, commissioning, monitoring and upgrading product solutions to generate recurring revenue from FY2021 onwards
• Invest and continue to grow profitable sales and service channels globally • Differentiate on product performance and expand solutions to address adjacent market segments• Provide exceptional customer service to generate repeat and recurring revenue
7
For
per
sona
l use
onl
y

FY2019 Financial Summary - P&L
AUD$M FY2020 FY2019
Sales Revenue 46.1 31.6COGS (24.1) (17.9)
Gross Profit 22.0 13.7
GP margin (%) 48% 43%
Operating Expenses (15.1) (16.6)
EBITDA* 7.4 (2.9)
Profit / (Loss) after tax 4.9 (4.7)
* Earnings before interest, taxes, depreciation and amortisation
8
For
per
sona
l use
onl
y
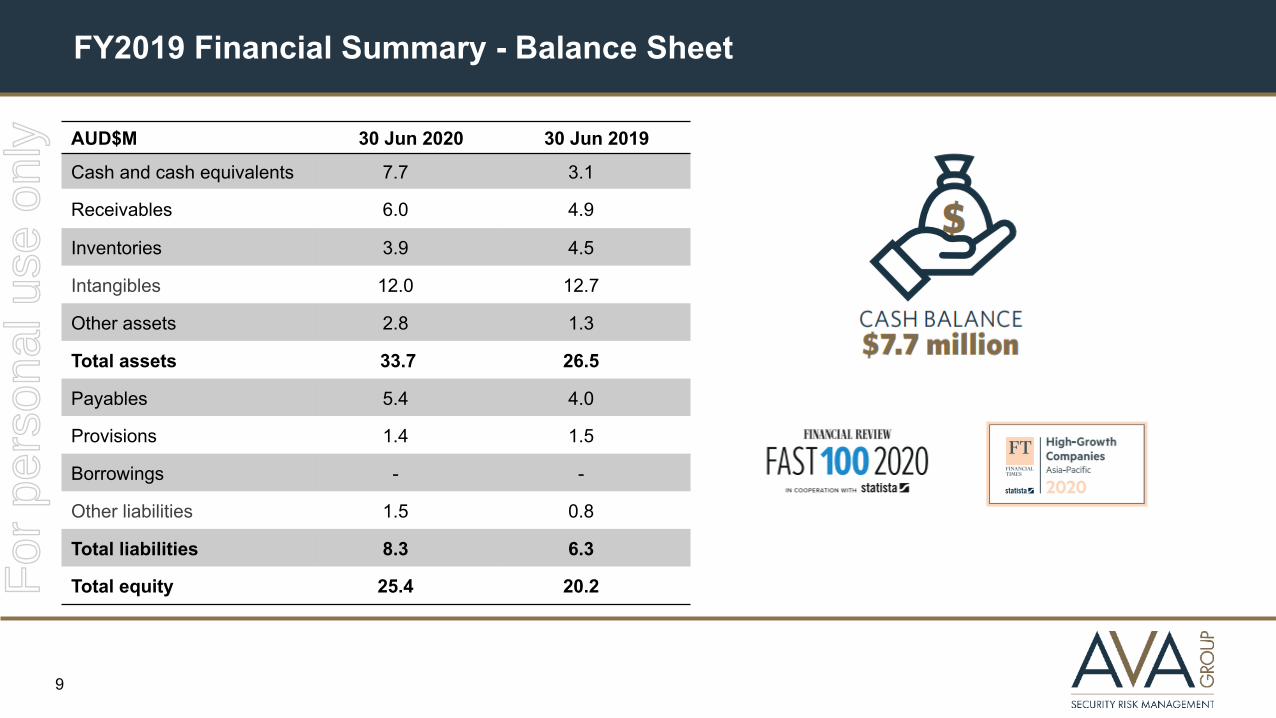
FY2019 Financial Summary - Balance Sheet
AUD$M 30 Jun 2020 30 Jun 2019
Cash and cash equivalents 7.7 3.1
Receivables 6.0 4.9
Inventories 3.9 4.5
Intangibles 12.0 12.7
Other assets 2.8 1.3
Total assets 33.7 26.5
Payables 5.4 4.0
Provisions 1.4 1.5
Borrowings - -
Other liabilities 1.5 0.8
Total liabilities 8.3 6.3
Total equity 25.4 20.2
9
For
per
sona
l use
onl
y

FY2020 Comparison Summary
10
For
per
sona
l use
onl
y
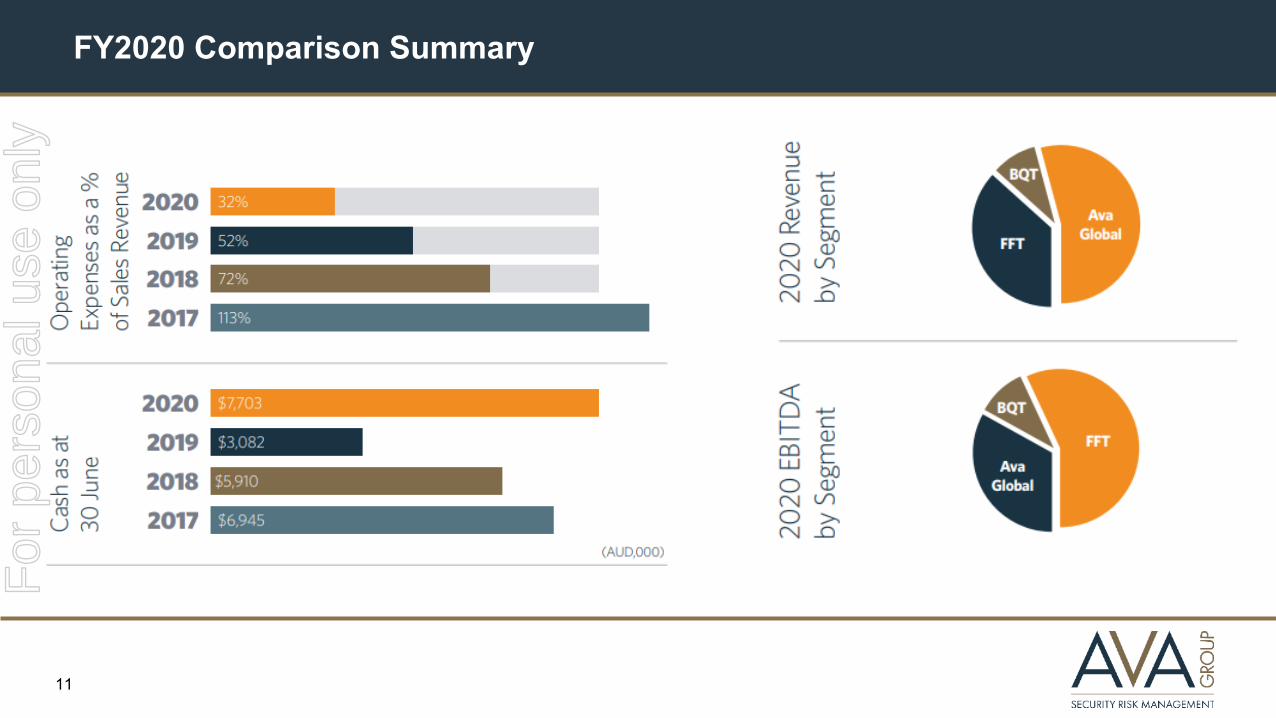
FY2020 Comparison Summary
11
For
per
sona
l use
onl
y

FY2021 Guidance & Growth Strategy
• Continued strong revenue growth with large qualified sales pipeline and addressable client spend• Q1 FY2021 revenues forecast to increase by more than 58% over PCP from $9.8m to $15.5m+• Well funded for growth with $7.7m cash at bank (as at 30 June 2020)
PCP = Previous Corresponding Period
GROWING PROFITS
SUCCESSFUL NEW PRODUCT LAUNCHES
STRONG REVENUE GROWTH
GROWTH STRATEGY
• Q1 FY2021 positive EBITDA forecast, and to grow over PCP• FY2021 licensing contribution from IMOD contract forecast to be circa $11.7m
• $49m+ qualified sales opportunities for our new Aura IQ conveyor health monitoring solution, building on FY2020 completed commercial “Proof of Value” (POV) deployments another 6 POV deployments are currently underway.
• Extend remote installation, commissioning, monitoring and upgrading solutions producing recurring revenues from FY2021
• Invest and continue to grow profitable sales and service channels globally • Extend product performance and expanded solutions to address adjacent market segments• Provide exceptional customer service to generate repeat and recurring revenue
12
For
per
sona
l use
onl
y

Growth Outlook
• World leading technology products installed in more than 70 countries with blue-chip user base• Strong Intellectual Property portfolio with clear TCO and performance advantages• Refer to ASX releases for COVID-19 related challenges
PCP = Previous Corresponding Period
SECURITY CONCERNS
LARGE ADDRESSABLE MARKETS
WORLD LEADING
SOUND METRICS
• Growing global security concerns driving increasing demand and rapid adoption of high security technology, secure remote diagnostics and support capabilities, and utilisation of our high security logistics services
• Attractive industry fundamentals underpin future growth• Strong pipeline of new technology projects, plus continued After Market sales focus of
refresh/conversion of installed base with thousands of legacy systems • Growing addressable client spend in Services Division
• Improved Gross Margins, $14.6m backlog (as at 30 June 2020) and right sized cost base provides good visibility to improved performance
• Strong lift in revenue and earnings as company executes on growth strategy
13
For
per
sona
l use
onl
y
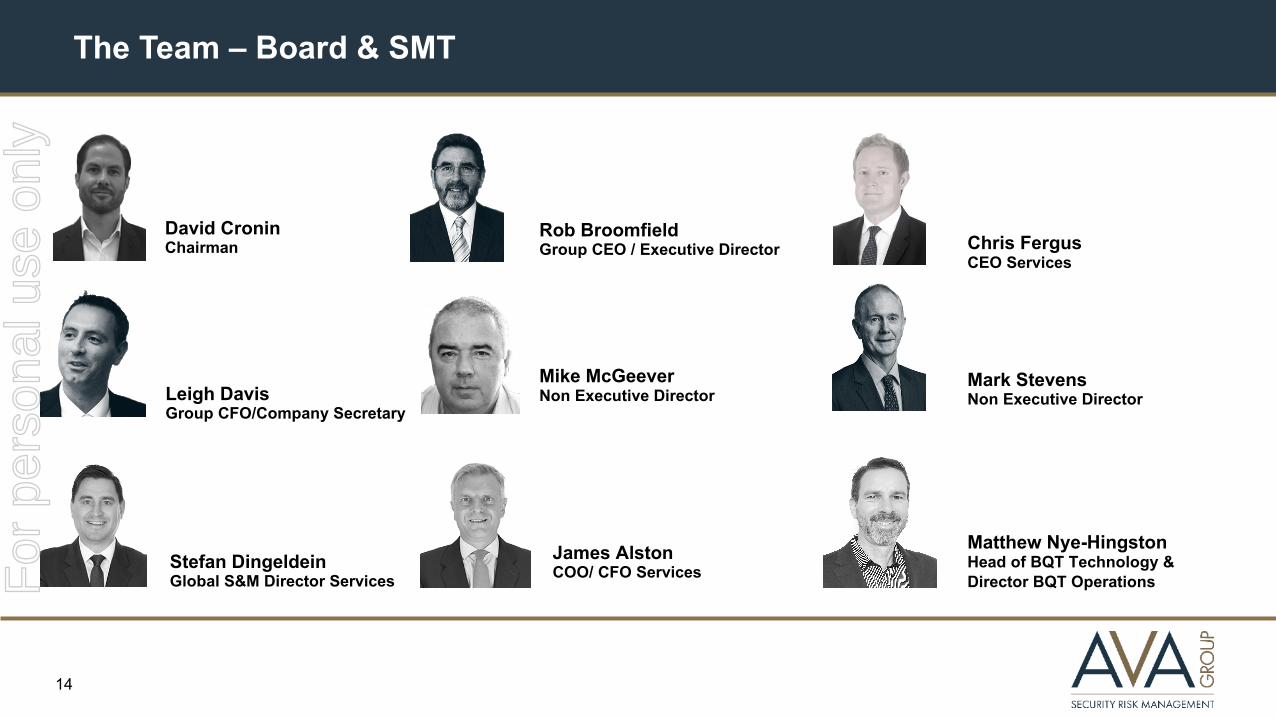
The Team – Board & SMTDavid CroninChairman
Rob BroomfieldGroup CEO / Executive Director
Mike McGeeverNon Executive Director
Mark StevensNon Executive Director
Chris FergusCEO Services
Leigh DavisGroup CFO/Company Secretary
James AlstonCOO/ CFO ServicesStefan Dingeldein
Global S&M Director Services
The Team – Board & SMT
Matthew Nye-HingstonHead of BQT Technology & Director BQT Operations
14
For
per
sona
l use
onl
y

Appendix
15
For
per
sona
l use
onl
y

Global Footprint
Future Fibre Technologies
AVA Global Logistics
BQT Solutions
AVA Group is a diversified risk management technology and services company operating around the globe
Services division
Technology division
16
For
per
sona
l use
onl
y

Large Addressable Markets
Estimated Total Market Value
Current Estimated Addressable Market**
Perimeter Security (sensors)US$11bn (CAGR 13.6%)*
Few key competitorsAvg. Margin Range 65-80%
US$1bn - $2bn
Access Control SystemsUS$6.3bn (CAGR 12.2%)*
Many key competitorsAvg. Margin Range 45-60%
US$0.6bn - $1.5bn
International Valuable LogisticsUS$1.0bn - $1.5bn
Few key competitorsAvg. Margin Range 21-27%
US$0.6bn - $1.0bn
* Markets and Markets: Perimeter Security Market Global Forecast to 2020.** Ava Management assessment
17
For
per
sona
l use
onl
y

Services Division – Ava Global Logistics
• Ava Global Logistics is a growing global provider of secure international logistics of high-risk valuables, precious metals and currency.
• Provides fully insured, door to door services, utilising a network of highly experienced service providers, freight forwarders, airlines and customs brokers, all operating under Ava’s strict risk management guidelines.
• Unique Partner model: ability to provide service in 100+ countries.
• Blue chip client base.
• Global footprint with offices in New York, London, Frankfurt, Dubai & Singapore.
18
For
per
sona
l use
onl
y

Services Division – Market Segment: Precious Metals
Mines Refiners Banks/Bullion Traders
• Full Lifecycle of ore from mine to consumer
• Global movement on behalf of international client base of mines, refiners, banks and bullion traders
19
For
per
sona
l use
onl
y

Services Division – Market Segment: Currency
• Full lifecycle of transportation, aggregation and cash processing
Banknote Printers Central Banks Bulk Commercial Banks
20
For
per
sona
l use
onl
y
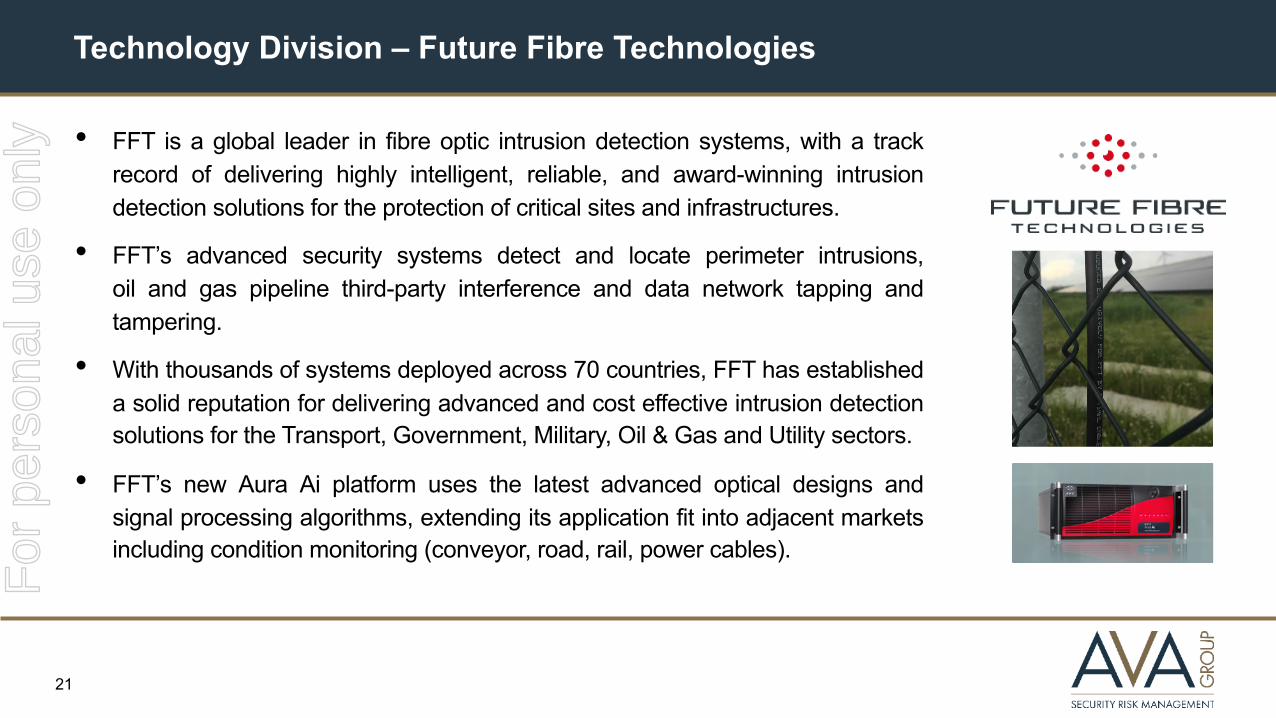
Technology Division – Future Fibre Technologies
• FFT is a global leader in fibre optic intrusion detection systems, with a trackrecord of delivering highly intelligent, reliable, and award-winning intrusiondetection solutions for the protection of critical sites and infrastructures.
• FFT’s advanced security systems detect and locate perimeter intrusions,oil and gas pipeline third-party interference and data network tapping andtampering.
• With thousands of systems deployed across 70 countries, FFT has establisheda solid reputation for delivering advanced and cost effective intrusion detectionsolutions for the Transport, Government, Military, Oil & Gas and Utility sectors.
• FFT’s new Aura Ai platform uses the latest advanced optical designs andsignal processing algorithms, extending its application fit into adjacent marketsincluding condition monitoring (conveyor, road, rail, power cables).
21
For
per
sona
l use
onl
y

Technology Division – BQT Solutions
• BQT’s secure, reliable smart reader and card systems, biometric solutions,electric locking, and access control products are utilised at thousands ofsites in more than 50 countries.
• A leader in high security access control technology used in some of the mosthigh security, critical applications in the world.
• Offers custom and “off the shelf” products to deliver market-wide accesscontrol security including military, critical infrastructure, commercial, industrialand residential applications.
22
For
per
sona
l use
onl
y
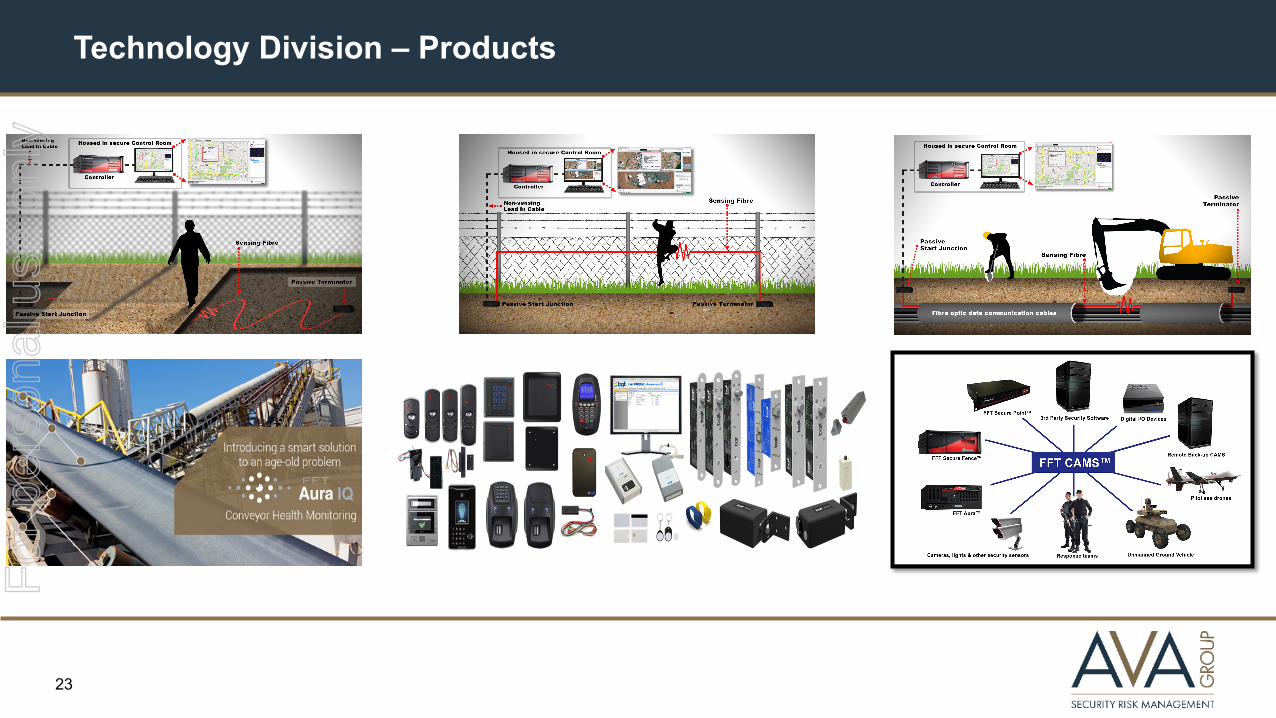
Technology Division – Products
23
For
per
sona
l use
onl
y
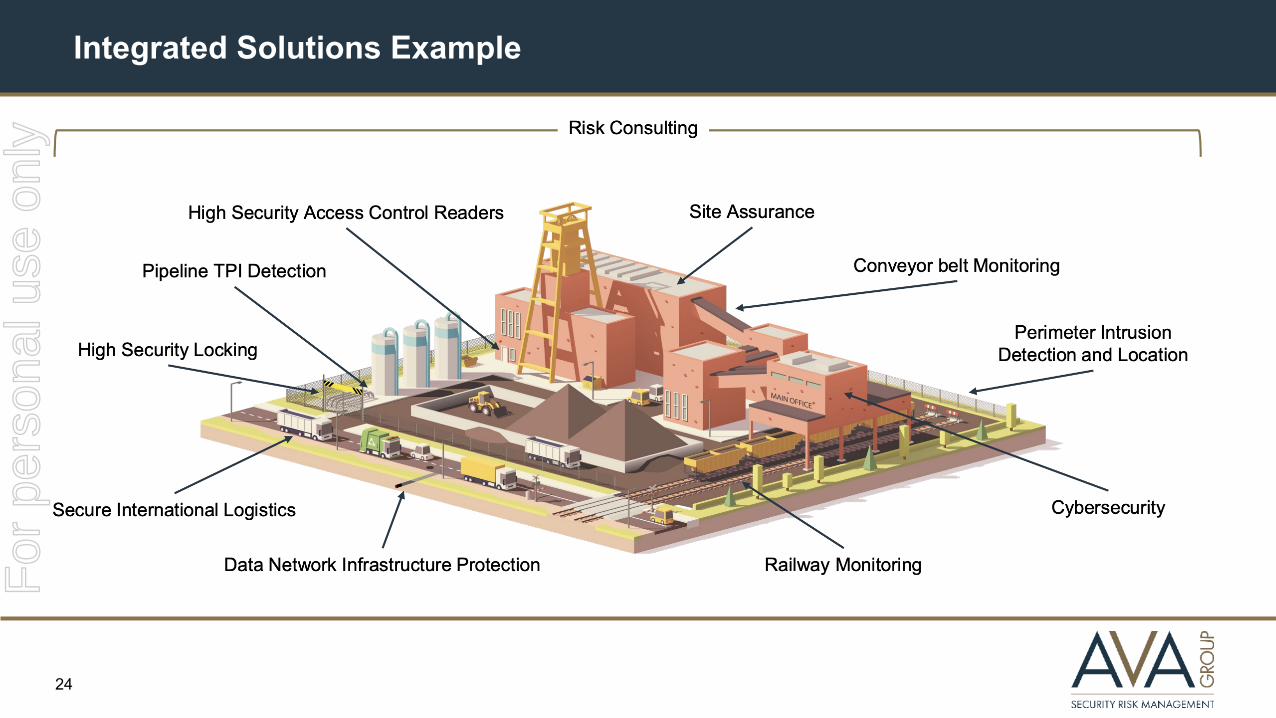
Integrated Solutions Example
24
For
per
sona
l use
onl
y

Diverse Market Sectors
UTILITIES
CHEMICAL, OIL, GAS & MINING
MILITARY
GOVERNMENT
TRANSPORTATION
COMMERCIAL & RESIDENTIAL
CORRECTION FACILITIES & BORDERS
25
For
per
sona
l use
onl
y
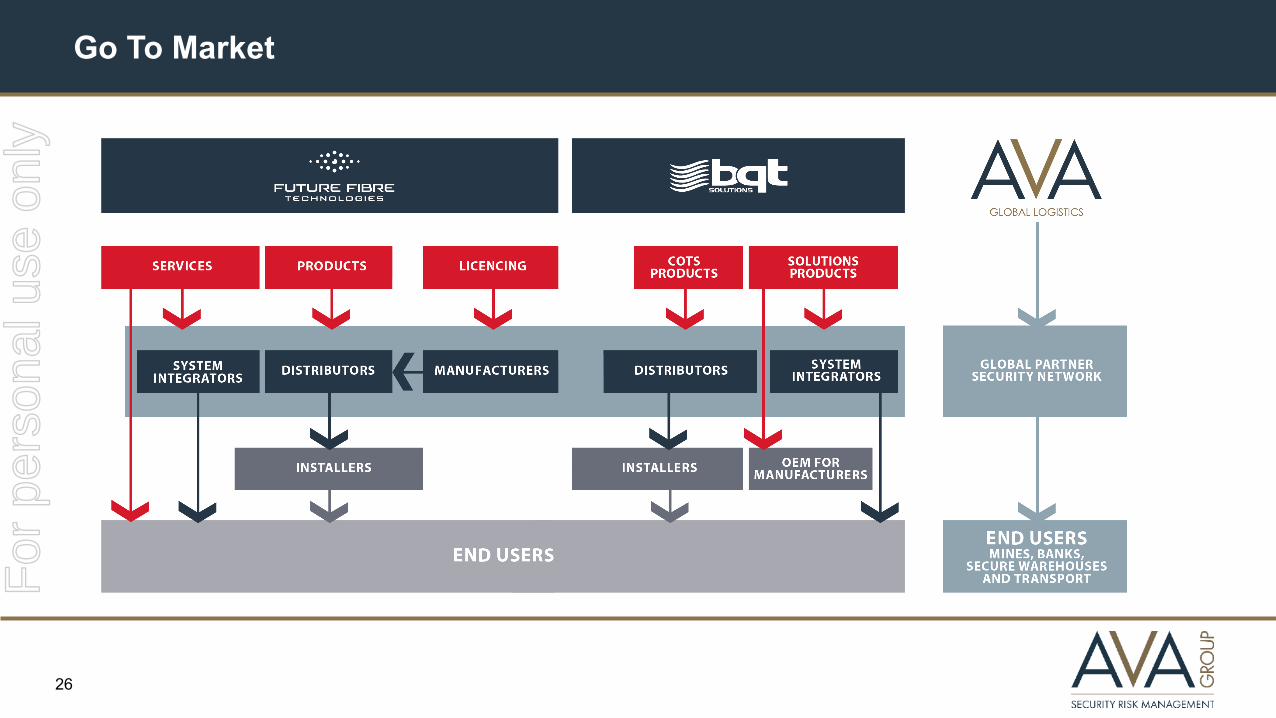
Go To Market
26
For
per
sona
l use
onl
y