fy2020 first quarter consolidated financial results...23 hours ago · advantest corporation...
TRANSCRIPT
Advantest Corporation (FY2020 Q1)
FY2020 First Quarter Consolidated Financial Results (Advantest’s consolidated financial statements are prepared in accordance with IFRS)
(Period ended June 30, 2020)
July 30, 2020
Company Name : Advantest Corporation
(URL https://www.advantest.com/investors)
Stock Exchange on which shares are listed : First section of the Tokyo Stock Exchange
Stock Code Number : 6857
Company Representative : Yoshiaki Yoshida, Representative Director, President and
CEO
Contact Person : Atsushi Fujita, Director and Managing Executive Officer
Executive Vice President, Corporate Administration Group
(03) 3214-7500
Quarterly Report Filing Date (as planned) : August 13, 2020
Dividend Payable Date (as planned) : ―
Quarterly Results Supplemental Materials : Yes
Quarterly Results Presentation Meeting : Yes
(Rounded to the nearest million yen)
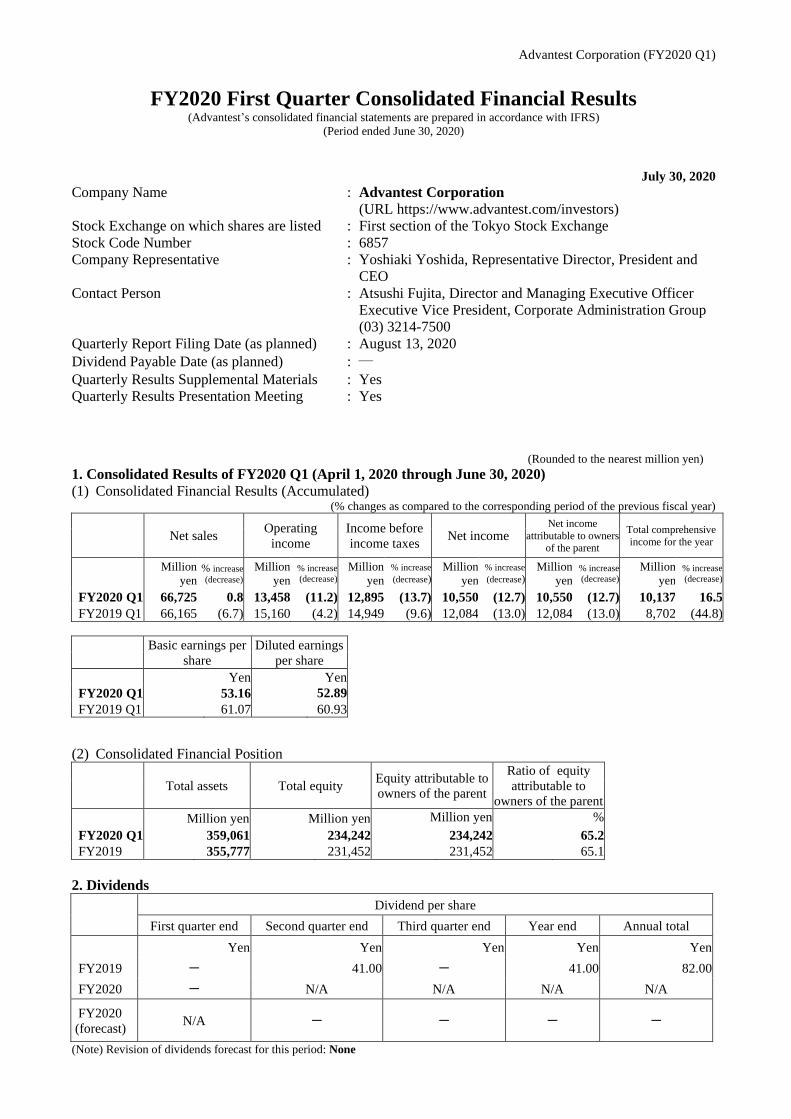
1. Consolidated Results of FY2020 Q1 (April 1, 2020 through June 30, 2020)
(1) Consolidated Financial Results (Accumulated) (% changes as compared to the corresponding period of the previous fiscal year)
Net sales
Operating
income
Income before
income taxes Net income
Net income
attributable to owners of the parent
Total comprehensive
income for the year
Million
yen % increase
(decrease) Million
yen % increase
(decrease)
Million
yen
% increase
(decrease) Million
yen
% increase
(decrease) Million
yen % increase
(decrease)
Million
yen % increase
(decrease)
FY2020 Q1 66,725 0.8 13,458 (11.2) 12,895 (13.7) 10,550 (12.7) 10,550 (12.7) 10,137 16.5
FY2019 Q1 66,165 (6.7) 15,160 (4.2) 14,949 (9.6) 12,084 (13.0) 12,084 (13.0) 8,702 (44.8)
Basic earnings per
share
Diluted earnings
per share
Yen Yen
FY2020 Q1 53.16 52.89
FY2019 Q1 61.07 60.93
(2) Consolidated Financial Position
Total assets Total equity
Equity attributable to
owners of the parent
Ratio of equity
attributable to
owners of the parent
Million yen Million yen Million yen %
FY2020 Q1 359,061 234,242 234,242 65.2
FY2019 355,777 231,452 231,452 65.1
2. Dividends
Dividend per share
First quarter end Second quarter end Third quarter end Year end Annual total
Yen Yen Yen Yen Yen
FY2019 - 41.00 - 41.00 82.00
FY2020 - N/A N/A N/A N/A
FY2020
(forecast) N/A - - - -
(Note) Revision of dividends forecast for this period: None
Advantest Corporation (FY2020 Q1)
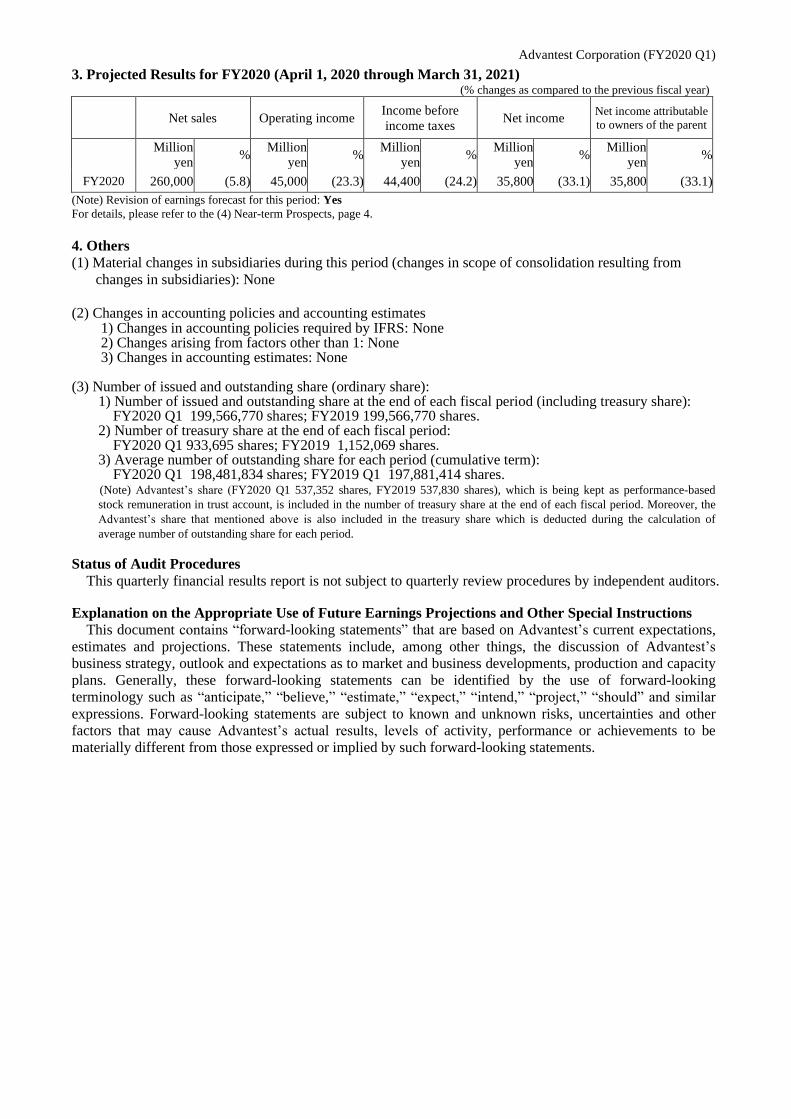
3. Projected Results for FY2020 (April 1, 2020 through March 31, 2021) (% changes as compared to the previous fiscal year)
Net sales Operating income Income before
income taxes Net income
Net income attributable
to owners of the parent
Million
yen %
Million
yen %
Million
yen %
Million
yen %
Million
yen %
FY2020 260,000 (5.8) 45,000 (23.3) 44,400 (24.2) 35,800 (33.1) 35,800 (33.1)
(Note) Revision of earnings forecast for this period: Yes
For details, please refer to the (4) Near-term Prospects, page 4.
4. Others
(1) Material changes in subsidiaries during this period (changes in scope of consolidation resulting from
changes in subsidiaries): None
(2) Changes in accounting policies and accounting estimates 1) Changes in accounting policies required by IFRS: None 2) Changes arising from factors other than 1: None 3) Changes in accounting estimates: None
(3) Number of issued and outstanding share (ordinary share):
1) Number of issued and outstanding share at the end of each fiscal period (including treasury share): FY2020 Q1 199,566,770 shares; FY2019 199,566,770 shares.
2) Number of treasury share at the end of each fiscal period: FY2020 Q1 933,695 shares; FY2019 1,152,069 shares.
3) Average number of outstanding share for each period (cumulative term): FY2020 Q1 198,481,834 shares; FY2019 Q1 197,881,414 shares.
(Note) Advantest’s share (FY2020 Q1 537,352 shares, FY2019 537,830 shares), which is being kept as performance-based
stock remuneration in trust account, is included in the number of treasury share at the end of each fiscal period. Moreover, the
Advantest’s share that mentioned above is also included in the treasury share which is deducted during the calculation of
average number of outstanding share for each period.
Status of Audit Procedures
This quarterly financial results report is not subject to quarterly review procedures by independent auditors.
Explanation on the Appropriate Use of Future Earnings Projections and Other Special Instructions
This document contains “forward-looking statements” that are based on Advantest’s current expectations,
estimates and projections. These statements include, among other things, the discussion of Advantest’s
business strategy, outlook and expectations as to market and business developments, production and capacity
plans. Generally, these forward-looking statements can be identified by the use of forward-looking
terminology such as “anticipate,” “believe,” “estimate,” “expect,” “intend,” “project,” “should” and similar
expressions. Forward-looking statements are subject to known and unknown risks, uncertainties and other
factors that may cause Advantest’s actual results, levels of activity, performance or achievements to be
materially different from those expressed or implied by such forward-looking statements.
Advantest Corporation (FY2020 Q1)
1
Contents 1. Overview of Business Results・・・・・・・・・・・・・・・・・・・・・・・・・・・・・・・・・・・・・・・・・・・・・・・・・ P. 2
(1) Overview of Business Results・・・・・・・・・・・・・・・・・・・・・・・・・・・・・・・・・・・・・・・・・・・・・ P. 2 (2) Overview of Financial Condition・・・・・・・・・・・・・・・・・・・・・・・・・・・・・・・・・・・・・・・・・・ P. 4 (3) Overview of Cash Flows・・・・・・・・・・・・・・・・・・・・・・・・・・・・・・・・・・・・・・・・・・・・・・・・・ P. 4 (4) Near-term Prospects ・・・・・・・・・・・・・・・・・・・・・・・・・・・・・・・・・・・・・・・・・・・・・・・・・・・・ P. 4
2. Condensed Consolidated Financial Statements・・・・・・・・・・・・・・・・・・・・・・・・・・・・・・・・・・・・ P. 7 (1) Condensed Consolidated Statement of Financial Position・・・・・・・・・・・・・・・・・・・・・・・ P. 7 (2) Condensed Consolidated Statement of Profit or Loss and Condensed Consolidated
Statements of Comprehensive Income・・・・・・・・・・・・・・・・・・・・・・・・・・・・・・・・・・・・・・・ P. 9 (3) Condensed Consolidated Statement of Changes in Equity・・・・・・・・・・・・・・・・・・・・・・・ P. 11 (4) Condensed Consolidated Statement of Cash Flows ・・・・・・・・・・・・・・・・・・・・・・・・・・・・ P. 12 (5) Notes to the Condensed Consolidated Financial Statements・・・・・・・・・・・・・・・・・・・・・・・ P. 13
(Notes on Going Concern)・・・・・・・・・・・・・・・・・・・・・・・・・・・・・・・・・・・・・・・・・・・・・・・・・ P. 13 (Segment Information)・・・・・・・・・・・・・・・・・・・・・・・・・・・・・・・・・・・・・・・・・・・・・・・・・・・・ P. 13
FY2020 First Quarter Consolidated Financial Results Overview ・・・・・・・・・・・・・・・・・・・・・ P. 14
Advantest Corporation (FY2020 Q1)
2
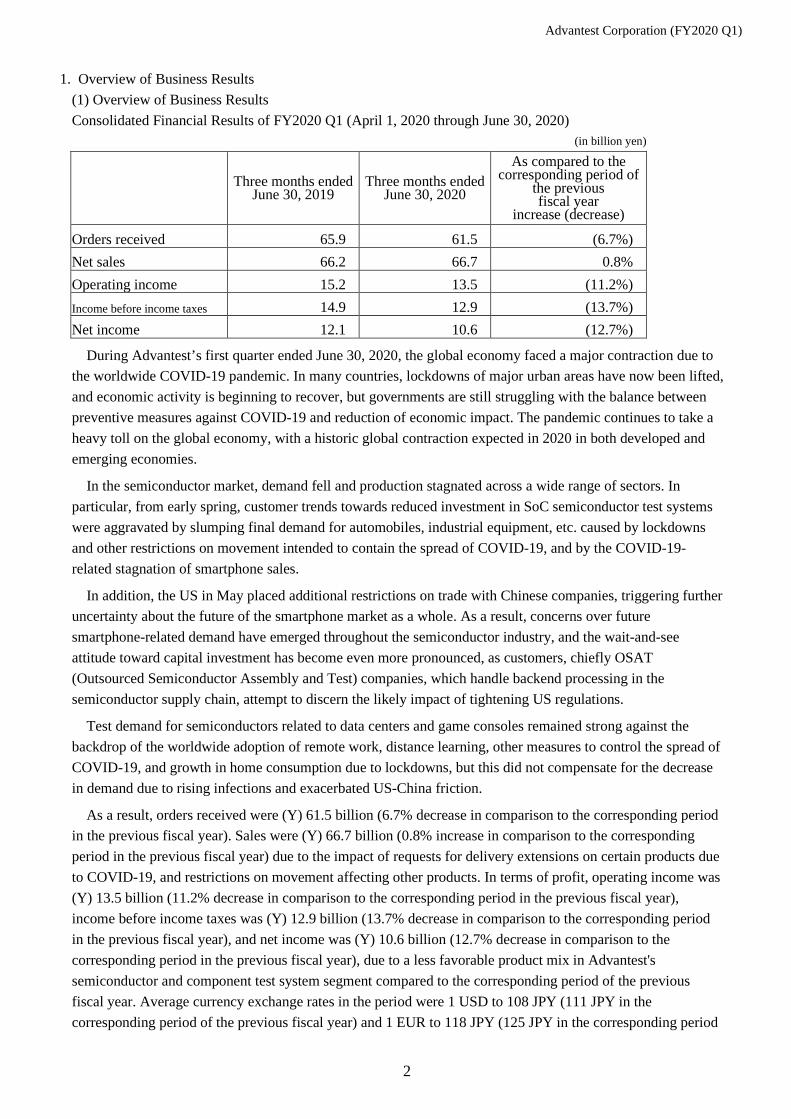
1. Overview of Business Results (1) Overview of Business Results Consolidated Financial Results of FY2020 Q1 (April 1, 2020 through June 30, 2020)
(in billion yen)
Three months ended June 30, 2019
Three months ended June 30, 2020
As compared to the corresponding period of
the previous fiscal year
increase (decrease)
Orders received 65.9 61.5 (6.7%) Net sales 66.2 66.7 0.8% Operating income 15.2 13.5 (11.2%) Income before income taxes 14.9 12.9 (13.7%) Net income 12.1 10.6 (12.7%)
During Advantest’s first quarter ended June 30, 2020, the global economy faced a major contraction due to the worldwide COVID-19 pandemic. In many countries, lockdowns of major urban areas have now been lifted, and economic activity is beginning to recover, but governments are still struggling with the balance between preventive measures against COVID-19 and reduction of economic impact. The pandemic continues to take a heavy toll on the global economy, with a historic global contraction expected in 2020 in both developed and emerging economies.
In the semiconductor market, demand fell and production stagnated across a wide range of sectors. In particular, from early spring, customer trends towards reduced investment in SoC semiconductor test systems were aggravated by slumping final demand for automobiles, industrial equipment, etc. caused by lockdowns and other restrictions on movement intended to contain the spread of COVID-19, and by the COVID-19-related stagnation of smartphone sales.
In addition, the US in May placed additional restrictions on trade with Chinese companies, triggering further uncertainty about the future of the smartphone market as a whole. As a result, concerns over future smartphone-related demand have emerged throughout the semiconductor industry, and the wait-and-see attitude toward capital investment has become even more pronounced, as customers, chiefly OSAT (Outsourced Semiconductor Assembly and Test) companies, which handle backend processing in the semiconductor supply chain, attempt to discern the likely impact of tightening US regulations.
Test demand for semiconductors related to data centers and game consoles remained strong against the backdrop of the worldwide adoption of remote work, distance learning, other measures to control the spread of COVID-19, and growth in home consumption due to lockdowns, but this did not compensate for the decrease in demand due to rising infections and exacerbated US-China friction.
As a result, orders received were (Y) 61.5 billion (6.7% decrease in comparison to the corresponding period in the previous fiscal year). Sales were (Y) 66.7 billion (0.8% increase in comparison to the corresponding period in the previous fiscal year) due to the impact of requests for delivery extensions on certain products due to COVID-19, and restrictions on movement affecting other products. In terms of profit, operating income was (Y) 13.5 billion (11.2% decrease in comparison to the corresponding period in the previous fiscal year), income before income taxes was (Y) 12.9 billion (13.7% decrease in comparison to the corresponding period in the previous fiscal year), and net income was (Y) 10.6 billion (12.7% decrease in comparison to the corresponding period in the previous fiscal year), due to a less favorable product mix in Advantest's semiconductor and component test system segment compared to the corresponding period of the previous fiscal year. Average currency exchange rates in the period were 1 USD to 108 JPY (111 JPY in the corresponding period of the previous fiscal year) and 1 EUR to 118 JPY (125 JPY in the corresponding period
Advantest Corporation (FY2020 Q1)
3
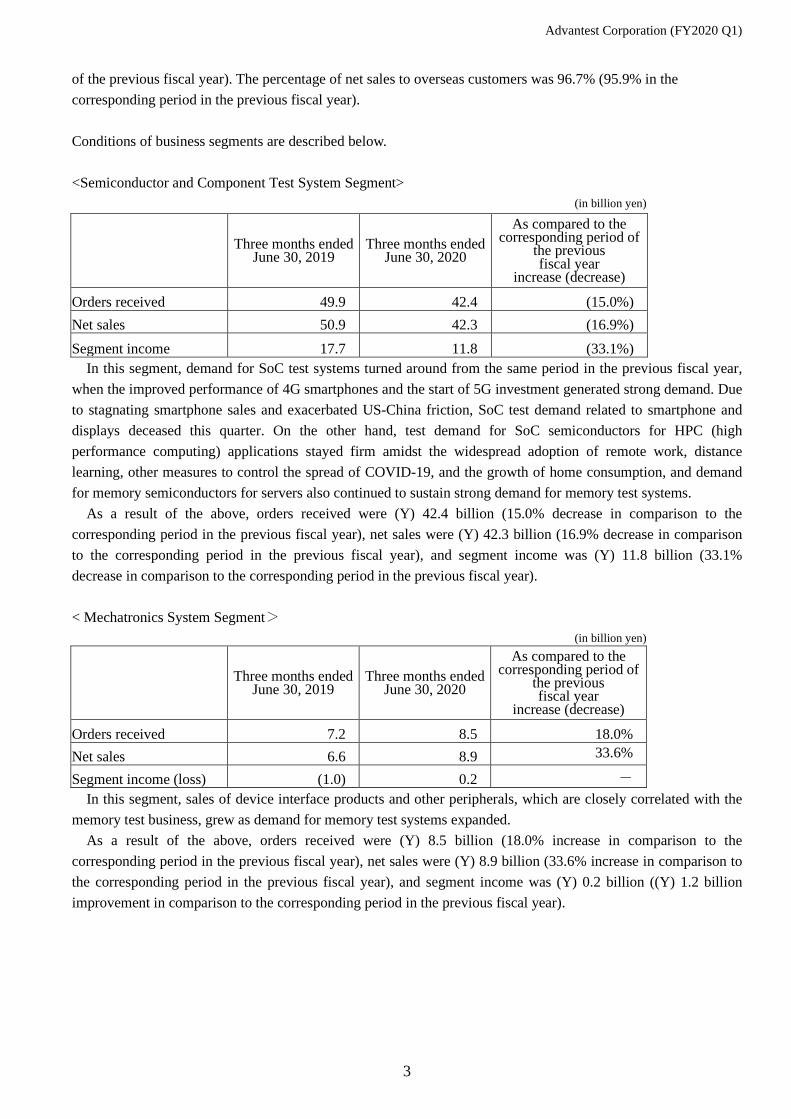
of the previous fiscal year). The percentage of net sales to overseas customers was 96.7% (95.9% in the corresponding period in the previous fiscal year). Conditions of business segments are described below. <Semiconductor and Component Test System Segment>
(in billion yen)
Three months ended June 30, 2019
Three months ended June 30, 2020
As compared to the corresponding period of
the previous fiscal year
increase (decrease)
Orders received 49.9 42.4 (15.0%) Net sales 50.9 42.3 (16.9%) Segment income 17.7 11.8 (33.1%)
In this segment, demand for SoC test systems turned around from the same period in the previous fiscal year, when the improved performance of 4G smartphones and the start of 5G investment generated strong demand. Due to stagnating smartphone sales and exacerbated US-China friction, SoC test demand related to smartphone and displays deceased this quarter. On the other hand, test demand for SoC semiconductors for HPC (high performance computing) applications stayed firm amidst the widespread adoption of remote work, distance learning, other measures to control the spread of COVID-19, and the growth of home consumption, and demand for memory semiconductors for servers also continued to sustain strong demand for memory test systems.
As a result of the above, orders received were (Y) 42.4 billion (15.0% decrease in comparison to the corresponding period in the previous fiscal year), net sales were (Y) 42.3 billion (16.9% decrease in comparison to the corresponding period in the previous fiscal year), and segment income was (Y) 11.8 billion (33.1% decrease in comparison to the corresponding period in the previous fiscal year).
< Mechatronics System Segment>
(in billion yen)
Three months ended June 30, 2019
Three months ended June 30, 2020
As compared to the corresponding period of
the previous fiscal year
increase (decrease)
Orders received 7.2 8.5 18.0% Net sales 6.6 8.9 33.6%
% Segment income (loss) (1.0) 0.2 -
In this segment, sales of device interface products and other peripherals, which are closely correlated with the memory test business, grew as demand for memory test systems expanded.
As a result of the above, orders received were (Y) 8.5 billion (18.0% increase in comparison to the corresponding period in the previous fiscal year), net sales were (Y) 8.9 billion (33.6% increase in comparison to the corresponding period in the previous fiscal year), and segment income was (Y) 0.2 billion ((Y) 1.2 billion improvement in comparison to the corresponding period in the previous fiscal year).
Advantest Corporation (FY2020 Q1)
4
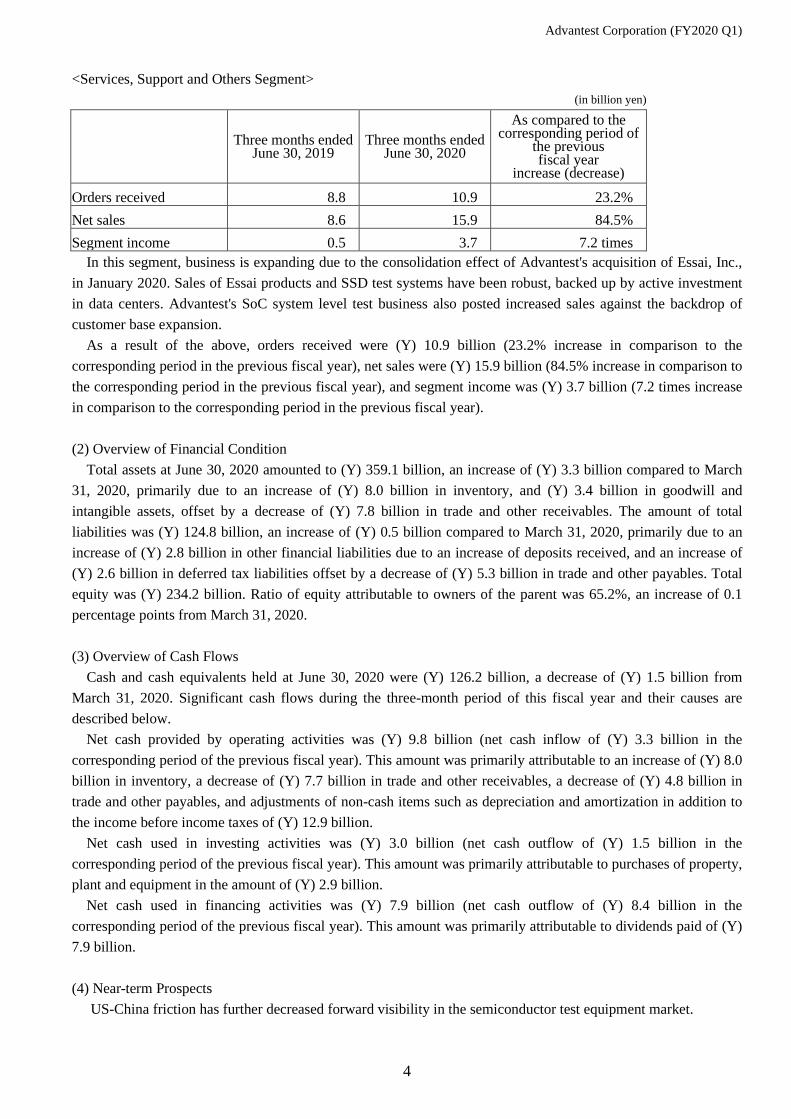
<Services, Support and Others Segment> (in billion yen)
Three months ended June 30, 2019
Three months ended June 30, 2020
As compared to the corresponding period of
the previous fiscal year
increase (decrease)
Orders received 8.8 10.9 23.2% Net sales 8.6 15.9 84.5% Segment income 0.5 3.7 7.2 times
In this segment, business is expanding due to the consolidation effect of Advantest's acquisition of Essai, Inc., in January 2020. Sales of Essai products and SSD test systems have been robust, backed up by active investment in data centers. Advantest's SoC system level test business also posted increased sales against the backdrop of customer base expansion.
As a result of the above, orders received were (Y) 10.9 billion (23.2% increase in comparison to the corresponding period in the previous fiscal year), net sales were (Y) 15.9 billion (84.5% increase in comparison to the corresponding period in the previous fiscal year), and segment income was (Y) 3.7 billion (7.2 times increase in comparison to the corresponding period in the previous fiscal year). (2) Overview of Financial Condition
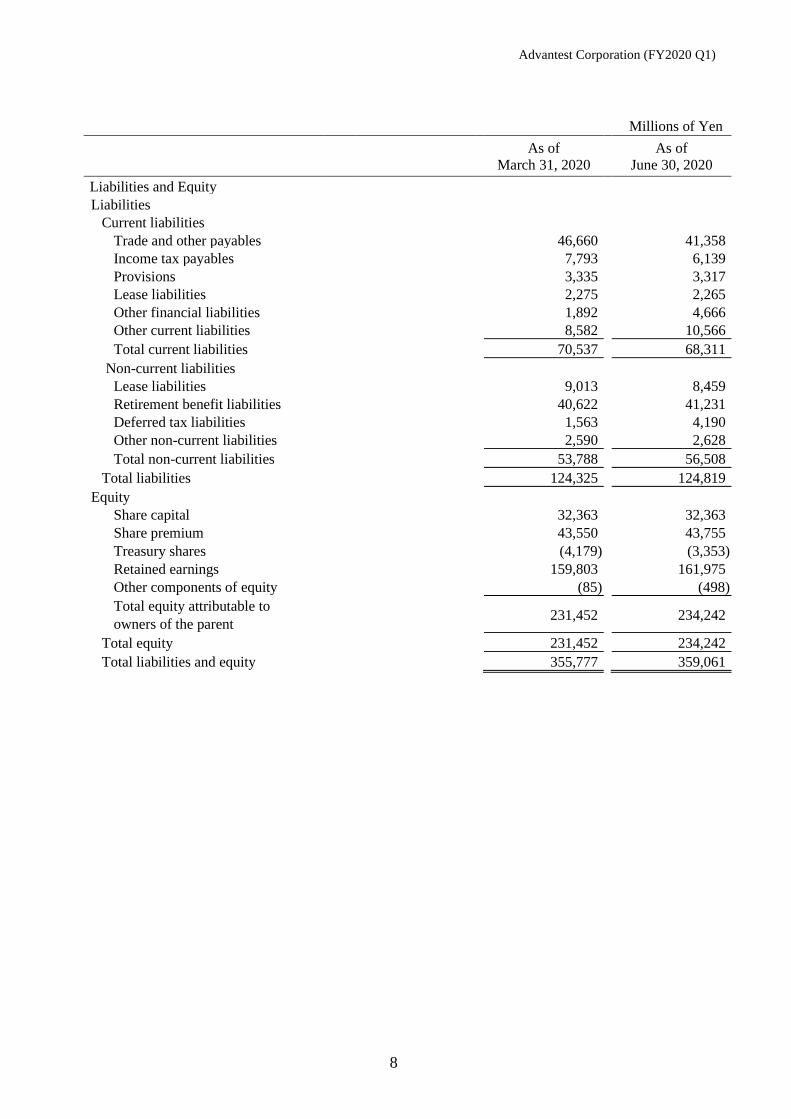
Total assets at June 30, 2020 amounted to (Y) 359.1 billion, an increase of (Y) 3.3 billion compared to March 31, 2020, primarily due to an increase of (Y) 8.0 billion in inventory, and (Y) 3.4 billion in goodwill and intangible assets, offset by a decrease of (Y) 7.8 billion in trade and other receivables. The amount of total liabilities was (Y) 124.8 billion, an increase of (Y) 0.5 billion compared to March 31, 2020, primarily due to an increase of (Y) 2.8 billion in other financial liabilities due to an increase of deposits received, and an increase of (Y) 2.6 billion in deferred tax liabilities offset by a decrease of (Y) 5.3 billion in trade and other payables. Total equity was (Y) 234.2 billion. Ratio of equity attributable to owners of the parent was 65.2%, an increase of 0.1 percentage points from March 31, 2020. (3) Overview of Cash Flows
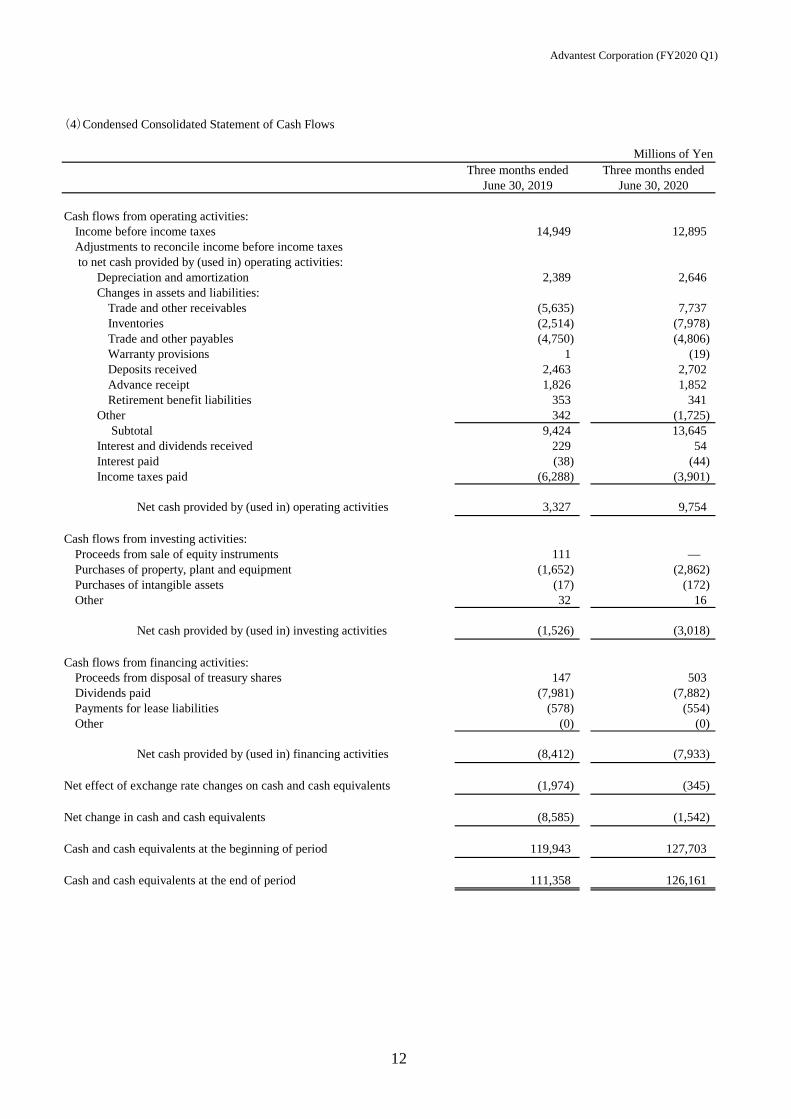
Cash and cash equivalents held at June 30, 2020 were (Y) 126.2 billion, a decrease of (Y) 1.5 billion from March 31, 2020. Significant cash flows during the three-month period of this fiscal year and their causes are described below.
Net cash provided by operating activities was (Y) 9.8 billion (net cash inflow of (Y) 3.3 billion in the corresponding period of the previous fiscal year). This amount was primarily attributable to an increase of (Y) 8.0 billion in inventory, a decrease of (Y) 7.7 billion in trade and other receivables, a decrease of (Y) 4.8 billion in trade and other payables, and adjustments of non-cash items such as depreciation and amortization in addition to the income before income taxes of (Y) 12.9 billion.
Net cash used in investing activities was (Y) 3.0 billion (net cash outflow of (Y) 1.5 billion in the corresponding period of the previous fiscal year). This amount was primarily attributable to purchases of property, plant and equipment in the amount of (Y) 2.9 billion.
Net cash used in financing activities was (Y) 7.9 billion (net cash outflow of (Y) 8.4 billion in the corresponding period of the previous fiscal year). This amount was primarily attributable to dividends paid of (Y) 7.9 billion. (4) Near-term Prospects
US-China friction has further decreased forward visibility in the semiconductor test equipment market.
Advantest Corporation (FY2020 Q1)
5
Currently, many SoC semiconductors installed in smartphones, servers, and game consoles are being mass-produced under fabless-foundry-OSAT model. This market structure causes any change in the demand outlook for some leading products or key companies to have strong knock-on effects on SoC semiconductor test equipment utilization rates and new investment across the entire semiconductor supply chain. It is extremely unclear how U.S.-China friction will affect business trends in the smartphone market and related major semiconductor manufacturers in the future, but given the possibility of declining test demand from the major chipmaker which is subject to US regulations, customers are likely to adjust their investments in SoC test equipment downwards for the foreseeable future. In addition, the spread of COVID-19 will probably restrict demand for semiconductor test equipment related to automobiles, industrial equipment, and displays for the time being. Although demand for memory testers is expected to increase year on year amidst increased data traffic volumes due to the widespread adoption of telecommuting, the 2020 semiconductor test equipment market as a whole is predicted to remain flat year-on-year as a result of exacerbated US-China friction and COVID-19.
Based on this market outlook, Advantest’s consolidated financial forecasts for the current consolidated fiscal year are as follows: orders of (Y) 240.0 billion, sales of (Y) 260.0 billion, operating income of (Y) 45.0 billion, income before income taxes of (Y) 44.4 billion, and net income of (Y) 35.8 billion. The forecasted exchange rates for the nine months starting in the second quarter of the current consolidated fiscal year are 105 yen to the US dollar and 120 yen to the euro. Given that results from COVID-19 containment measures have been uncertain, and the global economy may slow down in response to a "second wave," Advantest has set flexible response to changes in the external environment during the current consolidated fiscal year as a top priority. In addition, while the consequences of the US-China economic decoupling are very hard to predict, the company will seek to craft an appropriate response to the situation without underestimating its impact.
In April, Advantest foresaw five major categories of business risk resulting from the COVID-19 pandemic: (1) Interruptions to business / reduced efficiency due to possible infection of employees of the Advantest
Group, customers, and/or suppliers (2) Problems caused by long-term restrictions on movement and lockdowns around the world
i) Declines in product supply capacity due to shortages of manufacturing personnel at the Advantest Group / subcontractors ii) Decreased ability to provide customer support due to restrictions on movement iii) Declines in product supply capacity due to global supply chain disruptions causing difficulties in procurement of materials and components
(3) Decreases in end-product demand due to the rapid deterioration of the world economy and the spread of the impact to the electronics industry as a whole, and a slowdown in the semiconductor and semiconductor manufacturing equipment markets
(4) Potential significant mid-term changes in the structure of the semiconductor industry resulting from changes in customer supply chains
(5) Changes in Advantest's business environment due to changes in human behavior and society in the post-COVID-19 period
It is estimated that as a result of risks (2) and (3) becoming realities, Advantest's revenues declined by approximately (Y) 3.5 billion in the first quarter.
Advantest considers that the present market contraction represents a phase that does not imply any need for
change in the company's medium- to long-term growth strategy. The digital transformation led by 5G commercialization will continue to stimulate demand expansion over the medium to long term for semiconductors with higher performance and higher reliability, which are needed to create comfortable telework environments and advanced telemedicine environments, and consequently for semiconductor test equipment.

Advantest Corporation (FY2020 Q1)
6
In response to this macrotrend, Advantest has been focused on expanding its business in adjacent markets, such as testing at the system / module level, in parallel with strengthening the company's existing businesses such as testing at the wafer level and package level. Advantest will continue to advance these initiatives, and also plans to expand its solutions in the data analytics sector. By creating an environment in which semiconductor test data can be utilized for semiconductor process analysis, the company aims to further embody its corporate vision of adding customer value in an evolving semiconductor value chain.
In addition to these plans, Advantest will continue to strive to reinforce its business foundation for long-term growth, improve profitability in the medium term, and efficiently use its capital resources, with the aim of achieving the company's “Grand Design” medium- to long-term management policy.
Advantest Corporation (FY2020 Q1)
7
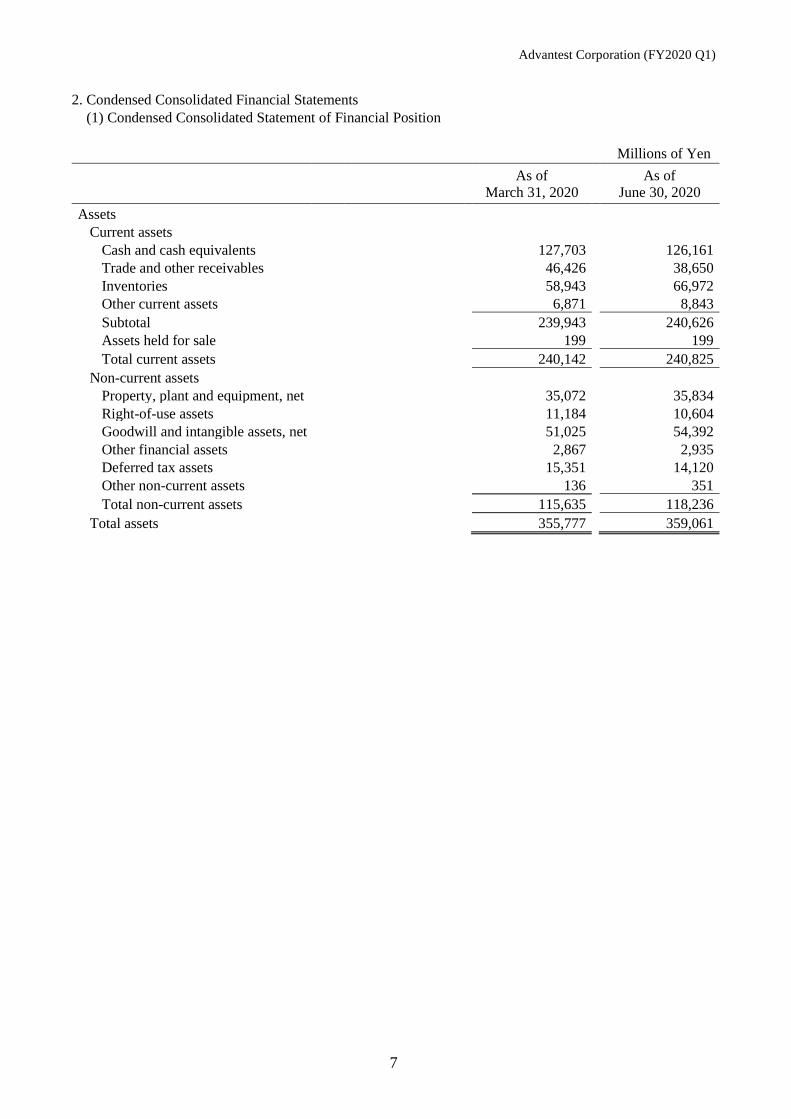
2. Condensed Consolidated Financial Statements
(1) Condensed Consolidated Statement of Financial Position
Millions of Yen
As of
March 31, 2020
As of
June 30, 2020
Assets
Current assets
Cash and cash equivalents 127,703 126,161
Trade and other receivables 46,426 38,650
Inventories 58,943 66,972
Other current assets 6,871 8,843
Subtotal 239,943 240,626
Assets held for sale 199 199
Total current assets 240,142 240,825
Non-current assets
Property, plant and equipment, net 35,072 35,834
Right-of-use assets 11,184 10,604
Goodwill and intangible assets, net 51,025 54,392
Other financial assets 2,867 2,935
Deferred tax assets 15,351 14,120
Other non-current assets 136 351
Total non-current assets 115,635 118,236
Total assets 355,777 359,061
Advantest Corporation (FY2020 Q1)
8
Millions of Yen
As of
March 31, 2020
As of
June 30, 2020
Liabilities and Equity
Liabilities
Current liabilities
Trade and other payables 46,660 41,358
Income tax payables 7,793 6,139
Provisions 3,335 3,317
Lease liabilities 2,275 2,265
Other financial liabilities 1,892 4,666
Other current liabilities 8,582 10,566
Total current liabilities 70,537 68,311
Non-current liabilities
Lease liabilities 9,013 8,459
Retirement benefit liabilities 40,622 41,231
Deferred tax liabilities 1,563 4,190
Other non-current liabilities 2,590 2,628
Total non-current liabilities 53,788 56,508
Total liabilities 124,325 124,819
Equity
Share capital 32,363 32,363
Share premium 43,550 43,755
Treasury shares (4,179) (3,353)
Retained earnings 159,803 161,975
Other components of equity (85) (498)
Total equity attributable to
owners of the parent 231,452 234,242
Total equity 231,452 234,242
Total liabilities and equity 355,777 359,061
Advantest Corporation (FY2020 Q1)
9
(2) Condensed Consolidated Statement of Profit or Loss and Condensed Consolidated Statement of
Comprehensive Income
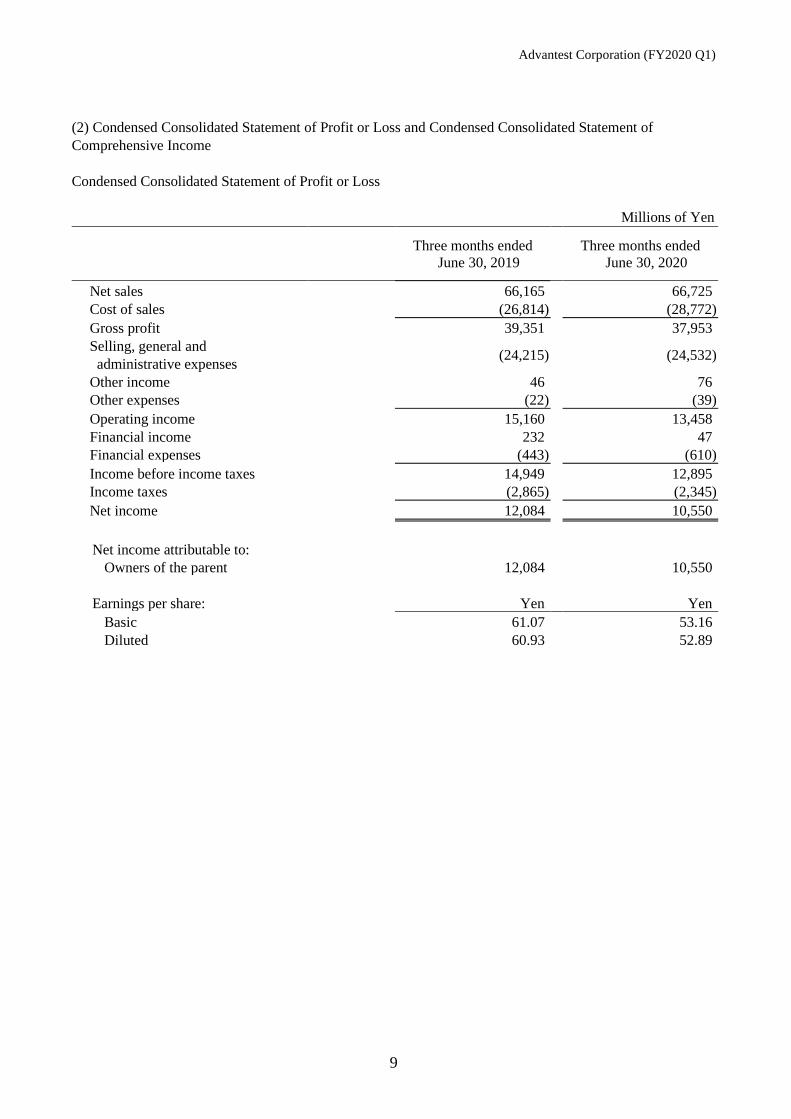
Condensed Consolidated Statement of Profit or Loss
Millions of Yen
Three months ended
June 30, 2019
Three months ended
June 30, 2020
Net sales 66,165 66,725
Cost of sales (26,814) (28,772)
Gross profit 39,351 37,953
Selling, general and
administrative expenses (24,215) (24,532)
Other income 46 76
Other expenses (22) (39)
Operating income 15,160 13,458
Financial income 232 47
Financial expenses (443) (610)
Income before income taxes 14,949 12,895
Income taxes (2,865) (2,345)
Net income 12,084 10,550
Net income attributable to:
Owners of the parent 12,084 10,550
Earnings per share: Yen Yen
Basic 61.07 53.16
Diluted 60.93 52.89
Advantest Corporation (FY2020 Q1)
10
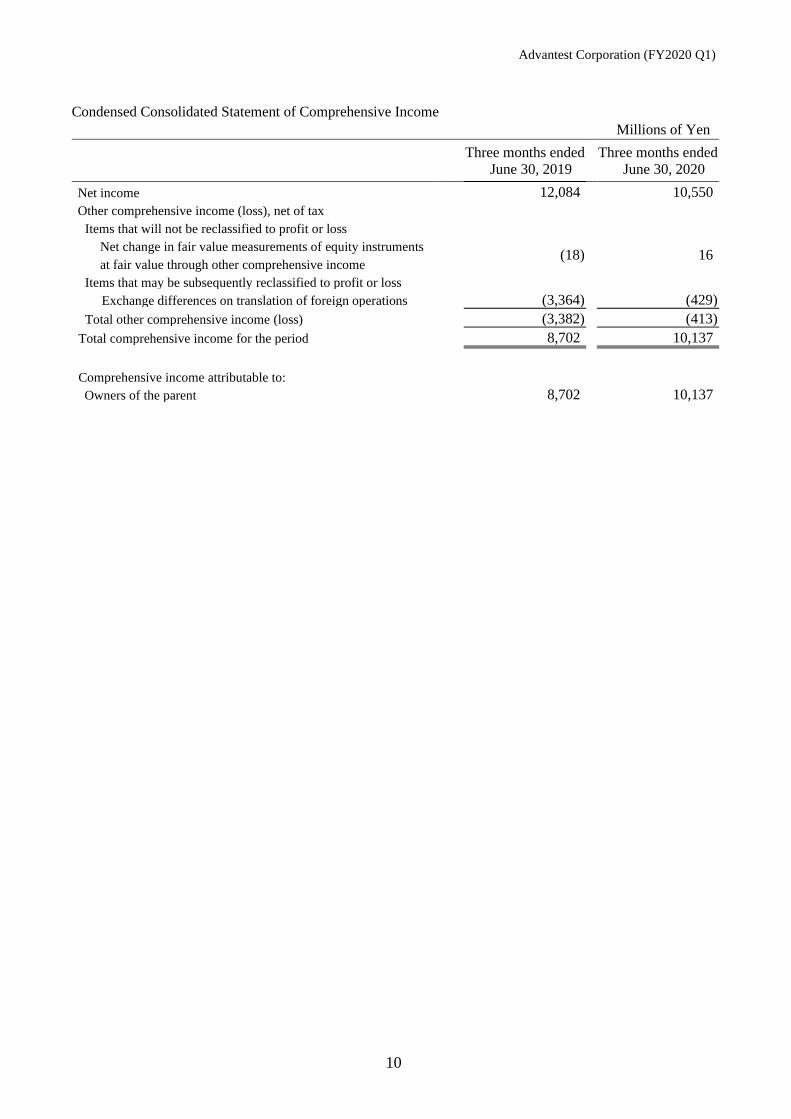
Condensed Consolidated Statement of Comprehensive Income
Millions of Yen
Three months ended
June 30, 2019 Three months ended
June 30, 2020
Net income 12,084 10,550
Other comprehensive income (loss), net of tax
Items that will not be reclassified to profit or loss
Net change in fair value measurements of equity instruments
at fair value through other comprehensive income (18) 16
Items that may be subsequently reclassified to profit or loss
Exchange differences on translation of foreign operations (3,364) (429)
Total other comprehensive income (loss) (3,382) (413)
Total comprehensive income for the period 8,702 10,137
Comprehensive income attributable to:
Owners of the parent 8,702 10,137
Advantest Corporation (FY2020 Q1)
11
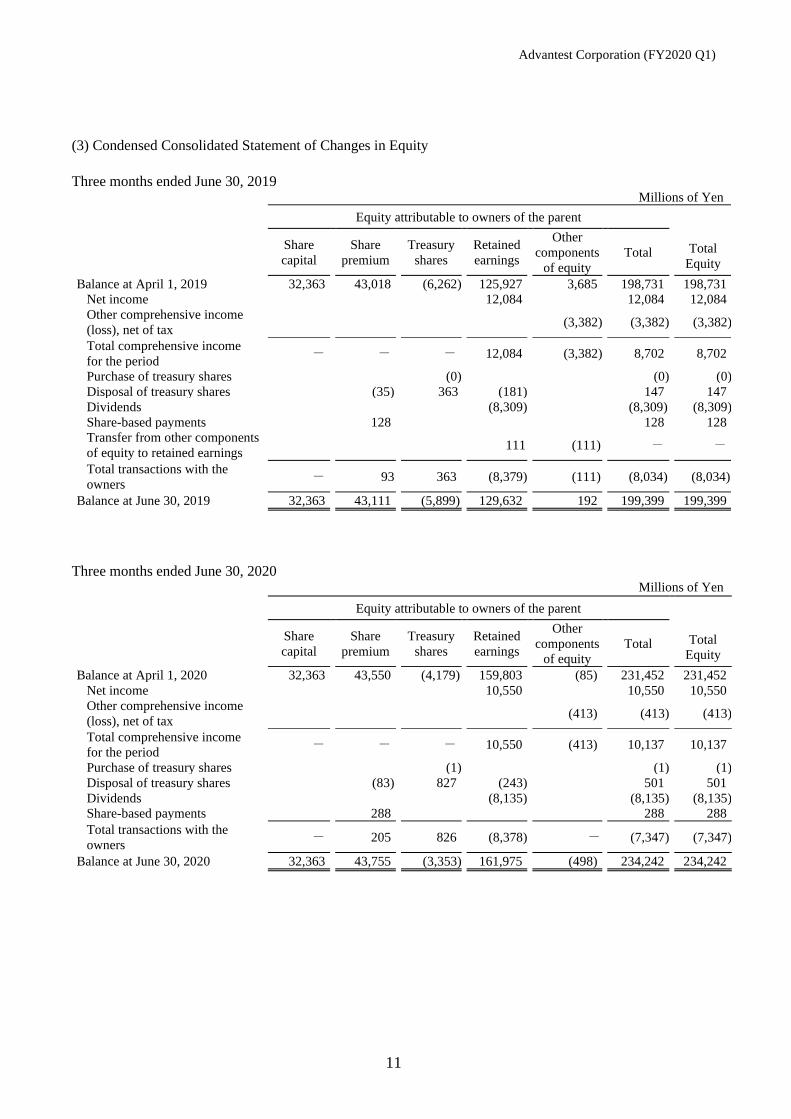
(3) Condensed Consolidated Statement of Changes in Equity
Three months ended June 30, 2019 Millions of Yen
Equity attributable to owners of the parent
Total
Equity
Share
capital
Share
premium
Treasury
shares
Retained
earnings
Other
components
of equity
Total
Balance at April 1, 2019 32,363 43,018 (6,262) 125,927 3,685 198,731 198,731
Net income 12,084 12,084 12,084
Other comprehensive income
(loss), net of tax (3,382) (3,382) (3,382)
Total comprehensive income
for the period - - - 12,084 (3,382) 8,702 8,702
Purchase of treasury shares (0) (0) (0)
Disposal of treasury shares (35) 363 (181) 147 147
Dividends (8,309) (8,309) (8,309)
Share-based payments 128 128 128
Transfer from other components
of equity to retained earnings 111 (111) - -
Total transactions with the
owners - 93 363 (8,379) (111) (8,034) (8,034)
Balance at June 30, 2019 32,363 43,111 (5,899) 129,632 192 199,399 199,399
Three months ended June 30, 2020 Millions of Yen
Equity attributable to owners of the parent
Total
Equity
Share
capital
Share
premium
Treasury
shares
Retained
earnings
Other
components
of equity
Total
Balance at April 1, 2020 32,363 43,550 (4,179) 159,803 (85) 231,452 231,452
Net income 10,550 10,550 10,550
Other comprehensive income
(loss), net of tax (413) (413) (413)
Total comprehensive income
for the period - - - 10,550 (413) 10,137 10,137
Purchase of treasury shares (1) (1) (1)
Disposal of treasury shares (83) 827 (243) 501 501
Dividends (8,135) (8,135) (8,135)
Share-based payments 288 288 288
Total transactions with the
owners - 205 826 (8,378) - (7,347) (7,347)
Balance at June 30, 2020 32,363 43,755 (3,353) 161,975 (498) 234,242 234,242
Advantest Corporation (FY2020 Q1)
(4)Condensed Consolidated Statement of Cash Flows
Three months ended Three months endedJune 30, 2019 June 30, 2020
Cash flows from operating activities:Income before income taxes 14,949 12,895 Adjustments to reconcile income before income taxes to net cash provided by (used in) operating activities:
Depreciation and amortization 2,389 2,646 Changes in assets and liabilities:
Trade and other receivables (5,635) 7,737 Inventories (2,514) (7,978) Trade and other payables (4,750) (4,806) Warranty provisions 1 (19) Deposits received 2,463 2,702 Advance receipt 1,826 1,852 Retirement benefit liabilities 353 341
Other 342 (1,725) Subtotal 9,424 13,645
Interest and dividends received 229 54 Interest paid (38) (44) Income taxes paid (6,288) (3,901)
Net cash provided by (used in) operating activities 3,327 9,754
Cash flows from investing activities:Proceeds from sale of equity instruments 111 — Purchases of property, plant and equipment (1,652) (2,862) Purchases of intangible assets (17) (172) Other 32 16
Net cash provided by (used in) investing activities (1,526) (3,018)
Cash flows from financing activities:Proceeds from disposal of treasury shares 147 503 Dividends paid (7,981) (7,882) Payments for lease liabilities (578) (554) Other (0) (0)
Net cash provided by (used in) financing activities (8,412) (7,933)
Net effect of exchange rate changes on cash and cash equivalents (1,974) (345)
Net change in cash and cash equivalents (8,585) (1,542)
Cash and cash equivalents at the beginning of period 119,943 127,703
Cash and cash equivalents at the end of period 111,358 126,161
Millions of Yen
12
Advantest Corporation (FY2020 Q1)
13
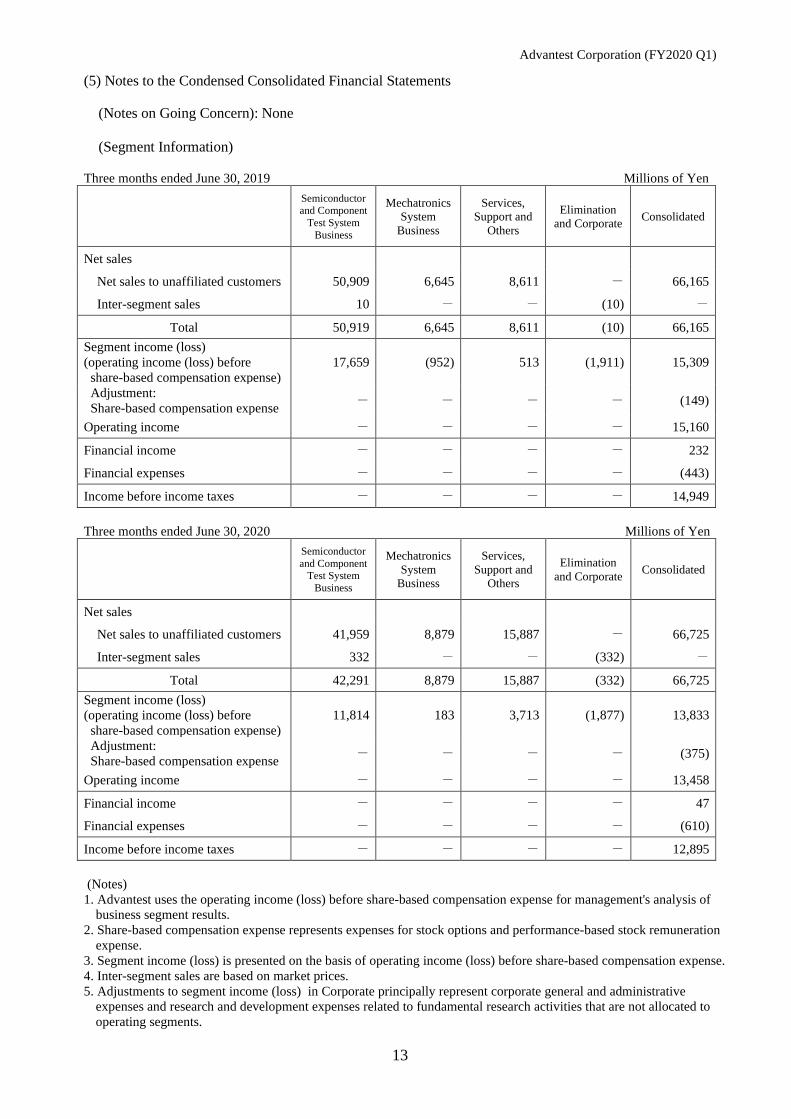
(5) Notes to the Condensed Consolidated Financial Statements
(Notes on Going Concern): None (Segment Information)
Three months ended June 30, 2019 Millions of Yen
Semiconductor and Component
Test System Business
Mechatronics System
Business
Services, Support and
Others
Elimination and Corporate Consolidated
Net sales
Net sales to unaffiliated customers 50,909 6,645 8,611 - 66,165
Inter-segment sales 10 - - (10) -
Total 50,919 6,645 8,611 (10) 66,165 Segment income (loss) (operating income (loss) before
share-based compensation expense) 17,659 (952) 513 (1,911) 15,309
Adjustment: Share-based compensation expense - - - - (149)
Operating income - - - - 15,160
Financial income - - - - 232
Financial expenses - - - - (443)
Income before income taxes - - - - 14,949 Three months ended June 30, 2020 Millions of Yen
Semiconductor and Component
Test System Business
Mechatronics System
Business
Services, Support and
Others
Elimination and Corporate Consolidated
Net sales
Net sales to unaffiliated customers 41,959 8,879 15,887 - 66,725
Inter-segment sales 332 - - (332) -
Total 42,291 8,879 15,887 (332) 66,725 Segment income (loss) (operating income (loss) before
share-based compensation expense) 11,814 183 3,713 (1,877) 13,833
Adjustment: Share-based compensation expense - - - - (375)
Operating income - - - - 13,458
Financial income - - - - 47
Financial expenses - - - - (610)
Income before income taxes - - - - 12,895 (Notes) 1. Advantest uses the operating income (loss) before share-based compensation expense for management's analysis of
business segment results. 2. Share-based compensation expense represents expenses for stock options and performance-based stock remuneration
expense. 3. Segment income (loss) is presented on the basis of operating income (loss) before share-based compensation expense. 4. Inter-segment sales are based on market prices. 5. Adjustments to segment income (loss) in Corporate principally represent corporate general and administrative
expenses and research and development expenses related to fundamental research activities that are not allocated to operating segments.
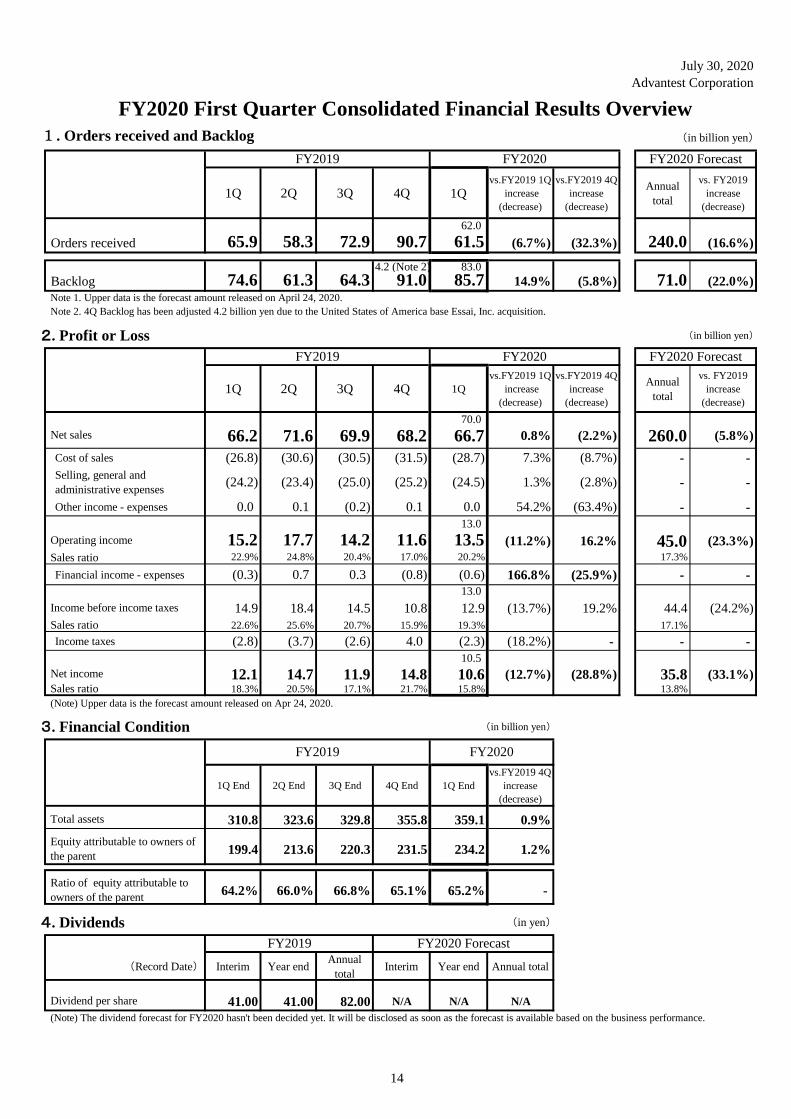
July 30, 2020
Advantest Corporation
1. Orders received and Backlog (in billion yen)
1Q 2Q 3Q 4Q 1Qvs.FY2019 1Q
increase
(decrease)
vs.FY2019 4Q
increase
(decrease)
Annual
total
vs. FY2019
increase
(decrease)
62.0
65.9 58.3 72.9 90.7 61.5 (6.7%) (32.3%) 240.0 (16.6%)
4.2 (Note 2) 83.0
74.6 61.3 64.3 91.0 85.7 14.9% (5.8%) 71.0 (22.0%)
Note 1. Upper data is the forecast amount released on April 24, 2020.
Note 2. 4Q Backlog has been adjusted 4.2 billion yen due to the United States of America base Essai, Inc. acquisition.
2. Profit or Loss (in billion yen)
1Q 2Q 3Q 4Q 1Q
vs.FY2019 1Q
increase
(decrease)
vs.FY2019 4Q
increase
(decrease)
Annual
total
vs. FY2019
increase
(decrease)
70.0
66.2 71.6 69.9 68.2 66.7 0.8% (2.2%) 260.0 (5.8%)
Cost of sales (26.8) (30.6) (30.5) (31.5) (28.7) 7.3% (8.7%) - -
Selling, general and
administrative expenses(24.2) (23.4) (25.0) (25.2) (24.5) 1.3% (2.8%) - -
Other income - expenses 0.0 0.1 (0.2) 0.1 0.0 54.2% (63.4%) - -
13.0
15.2 17.7 14.2 11.6 13.5 (11.2%) 16.2% 45.0 (23.3%)
22.9% 24.8% 20.4% 17.0% 20.2% 17.3%
Financial income - expenses (0.3) 0.7 0.3 (0.8) (0.6) 166.8% (25.9%) - -
13.0
14.9 18.4 14.5 10.8 12.9 (13.7%) 19.2% 44.4 (24.2%)
22.6% 25.6% 20.7% 15.9% 19.3% 17.1%
Income taxes (2.8) (3.7) (2.6) 4.0 (2.3) (18.2%) - - -
10.5
12.1 14.7 11.9 14.8 10.6 (12.7%) (28.8%) 35.8 (33.1%)18.3% 20.5% 17.1% 21.7% 15.8% 13.8%
(Note) Upper data is the forecast amount released on Apr 24, 2020.
3. Financial Condition (in billion yen)
1Q End 2Q End 3Q End 4Q End 1Q End
vs.FY2019 4Q
increase
(decrease)
310.8 323.6 329.8 355.8 359.1 0.9%
199.4 213.6 220.3 231.5 234.2 1.2%
64.2% 66.0% 66.8% 65.1% 65.2% -
4. Dividends (in yen)
(Record Date) Interim Year endAnnual
totalInterim Year end Annual total
41.00 41.00 82.00 N/A N/A N/A
(Note) The dividend forecast for FY2020 hasn't been decided yet. It will be disclosed as soon as the forecast is available based on the business performance.
Dividend per share
FY2019 FY2020
Total assets
Equity attributable to owners of
the parent
Ratio of equity attributable to
owners of the parent
FY2019 FY2020 Forecast
Sales ratio
Income before income taxes
Sales ratio
Net income
Sales ratio
FY2019 FY2020 FY2020 Forecast
Net sales
Operating income
FY2020 First Quarter Consolidated Financial Results Overview
FY2019 FY2020 FY2020 Forecast
Orders received
Backlog
14