fy2020 data snapshot
TRANSCRIPT
City of Philadelphia
Office of Homeless Services
FY2020 Data
Snapshot

1
FY2020 Data Snapshot City of Philadelphia
Office of Homeless Services July 1, 2019 to June 30, 2020
Introduction
The mission of the Office of Homeless Services (OHS) is to make homelessness rare, brief and nonrecurring in
Philadelphia. We fulfill this mission by providing the leadership, planning, coordination and mobilization of resources to
an extensive system of homelessness prevention, emergency, temporary and long-term housing services to those facing
imminent or literal homelessness.
The City’s strategic plan to address homelessness, The Roadmap to Homes, identifies core values for the homeless
service system as determined by the community of stakeholders who developed the plan. Being data informed and
transparent are among these, as are flexibility and efficiency. This 2020 Data Snapshot produced by the Office of
Homeless Services is a foundational element of fulfilling these values. Quite simply, it is only with high quality, consistent
data that we can identify trends, assess progress and direct our efforts to best meet the needs of the community.
To that end, the Office of Homeless Services has worked tirelessly to address data quality concerns, encourage agencies
to use Homeless Management Information System (HMIS) and provide training and technical assistance to users, in
order to ensure that the data collected is comprehensive and accurately reflects the community. The FY18 Data
Snapshot was the first report produced with data from HMIS by the Office of Homeless Services that contained a
system-wide overview of the City’s progress towards ending homelessness. This report is the third comprehensive data
report released by the Office of Homeless Services, and it aims to expand upon the data that was provided in the first
two Data Snapshots, and to illustrate the community’s progress towards ending homelessness.
Note: At the time of this report, 84% of the beds dedicated to people experiencing homeless by various agencies in the City of
Philadelphia were reporting into HMIS. Agencies providing shelter for Survivors of Domestic Violence, and agencies that do not use
Philadelphia’s HMIS are only included in the Point-in-Time and Housing Inventory Count sections. The remainder of this snapshot
reflects data from the 84% of beds reported in HMIS and is therefore not representative of the entire homeless assistance system.

2
FY2020 Data Snapshot City of Philadelphia
Office of Homeless Services July 1, 2019 to June 30, 2020
Table of Contents
Making Homelessness Rare, Brief and Non-recurring .............................................................................................. 3
Additional Performance Measures ............................................................................................................................... 5
Housing Inventory Count ................................................................................................................................................. 6
Point-in-Time Count ........................................................................................................................................................... 7
Total Persons Served........................................................................................................................................................ 10
Key Terms............................................................................................................................................................................ 14
Sources ................................................................................................................................................................................ 15

3
FY2020 Data Snapshot City of Philadelphia
Office of Homeless Services July 1, 2019 to June 30, 2020
Making Homelessness Rare, Brief and Non-recurring
The Office of Homeless Services tracks its progress towards ending homeless by measuring the number of people
entering the homeless system for the first time (rare), the length of time someone experiences homelessness (brief),
and the number of people who return to homelessness after exiting the system (non-recurring). These measures are
described in Roadmap to Homes, Philadelphia’s Five Year Strategic Plan for the Homeless Assistance System, and align
with the national goals for addressing homelessness established by the U.S. Department of Housing and Urban
Development.
GOAL: MAKE HOMELESSNESS RARE M E T R I C : N U M B E R O F P E R S O N S E N T E R I N G A N E M E R G E N C Y S H E L T E R , S A F E H A V E N ,
T R A N S I T I O N A L H O U S I N G O R P E R M A N E N T H O U S I N G F O R T H E F I R S T T I M E
FY19 FY20
72% 9,083 (72%) of the 12,651 persons who entered a project in FY19 were entering a housing assistance project for the first
time
68% 9,313 (68%) of the 13,632 persons who entered a project in FY20 were entering a housing assistance project for the
first time
The Office of Homeless Services’ goal to make homelessness rare starts with aiding households at-risk of experiencing
homelessness by emphasizing prevention and diversion strategies and building partnerships with a diverse array of
organizations in order to effectively allocate resources. Through prevention and diversion, the Office of Homeless
Services can help households maintain their current housing or identify and create new pathways to housing, while
connecting households to services and supports that provide direct assistance. Aligning these efforts helps at-risk
households attain housing stability while preserving scarce housing resources.
In an effort to strengthen prevention and diversion practices, Office of Homeless Services (OHS) increased its support for
prevention and diversion assistance. As a result, over 1,400 households received prevention or diversion assistance in
FY20. Between FY19 and FY20, OHS reported a decrease in the number of persons experiencing homelessness for the
first time in four years (since 2017).
GOAL: MAKE HOMELESSNESS BRIEF M E T R I C : A V E R A G E L E N G T H O F T I M E ( D A Y S ) I N A N E M E R G E N C Y S H E L T E R , S A F E H A V E N O R
T R A N S I T I O N A L P R O J E C T F O R A L L P E R S O N S
FY19 FY20
161 days Average length of time participants are enrolled in an emergency shelter, safe haven or transitional housing
(median length of stay = 68 days)
157 days Average length of time participants are enrolled in an
emergency shelter, safe haven or transitional
housing (median length of stay = 68 days)

4
FY2020 Data Snapshot City of Philadelphia
Office of Homeless Services July 1, 2019 to June 30, 2020
The average length of stay in emergency shelter, safe haven and transitional housing projects indicates the homeless
system’s ability to move people out of homelessness. It can also measure the system’s ability to embrace the Housing
First Approach, which strives to move people into housing as quickly as possible by removing barriers for households
entering housing assistance projects. In FY20, in order to more closely reflect participants’ experience, the methodology
for calculating this metric changed to include night-by-night and after-hours participants. The Average and median
length of stay for FY19 were also adjusted to reflect the new methodology.
GOAL: MAKE HOMELESSNESS NON-RECURRING M E T R I C : N U M B E R O F P E O P L E W H O E X I T E D T O P E R M A N E N T H O U S I N G D E S T I N A T I O N I N T H E
P A S T T W O Y E A R S A N D R E T U R N E D T O H O M E L E S S N E S S
FY19 FY20
85% of participants who exited a project for a permanent housing destination did not return to homelessness
82% of participants who exited a project for a permanent housing destination did not return to homelessness
To track the community’s progress towards making homeless non-recurring, the Office of Homeless Services tracks the
number of persons who exited to a permanent housing destination and then re-entered a housing assistance project.
This measure provides the percent of people who stably and successfully exited homelessness.
Similarly to the previous measure, this one was also impacted by the expansion of emergency shelter projects in
Philadelphia’s HMIS, and the 82% reported for FY20 reflects a more accurate representation of this measure. Moving
forward, the Office of Homeless Services continues to advocate for more permanent housing resources.
ES
65 days
TH
330 days
SH
215 days
RRH
274 days
PSH
1,990 days

5
FY2020 Data Snapshot City of Philadelphia
Office of Homeless Services July 1, 2019 to June 30, 2020
Additional Performance Measures
The Office of Homeless Services tracks additional performance measures that relate to and support the community’s
mission of making homelessness brief, rare and non-recurring. For example, employment and income growth is closely
related to a household’s ability to remain stably housed and is therefore tracked in order to better understand the
community’s progress towards making homeless non-recurring. The chart below reviews the income reported during a
person’s exit compared to the income they reported during their enrollment. Between FY19 and FY20, there was a 3%
decrease in the percent of persons receiving earned and non-employment income who exited from a project funded by
the Continuum of Care program. The observed decrease was significant in the 4th Quarter of FY20 and may reflect the
COVID-19 economic impact.
INCOME CHANGE: ADULTS WHO EX ITED *
FY19 FY20
Number of adults who exited a project (leavers) 1,155 699
Leavers with increased earned income 285 (25%) 115 (17%)
Leavers with increased non-employment cash income 328 (28%) 208 (31%)
Total leavers with any increase in income (earned + non-employment income) 542 (47%) 295 (44%)
*This chart reports on data collected from projects that were funding by the Continuum of Care program only. More information on the Continuum of Care can be
found at http://philadelphiaofficeofhomelessservices.org/about-us/continuum-of-care/
One of the key indicators of success for housing projects is the percent of exits to a permanent housing destination.
Examples of permanent housing destinations include moving into a rental unit, moving in with friends or family, or
entering a permanent housing project. In FY20, 26% of all persons who were enrolled in an Emergency Shelter, Safe
Haven, Transitional Housing or Rapid Rehousing projects exited to a permanent housing destination. The number is
greater, but the percentage of successful exits remained the same as in FY19. This is directly related to the availability of
affordable housing.
EX I TS TO PERMANENT HOUS ING
FY19 FY20
Persons in Emergency Shelter, Safe Haven, Transitional Housing and Rapid Rehousing
9,193 10,308
Of those, who exited to a permanent housing destination 2,417 2,650
Successful Exits 26% 26%
6
FY2020 Data Snapshot City of Philadelphia
Office of Homeless Services July 1, 2019 to June 30, 2020
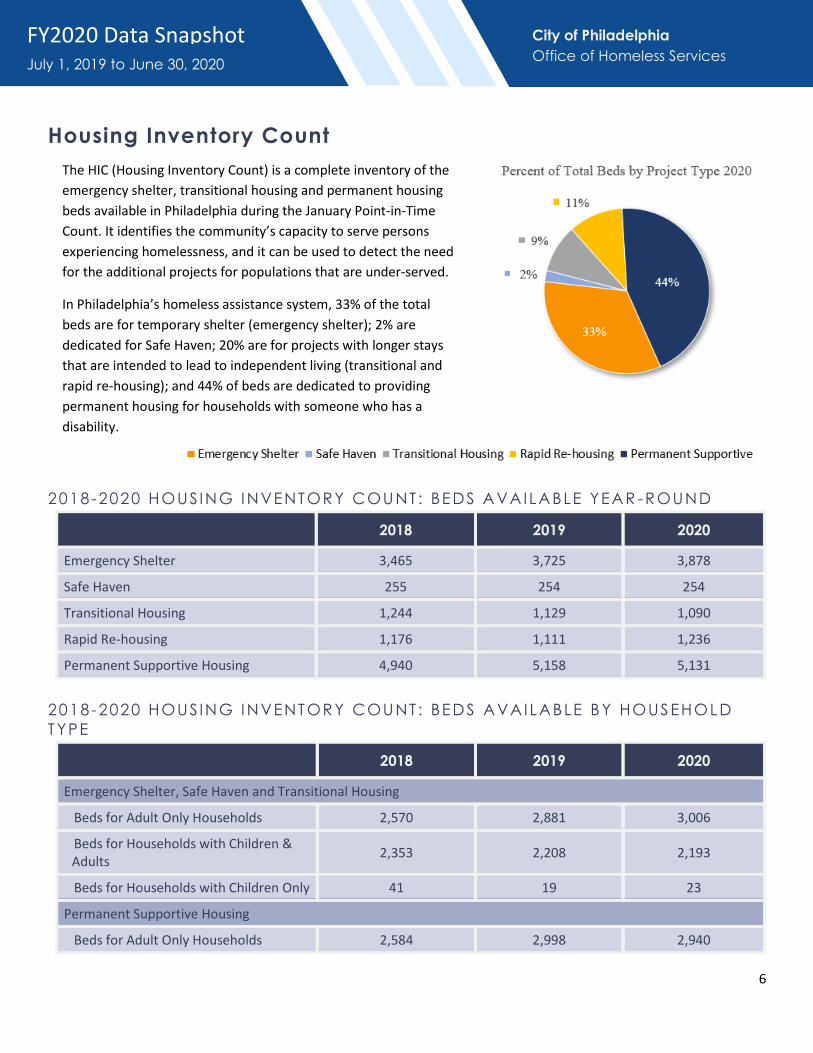
Housing Inventory Count
The HIC (Housing Inventory Count) is a complete inventory of the
emergency shelter, transitional housing and permanent housing
beds available in Philadelphia during the January Point-in-Time
Count. It identifies the community’s capacity to serve persons
experiencing homelessness, and it can be used to detect the need
for the additional projects for populations that are under-served.
In Philadelphia’s homeless assistance system, 33% of the total
beds are for temporary shelter (emergency shelter); 2% are
dedicated for Safe Haven; 20% are for projects with longer stays
that are intended to lead to independent living (transitional and
rapid re-housing); and 44% of beds are dedicated to providing
permanent housing for households with someone who has a
disability.
2018-2020 HOUSING INVENTORY COUNT: BEDS AVAILABLE YEAR -ROUND
2018 2019 2020
Emergency Shelter 3,465 3,725 3,878
Safe Haven 255 254 254
Transitional Housing 1,244 1,129 1,090
Rapid Re-housing 1,176 1,111 1,236
Permanent Supportive Housing 4,940 5,158 5,131
2018-2020 HOUSING INVENTORY COUNT: BEDS AVAILABLE BY HOUSEHOLD
TYPE
2018 2019 2020
Emergency Shelter, Safe Haven and Transitional Housing
Beds for Adult Only Households 2,570 2,881 3,006
Beds for Households with Children & Adults
2,353 2,208 2,193
Beds for Households with Children Only 41 19 23
Permanent Supportive Housing
Beds for Adult Only Households 2,584 2,998 2,940

7
FY2020 Data Snapshot City of Philadelphia
Office of Homeless Services July 1, 2019 to June 30, 2020
Beds for Households with Children & Adults
2,356 2,160 2,191
Point-in-Time Count
The Point-in-Time (PIT) Count is an annual count of sheltered and unsheltered homeless persons on a single night in
January. It provides the homeless assistance community with data needed to understand the number and characteristics
of persons who are experiencing homelessness.
Unsheltered population includes persons sleeping in any location not designed for or ordinarily used as a regular sleeping accommodation for humans, such as on the streets, transportation centers, public parks, abandoned buildings or cars.i
Sheltered population includes persons experiencing homelessness that are staying in an emergency shelter, safe haven or transitional housing project.
2020 POINT - IN -T IME COUNT
Sheltered Unsheltered Total
Total Persons 4,676 958 5,634
Total Children (Under 18) 1,158 11 1,169
Total Youth (Ages 18 to 24) 321 106 427
Total Adults (Over 24) 3,197 841 4,038
Between 2016 and 2020 the total number of unsheltered persons counted during the Point-in-Time Count has seen an
8% average increase. However, over the last two years there was a 6% decline in the unsheltered population. The total
number of sheltered declined over the last 5 years. Overall, in FY20, both sheltered and unsheltered populations saw 2%
decline.
2020 P I T COUNT: UNSHELTERED INDIVIDUALS SURVEYED IN CENTER CITY
For this year, the PIT Count was held on the
night of Wednesday, January 22nd from midnight
to 4:00 am. The map to the right shows the
location of unsheltered persons who were
sleeping on the streets, or in either Suburban
Station or 30th Street Station, and completed a
survey conducted by volunteers. In the Center
City area, defined here as south of Spring
Garden, north of South Street, and bordered by
the Schuylkill and Delaware Rivers, there were a
total of 388 individuals counted.

8
FY2020 Data Snapshot City of Philadelphia
Office of Homeless Services July 1, 2019 to June 30, 2020
Since 2016, the total number of persons experiencing homelessness has decreased by 8% (-478 people). This reduction
is primarily due to a decrease in the number of persons in shelter. The number of unsheltered persons increased from
2016 to 2018 and slightly decreased since 2018.
2016-2020 POINT - IN-T IME COUNT TRENDS
For households with at least one child and one adult, the sheltered count has decreased by 26% (213 households) since
2017, and from 2018 to 2020, the unsheltered count remained at zero. The number of households without children saw
a slight decrease of 2% (45 households) in 2020 an improvement from the steady increase from 2018 to 2019 and the
sheltered fluctuated from 2017 to 2020.
HOUSEHOLDS REPORTED 2017 -2020 POINT - IN -T IME COUNTS
2017 2018 2019 2020
Sheltered Households 3,199 3,237 3,426 3,335
Households without children 2,352 2,474 2,754 2,709
Households with adults and children 825 744 663 612
Households with only children 22 19 9 14
Unsheltered Households 943 1,083 973 958
Households without children 938 1,066 967 947
Households with adults and children 1 0 0 0
Households with only children 4 17 6 11
Total Households 4,142 4,320 4,399 4,293
To be considered chronically homeless, a person must have a disabling condition and their homeless experience must be
at least one year long; or during the last three years they must have at least four occasions of homelessness that equal

9
FY2020 Data Snapshot City of Philadelphia
Office of Homeless Services July 1, 2019 to June 30, 2020
one year in length. In the 2020 PIT Count, the total number of chronically homeless persons decreased by 12% as
compared to 2019 PIT Count. The largest decrease was among the unsheltered population due to deployment of
additional resources including new Recovery House programs, additional OHS shelter programs such as Sacred Heart
and Ife, and additional winter beds that became available in December 2019 as well as increased dedicated supportive
housing.
POINT - IN -T IME COUNT: CHRONICALLY HOM ELESS
Emergency
Shelter Safe Haven Unsheltered Total
% Change from
previous year
(2019)
Chronically Homeless Individuals
670 188 287 1,145 -12%
Several population subgroups are considered by HUD to be more vulnerable. This includes persons who are chronically
homeless, unaccompanied youth (18 to 24 years old), and veterans. Of the subpopulations identified in the table below,
persons experiencing a severe mental illness and chronic substance abuse are the most represented. Both of these
populations’ percentage of the adult population saw a slight decrease from last year’s Point-in-Time Count. During the
2019 Count, 40.6% (1,808 out of 4,449 total adults) of all adults reported a mental illness, and in 2020, it decreased to
39.6%. For substance use disorder, the percentage decreased from 37.5% (1,667 out of 4,334) in 2019 to 33.3% in 2020.
POINT - IN -T IME COUNT: SUBPOPULAT IONS
Sheltered Unsheltered Total
% of Adult
Population
(4,465 adults)
Unaccompanied Youth (18-24) 161 106 267 6.0%
Parenting Youth (18-24) 72 0 72 1.6%
Veterans 219 21 240 5.4%
Mental Illness 1,249 518 1,767 39.6%
Substance Use Disorder 1,011 477 1,488 33.3%
Persons with HIV/AIDS 109 41 150 3.4%
Adults fleeing domestic violence 281 92 373 8.4%

10
FY2020 Data Snapshot City of Philadelphia
Office of Homeless Services July 1, 2019 to June 30, 2020
Total Persons Served
The Office of Homeless Services records and tracks the number of persons served
after each fiscal year (July 1st to June 30th). The tables in this section are based on
the total number of persons who enrolled in each project type. Persons with
enrollments in multiple project types are reported once for each project type. In
FY20, there were a total of 19,988 unique persons served in all project types.
TOTAL PERSONS SERVED BY PROJECT TYPE , FY1 9-20
Overflow (After Hours
& Winter Initiative) Emergency
Shelter Safe Haven
Transitional
Housing
Rapid
Rehousing
Permanent
Supportive
FY20 5,445 8,206 703 1,287 2,608 4,059
FY19 3,811 8,347 561 1,385 2,198 3,653 *Persons are reported in each project type that they enrolled in. Persons with multiple enrollments are counted in each project type.
The average age of all persons served in project in FY20 was 35 years, which is higher than the average reported for
previous years (33 in 2019; 31 in 2018; 29 in 2017). Between FY19 and FY20, the % of total number of children (ages 0 to
17) remained the same, and the % of total youth (18-24) saw a 1% increase. All of the age groups that captured people
25 and older increased, which is consistent with national trends.
AGE OF ALL PERSONS SERVED IN FY 20
*Total of 386 persons (2%) missing Date of Birth information.
The percent of adults aged 55+ in shelter is anticipated to continue to grow significantly as the Baby Boomer generation
and Generation X age. Studies show that older individuals experiencing homelessness age prematurely, with rates of
cognitive decline and decreased mobility equal to persons 20 years older.ii This suggests that with the increase of older
A TOTAL OF
19,988 PERSONS
WERE SERVED IN FY20
11
FY2020 Data Snapshot City of Philadelphia
Office of Homeless Services July 1, 2019 to June 30, 2020
individuals, the homeless assistance community should anticipate an increase in costs associated with health care
services when serving this population. We need to expand housing solutions and create models with health care services
and health care dollars that serve both the housing and health needs of people experiencing homelessness. The Office of
Homeless Services hopes to expand such services over the next several years, as noted in the Roadmap to Homes plan.
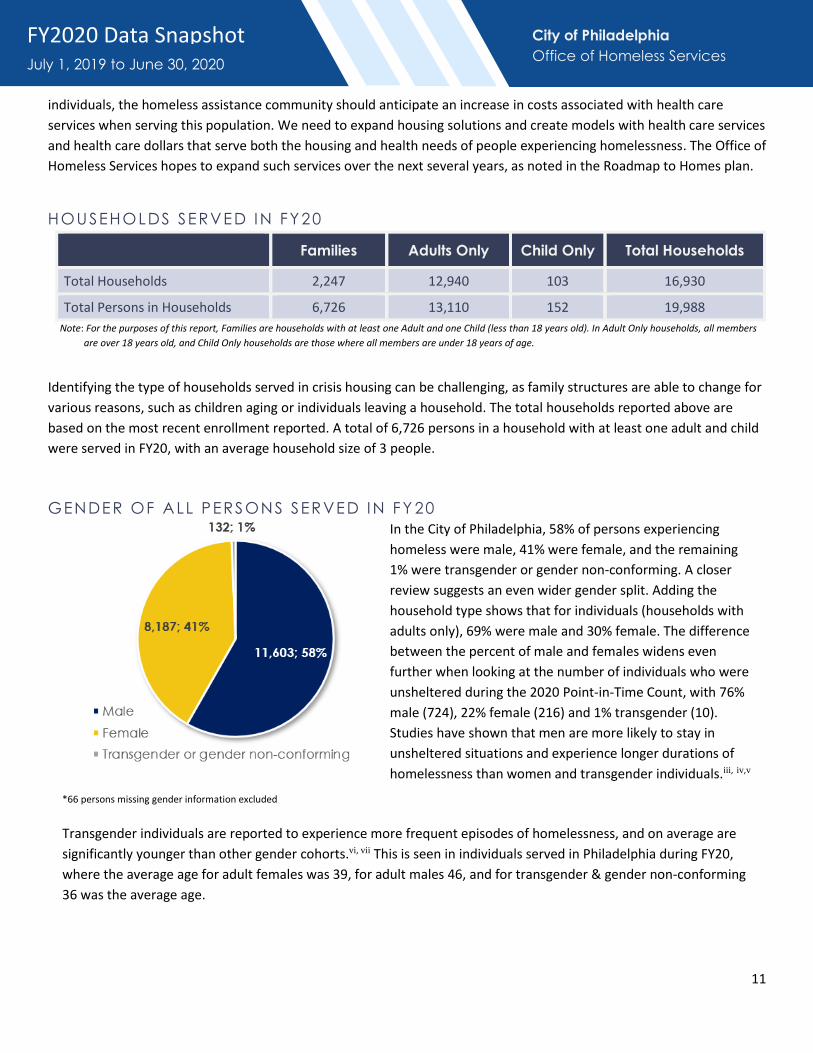
HOUSEHOLDS SERVED IN FY 20
Families Adults Only Child Only Total Households
Total Households 2,247 12,940 103 16,930
Total Persons in Households 6,726 13,110 152 19,988
Note: For the purposes of this report, Families are households with at least one Adult and one Child (less than 18 years old). In Adult Only households, all members
are over 18 years old, and Child Only households are those where all members are under 18 years of age.
Identifying the type of households served in crisis housing can be challenging, as family structures are able to change for
various reasons, such as children aging or individuals leaving a household. The total households reported above are
based on the most recent enrollment reported. A total of 6,726 persons in a household with at least one adult and child
were served in FY20, with an average household size of 3 people.
GENDER OF ALL PERSONS SERVED IN FY 20
*66 persons missing gender information excluded
In the City of Philadelphia, 58% of persons experiencing
homeless were male, 41% were female, and the remaining
1% were transgender or gender non-conforming. A closer
review suggests an even wider gender split. Adding the
household type shows that for individuals (households with
adults only), 69% were male and 30% female. The difference
between the percent of male and females widens even
further when looking at the number of individuals who were
unsheltered during the 2020 Point-in-Time Count, with 76%
male (724), 22% female (216) and 1% transgender (10).
Studies have shown that men are more likely to stay in
unsheltered situations and experience longer durations of
homelessness than women and transgender individuals.iii, iv,v
Transgender individuals are reported to experience more frequent episodes of homelessness, and on average are
significantly younger than other gender cohorts.vi, vii This is seen in individuals served in Philadelphia during FY20,
where the average age for adult females was 39, for adult males 46, and for transgender & gender non-conforming
36 was the average age.
12
FY2020 Data Snapshot City of Philadelphia
Office of Homeless Services July 1, 2019 to June 30, 2020
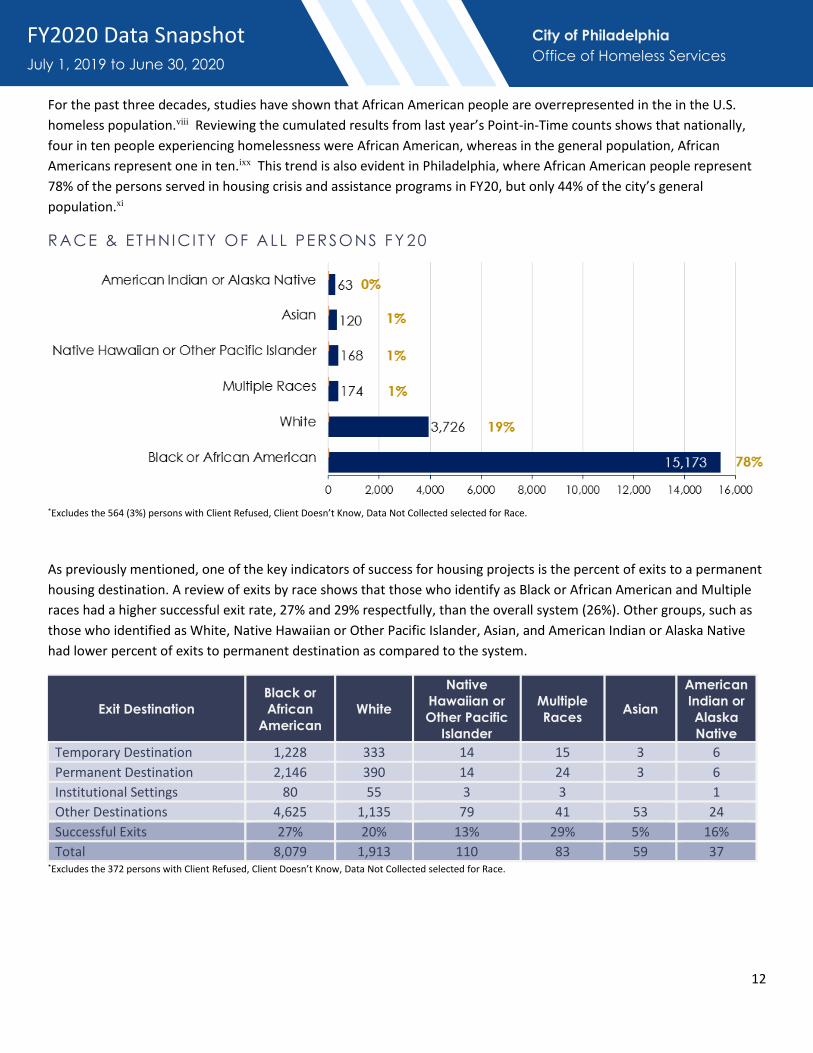
For the past three decades, studies have shown that African American people are overrepresented in the in the U.S.
homeless population.viii Reviewing the cumulated results from last year’s Point-in-Time counts shows that nationally,
four in ten people experiencing homelessness were African American, whereas in the general population, African
Americans represent one in ten.ixx This trend is also evident in Philadelphia, where African American people represent
78% of the persons served in housing crisis and assistance programs in FY20, but only 44% of the city’s general
population.xi
RACE & ETHNICITY OF ALL PERSONS FY 20
*Excludes the 564 (3%) persons with Client Refused, Client Doesn’t Know, Data Not Collected selected for Race.
As previously mentioned, one of the key indicators of success for housing projects is the percent of exits to a permanent
housing destination. A review of exits by race shows that those who identify as Black or African American and Multiple
races had a higher successful exit rate, 27% and 29% respectfully, than the overall system (26%). Other groups, such as
those who identified as White, Native Hawaiian or Other Pacific Islander, Asian, and American Indian or Alaska Native
had lower percent of exits to permanent destination as compared to the system.
Exit Destination
Black or
African
American
White
Native
Hawaiian or
Other Pacific
Islander
Multiple
Races Asian
American
Indian or
Alaska
Native
Temporary Destination 1,228 333 14 15 3 6
Permanent Destination 2,146 390 14 24 3 6
Institutional Settings 80 55 3 3 1
Other Destinations 4,625 1,135 79 41 53 24
Successful Exits 27% 20% 13% 29% 5% 16%
Total 8,079 1,913 110 83 59 37 *Excludes the 372 persons with Client Refused, Client Doesn’t Know, Data Not Collected selected for Race.

13
FY2020 Data Snapshot City of Philadelphia
Office of Homeless Services July 1, 2019 to June 30, 2020
Additionally, the share of the U.S. population
identifying as Hispanic, 18%, also has a slightly
higher representation with this population,
representing 22% of persons experiencing
homelessness.xii In Philadelphia, 14% of the
general population identified as Hispanic/Latinx,
but in the housing assistance programs, this group
only represented 9% of the population served.xiii A
recent study of the ‘Latinx paradox’ (low
representation of Latinxs among homeless
population) in Philadelphia suggests that this may
be due partly to systemic barriers (ex. language
access), negative perceptions of homeless services, and informal and formal community assets that exist within the
Latinx community which prevent some from becoming homeless.xiv People who are Latinx/Hispanic are also less likely to
use standard homeless sleeping arrangements (shelters, churches, etc.) and more likely to be in crowded, inadequate
housing or “doubling up.” xv This may consequentially, exclude them from accessing homeless assistance programs,
which focus on serving persons who are homeless according to the definition provided by the U.S. Department of
Housing and Urban Development.
The Office of Homeless Services has worked to mitigate against the Latinx Paradox in several ways over the past three
years: 1) providing a suite of homelessness prevention services that do not require people to meet the definition of
literally homeless to get rental assistance; 2) providing more culturally competent Spanish language services in
community organizations that already serve the Latinx community; 3) nesting the range of homeless assessment,
referral and emergency housing services within housing counseling agencies in the Latinx community; 4) expanding the
network of homeless services providers in the Latinx community to build capacity and increase availability; 5) support
innovative practices, programs and policies designed to meet the unique needs of this population.

14
FY2020 Data Snapshot City of Philadelphia
Office of Homeless Services July 1, 2019 to June 30, 2020
Key Terms
• Adult: Persons age 18 and older.
• After Hours: An emergency shelter project that provides beds on a night-by-night basis to persons entering
emergency shelter after 5:00 pm on weekdays, on weekends or holidays. After Hours beds are also referred to as
Overflow beds.
• Child: Persons age 17 and younger.
• Chronically Homeless: A person experiencing homelessness (in a place not meant for human habitation, safe haven,
or an emergency shelter) continuously for at least 1 year, or on at least four separate occasions in last 3 years where
the combined length of time is those occasions is at least 12 months; and the person has a disability.
• Disability: an individual with a physical, mental, or emotional impairment, including impairment caused by alcohol
or drug abuse, post-traumatic stress disorder or brain injury. The condition must be:
o Expected to be long-continuing or of indefinite duration
o Impedes the individual’s ability to live independently; and
o Could be improved with suitable housing conditions.
• Emergency Shelter: Any facility with the primary purpose of providing temporary shelter for persons experiencing
homelessness.
• Household: One or more individuals who live together.
• Housing Inventory Count: also known as the HIC, this chart is a complete inventory of all Emergency, Transitional,
Safe Haven, Permanent Supportive, and Rapid Re-housing projects within the Philadelphia Continuum of Care.
• Parenting Youth: Youth between the ages of 18 and 24 who identifies as the parent or guardian of one or more
children who are present or sleeping in the same place as that youth parent.
• Permanent Supportive Housing: Long-term housing project that provides supportive services to assist homeless
persons with a disability to live independently.
• Point-in-Time Count: Also known as the PIT, this is an annual count of all persons experiencing homelessness,
sheltered or unsheltered, on a given night in January.
• Rapid Re-Housing: A project that provides rental assistance and supportive services on a time-limited basis to
homeless families and individuals.
• Transitional Housing: Used to facilitate the movement of homeless families and individuals into permanent housing,
this project type provides supportive services and housing for up to 24 months.
• Unaccompanied Youth: Persons under the age of 25 who are not accompanied by a parent or guardian.
• Winter Initiative: An emergency shelter project that provides supplemental beds on a planned basis during the
winter. Winter Initiative beds are also referred to as Seasonal or Code Blue beds.
• Youth: Unaccompanied youth are persons under age 25 who are not accompanied by a parent or guardian and are
not a parent presenting with or sleeping in the same place as his/her child or children. Unaccompanied youth are
single youth, youth couples, and groups of youth presenting together as a household.
15
FY2020 Data Snapshot City of Philadelphia
Office of Homeless Services July 1, 2019 to June 30, 2020
Sources
i U.S. Department of Housing and Urban Development (2014). Point-in-Time Count Methodology Guide. 18.
ii Culhane, D., Byrne, T., Metraux, S., Kuhn, R., Doren, K., Johns, E. and Schretzman, D. (2019). The Emerging Crisis of Aged Homelessness. https://1slo241vnt3j2dn45s1y90db-wpengine.netdna-ssl.com/wp-content/uploads/2019/01/Emerging-Crisis-of-Aged-Homelessness-1.pdf
iii Montgomery, A. E., Szymkowiak, D., and Culhane, D. P. (2017). Gender Differences in Factors Associated with Unsheltered Status and Increased Risk of Premature Mortality among Individuals Experiencing Homelessness. Women's Health Issues, 259-262.
iv Montgomery, A.E., Szymkowiak, D., Marcus, J., Howard P., and Culhane, D.P. (2016). Homeless, Unsheltered Status, and Risk Factors for Mortality: Findings from the 100,000 Homes Campaign. Public Health Reports Vol. XX: 1-8, 3-9.
v Bird, M., Rhoades, H., Lahey, J., Cederbaum, J. and Wenzel, S. (2017). Life Goals and Gender Differences Among Chronically Homeless Individuals Entering Permanent Supportive Housing. Journal of Social Distress and the Homeless. Vol. 26, No. 1, 9-15.
vi Montgomery, A. E., Szymkowiak, D., and Culhane, D. P. (2017). 259-262.
vii Begun, S., and Kattari, S.K. (2016). Conforming for survival: Associations between transgender visual conformity/passing and homelessness experiences. Journal of Gay & Lesbian Social Services, 57-65.
viii Jones, M. (2016). Does Race Matter in Addressing Homelessness? A Review of Literature. World Medical and Health Policy. 8:2. Page 139.
ix U.S. Department of Housing and Urban Development (2018). The 2018 Annual Homeless Assessment Report (AHAR) to Congress. 12.
x U.S. Census Bureau (2017 population estimated); U.S. Census Bureau, American Community Survey 5-Year Estimates.
xi U.S. Census Bureau (2017 population estimated); U.S. Census Bureau, American Community Survey 5-Year Estimates.
xii U.S. Department of Housing and Urban Development (2018). The 2018 Annual Homeless Assessment Report (AHAR) to Congress. 12.
xiii U.S. Census Bureau (2017 population estimated); U.S. Census Bureau, American Community Survey 5-Year Estimates.
xiv Culhane, D., Metraux, S., Treglia, D., Lowman, K., Ortiz-Siberon, A. (2019). Latinx Homelessness in Philadelphia: Rates of Service Use, Perceived Barriers and Assets, and Potential Opportunities for Leveraging City Reform Efforts to Address Service Gaps. http://works.bepress.com/dennis_culhane/233/ xv Conroy, S. and Heer, D. (2003). Hidden Hispanic Homelessness in Los Angeles: The “Latino Paradox” Revisited. Hispanic Journal of Behavioral Sciences. Vol. 25 No. 4, 536.