for personal use only - asx2008/04/29 · (1) based on bbi closing price of $1.15 on 17/4/08 (2)...
TRANSCRIPT

ASX RELEASE 29 April 2008 BABCOCK & BROWN INFRASTRUCTURE CONFERENCE Please see the attached presentation to be delivered by Jeff Kendrew, Chief Executive Officer, at the Babcock & Brown Infrastructure Conference in London later today. ENDS Further Enquiries Jeff Kendrew Chief Executive Officer Babcock & Brown Infrastructure +61 2 9229 1800
Helen Liossis Investor Relations Manager Babcock & Brown Infrastructure +61 2 9229 1800
ABOUT BABCOCK & BROWN INFRASTRUCTURE Babcock & Brown Infrastructure (ASX: BBI) is a specialist infrastructure entity which provides investors access to a diversified portfolio of quality infrastructure assets. BBI’s investment strategy focuses on acquiring, managing and operating quality infrastructure assets in Australia and internationally. BBI’s current portfolio is diversified across two asset classes:
Asset Class FY07 BBI EBITDA* Contribution to FY07 BBI EBITDA*
Transport $299.4m 53% Energy Transmission and Distribution $266.7m 47% TOTAL $566.1m 100% *Excluding BBI corporate overheads
BBI is managed by Babcock & Brown Infrastructure Management Pty Limited (BBIM), a subsidiary of Babcock & Brown Limited (ASX: BNB), a global investment and advisory firm with longstanding capabilities in structured finance and the creation, syndication and management of asset and cash flow-based investments, particularly infrastructure investments.
BBI is listed on the Australian Stock Exchange and has a market capitalisation of approximately A$2.8 billion.
For further information please visit our website: www.bbinfrastructure.com
For
per
sona
l use
onl
y

Babcock & Brown Infrastructure Strength in Diversity
Babcock & Brown Infrastructure Conference 29 April 2008, London
For
per
sona
l use
onl
y

2
DISCLAIMER
To the maximum extent permitted by law, none of Babcock & Brown Infrastructure Limited, Babcock & Brown Investor Services Limited as responsible entity of the Babcock & Brown Infrastructure Trust, Babcock & Brown Infrastructure Management Pty Limited, nor any of their related entities (collectively “BBI”) nor their respective directors or officers or any other person accepts any liability for any loss arising from the use of this presentation or its contents or otherwise arising in connection with it, including without limitation, any liability arising from fault or negligence on the part of BBI or their respective directors or officers or any other person. The information contained in this presentation is not intended to constitute legal, tax or accounting advice or opinion. No representation or warranty, express or implied, is made as to the accuracy, completeness, fairness, correctness or thoroughness of the information contained in the presentation. The recipient should consult with its own legal, tax or accounting advisers as to the accuracy and application of the information contained in the presentation and should conduct its own due diligence and other enquiries in relation to such information.
The information in this presentation has not been independently verified by BBI. Actual results may vary from the information in this presentation and any variation may be material. BBI disclaims any responsibility for any errors or omissions in such information, including the financial calculations, projections and forecasts set out in the presentation. No representation or warranty, express or implied, is made by or on behalf of BBI that any projection, forecast, calculation, forward-looking statement, assumption or estimate contained in this presentation should or will be achieved.
This presentation is not an offer or invitation for subscription or purchase of or a recommendation of securities. In providing this presentation, BBI has not considered the objectives, financial position or needs of the recipient. The recipient should obtain and rely on its own professional advice from its tax, legal, accounting and other professional advisers in respect of the recipient’s objectives, financial position or needs.
This presentation does not carry any right of publication. This presentation is incomplete without reference to, and should be viewed solely in conjunction with, the oral briefing provided by BBI. Neither this presentation nor any of its contents may be reproduced or used for any other purpose whatsoever without the prior written consent of BBI.
For
per
sona
l use
onl
y

3
AGENDA
1. BBI Overview
2. Results highlights
3. Asset class highlights
4. Distributions
5. Capital management
6. Growth and outlook
7. Appendix
Presenter:Jeff Kendrew – Chief Executive Officer
For further information please contact:Helen Liossis – Investor Relations Manager+61 2 9229 [email protected]
For
per
sona
l use
onl
y

4
BBI OVERVIEW
Current Portfolio
• BBI operates across two asset classes: Energy Transmission & Distribution & Transport Infrastructure
• BBI’s businesses operate in several different regulatory regimes• BBI’s businesses benefit from international geographical diversification• Assets provide organic & step-change growth upsides to BBI
Target Returns
• Distributions paid from operating cash flow• Distribution yield 13.0% (tax deferred)(1) in 08F (2)
• Distribution yield 13.9% (close to 100% tax deferred)(1) in 09F (2)
• Expected to be fully tax deferred in 08F and 09F
Listing
• BBI was listed on the ASX in June 2002• 2.376 billion securities on issue• Current market capitalisation approximately $2.7 billion(1)
• Since listing, TSR achieved was 120.1% (ASX200: 117.6%) (3)
Management
• Managed by Babcock & Brown an experienced energy transmission, distribution and transport infrastructure manager
• Experienced operating management team• Majority independent directors on Board
(1) Based on BBI closing price of $1.15 on 17/4/08(2) BBI is targeting 15 cents in FY08 & 16 cents in FY09 periods provided these key assumptions are achieved – no material adverse
change to key tax or regulatory environments and the completion of the DBCT expansion in line with schedule(3) TSR calculated over: 24 June 2002 to 17 April 2008
(Source: Bloomberg)
For
per
sona
l use
onl
y

5
HY08 RESULT HIGHLIGHTS
1 Source: Bloomberg, Period 24 June 2002 to 17 April 2008
2 The distribution guidance for the FY08 & FY09 periods is based on the following assumptions:
- Completion of the DBCT expansion in line with schedule
- No material adverse change to key tax and regulatory environments
Maintaining distribution guidance of 15cps and 16cps for 2008 and 2009 respectively2
HighlightsFinancial Performance
Revenue (m) $1,016.7 69%
EBITDA (m) $319.7 27%
Cash avail for distribution (m) $167.0 53%
FY08 Interim Distribution (cps) 7.5 7.1%
TSR since IPO1 120.1%
ASX200 Acc TSR1 117.6%
• FY08 Interim distribution confirmed at 7.5 cents per stapled security and expected to be fully tax deferred
• Continued revenue and EBITDA growth across both asset classes with all assets performing in line with expectations
• First time contributions from the Australian ET&D businesses (ex Alinta) & a number of BBI European ports
• Further accretive European Ports and NGPL acquisitions completed
• Australian ET&D businesses (ex Alinta) performing in line with expectations
• European Ports portfolio volumes & EBITDA up on last year (& within expectations)
For
per
sona
l use
onl
y

6
HIGHLIGHTS – ET&DPowerco• Powerco continues to experience good growth in connections in NZ electricity and Tasmania gas• Powerco awaiting final result on Gas Authorisation and welcomed the New Zealand government’s
proposed Commerce Act changes to increase regulatory certainty
International Energy Group• IEG continues to experience strong growth in connections and orders• IEG UK: 37,700 gas orders received and 28,000 UK gas connections completed in first half FY08• Cumulative contracted gas connections (orders and connections) of 461,000 at 31 December 2007• IEG UK: over 9,000 electricity orders received in first half of FY08
US ET&D• Cross Sound Cable (CSC) has signed an O&M services agreement with Trans Bay Cable• CSC had no forced, scheduled or third-party outages in first half of FY08• BBI has acquired a 26% stake (the single largest holding) in MidCon LLC (“MidCon”) which is the
100% owner of the Natural Gas Pipeline Company of America (“NGPL”)• NGPL increases BBI’s presence in the US & expands its Energy Transmission & Distribution portfolio
Australian ET&D• BBI completed the Alinta acquisition on 31 August 2007¹
and secured significant Australian gas transmission and distribution assets and the Western Australian Asset Management business (Australian ET&D businesses) . The business integration is progressing well
• All Australian ET&D businesses performing in line with budgets and Scheme Book expectations • Western Australian Asset management business re-branded “WestNet Energy” and pursuing project
management and asset management growth opportunities Australia wide in the gas and electric transmission sector
• The regulatory decision at Multinet on 7 March 2008 is a good example of normal regulatory practice of passing on higher costs of debt
¹
BBI receives its proportionate share of operating cash from the Australian ET&D businesses for July and August 2007
For
per
sona
l use
onl
y

7
HIGHLIGHTS – TRANSPORTDalrymple Bay Coal Terminal • DBCT 7X Expansion project on track: Phase 1 was completed in early March 2008 and Phase 2/3
remains on target for completion in December 2008
• 100% of pre-award DBCT 7X Expansion contracts (to value of $695.7m at 31 January 2007) submitted to the QCA to date have satisfied all expenditure approval requirements
• QCA has approved a preliminary final cost estimate for Phase 1 of circa $590 million, which will be used as the basis for BBI to provisionally begin invoicing customers from 1 April 2008
WestNet Rail • WestNet Rail experienced increased non-grain volumes, which offset the lower grain haulage volumes
(due to the impact of the drought)
• QR access revenues were up 9% on last year
PD Ports• PD Ports experienced increased container volumes and steel export volumes, increases in both slab
steel and finished steel volumes, continued higher LoLo and RoRo volumes and strong pipe and plate volume through Hartlepool
• Bulk volumes lower due to scheduled maintenance shutdown of some of the ports major customers.
• Recently received final government approval for the Northern Gateway project
European Ports• Volumes grew 5% for the 2007 calendar year and on target¹• Completed numerous bulk concession port acquisitions this half to form the BBI Euroports business
with an EV (100% basis) greater than $1.5 billion
¹
As stated at the European Ports Analyst Briefing on 29 October 2007
For
per
sona
l use
onl
y

8
10
11
12
13
14
15
16
17
FY2006 FY2007 FY2008 FY2009
BBI DISTRIBUTIONS
CAGR 6.5%
Distribution ApproachDistributions paid substantially from operating cashflows after:• debt servicing• working capital• maintenance capital expenditure • cash tax paid
It does NOT include proceeds from regearing, refinancing or restructuring initiatives
Distribution Guidance¹
• BBI is targeting a 15.0 cent per stapled security full year distribution in 2008 Financial Year and 16.0 cent per stapled security full year distribution in 2009 Financial Year1
• Post 2009 further distribution growth is anticipated
• FY08 Distributions expected to be fully tax deferred (and will be confirmed with the release of the full year results).
Growth NOT included in the Guidance
1 The distribution guidance for the FY08 & FY09 periods is based on the following
assumptions:
- Completion of the DBCT expansion in line with schedule
- No material adverse change to key tax and regulatory environments
• Full year contribution of DBCT Phase 2/3 in FY10• Transmission development opportunities in Aust and NZ• IEG electricity connection growth• PDP - deep sea container terminal (Northern Gateway) and
further development of vacant land (e.g. ASDA replication)• WNR - iron ore expansion infrastructure opportunities• WA asset management - new large scale electricity and gas
transmission construction and asset management opportunities• NGPL large scale gas transmission and storage opportunities
15.016.0
14.2513.25
Cen
ts p
er S
tapl
ed S
ecur
ity
Distribution History and Guidance¹
For
per
sona
l use
onl
y

9
BBI’s CURRENT CAPITAL MANAGEMENT POSITION
¹
Assumes all debt was in place at 31 December 2007 and is drawn to the facility limit at maturity. NZ SPARCS and BBI EPS are excluded from profile as for this analysis it is assumed these instruments will be redeemed /converted into BBI securities at maturity
²
Forecast debt profile based on proportionate ownership interest and includes debt associated with recently announced BBI’s European ports acquisitions and NGPL but excludes NZ SPARCS and BBI EPS
-
2,000
4,000
6,000
8,000
10,000
12,000
Dec-07 Jun-08 Dec-08 Jun-09 Dec-09
AU
D M
illio
ns
0.00%
1.00%
2.00%
3.00%
4.00%
5.00%
6.00%
7.00%
8.00%
Forecast Debt Profile* Natural hedge Fixed Debt & Swaps Weighted Average Rate
0
500
1000
1500
2000
2500
3000
Jun-2008 Jun-2009 Jun-2010 Jun-2011 Jun-2012 Jun-2013 Jun-2014 Jun-2015 Jun-2016 2016 +
Mill
ions
($A
)
Corporate debt Non-recourse asset level debt
BBI Debt Maturity Profile¹
Interest Rate Risk² BBI’s has hedged its interest rate exposure
Hedged between 94% and 85% to Dec 2009
Debt position is well placed• 10% of total debt maturing in the period to June 2009 (on
regulated assets and asset which have strong monopolistic cash flows)
• 80% of debt matures post June 2010• Successfully refinanced, upsized and syndicated BBI’s existing
corporate facility (3 & 5 year tranches) at lower margins• Successful financing of DBCT Phase 2/3 expansion (3 & 5 year
tranches)• Existing debt facilities will fund all material near term organic
growth capex• Robust projected consolidated FY08 EBITDA / Interest cover of
2.0x (EBITDA - Maintenance capex / Interest cover is 1.7x)
• 100bp increase in rates in every jurisdiction that BBI operates in equates to c.0.5 cents per security in FY08 or < 3.5% of BBI’s forecast distribution for FY08.
• Regulated assets contribute c. 75% of BBI’s EBITDA. • Regulated regimes and inflation-linked revenues provide
further natural hedges to movement in interest rates• Underlying assets have strong credit characteristics in
sectors with inherently low credit volatility• Average margin across BBI’s consolidated debt is c. 100bp• BBI’s corporate debt interest cover at 31 December 07 was
8.86x (31 December 2006 5.68x) – lock up occurs at 2x
Average maturity is between 6 - 7 years
For
per
sona
l use
onl
y

10
MANAGED GROWTH
Near Term Growth Opportunities• DBCT - Phase 2/3 Expansion
• DBNGP - 5a Expansion
• Powerco and TGP - Tasmanian Natural Gas connection and volume growth
• IEG - Continued UK electricity and gas connection growth
• PD Ports - ASDA replication potential
Longer Term Growth Opportunities• PD Ports - Northern Gateway project
• WNR - Iron ore expansion and infrastructure opportunities
• Powerco - NZ electricity transmission projects and Tasmanian co-generation projects
• WA Asset Management expansion into new markets
• NGPL – gas transmission and storage extensions and expansions
Growth Opportunities
There is more than A$2 billion of stepped growth opportunities embedded within BBI’s existing portfolio
For
per
sona
l use
onl
y

11
2008 OUTLOOKPeriod of ConsolidationBBI is focussed on a period of consolidation which involves three streams of activity:• Optimisation: finding the best and most efficient practices at our current operations;• Extracting organic growth: building organically on existing businesses through
commercially attractive enhancement capex investments (and projects) and increasing revenue and EBITDA growth opportunities; and
• Integration: bedding down new acquisitions and governance practices and reporting into the BBI portfolio including the Alinta assets, the BBI European Ports and NGPL
Capital management • Long debt maturity profile, minimal exposure to interest rate movement and good cash
coverage of interestDistributions• BBI expects that distributions will be fully funded from operating cash flows when the
DBCT Phase 2/3 expansion is completed (i.e. full coverage of distributions expected in the 2009 calendar year)
• Completion of DBCT Phase 2/3 to contribute strong operating cash flows to support distribution growth
FY08 distribution will be not less than 15.0 cents per stapled security and FY09 distribution target of 16cps¹
1 BBI is targeting a 15.0 cent per stapled security full year distribution in 2008 Financial Year and 16.0 cent per stapled security full year distribution in 2009 Financial Year. The distribution guidance for the FY08 & FY09 periods is based on the following assumptions: Completion of the DBCT expansion in line with schedule; No material adverse change to key tax and regulatory environments
For
per
sona
l use
onl
y

12
Appendix
For
per
sona
l use
onl
y

13
BBI STRATEGY
BBI's investment strategy focuses on acquiring, managing and operating
quality infrastructure assets in two distinct asset classes: Energy
Transmission & Distribution and Transport Infrastructure with
geographic coverage on a global basis in OECD countries
For
per
sona
l use
onl
y

14
BBI BUSINESS PORTFOLIO
*
Transport InfrastructureEnergy Transmission & Distribution
For
per
sona
l use
onl
y

15
OVERVIEW OF ET&D BUSINESSESAsset
Description Electricity & gas distribution LPG, natural gas & electricity distribution and supply
Location North Island of New Zealand & Tasmania, Australia United Kingdom, the Channel Islands*, Isle of Man & Portugal
Acquired Nov 2004 – A$1.7b for 10x EV/EBITDA** Jun 2005 – A$600m for 10.4x EV/EBITDA**
BBI % ownership 100% 100%
Regulatory Environment
Subject to economic regulation in NZ:• NZ electricity operates under a price & quality threshold
(CPI-X) regime. Reset is due in 2009• NZ gas operates under provisional price control. Final
decision expected in June 2008No economic regulation in Tasmania
UK: capacity charges (regulated gas & electricity charges giving fixed revenue per connection) Channel Islands* & Isle of Man: monitoring Portugal: open market, no economic regulation
Customer Base Broad, low volatility customer base, diversified both regionally & by customer class. Electricity & gas customers are largely residential, generally contracted via retail energy companies
UK: shippers of gas, suppliers of electricity, largely residential with capacity charges Channel Islands*, Isle of Man & Portugal: direct contracts with end- users, both commercial & residential
Asset Age & Condition
Electricity: ~ half economic life (25yrs) Gas: < half economic life (18yrs) Assets in good condition commensurate with age
UK: 0 - 11yrs Channel Islands* & Isle of Man: assets are in good condition commensurate with age
Portugal: 0 - 16yrs
Utilisation 13.9MWh per electricity connection & 101.6GJ per gas connection (23GJ per residential gas customer)
Systems designed for 1:20 winter demand conditions
Key Drivers Energy demand & consumption levels New connections as a result of new housing developments in all areas. Regional economic & population growth
New connections in gas & electricity
Outlook Tasmanian co-generation & natural gas connectionsCommerce Commission – final decision on gas authorisation
UK electricity connections achieve 17,500 orders in 2007/8UK gas connections targeted to maintain market share at 75,000pa
* Guernsey, Jersey
** excluding transaction costs and reserves
For
per
sona
l use
onl
y

16
OVERVIEW OF ET&D BUSINESSES CONT’D
** excluding transaction costs and reserves
Asset NGPL Australian ET&D
Description A 330MW HVDC submarine cable transmission interconnector system linking the New England & New York transmission grids
Natural gas transmission pipeline & storage system A portfolio of 5 strategic essential infrastructure businesses which include gas transmission & distribution pipelines & an O&M business
Location Connecticut & New York, USA Traverses through 10 states, USA Victoria, Tasmania & WA
Acquired Feb 2006 – a$280M for 13.7x EV/EBITDA** December 2007 Financial close was August 2007
BBI % ownership
100% 26% Various (between 18.3% to 100%)
Regulatory Environment
Regulator, Federal Energy Regulatory Commission (FERC) - US Federal Regulator - approval for transmission capacity rate & long term contract through June 2032.
Regulated by the (FERC), including rates charged as per the Natural Gas Act. The last FERC ruling was in 1996
Various (and includes Essential Services Commission – (ESC), Australian Energy Regulatory (AER), Economic Regulation Authority of WA (ERA)
Customer Base
Transmission capacity contracted to LIPA, a creditworthy municipal power authority, through June 2032
Diversity of high creditworthy customers. Top 10 customers make up appro 61% of transmission & storage revenues. Average contract terms are 3.4 yrs & 4.4 yrs for transport & storage customers respectively with long history of contracts being rolled over
Industrial, commercial and residential customers
Asset Age & Condition
In early stages of economic life of > 40yrs N/A Various with youngest being TGP & DBNGP with remainder being midlife assets such as Multinet & AGN
Utilisation LIPA has contracted for 100% of the 330MW transmission capability
Storage services sold out long term. Amarillo, Crosshaul & Louisiana pipelines are sold out long term. Gulf Coast pipeline typically sold out in winter with some summer capacity available.
Key Drivers Revenue inflator applies with capacity rate structure. Gas & storage demand with demand for service generating system optimisation opportunities
Demand for natural gas. Economic growth in WA
Outlook Growth in capacity rates is contracted. Strong stable demand for transmission & storage services (underpinned by a captive residential/commercial customer base)
DBNGP – stage 5A to deliver additional capacity in 2008Complete integration & $518M refinance
For
per
sona
l use
onl
y

17
OVERVIEW OF TRANSPORT BUSINESSESAsset
Description Port facility for the receival, preparation and export of coal A rail infrastructure owner and access provider
Location Queensland, Australia Western Australia, Australia
Acquired Sept 2001 – Seed asset of Prime Infrastructure (now BBI) Jun 2006 – A$420.7m for 8.75x EV/EBITDA**
BBI % ownership 100% leasehold (100% economic ownership of 99 year lease Currently 51% (with call option over remaining 49%). BBI will own 100% from 31 March 2008
Regulatory Environment
Terms and conditions of access are regulated by the QCA. Next regulatory reset are in 2009
Line segment regulation based on revenue ceilings; Gross Replacement Value, a regulated WACC and efficient annual overhead and operating costs
Customer Base
Bowen Basin coal mines. DBCT customers include mines owned by some of the world’s largest mining companies. Customer agreements are in the form of long term 100% take- or-pay contracts.
Access agreements with strong blue chip customers (including long term access agreement with Queensland Rail)
Asset Age & Condition
New assets (post expansion) will have an average life of > 40 years
Varies across line segments. Maintenance and renewal obligations are mandated by the lease with the WA Government and are being complied with
Utilisation Historically approximately 90% utilisation, actual volume shipped does not impact cash flows due to the regulatory and the 100% take or pay contractual regime.
Varies across line segments. Ample spare capacity on lighter gauge lines, and ability to increase capacity to meet demand
Key Drivers
International coal demand which underpin expansions of the terminal
WA economy (GSP) Global economic activity and commodity demand Mine expansion activities of current users, and addition of new users
Outlook Phase II/III scheduled to be completed by the end of calendar year 2008
Acquire remaining 25% minority interest by December 2008Iron ore expansion & infrastructure opportunities. Good non grain growth
** excluding transaction costs and reserves
For
per
sona
l use
onl
y
18
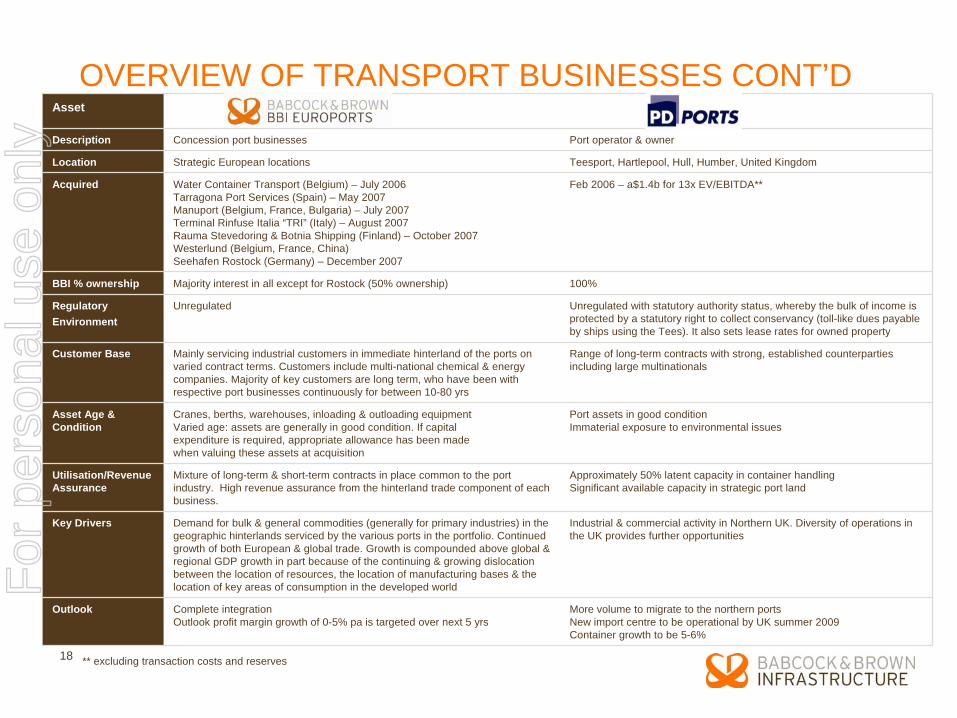
OVERVIEW OF TRANSPORT BUSINESSES CONT’DAsset
Description Concession port businesses Port operator & owner
Location Strategic European locations Teesport, Hartlepool, Hull, Humber, United Kingdom
Acquired Water Container Transport (Belgium) – July 2006Tarragona Port Services (Spain) – May 2007Manuport (Belgium, France, Bulgaria) – July 2007Terminal Rinfuse Italia “TRI” (Italy) – August 2007Rauma Stevedoring & Botnia Shipping (Finland) – October 2007Westerlund (Belgium, France, China)Seehafen Rostock (Germany) – December 2007
Feb 2006 – a$1.4b for 13x EV/EBITDA**
BBI % ownership Majority interest in all except for Rostock (50% ownership) 100%
Regulatory Environment
Unregulated Unregulated with statutory authority status, whereby the bulk of income is protected by a statutory right to collect conservancy (toll-like dues payable by ships using the Tees). It also sets lease rates for owned property
Customer Base Mainly servicing industrial customers in immediate hinterland of the ports on varied contract terms. Customers include multi-national chemical & energy companies. Majority of key customers are long term, who have been with respective port businesses continuously for between 10-80 yrs
Range of long-term contracts with strong, established counterparties including large multinationals
Asset Age & Condition
Cranes, berths, warehouses, inloading & outloading equipmentVaried age: assets are generally in good condition. If capital expenditure is required, appropriate allowance has been made when valuing these assets at acquisition
Port assets in good condition Immaterial exposure to environmental issues
Utilisation/Revenue Assurance
Mixture of long-term & short-term contracts in place common to the port industry. High revenue assurance from the hinterland trade component of each business.
Approximately 50% latent capacity in container handling Significant available capacity in strategic port land
Key Drivers Demand for bulk & general commodities (generally for primary industries) in the geographic hinterlands serviced by the various ports in the portfolio. Continued growth of both European & global trade. Growth is compounded above global & regional GDP growth in part because of the continuing & growing dislocation between the location of resources, the location of manufacturing bases & the location of key areas of consumption in the developed world
Industrial & commercial activity in Northern UK. Diversity of operations in the UK provides further opportunities
Outlook Complete integrationOutlook profit margin growth of 0-5% pa is targeted over next 5 yrs
More volume to migrate to the northern portsNew import centre to be operational by UK summer 2009Container growth to be 5-6%
** excluding transaction costs and reserves
For
per
sona
l use
onl
y

19
Europe China
EUROPEAN PORT LOCATIONSF
or p
erso
nal u
se o
nly

20
NATURAL GAS PIPELINE COMPANY OF AMERICA
• BBI has acquired a 26% stake (the single largest holding) in MidCon LLC (“MidCon”) which is the 100% owner of the Natural Gas Pipeline Company of America (“NGPL”)
• NGPL has an 100% EV of A$7.6b1 and the acquisition represents an attractive EV/EBITDA of 10.7x2
• NGPL is one of the largest natural gas transmission pipeline and storage systems in the United States. By way of comparison, NGPL is more than eight times the length and annual throughput of the Dampier to Bunbury Natural Gas Pipeline (“DBNGP”)
• NGPL increases BBI’s presence in the US and expands its Energy Transmission & Distribution portfolio
• NGPL improves BBI’s geographic and regulatory diversity• The residual 20% interest of MidCon will be held by
Knight Inc., a premier pipeline operator in the US, who will continue to operate and maintain NGPL under contract
• The other Consortium partners are equity investors with a long term hold strategy with an alignment of interests
1 FX rate used 0.86752 Excludes transaction costs; and based on estimated 2007 calendar year EBITDA
NGPL Pipeline and Storage System
Amarillo Line
Gulf Coast Line
Louisiana Line
A/G Line
Pipeline
Storage
For
per
sona
l use
onl
y

21
NGPL BUSINESS STRENGTHSConnectivity Storage1
Access to Supply Services in High Demand
NGPL’s business strengths result in strong, stable cash flows
• NGPL has 1101 existing interconnects with local distribution companies (“LDCs”) Nicor and Peoples (Integrys) in the congested Chicago region – very difficult to replicate
• NGPL is well connected to markets along the system and to other pipelines accessing downstream markets, bolstering demand for NGPL’s services
• Gas fired power plants – gas demand connected directly to NGPL with no or limited options to connect to competitors
• The ability to offer short and long term storage services, which are in high demand in today’s volatile market place, raises the value of all NGPL transport and storage products
• Seven storage facilities with approximately 630 PJ storage capacity and 272 PJ working gas capacity; flexibility to offer integrated services
• Peak day storage deliverability of 1.5 PJ/day – represents 25% of system throughput capability
• Access to major supply basins including Rockies, Permian, Midcontinent and the Gulf Coast region
• Not locked into one or two supply basins; customers have options for gas supply
• Adjacent NGPL storage is of benefit to suppliers
• NGPL may also benefit from the projected dramatic increase in LNG shipments to the US marketplace via the Gulf Coast
• Storage services sold out long term
• Amarillo, Crosshaul & Louisiana Line Pipelines transport sold out long term
• Gulf Coast Pipeline transport typically sold out in winter with some summer capacity available
• Demand for service generates system optimisation opportunities
1 Source: KMI Form 10-k Report – December 2006
For
per
sona
l use
onl
y

22
HY08 RESULTS SUMMARY
Note: 100% of WestNet Rail revenue and EBITDA is reported above, BBI owns 51% of WestNet Rail and has a call option over the remaining 49% which will be exercised on 31 March 2008. 100% of the BBI Euroports revenue and EBITDA is reported above in the above figures. BBI owns circa 71% of the reported BBI Euroports revenue and circa 66% of the reported BBI Euroports EBITDA for the period ended 31 December 2007.
Actual 6months to 31 Dec 07
$m
Actual 6months to 31 Dec 06
$mVariance
A$mVariance
%REVENUETransport Infrastructure 654.2 350.9 303.3 86%Energy Transmission & Distribution 362.5 250.4 112.1 45%Total Revenue 1,016.7 601.3 415.4 69%EBITDATransport Infrastructure 174.9 151.5 23.4 15%Energy Transmission & Distribution 176.6 124.4 52.2 42%FX (losses) / gain (3.1) (3.9) 0.8 21%Loss on disposal of PP&E (4.1) 0.0 (4.1) 100%Corporate Overheads (7.2) (9.8) 2.6 27%Base Fee (17.4) (10.6) (6.8) (64%)Total EBITDA - continuing operations 319.7 251.6 68.1 27%Depreciation & Amortisation (141.7) (88.0) (53.7) 61%EBIT 178.0 163.6 14.4 9%Borrowing costs (net of revenue) (205.3) (156.5) (48.8) (31%)Hedge (gain) / Expense 11.5 (58.8) 70.3 120%NLBT from continuing operations (15.8) (51.7) 35.9 69%
For
per
sona
l use
onl
y

23
HY08 REVENUE & EBITDA IN BASE CURRENCY
Note: The December 06 comparative for BBI Euroports only includes WCT. The WestNet result is 100%. The Australian ET&D assets were acquired 31 August 2007 as part of the Alinta transaction therefore current period result is for 4 months. The Australian ET&D result is the statutory result (i.e. 100% of the 4 month results of AGN, TGP and West O&M businesses and BBI’s share of profit after tax for the 4 months for its relevant interest in the DBP and Multinet businesses)
Actual 31 December 07
A$m
Actual 31 December 06
A$m
Actual 31 December 07 (local currency)
millions
Actual 31 December 06 (local currency)
millions
Revenue from Continuing OperationsDBCT (AUD) 87.8 82.1 87.8 82.1
PD Ports (GBP) 157.3 158.8 67.1 64.0
WestNet Rail (AUD) 92.5 95.5 92.5 95.5
EuroPorts (Euro) 316.6 14.5 194.3 8.6
Powerco (NZD) 162.2 154.3 187.0 180.4
IEG (GBP) 91.6 83.2 39.1 33.5
Australian ET&D (AUD) 97.3 - 97.3 -
CSC (USD) 11.4 12.9 9.9 9.8
EBITDA from Continuing OperationsDBCT (AUD) 44.4 44.0 44.4 44.0
PD Ports (GBP) 50.3 52.5 21.5 21.5
WestNet Rail (AUD) 41.9 52.9 41.9 52.9
EuroPorts (Euro) 38.3 2.1 23.5 1.4
Powerco (NZD) 98.0 89.8 112.5 105.0
IEG (GBP) 29.6 25.8 12.6 10.4
Australian ET&D (AUD) 41.0 - 41.0 -
CSC (USD) 8.0 8.8 7.0 6.6For
per
sona
l use
onl
y

24
CASH AVAILABLE FOR DISTRIBUTION BY BUSINESS
1 Australian ET&D results include the operating cash generated for July and August as the Australian ET&D businesses were acquired cum this operating cash flow
2 Refer to reconciliation of total cash flow available for distribution for calculation of Operating Cash flow from continuing operations available to pay distributions on slide 20 and slide 21
Transport
DBCT $28.3m
WestNet Rail (51%) $7.0m
PD Ports $21.5m
European Ports (various) $11.9m
TOTAL $68.7m
Energy T&D
Powerco $32.5m
IEG $9.0m
Australian ET&D1 $18.7m
CSC $1.5m
TOTAL $61.7m
$130.4m Cash available for distribution from operating businesses
($7.2m) Less corporate overheads, management fees and interest income
$43.8m Release of undistributed prior year operating cash flow, cash gain on sale of power generating assets and capitalised equity return during DBCT expansion
$167.0m2 (7.5 cps) Cash available for distribution to SecurityholdersFor
per
sona
l use
onl
y

25
RECONCILIATION OF CASH FLOW AVAILABLE FOR DISTRIBUTIONS
31 Dec 2006 31 Dec 2006 31 Dec 2006
Actual 31 December 07
A$m
EBITDA 324.0
Less
Interest Paid (net) (193.0)
Cash Tax Paid (4.9)
Maintenance Capital Expenditure (46.6)
Add
Cash Reserves Released and Disposal of Trading Assets 17.5
Cash Available attributable to Minority Interests (15.8)
Other (FX Cash Gain, Tas Government Contribution) 31.7
Operating Cash flow from Continuing Businesses 112.9
Securities on issue in Respect of Continuing Businesses (in millions) 1,536.0
Operating Cash flow Available from Continuing Operations to Pay Distributions (CPS) 7.4
Securities (millions)
Weighted Average Number of Equity Issued in Respect of Current Operating Businesses 1,536.0
Weighted Average Number of Equity Issued to Fund DBCT Phase Expansion 350.0
Weighted Average Number of Equity Issued in Respect of Surplus Funds 341.0
Total Weighted Average Number of Securities on Issue Eligible for Distribution 2,227.0
For
per
sona
l use
onl
y