food waste
DESCRIPTION
TRANSCRIPT
CASE STUDY FINAL PRESENTATIONNouf Aljalal
Abdulaziz AlmaarikMatthew MycroftRama Wusirika
SELP 552Professor Rosalind LewisApril 30th, 2012
Research Plan
Apr 10, 2023 2
• Case Study Objective: Reduce the Amount of Food Waste Sent to Landfills– Null Hypothesis: Food Waste Sent to Landfills Cannot Be Reduced
– Alternate Hypothesis: Food Waste Sent to Landfills Can Be Reduced
• Methodology – Analysis of Alternatives
• What Technologies Are Out There ?• Can These Technologies Reduce Waste ?• Which Is The Most Effective ?
– Develop Selection Criteria
– Develop Screening Criteria
– Cost/Benefit Analysis• What Are The Cost of These Technologies ?• What Is the ROI of These Technologies ?• Do The Savings Justify The Cost ?
Research Plan
• Objective: Develop Requirement Analysis Plan– Performance Requirements
• What Makes A Technology Effective or Ineffective?
– Functional Requirements
• How and Under What Conditions Must The Technology Perform Under
– Architectural Constraints
• What Are The Limitations That Make A Technology Effective or Ineffective
– Measures of Performance
• How Will We Measure The Effectiveness of the Technology?
– Verification Criteria
• How Will We Verify That A Technology Is Working?
• Resources:– Written Articles, Textbooks
– Current Company Technology Review
– Applicable Laws and Regulations
• FAO
• USDA
– From Where
• Library
• LMU
Apr 10, 2023 3
Research Plan- Risks
• Risks– Technical Risks
• No Technology Can Be Found That Meets the Performance Criteria
– Cost Risk• The Technology Is Too Expensive To Develop Or Implement
– Schedule Risk• The Technology Cannot Be Implemented In A Practical Timeframe To Make A Difference
– Programmatic Risk• Decisions At Higher Authorities Levels (Government or Industry) Could Render Technology
Useless
• Funding Issues
• Dealing with Setbacks/Hurdles– Only Chose Selections Determined to Be Measurable– Difficulty with Obtaining Quantitative Data: Took More Qualitative Look– Evaluation of Multi-Criterion Solutions:
• TOPSIS and SAW
• Build Quantitative Scorecard for Qualitative Multi-Criterion Solution
Apr 10, 2023 4
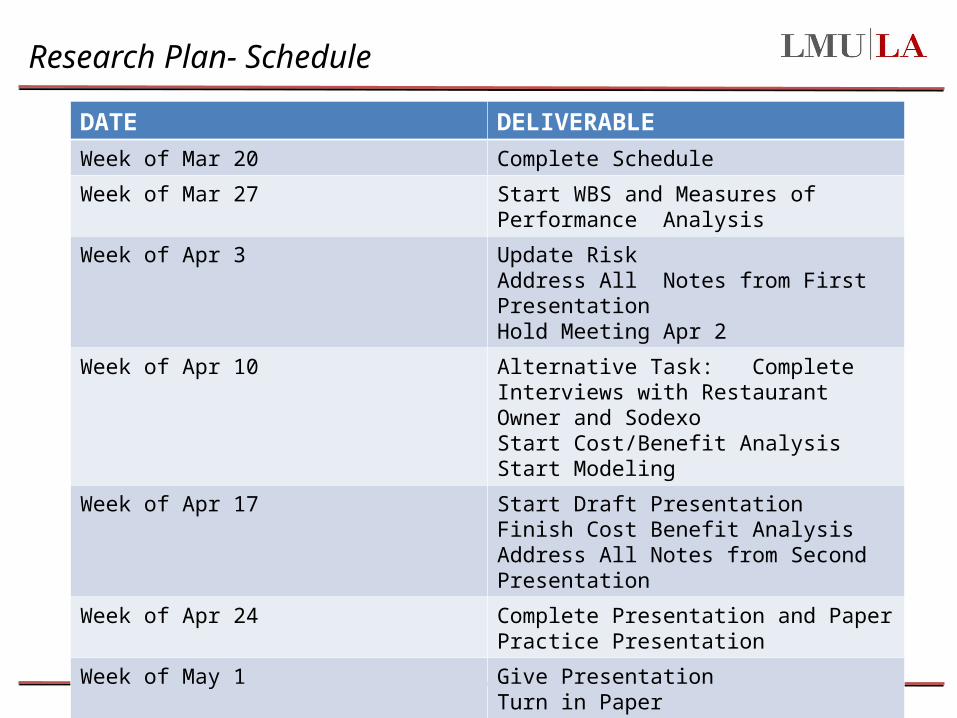
Research Plan- Schedule
DATE DELIVERABLE
Week of Mar 20 Complete Schedule
Week of Mar 27 Start WBS and Measures of Performance Analysis
Week of Apr 3 Update Risk Address All Notes from First PresentationHold Meeting Apr 2
Week of Apr 10 Alternative Task: Complete Interviews with Restaurant Owner and SodexoStart Cost/Benefit AnalysisStart Modeling
Week of Apr 17 Start Draft Presentation Finish Cost Benefit AnalysisAddress All Notes from Second Presentation
Week of Apr 24 Complete Presentation and PaperPractice Presentation
Week of May 1 Give Presentation Turn in Paper
METHODS / ANALYSIS
Apr 10, 2023 6
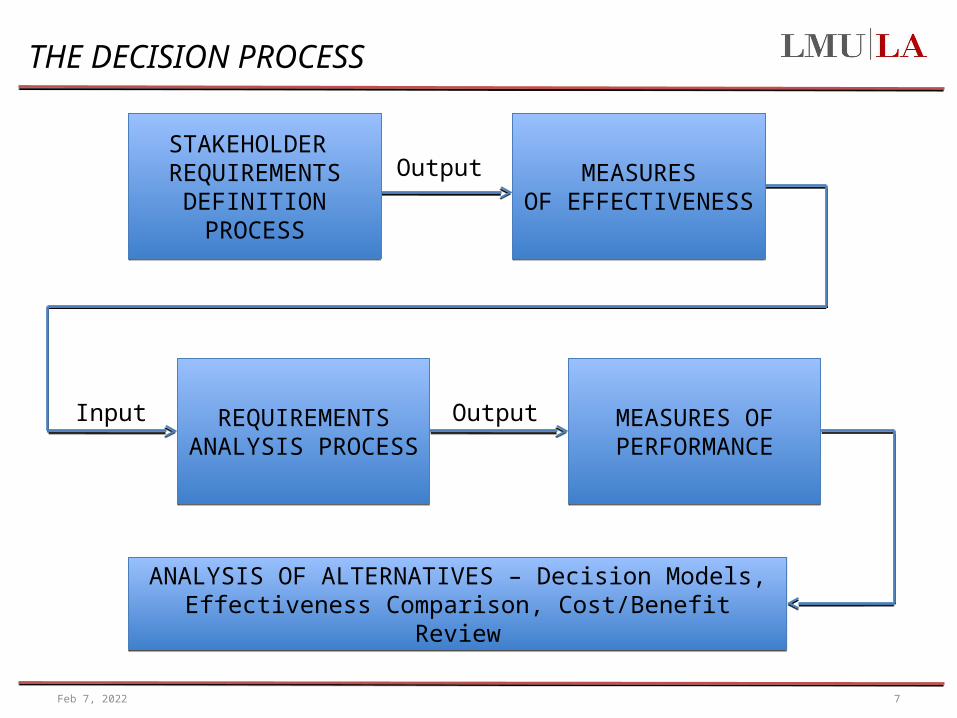
THE DECISION PROCESS
Apr 10, 2023 7
MEASURESOF
EFFECTIVENESS
MEASURESOF
EFFECTIVENESS
STAKEHOLDER REQUIREMENTS
DEFINITIONPROCESS
STAKEHOLDER REQUIREMENTS
DEFINITIONPROCESS
Output
REQUIREMENTS ANALYSIS PROCESS
REQUIREMENTS ANALYSIS PROCESS
Input Output MEASURES OF PERFORMANCEMEASURES OF PERFORMANCE
ANALYSIS OF ALTERNATIVES – Decision Models, Effectiveness Comparison, Cost/Benefit Review
ANALYSIS OF ALTERNATIVES – Decision Models, Effectiveness Comparison, Cost/Benefit Review
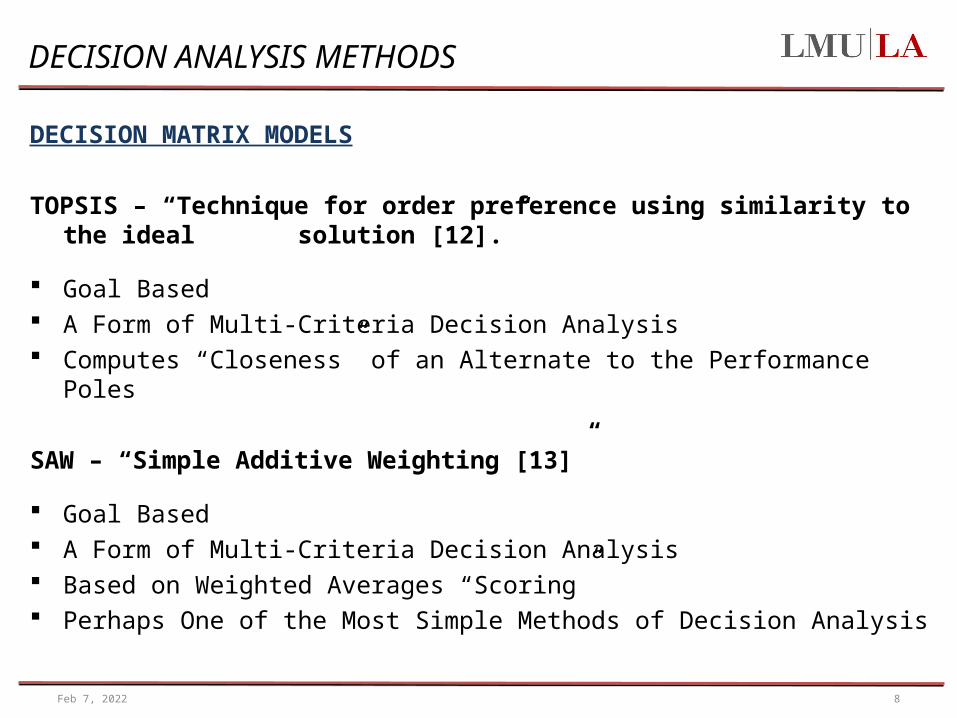
DECISION ANALYSIS METHODS
DECISION MATRIX MODELS
TOPSIS – “Technique for order preference using similarity to the ideal solution [12].”
Goal Based A Form of Multi-Criteria Decision Analysis Computes “Closeness” of an Alternate to the Performance Poles
SAW – “Simple Additive Weighting [13]”
Goal Based A Form of Multi-Criteria Decision Analysis Based on Weighted Averages “Scoring” Perhaps One of the Most Simple Methods of Decision Analysis
Apr 10, 2023 8

DECISION MATRIX MODELS
Apr 10, 2023 9
There are two types of inputs that can be applied to a decision matrix model:
Tangible – “Definite, not vague or illusive” •Cost•Time•Numerical Measures of Performance
Intangible - “Indefinite, vague”•Better Than / Worse Than•Good / Better / Best •Low / Average / High
In order to conduct mathematical analysis on the decision matrix, we must convert the intangibles in the decision matrix to numbers.

DECISION MATRIX MODEL
Apr 10, 2023 10
Time CostCost to
Implement Spent Funds Impact Profit Feasibility
0
10+ Very High Large Increase 1Very
Small/None Large Decrease Definitely No5-10 High Increase 3 Small Decrease Probably No
1-5 Yr Average No Change 5 Average No Change Maybe< 1 Yr Low Decrease 7 Large Increase Probably YesNow Very Low Large Decrease 9 Very Large Large Increase Definitely Yes
10
Intangibles Scale [12]
(Saaty’s Scale of Pairwise Comparisons)

The Food Waste Decision Matrix
Apr 10, 2023 11

Conversion of Decision Matrix to Matrix of Numbers
Apr 10, 2023 12
Normalization & Weighting of the TOPSIS Matrix
Apr 10, 2023 13
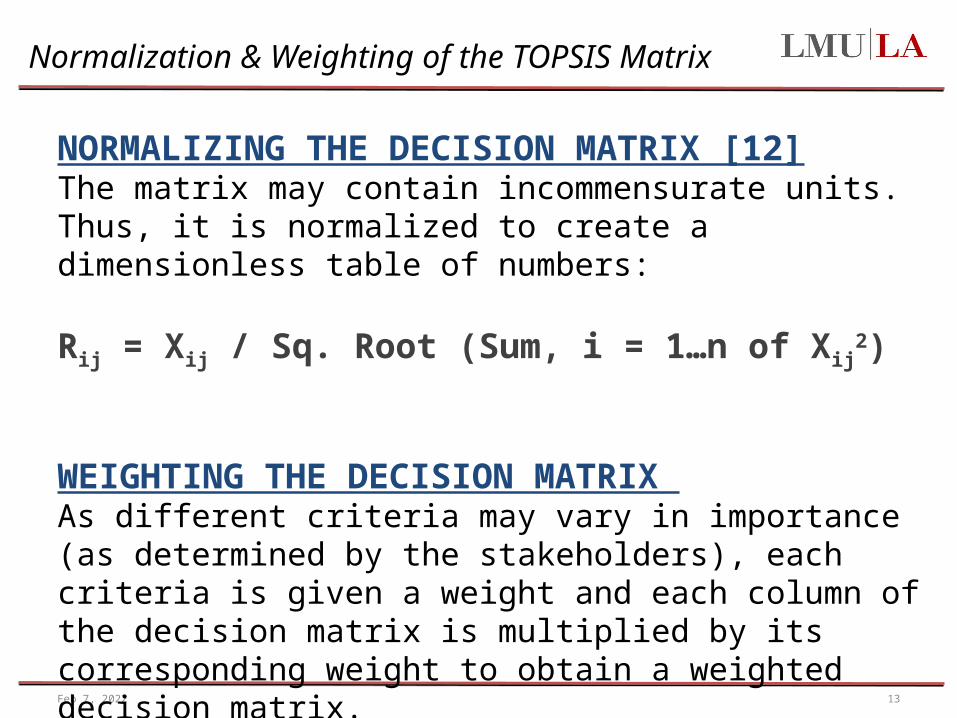
NORMALIZING THE DECISION MATRIX [12]The matrix may contain incommensurate units. Thus, it is normalized to create a dimensionless table of numbers:
Rij = Xij / Sq. Root (Sum, i = 1…n of Xij2)
WEIGHTING THE DECISION MATRIX As different criteria may vary in importance (as determined by the stakeholders), each criteria is given a weight and each column of the decision matrix is multiplied by its corresponding weight to obtain a weighted decision matrix.
The Weighted and Normalized Matrix
Apr 10, 2023 14
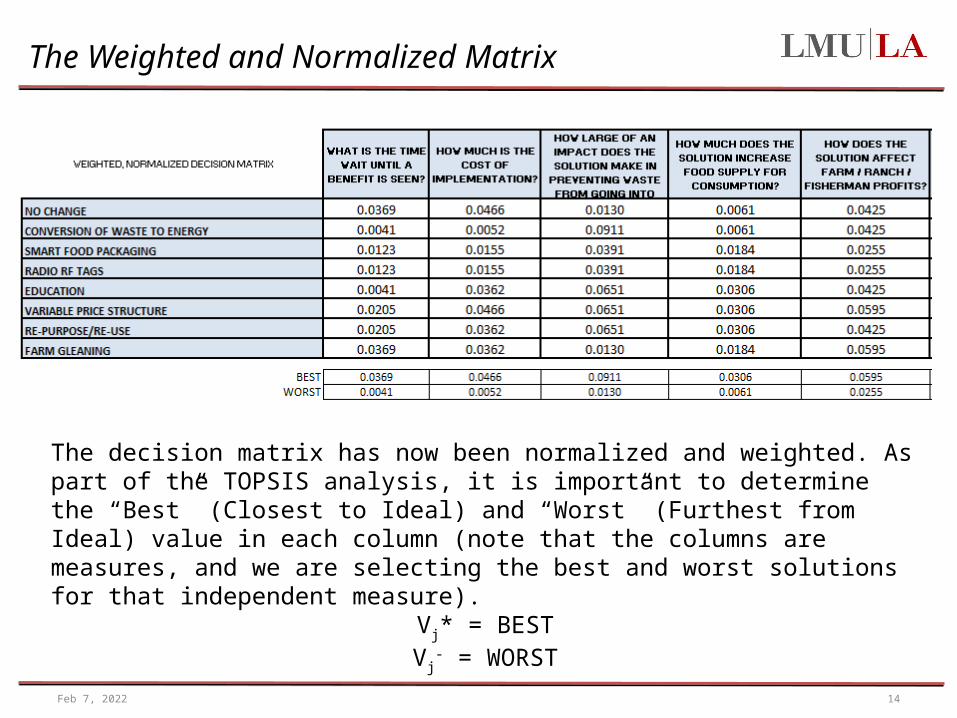
The decision matrix has now been normalized and weighted. As part of the TOPSIS analysis, it is important to determine the “Best” (Closest to Ideal) and “Worst” (Furthest from Ideal) value in each column (note that the columns are measures, and we are selecting the best and worst solutions for that independent measure).
Vj* = BESTVj
- = WORST

TOPSIS ANALYSIS
Apr 10, 2023 15
The next step in TOPSIS analysis is to determine the separation measure from the ideal and negative ideal solutions.
Separation Measure from Ideal Solution [12]: S* = Ideal Sq Root (sum of squares for j = 1….m of (vij-vj*))
Separation Measure from Negative Ideal Solution [12]: S- = Sq Root (sum of squares for j = 1….m of (vij-vj
-))
Once the separation measures are determined, we can calculate the relative closeness to the ideal solution:
Closeness to the Ideal Solution [12] = Si - / (Si * + Si -)
Si*
Si-
Ideal Solution
NegativeIdeal Solution
Examined Alternative
TOPSIS RESULTS
Apr 10, 2023 16
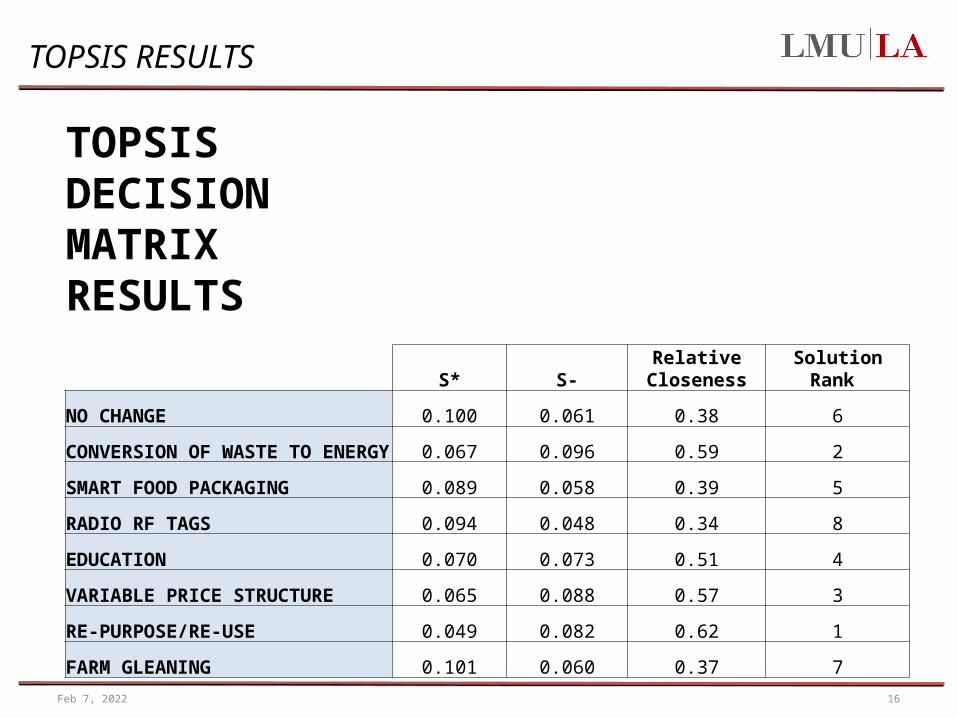
TOPSIS DECISION MATRIX RESULTS
S* S-Relative
Closeness Solution Rank
NO CHANGE 0.100 0.061 0.38 6
CONVERSION OF WASTE TO ENERGY 0.067 0.096 0.59 2
SMART FOOD PACKAGING 0.089 0.058 0.39 5
RADIO RF TAGS 0.094 0.048 0.34 8
EDUCATION 0.070 0.073 0.51 4
VARIABLE PRICE STRUCTURE 0.065 0.088 0.57 3
RE-PURPOSE/RE-USE 0.049 0.082 0.62 1
FARM GLEANING 0.101 0.060 0.37 7
Normalization & Weighting of the SAW Matrix
Apr 10, 2023 17
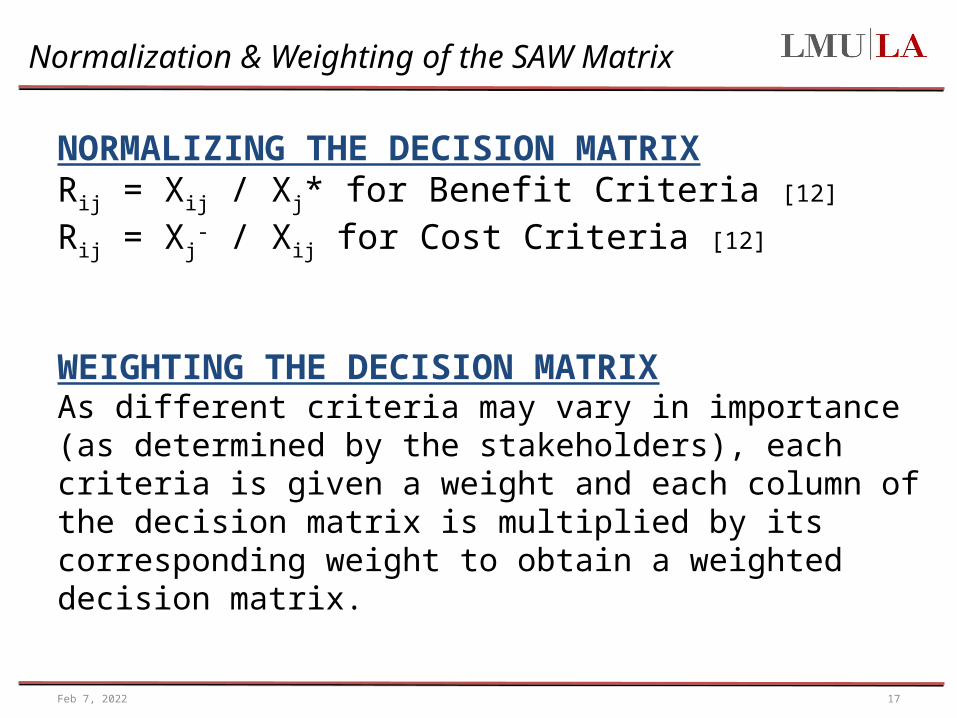
NORMALIZING THE DECISION MATRIXRij = Xij / Xj* for Benefit Criteria [12]
Rij = Xj- / Xij for Cost Criteria [12]
WEIGHTING THE DECISION MATRIXAs different criteria may vary in importance (as determined by the stakeholders), each criteria is given a weight and each column of the decision matrix is multiplied by its corresponding weight to obtain a weighted decision matrix.
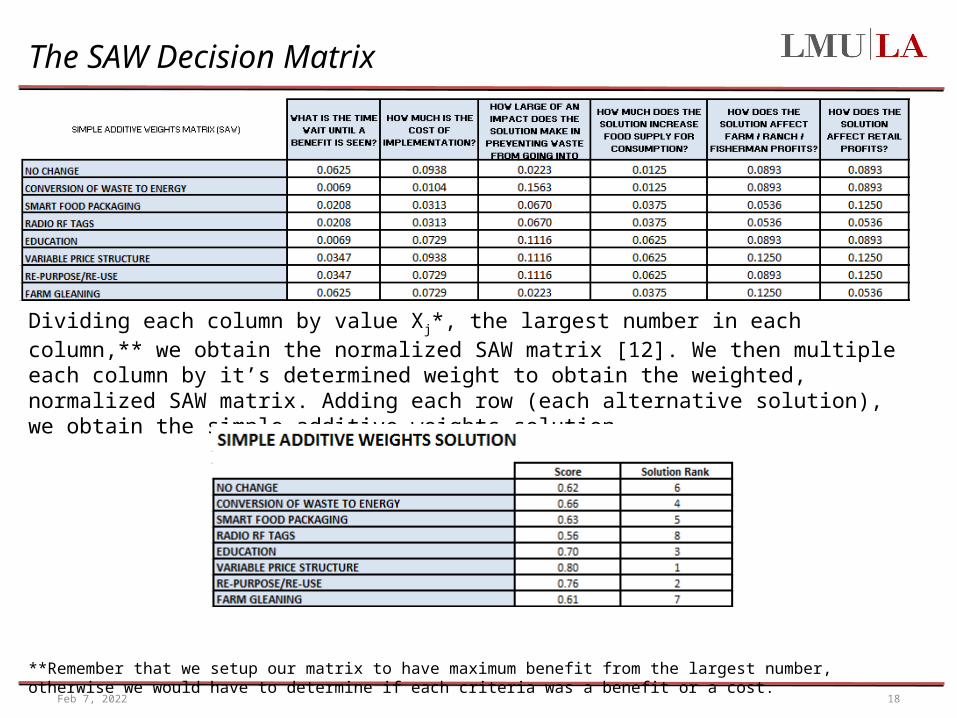
The SAW Decision Matrix
Apr 10, 2023 18
Dividing each column by value Xj*, the largest number in each column,** we obtain the normalized SAW matrix [12]. We then multiple each column by it’s determined weight to obtain the weighted, normalized SAW matrix. Adding each row (each alternative solution), we obtain the simple additive weights solution.
**Remember that we setup our matrix to have maximum benefit from the largest number, otherwise we would have to determine if each criteria was a benefit or a cost.
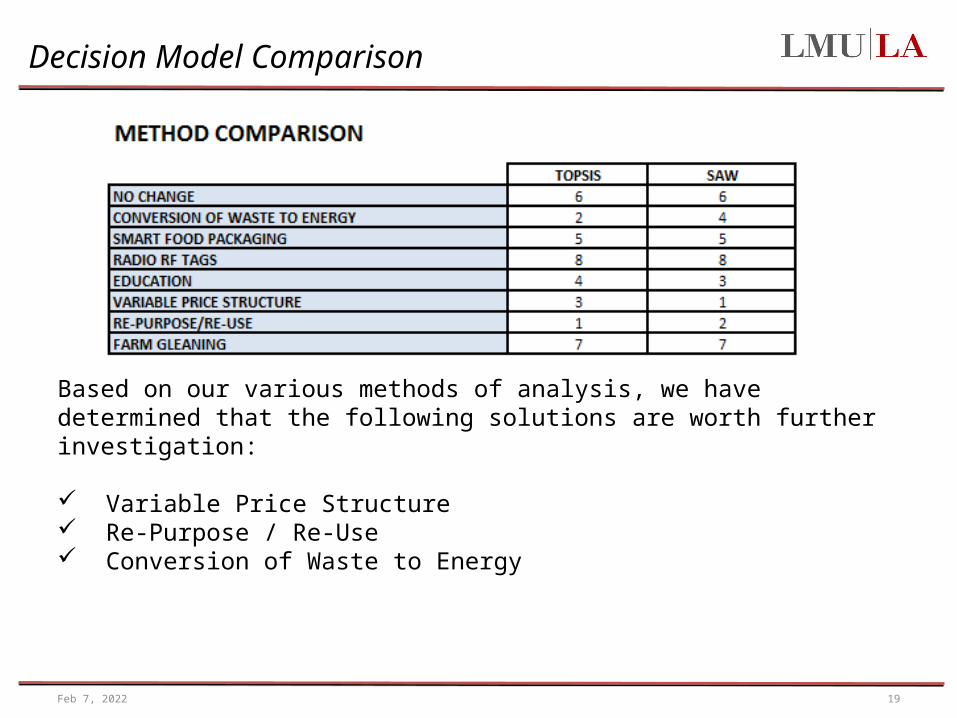
Decision Model Comparison
Apr 10, 2023 19
Based on our various methods of analysis, we have determined that the following solutions are worth further investigation:
Variable Price Structure Re-Purpose / Re-Use Conversion of Waste to Energy
Decision Model Review
Reviewing our model, we decided that our method for weighting each category could be improved. 1.Initial weighting assumed stakeholders were prioritizing criteria. Weight was applied with this assumed priority.
2.We were too heavily weighted toward profit criteria. We decided to divide the weight for profit related columns to combine to share a weight equivalent to that of a single category.
3.We decided to reduce the weight of the green-fuel category as not all stakeholders would consider this a priority.
4.We increased the weight of our main category, reduction of food waste to landfills.
Apr 10, 2023 20
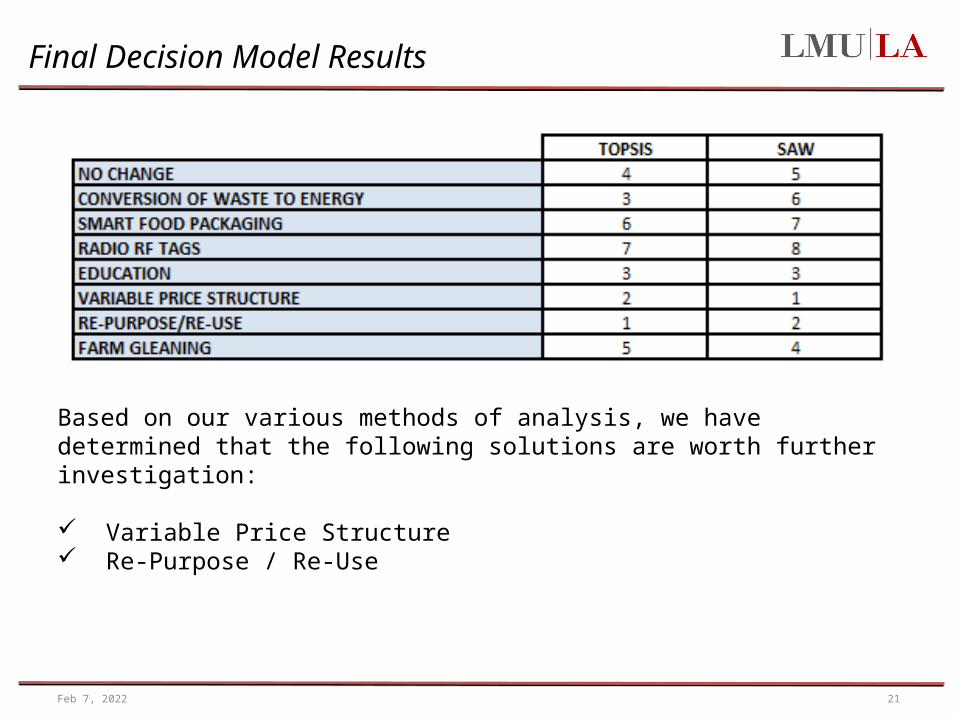
Final Decision Model Results
Apr 10, 2023 21
Based on our various methods of analysis, we have determined that the following solutions are worth further investigation:
Variable Price Structure Re-Purpose / Re-Use
Decision Matrix Model Results
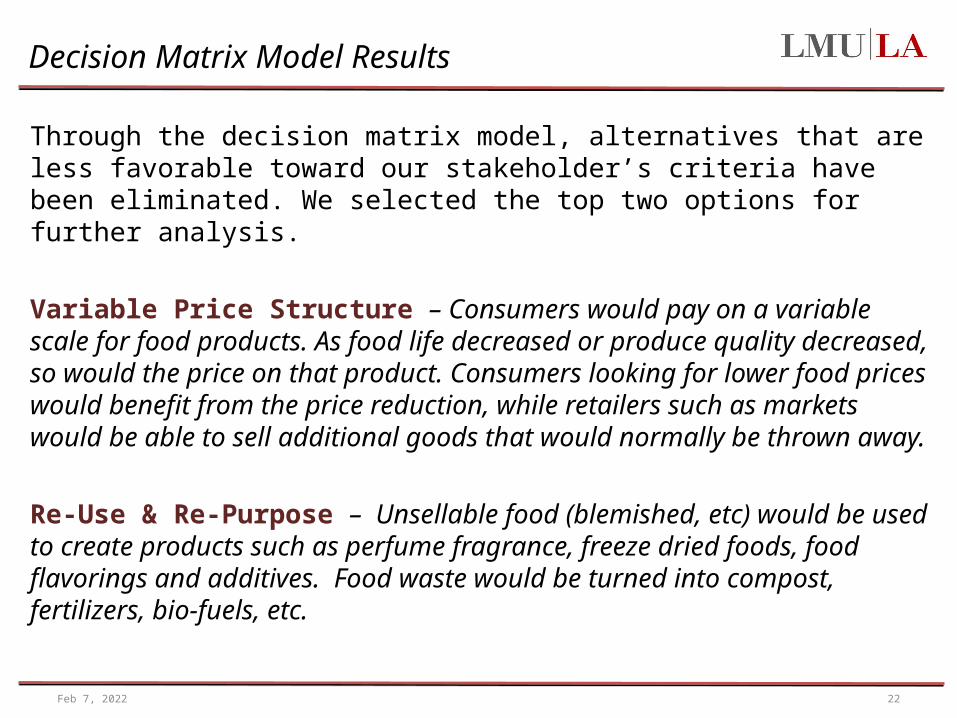
Through the decision matrix model, alternatives that are less favorable toward our stakeholder’s criteria have been eliminated. We selected the top two options for further analysis.
Variable Price Structure – Consumers would pay on a variable scale for food products. As food life decreased or produce quality decreased, so would the price on that product. Consumers looking for lower food prices would benefit from the price reduction, while retailers such as markets would be able to sell additional goods that would normally be thrown away.
Re-Use & Re-Purpose – Unsellable food (blemished, etc) would be used to create products such as perfume fragrance, freeze dried foods, food flavorings and additives. Food waste would be turned into compost, fertilizers, bio-fuels, etc.
Apr 10, 2023 22

Potential Solution – PROS & CONS Review
Apr 10, 2023 23
Variable Price Structure
PROS• Reduces the amount of food going to
landfills.
• Beneficial to both consumers and sellers.
Consumers get a lower price & can save
money. Sellers gain benefit by selling
produce or goods that may normally be
thrown away.
• Helps keep food on the table for those that
may be struggling financially.
• May help people to realize that there is
nothing wrong with slightly discolored or
blemished produce. People will be
educated by the experience.
CONS
• Lowers quality standards for produce and other grocery goods.
• May fail due to social standards. (For example, some consumers may want to hide the fact that they can’t afford the higher quality produce.)
• May result in a profit trade-off for retail stores. They will sell more product, but the profit on the product may be smaller. Can they share the lost with food producers?
Potential Solution – PROS & CONS Review
Apr 10, 2023 24
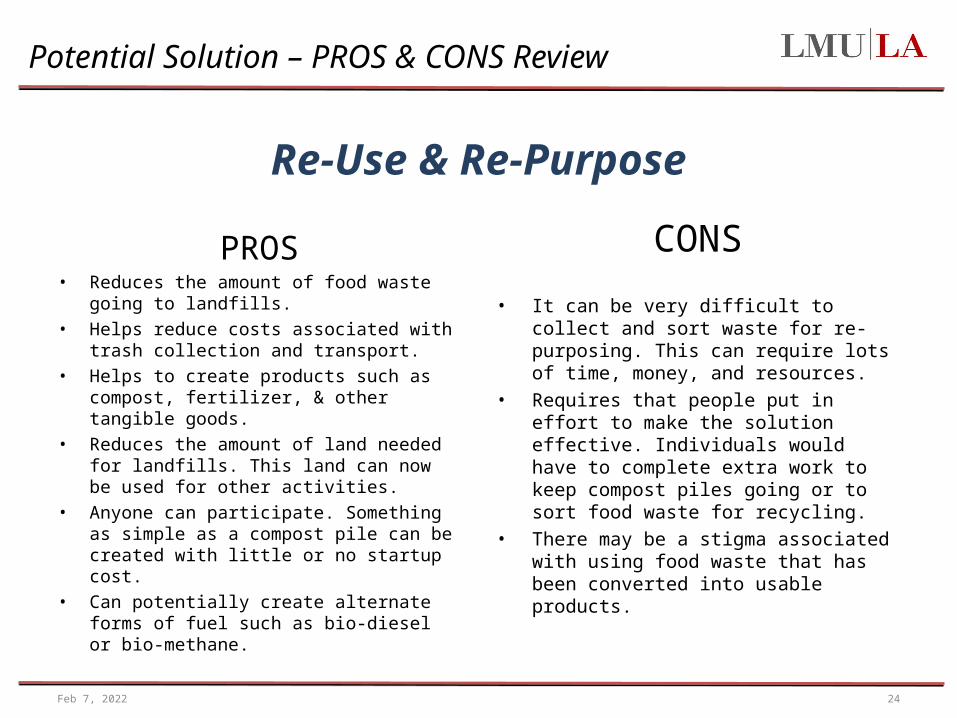
Re-Use & Re-Purpose
PROS• Reduces the amount of food waste going
to landfills. • Helps reduce costs associated with trash
collection and transport. • Helps to create products such as
compost, fertilizer, & other tangible goods.
• Reduces the amount of land needed for landfills. This land can now be used for other activities.
• Anyone can participate. Something as simple as a compost pile can be created with little or no startup cost.
• Can potentially create alternate forms of fuel such as bio-diesel or bio-methane.
CONS
• It can be very difficult to collect and sort waste for re-purposing. This can require lots of time, money, and resources.
• Requires that people put in effort to make the solution effective. Individuals would have to complete extra work to keep compost piles going or to sort food waste for recycling.
• There may be a stigma associated with using food waste that has been converted into usable products.
Effectiveness Analysis (Risk of Not Performing)
Apr 10, 2023 25
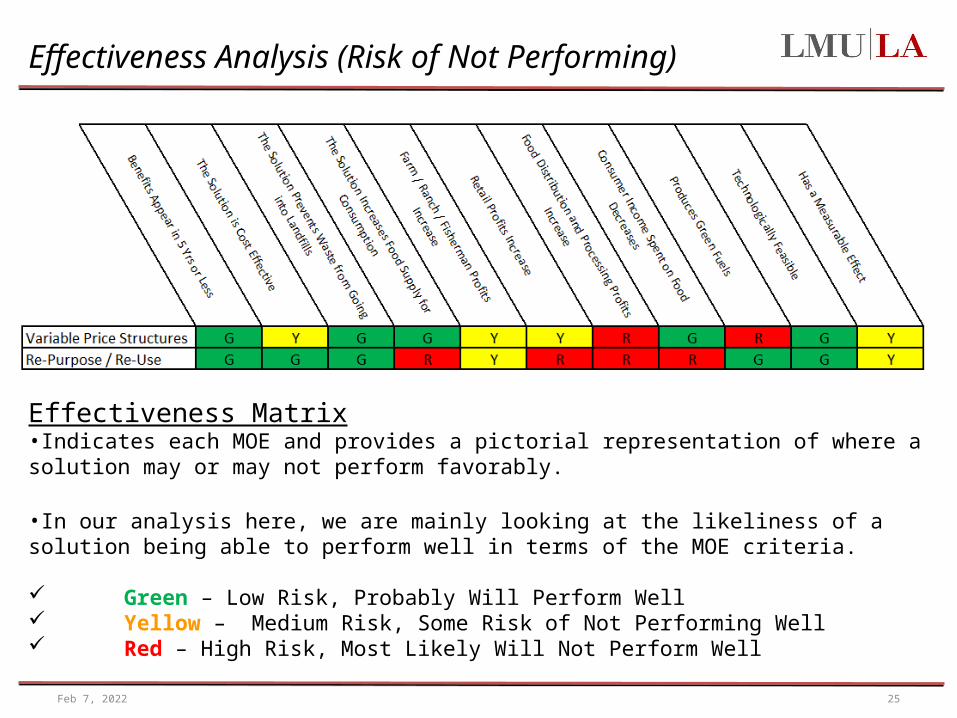
Effectiveness Matrix•Indicates each MOE and provides a pictorial representation of where a solution may or may not perform favorably.
•In our analysis here, we are mainly looking at the likeliness of a solution being able to perform well in terms of the MOE criteria.
Green – Low Risk, Probably Will Perform Well Yellow – Medium Risk, Some Risk of Not Performing Well Red – High Risk, Most Likely Will Not Perform Well

Cost / Benefit Considerations
Variable Price Structure• Complex price structure interactions exist. Food prices are controlled by market
demand. Would variable price structuring cause farmers to allow land to lie fallow or unharvested crops to spoil due to less favorable ROI?
• Will retailers end up losing money from variable price structures? One would have to review the amount of money lost due to throwing away food versus the reduced profits from selling items at low cost (while the same consumer would be currently purchasing the item at full cost).
• What would be the labor required to sort foods by quality? What would be the criteria to apply to the variable price structure? Would there still be undesirable items in each of the “quality level bins?”
Re-Use / Re-Purpose• Implementation can be very low cost or expensive
– Compost Piles (Low Cost)– Bio-Fuel Production (Expensive)
• Current infrastructure makes it difficult to make a profit from food waste. Bio-fuel plants may be expensive to implement. Food has to be collected and sorted to provide fertilizer on a large scale.
• The products of this process have a lot of competition. Would chemical fertilizers be more effective than compost based fertilizers? What would be the cost difference between the two options?
Apr 10, 2023 26

Qualitative Cost/Benefit Review
Apr 10, 2023 27
Case Study Result
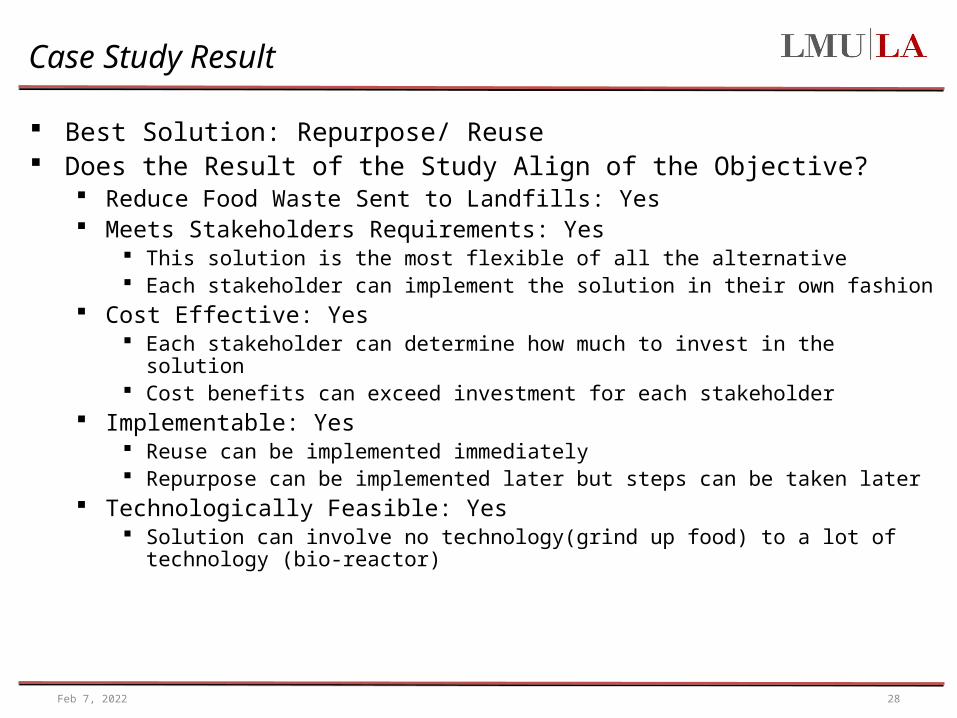
Best Solution: Repurpose/ Reuse Does the Result of the Study Align of the Objective?
Reduce Food Waste Sent to Landfills: Yes Meets Stakeholders Requirements: Yes
This solution is the most flexible of all the alternative Each stakeholder can implement the solution in their own fashion
Cost Effective: Yes Each stakeholder can determine how much to invest in the solution Cost benefits can exceed investment for each stakeholder
Implementable: Yes Reuse can be implemented immediately Repurpose can be implemented later but steps can be taken later
Technologically Feasible: Yes Solution can involve no technology(grind up food) to a lot of technology (bio-
reactor)
Apr 10, 2023 28
Case Study Result
• Solution Mix of Non-technological and Technological – Addresses Issues of Stakeholder Behavior To Reduce Waste
– Addresses Issues of Using Technology In Concert
• Adverse Consequences– Our solution minimizes adverse consequences to stakeholders
– Each stakeholder can determine best solution
– Flexibility Can Minimize Risks
Apr 10, 2023 29
Lessons Learned
Apr 10, 2023 30
• The systems engineer process works– Many parts of the process are recursive. It is important to analyze and
re-analyze. – Plan for risk: Try to identify and quantify all risks. Put prevention and
mitigation plans in place. Monitor risks throughout the process. • Do not define the problem by a solution
– Full understanding of a problem is key – Don’t form an opinion on the solution until the SE process is applied.
This will blind you from potential solutions. • Models can show you how wrong you are in your assumptions
– It can be difficult to obtain good model inputs. Avoiding questionable inputs is important.
– Weighting criteria can be quite challenging• It is important to define stakeholder requirements
– It is critical to understand the stakeholders– Understanding of CONOPS is crucial to system development
• Communication is key– Open discussion and collaboration is required between all parties to
reach a viable solution• There is no one right answer: consider the whole range of options
– Be open to out of the box ideas. They may not be realistic, but they open your eyes to different ways of thinking.
• The ability to measure effects is important
References
[1] Mather, Tina et Al. “Food waste remains persistent problem at farms, grocery stores and restaurants,” californiawatch.org, 31 March 2010. Web. 1 February 2012. http://californiawatch.org/health-and-welfare/food-waste-remains-persistent-problem-farms-grocery-stores-and-restaurants
[2] Daniels, Kim. “Food to Waste”, USC Annenburg, 5 April 2010. Web. 1 February 2012. http://hungerincal.uscannenberg.org/?p=112
[3] Walsh, Dylan. “A War Against Food Waste,” New York Times, 15 September 2011. Web. 1 February 2012. < http://green.blogs.nytimes.com/2011/09/15/a-war-against-food-waste/>
[4] Hall, Kevin et Al. “The progressive Increase of Food Waste in America and Its Environmental Impact,” plosone.org, 25 November 2009, Web. 1 February 2012. <http://www.plosone.org/article/info%3Adoi%2F10.1371%2Fjournal.pone.0007940>
[5] Kaye, Leon. “Swipe card technology introduced for food waste bins,” The Guardian, 26 January 2012, Web. 1 February 2012. <http://www.guardian.co.uk/sustainable-business/south-korea-swipe-card-food-waste?newsfeed=true>
[6] Mather, Tina. “How the Top 5 Supermarkets Waste Food,” alternet.org, 18 April 2010, Web 1 February 2012. <http://www.alternet.org/investigations/146487/how_the_top_5_supermarkets_waste_food?page=entire>
[7] Martin, Andrew. “One Country’s Table Scraps, Another Country’s Meal”, The New York Times, 18 May 2008, Web. 1 February 2012 <http://www.nytimes.com/2008/05/18/weekinreview/18martin.html?scp=1&sq=One%20Country%92s%20Table%20Scraps,%20Another%20Country%92s%20Meal&st=cse>
[8] Ruitenberg, Rudy. “Food Waste Denounced as Almost 1 Billion People Go Hungry”, Bloomberg Businessweek, 23 January 2012, Web. 1 February 2012<http://www.businessweek.com/news/2012-01-23/food-waste-denounced-as-almost-1-billion-people-go-hungry.html>
[9] Katsman, Hannah. “Three Reasons we Throw Away Food,” cookingmanager.com, 3 January 2010. Web. 1 February 2012.< http://www.cookingmanager.com/reasons-for-throwing-away-food/>
Apr 10, 2023 31
References
[10] Various. “The Incose Systems Engineering Handbook”,Incose , Incose Working Group, 2012
[11] Roedler, Garry et Al. “Technical Measurement,” Incose.org, 27 Dec. 2005. Web. March 11, 2012.
http://www.incose.org/ProductsPubs/pdf/TechMeasurementGuide_2005-1227.pdf
[12] Kanda, Arun. “Lecture Series on Project and Production Management,” Indian Institute of Technology
[13] Afshari et Al. “Simple Additive Weighting approach to Personnel Selection Problem.” International Journal of Innovation, Management and Technology, Vol. 1, No. 5, December 2010. Web April 14, 2012
www.ijimt.org/papers/89-M474.pdf
[14] Ullman, Dr. David G. “Decisions Based on Analysis of Alternatives.” January 2009. Web. April 29, 2012.
www.robustdecisions.com/AOA.pdf
Apr 10, 2023 32
Any Questions?
Apr 10, 2023 33