food in scotland consumer tracking survey online quantitative survey was undertaken by tns, an...
TRANSCRIPT

©TNS 2016 JN 131354
Controlled document - Issue 5
TNS
BMR
B
Controlled document - Issue 4
Food in Scotland Consumer Tracking Survey SUMMARY REPORT - Wave 1 December 2015


i
Contents
1. Executive Summary ......................................................................... 1
2. Background and objectives .............................................................. 4
3. Method and Sample......................................................................... 5
4. Protecting other interests of consumers in relation to food ............... 8
5. Food is safe ................................................................................... 10
6. Food is authentic ........................................................................... 20
7. Consumers have healthier diets .................................................... 23
8. Responsible food businesses flourish ............................................ 26
9. FSS is a trusted organisation ......................................................... 29


1 © TNS 2016
1. Executive Summary
The results from the first wave of Food Standards Scotland
(FSS)’s Food in Scotland Consumer Tracking Survey will
act as a benchmark in measuring Scotland’s attitudes,
behaviours and knowledge in relation to food. The survey
will be undertaken biannually and will consist of a set of
consistent questions at each wave, with modules focusing on
food safety and authenticity, and diet and nutrition running
annually.
The survey was undertaken by TNS on FSS’s behalf amongst a representative
sample of adults in Scotland (online self-completion survey of 1,003 people aged
16+ between 8 and 15 December 2015).
Food Standards Scotland has six strategic outcomes it is working towards delivering:
1. Food is safe
2. Food is authentic
3 Consumers have healthier diets
4. Responsible food businesses flourish
5. FSS is a trusted organisation
6. FSS is efficient and effective
This survey includes measures relating to the first five strategic outcomes (with the
sixth being covered by the Civil Service People Survey, amongst other measures).
The survey was developed and designed to explore the interests of consumers in
Scotland in relation to food in order for FSS to put those interests at the heart of the
work it does.
1.1 Strategic Outcome – Food is safe
Consistent hand washing is the norm but there is scope for improvement on
this - 76% wash hands after handling raw meat poultry or fish, and 51% wash
fruit or veg to be eaten raw.
Less than half (46%) use a thermometer to accurately check fridge
temperature.
Around half follow each of these recommended practices to avoid cross-
contamination: 60% use the bottom shelf of fridge to store raw meat/poultry,
45% never wash raw chicken or poultry (FSS advice is not to wash raw
chicken or poultry as this splashes bacteria around) and 51% always use

© TNS 2016 2
different chopping boards for different foods/wash when switching between
foods.
Recommended cooking practices are more widely followed, but still only half
of consumers (50%) check that reheated food is hot in the middle and only
37% know what Campylobacter – the bacteria which causes the biggest
number of food poisoning cases in Scotland each year - is.
1.2 Strategic Outcome – Food is authentic
There is some desire to find out more about where food comes from, driven
by concern about authenticity. 79% are concerned about food not being what
the label says it is, and 55% agree that they would like to know more about
where the food they eat comes from.
Labels are widely referred to when both shopping and at home, primarily for
date information (95% ever look at food labels when shopping).
There is good awareness of what the label information refers to but it is not
necessarily displayed in a way that is understandable – only 52% agree that
information on food labels is clear and understandable.
Use by dates are moderately well understood and referred to as the best
indicator of food safety (69%).
1.3 Strategic Outcome – Consumers have healthier diets
While many are fairly comfortable with how healthy their and their family’s diet
is, there is also a significant degree of uncertainty, with only 53% thinking that
the kinds of meals and snack foods they and their family eat and drink are
very or quite healthy.
Though most feel they have clear information about eating healthily, there is a
significant level (69%) of perceived expert contradiction over which foods are
good or bad for you, resulting in confusion amongst over a third (35%) as to
what’s supposed to be healthy and what isn’t.
A significant proportion recognise Scotland’s obesity problem, and are
concerned about what is in food. 74% agree that there are too many people
who eat unhealthily in Scotland, and over 80% are concerned about the
amount of sugar, salt, fat and/or saturated fat in food.
Links between health and diet are, however, well-established, with 85%
agreeing they know that an unhealthy diet can cause lots of health problems,
like cancer and heart disease.

3 © TNS 2016
1.4 Strategic Outcome – Responsible food businesses flourish
There is widespread concern about food hygiene when eating out, and a
desire for establishments to pay more attention to this, with 75% agreeing that
restaurants, cafes, takeaways and catering establishments should pay more
attention to food safety and hygiene. 78% are concerned about ‘food hygiene
when eating out’.
However, price is the key factor when deciding to eat out, and consumers
primarily judge hygiene standards of places they eat out at by appearance of
the staff and premises (78%).
A quarter of people in Scotland (25%) worry about getting food poisoning
when eating out.
1.5 Strategic Outcome – FSS is a trusted organisation
The survey was undertaken eight months after FSS was set up on 1 April
2015. FSS has achieved a good level of brand recognition (44%) in that short
time, and a widespread degree of trust, with 70% of those aware of FSS
trusting the organisation to do its job.
FSS performs best in those areas where consumers most expect it to be
operating, with 49% of those aware of FSS rating the organisation as
excellent or very good at ensuring that food in Scotland is safe to eat.
However there is less knowledge of FSS’s role in diet and nutrition, with just
under half (49%) being aware that FSS is responsible for promoting and
enabling healthy eating.

© TNS 2016 4
2. Background and objectives
2.1 Background
Food Standards Scotland (FSS) is the new public sector
food body for Scotland. FSS became independent from the
UK Food Standards Agency on 1 April 2015. FSS was
established by the Food (Scotland) Act 2015 as a non-
ministerial office, part of the Scottish Administration,
alongside, but separate from, the Scottish Government.
FSS’s vision is “to create a food and drink environment in Scotland that benefits,
protects and is trusted by consumers.”
FSS’s three statutory objectives are to:
a) Protect the public from risks to health which may arise in connection with the
consumption of food;
b) Improve the extent to which members of the public have diets which are
conducive to good health; and
c) Protect the other interests of consumers in relation to food.
2.2 Study objectives
An online quantitative survey was undertaken by TNS, an independent research
company, in December 2015. The main purpose of the research was to obtain
current information on consumer attitudes, knowledge and reported behaviours in
Scotland across a range of food safety and nutrition issues.
This report summarises the findings in relation to the following FSS strategic
outcomes:
1. Food is safe
2. Food is authentic
3. Consumers have healthier diets
4. Responsible food businesses flourish
5. FSS is a trusted organisation
FSS intends to use the findings from the 2015 survey as a benchmark against which
changes in food safety and healthy eating knowledge, attitudes, behaviours can be
monitored over time. Questions about food safety and authenticity and healthy
eating will alternate between surveys, with a core set of questions being retained at
each wave.

5 © TNS 2016
3. Method and Sample
To ensure that the views and behaviours of the public in
Scotland towards food safety and authenticity and
healthy eating were accurately captured, FSS
commissioned a large-scale quantitative survey among
a representative sample of adults, aged 16+ in Scotland.
This data was collected using an online self-completion
questionnaire. The sample was drawn using a dual panel approach. These panels
operate to the highest standards of panel member recruitment, maintenance and
quality checks, to ensure that robust data is collected.
The target of 1000 completed questionnaires was achieved during the period 8 – 15
December 2015. The survey length was 30-40 minutes, and although long was
described by 45% as very enjoyable and 91% rated the questions easy to
understand.
Quotas were applied in order to provide a survey sample that was representative of
the adult population in Scotland in terms of gender, age, socio-economic status and
region. Additionally, to ensure that the achieved sample exactly matched the
population on these key variables, a weighting1 matrix was applied to the total
sample results.2
The achieved and weighted sample profiles are shown in Table 3.1
1 Weighting is the process by which data are adjusted to reflect the known population profile. Through weighting
specified profiles are adjusted to match targets and through the use of a number of targets each respondent is assigned a weight within the sample that represents the extent to which their answers are adjusted. 2 The weighting is based on population estimates from the BARB (Broadcasters’ Audience Research Board)
Establishment Report 2011, ONS (Office of National Statistics) Mid-year population estimates 2011 and the 2001 Census

© TNS 2016 6
Table 3.1: Survey profile: achieved and weighted Base: All respondents (1003)
An overview of the survey sample is shown in Figure 3.1, illustrating the range of the
adult population surveyed. Figure 3.1 Sample profile Base: All respondents (1003)
Gender Age
30
34
36
16-34 35-54 55+
SEG
21
29
20
30
AB
C1
C2
DE
48%
Male
52%
Female
Working status
5247
1
Working Not working
Location
North 24%Central 70%South 6%
%
%
%
Household composition
21% with children/pregnant
23% in 1 person 42% 2 people
35% 3+ people
Base:1003 Target %
Achieved %
Weighted %
Gender Male 48 49 48
Female 52 51 52
Age 16-34 30 19 30
35-44 16 17 16
45-54 18 21 18
55-64 15 18 15
65+ 21 25 21
SEG AB 21 27 22
C1 29 32 28
C2 20 16 20
DE 30 24 30

7 © TNS 2016
The scale and scope of the survey also allowed for a number of questions to be
included which are also usable as analysis variables. Though this report focusses
on the findings among the total Scotland sample, the data tables provide a wealth of
information for further analysis by a number of variables in addition to standard
demographics. Some examples of the analysis variables available are shown in
Figure 3.2.
Figure 3.2 Analysis variable Base: All respondents (1003)
A copy of the questionnaire can be found here:
http://www.foodstandards.gov.scot/food-scotland-survey
The full results for each question are available here:
http://www.foodstandards.gov.scot/food-scotland-data-tabulations

© TNS 2016 8
4. Protecting other interests of consumers in relation to food
Given that Food Standards Scotland has a wide remit, it is
important to understand what issues in relation to these areas
are of greatest concern to the general public. Two questions
were asked early in the survey to establish this.
Firstly, survey respondents were presented with a list of
issues relating to food and were asked which of the issues
concerned them and which did not. Given the large number of
issues, the question was asked in an engaging way, asking respondents to ‘sort’ the
issues into two groups, where they moved the issues on screen into boxes indicating
whether they were concerned by the issue or not. The proportion concerned with
each issue is shown in Figure 4.1 below.
Figure 4.1 Food issues causing concern - % concerned by each issue (prompted) Base: All respondents (1003)
As shown in Figure 4.1, the public are concerned about a wide variety of food related
issues, from hygiene to production and authenticity. Although food poisoning is a
concern for many (79%), it is interesting to note the difference in the proportion
concerned about food hygiene when eating out (78%) compared to food hygiene at
home (36%), suggesting many consider eating out to be the bigger risk. Similarly,
although there is a high degree of concern about food not being what the label says
it is (79%) there is significantly less concern about date labels etc. (43%).
Respondents were also presented with four specific issues and asked which one
they were most concerned about. The results of this question are shown in Figure
4.2.

9 © TNS 2016
Figure 4.2 Most concerning food issue (prompted) Base: All respondents (1003)
When prompted, three in ten people were most concerned about making sure they
and their family have a healthy diet, and the same proportion were most concerned
about coming ill through eating unsafe food. The cost of eating healthily was of least
concern overall, but was still most important to 16% of the population.

© TNS 2016 10
By this FSS means that food is produced in line with relevant legislation, and that food
placed on the market is not contaminated or injurious to health. Where appropriate, food
is supplied with accurate instructions to ensure safe storage and handling, and
consumers understand the risks and how to protect themselves and others from
foodborne illness.
5. Food is safe
Consistent hand washing is the norm but scope for
improvement on this - 76% wash hands after handling
raw meat poultry or fish, and 51% wash fruit or veg to
be eaten raw.
Less than half (46%) use a thermometer to accurately
check fridge temperature.
Around half follow each of these recommended
practices to avoid cross-contamination: 60% use the
bottom shelf of fridge to store raw meat/poultry, 45% never
wash raw chicken or poultry (the advice is not to wash raw chicken or poultry
as this splashes bacteria around) and 51% always use different chopping
boards for different foods/wash when switching between foods.
Recommended cooking practices are more widely followed, but still only half
of consumers (50%) check that reheated food is hot in the middle and only
37% know what Campylobacter – the bacteria which causes the biggest
number of food poisoning cases in Scotland each year - is.
This chapter of the report outlines findings on the extent to which ‘safe’ behaviours
are currently being followed, and looks at the overall proportion of the sample
population complying with recommended practice around the 4 Cs i.e. – chilling,
cooking, cross-contamination and cleaning.
All of the results in this chapter are based on the 95% of the sample who indicated
that they had some responsibility for cooking and preparing food in their household.
5.1 Cleaning
In the context of food safety there are three behaviours associated with cleaning. In
order to comply with recommended practice guidelines, each of these should always
be carried out when preparing or cooking food. Figure 5.1 shows the total proportion
claiming that they always do each of these.

11 © TNS 2016
Figure. 5.1: Extent to which recommended cleaning behaviours are followed (Q19) Base: all respondents involved in preparing/cooking food (956)
A large majority of around three-quarters (76%) indicated that they always wash their
hands after handling raw meat, poultry or fish, and a similar proportion (73%)
claimed to always do so before cooking. By comparison far fewer are consistently
washing fruit and veg which will be eaten raw – only around half the sample
indicated that they do this (51%). So, while most are following recommended
practice on washing their hands there is still room for significant improvement on
washing fruit and veg that is to be eaten raw.
5.2 Chilling
There are four recommended guidelines for chilling food:
Knowing correct fridge temperature
Checking fridge temperature accurately
Defrosting meat/fish in fridge (or cool place)
Eating opened packet of cooked/cured foods within 2 days.
The most positive response across these is for awareness of the correct temperature
of a fridge. To keep the survey engaging, respondents were presented with an
image of a thermometer on which they could select what they thought the
temperature of their fridge should be. 86% of those responsible for food
preparation/cooking correctly identified the answer as between 0 and 5 degrees
centigrade. However, as shown in Figure 5.2, among those consumers who check
their fridge temperature (some 81%) there is much less familiarity with accurate
methods of checking that the fridge temperature is correct.

© TNS 2016 12
Figure 5.2. Normal method to check temperature in fridge – prompted (Q22) Base: all respondents involved in preparing/cooking food and who check their fridge temperature (779)
The two recommended ways of reliably checking the fridge temperature are putting a
thermometer in the fridge & checking the temperature and, checking the in-built
fridge display/thermometer. In total slightly over half of those checking their fridge
temperature (56%) indicated that they correctly follow at least one of these practices.
However significant proportions also use other ways, most commonly checking the
fridge/gauge settings (41%), as well as feeling the food to see if it is cold (24%) and
looking for ice (20%).
Overall therefore, while many know what temperature their fridge should be set at,
far fewer are reliably checking whether or not their fridge is working at this
temperature.
With respect to defrosting meat or fish in the appropriate manner, 50% of the sample
indicated that they follow the recommended practice and either defrost meat or fish
in the fridge (38%) or in a cool place (12%). Most of the remainder (37% overall)
indicated that they allow the food to defrost at room temperature, with much smaller
minorities stating they defrost these foods in the microwave (5%) or in water (4%).
Compliance with the fourth ‘chilling’ behaviour was determined by asking for the
length of time an open packet of cooked/cured ham would be left open before
deciding not to eat it. The results of this question are shown in Figure 6.3.

13 © TNS 2016
Figure 5.3 Length of time would keep opened packet of cooked/cured ham before deciding not to eat it (Q32)Base: all respondents involved in preparing/cooking food (956)
The responses to this question are very varied. Those giving the recommended
response ‘within two days’ comprise around a fifth of the sample, with a similar
proportion claiming they would follow guidance on the packaging or refer to the use
by date. However in total around half (49%) indicated that they would choose to eat
the product beyond the two day limit, including 13% who would leave it at least 5
days. The remaining small percentage (7%) did not offer a response to the question,
stating that they do not eat this type of food product.
5.3 Cross-contamination
The survey assessed compliance with seven specific behaviours associated with
avoidance of cross-contamination, as follows.
Don’t Do
Don’t store open tins in the fridge Raw meat/poultry should be stored
in fridge in sealed container
Don’t wash raw chicken/poultry Raw meat/poultry should be stored on
bottom shelf of fridge
Don’t wash raw meat Use different chopping boards for different foods or wash chopping
boards when switching between foods
Don’t wash raw fish or seafood
21
13
9
27
9
9
4
7
Within two days
Follow storage information on the product
Would refer to use by date
Up to 3 days
Up to 4 days
Up to 5 days
More than 5 days
Never eat this product
%

© TNS 2016 14
Compliance levels varied slightly for the behaviours that FSS recommends people
do not undertake – the don’ts. The recommended practice that most claimed to
comply with is ‘never storing open tins in the fridge’, which 61% said they never do.
By comparison the proportion following the guidelines to not wash chicken or poultry
is significantly lower, with 45% indicating that they never do this, and even lower at
26% for not washing raw fish or seafood. However when this figure is re-calculated
to exclude the significant proportion that does not eat raw fish/seafood compliance
rises to 34%. The proportion claiming to never wash other meat was recorded
between these two levels, at 51%.
There was a similar spread of compliance levels for the behaviours that consumers
are encouraged to do. Using the bottom shelf of the fridge to store raw meat/poultry
is the practice most likely to be adhered to, with 60% claiming that they always do
this, whereas a significantly lower proportion claimed that they always store raw
meat/poultry in a covered container (40%).
Around half the sample claimed that they always use different chopping boards for
different foods, or wash chopping boards when switching between foods. Most of
the remaining sample (35%) claimed to do this most or some of the time, but there
was a significant minority of 11% who stated that they never complied with this
particular recommended behaviour.
Awareness of the reasons for washing chopping boards when using these to prepare
different types of food is at a fairly good level, with most (79%) spontaneously citing
some comment, which suggests they understand the risks of spreading bacteria and
cross contamination. Figure 5.4 shows the main reasons given when asked ‘why do
you think you should wash chopping boards when using them to prepare different
types of food?’

15 © TNS 2016
Figure 5.4 Reasons for washing chopping boards when preparing different types of food (spontaneous open-ended question) Base: all responsible involved in preparing/cooking food (956)
5.4 Cooking
The responses to six different measures were examined to gauge compliance with
recommended cooking practice. These included the following:
Table 5.1 Cooking behaviour
Four of the cooking guidelines relate to the methods used to determine whether or
not food has been cooked safely. The first of these, cooking food until it is steaming
hot throughout, is always adhered to by around three-quarters of the sample (74%).
Similar proportions agreed that they never eat burgers/sausages if pink/with pink or
red juice (72%), and never eat pork if pink/with pink or red juice (72%). An even
higher proportion indicated that they never eat poultry if pink/with pink or red juice
(83%).
Always cook food until it is steaming hot throughout
Never eat chicken or turkey if the meat is pink or has pink or red juices
Never eat burgers or sausages if the meat is pink or has pink or red juices
Never eat whole cuts of pork or pork chops if the meat is pink or has pink or red
juices
Reheat cooked food (only once)
When reheating, check food is cooked all the way through (by checking the middle
is hot)

© TNS 2016 16
In terms of reheating food, the safety advice to ‘reheat cooked food only once’ is
widely adhered to. Just over three-quarters (78%) claimed that they would consider
reheating cooked food a maximum of once, with a further 11% stating that they
would not do this at all. Only 9% of the sample would not follow the recommendation
and would reheat twice or more.
However the level of compliance with safe cooking practices is considerably lower
with respect to the method used to check that food has been reheated properly. On
this measure only 50% selected the correct response – check the middle is hot. The
full results given in response to the question ‘how do you usually tell that food has
been reheated properly?’ by those who would consider reheating cooked food are
shown in Figure 5.5.
Figure 5.5 Methods used to check food is reheated properly - prompted (Q34) Base: all respondents involved in preparing/cooking food and who would consider reheating food (888)
In addition to checking the middle of the food is hot, a variety of other methods are
used to ensure reheated food is properly cooked. For example, small minorities
indicated that they use a thermometer/ probe (13%) or set a cooking time period
(12%). More commonly though food is checked by ‘looking hot/sizzling/bubbling’
(36%) and having ‘an even temperature throughout’ (31%). Checking reheated food
is hot throughout therefore has the lowest level of compliance of the six
recommended safe cooking behaviours.

17 © TNS 2016
“C” Recommended Practice %
Wash hands before starting to cook or prepare food 73% Always
Wash hands immediately after handling raw meat, poultry or fish 76% Always
Wash raw fish or seafood 24% Always (25% n/a)
Wash fruit or veg (inc. salad) which are going to be eaten raw 51% Always
Temperature inside fridge should be between 0 and 5C 86%
Meat usually defrosted in fridge (or in a cool place other than fridge) 50%
Check fridge temperature using thermometer or built in thermometer 46%
Would keep an open packet of cooked/cured ham for up to 2 days before deciding not to eat it
22%
Raw meat / poultry in fridge should be stored in a covered container 40%
Raw meat poultry should be stored at bottom of fridge 60%
Use different chopping boards for different foods or wash chopping boards when switching between foods
51% Always
Wash raw chicken or poultry 45% Never
Wash raw meat other than chicken / poultry 51% Never
Store open tins in the fridge 61% Never
Cook food until it is steaming hot throughout 74% Always
Reheat cooked food no more than once 78% Once (11% never)
When reheating check food is cooked all the way through 50% (check middle is hot)
Eat chicken or turkey if the meat is pink or has pink or red juices 83% Never
Eat burgers or sausages if the meat is pink or has pink or red juices 72% Never
Eat whole cuts of pork or pork chops if the meat is pink or has pink or red juices
72% Never
5.4.1 Awareness of Campylobacter
Awareness of Campylobacter was a further measure used to assess knowledge of
good cooking practice. Campylobacter is the most common form of foodborne
illness (in Scotland, UK and most of the developed world). The illness normally lasts
for around a week, but can also cause more serious illness post- infection and at
worst it can kill3. It is an infection that is passed from animals to humans, and is
particularly prevalent in raw chicken.
When asked whether or not they had heard of Campylobacter, just over a third of the
sample (37%) indicated that they had.
5.4.2 Overall compliance with the 4 Cs
Across all 20 recommended food behaviours there is a huge variation in compliance
levels; from 90% for not reheating cooked food more than once to 22% for eating an
open pack of cooked ham within 2 days. The extent to which each behaviour is
complied with, from best level to worst, is highlighted in Figure 5.6.
Figure 5.6. Proportion undertaking ‘4Cs’ behaviours Base: all responsible for preparing and cooking food in the home
3 See more at: http://www.foodstandards.gov.scot/food-safety-standards/foodborne-illness/campylobacter#sthash.WUP4tJtc.dpuf

© TNS 2016 18
On average 11.7 of these 20 behaviours are observed. No one carries out all 20 and
5% do 5 or less. More commonly (for 57%) 11-15 behaviours are followed, and a
small minority, of 5%, claimed to do 17 – 18.
The average number of observed behaviours within each of the 4Cs ranges from 2
out of 3 for Cleaning to slightly over 4 out of 6 for Cooking. Overall, recommended
practices appear to be moderately well adhered to, but some are observed by only a
minority. This is despite 92%4 agreeing that they have clear information on how to
prepare and cook food safely and hygienically.
5.5 Changes in food safety behaviours
Respondents were presented with four food safety behaviours and asked whether
they had undertaken each behaviour more or less in the last 6 months. The results
of this question are shown in Figure 5.7.
Figure 5.7 Changes in food safety behaviours in the past 6 months Base: all respondents (1003)
At least two thirds claim not to have changed how often they do each of the four food
safety behaviours. 16% claim to have eaten leftover food more, and are doing so to
avoid waste and to save money. The same proportion – 16% - have eaten leftover
food less, and the main reason given for doing so was food safety. Food safety was
also the main reason given for the 23% who have kept leftovers for longer less, 18%
4 See results for Q19
Whether done more or less of each in last 6 months
(Q75)
%Eaten leftover
foodKept leftovers
for longerEaten food past its use by date
Eaten food past its best before
date
No change 67 68 75 75
Done more
16 8 6 8
Done less
16 23 18 17

19 © TNS 2016
who have eaten food past its use by date less and 17% who have eaten food past
its best before date less.
5.6 Sources of information about food safety
As shown in Figure 5.8, when prompted with a list of possible sources of information,
the main source of information about food hygiene, and how to prepare and cook
food safely at home is the internet, which was mentioned in some way by three fifths
(63%), with almost half claiming they would use an internet search engine (46%).
Three in ten (30%) also indicated on prompting that they would use the FSS website.
Figure 5.8 Sources of information about food hygiene, and how to prepare and cook food safely at home Base: all respondents (1003)
In addition to going online, the second most common source of information is
product packaging (37%), followed by cookery books (23%) and friends and family
(20%).

© TNS 2016 20
By this FSS means that food is of the nature, substance and quality as described
by the supplier. This includes its:
• Nature - the foodstuff is from the specified plant, animal or geographical
location described;
• Substance - the ingredients of the food are as described and in the appropriate
quantities;
• Quality - the food meets the requirements of any quality marketing standard
which has been applied, and that the product’s specific qualities have not
deteriorated.
6. Food is authentic
There is some desire to find out more about where food
comes from, driven by concern about authenticity. 79%
are concerned about ‘food not being what the label
says it is, and 55% agree that “I’d like to know more
about where the food I eat comes from”.
Labels are widely referred to when both shopping and
at home, primarily for date information (95% ever look
at food labels when shopping).
There is good awareness of what the label information
refers to but it is not necessarily displayed in a way that is understandable – only
52% agree “information on food labels is clear and understandable”.
Use by dates are moderately well-recognised and referred to as the best
indicator of food safety (69%).
This chapter of the report focuses on a number of attitudinal statements relating to
food sources and food labelling as well as reporting on the extent to which
consumers use and understand the purpose of ‘use by’ and ‘best before’ dates.
6.1 Interest in food authenticity
When prompted with a list of options, 79% of the total sample claimed that they are
concerned with ‘food not being what the label says it is’. Moreover, just under half
the sample (47%) agreed that ‘it worries them that what’s in food might not be
what’s on the label’. These results thus highlight that most consumers are interested
in authenticity, although significantly fewer would consider themselves worried by
this.
Interest in country of origin is also at a moderate level, with over half the sample
(55%) agreeing that they would’ like to know more about where the food they eat

21 © TNS 2016
comes from’. Around four in ten (41%) indicated that they would like to ‘talk to
people about things that interest or concern them about food and food issues’.
6.2 Usage and understanding of food labels
There is evidence to suggest that consumers believe the information on labels could
be improved. For example, while most (70%) agreed that they have ‘clear
information on what the labels on the food they buy means’, significantly fewer (52%)
indicated that ‘the information on labels is clear and understandable’. Additionally,
only half the sample agreed that they ‘trust the information on food labels’.
The survey results also provide clear evidence of the importance of food labels for
consumers, with nearly all agreeing that they ever look at food labels when shopping
(95%) and read food labels at home (93%). The main reasons for looking at labels
when shopping and when at home are summarised in Figure 6.1.
Figure 6.1 Main things looked at on labels when shopping/at home – prompted (Q39) Base: all respondents (1003)
The use by/sell by date is the most widely sought piece of information whether in the
shops or at home, with a large majority indicating that they look at labels for this
purpose. Indeed these dates are significantly more widely sought out than the price
or ingredients when shopping.

© TNS 2016 22
6.3 Understanding use by/best before dates on labels
While dates on packaging are used as a source of information, the findings also
demonstrate that consumers are not necessarily aware of the difference between the
various dates on labels. Around two-thirds (69%) correctly selected ‘use by date’
when asked which type of label date was the best indicator of whether food is safe to
eat. However nearly one fifth chose the ‘best before date’ (19%) and much smaller
proportions selected ‘sell by date’ (4%) and ‘display until date’ (2%).
In keeping with the these figures, around two thirds (63%) indicated that the last day
an item with a use by date of 15th January could safely be eaten was 15th January –
a further 16% said 14th January. However, again a significant remainder offered a
different response – 6% indicated that the item would be safe to eat on 16th January,
and a further 13% claimed that ‘it would depend on the condition of the food’.
Overall labels are widely used, with the use by date well recognised as the best
indicator of food safety. However this information is not always checked either when
shopping or when preparing food. In order to better understand how labels are used,
and to help keep respondents engaged throughout the survey, they were asked to
complete an exercise where they were shown a typical example of food packaging
and asked to read they packet just as they would as if they were in a shop – not for
any more or less time than normal. In total, respondents spent an average of 43
seconds looking at the labelling – 19 seconds at the front of the packaging and 24 at
the back. Whilst it is recognised this artificial methodology may not give a true read
of time spent looking at food labels in a retail environment, this exercise will be
repeated at future waves to determine whether consumers spend longer looking at
labels as a result of the importance of doing so being made clear.

23 © TNS 2016
FSS dietary advice is based on the Eatwell Guide, produced by Public Health
England in association with FSS and other UK governments. The Guide
encompasses consensus evidence from the Scientific Advisory Committee on
Nutrition Report on Carbohydrates and Health, together with existing dietary
recommendations.
7. Consumers have healthier diets
While many are fairly comfortable with how healthy
their and their family’s diet is, there is also a
significant degree of uncertainty, with only 53%
thinking that the kinds of meals and snack foods they
and their family eat and drink are very or quite
healthy.
Though most feel they have clear information about
eating healthily, there is a significant level (69%) of
perceived expert contradiction over what foods are
good or bad for you, resulting in confusion amongst
over a third (35%) as to what’s supposed to be healthy and what isn’t.
A significant proportion recognise Scotland’s obesity problem, and are
concerned about what is in food. 74% agree that there are too many people
who eat unhealthily in Scotland, and over 80% are concerned about the
amount of sugar, salt, fat and/or saturated fat in food.
Links between health and diet are, however, well-established, with 85%
agreeing they know that an unhealthy diet can cause lots of health problems,
like cancer and heart disease.
This chapter of the report mainly focuses on attitudes towards healthy eating:
covering issues such as healthiness of food and drinks normally consumed,
information on healthy eating and health concerns around specific types of food.
The Healthy Eating questions in Wave 1 represented a small section of the survey,
with this being expanded in Wave 2.
7.1 Healthiness of food/drink
To gauge perceptions towards the healthiness of the types of food and drink that
people consume, survey respondents were asked to rate their own consumption as
well as that of other people in their household. The results are summarised in Figure
7.1
© TNS 2016 24
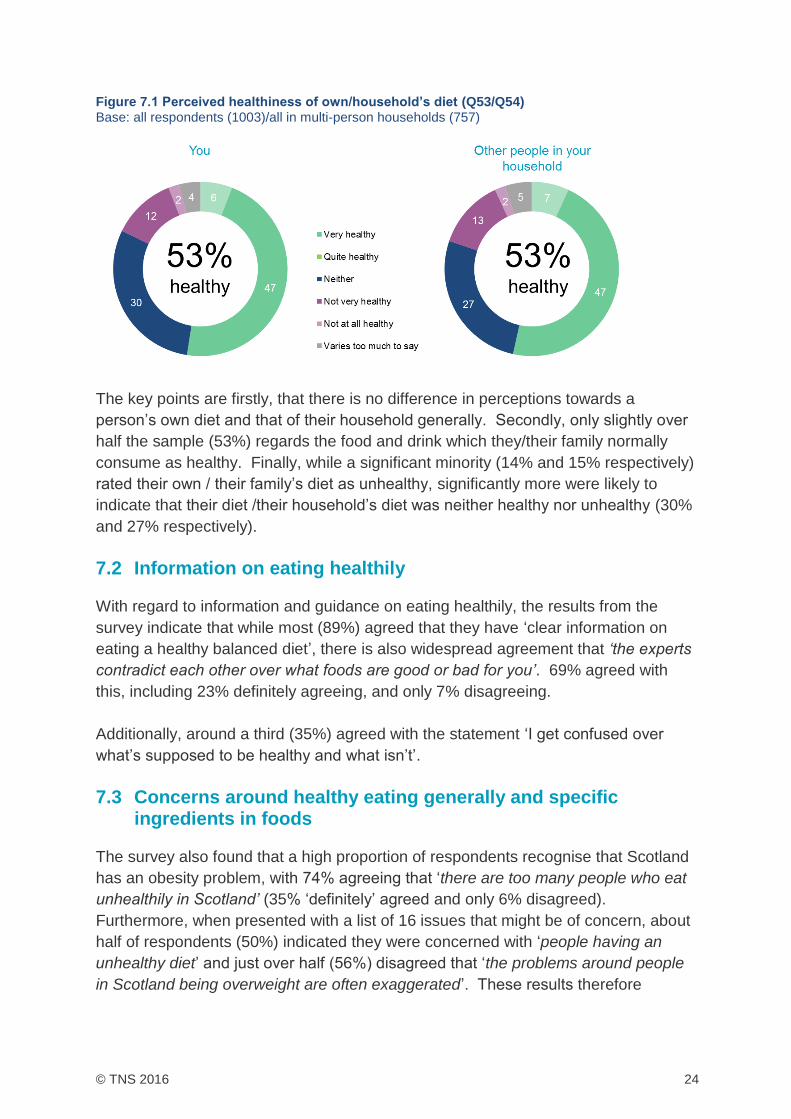
Figure 7.1 Perceived healthiness of own/household’s diet (Q53/Q54) Base: all respondents (1003)/all in multi-person households (757)
The key points are firstly, that there is no difference in perceptions towards a
person’s own diet and that of their household generally. Secondly, only slightly over
half the sample (53%) regards the food and drink which they/their family normally
consume as healthy. Finally, while a significant minority (14% and 15% respectively)
rated their own / their family’s diet as unhealthy, significantly more were likely to
indicate that their diet /their household’s diet was neither healthy nor unhealthy (30%
and 27% respectively).
7.2 Information on eating healthily
With regard to information and guidance on eating healthily, the results from the
survey indicate that while most (89%) agreed that they have ‘clear information on
eating a healthy balanced diet’, there is also widespread agreement that ‘the experts
contradict each other over what foods are good or bad for you’. 69% agreed with
this, including 23% definitely agreeing, and only 7% disagreeing.
Additionally, around a third (35%) agreed with the statement ‘I get confused over
what’s supposed to be healthy and what isn’t’.
7.3 Concerns around healthy eating generally and specific ingredients in foods
The survey also found that a high proportion of respondents recognise that Scotland
has an obesity problem, with 74% agreeing that ‘there are too many people who eat
unhealthily in Scotland’ (35% ‘definitely’ agreed and only 6% disagreed).
Furthermore, when presented with a list of 16 issues that might be of concern, about
half of respondents (50%) indicated they were concerned with ‘people having an
unhealthy diet’ and just over half (56%) disagreed that ‘the problems around people
in Scotland being overweight are often exaggerated’. These results therefore

25 © TNS 2016
suggest that there is a fairly high level of awareness that the people of Scotland
need to improve their diet.
Respondents were also asked to rate their level of concern with the amount of salt,
sugar, fat and saturated fat in food using the scale: ‘a lot’, ‘a little’ and ‘not at all’
concerned. The results are summarised in Figure 7.2.
Figure 7.2 Level of concern with ingredients in food (Q55) Base: all respondents (1003)
Over eight in ten respondents were either concerned ‘a lot’ or ‘a little’ about levels of
each of salt, sugar, fat and saturated fat. The ingredient causing most concern was
sugar, with 44% of all respondents concerned ‘a lot’, whereas fewer (34%) recorded
strong concern about salt.
The links between diet and health are also familiar to most, with 85% agreeing that
they ‘know that an unhealthy diet can cause lots of health problems, like cancer and
heart disease’. However, despite this well-known connection, a considerable
proportion agreed (51%) that they ‘know they need to do something to eat more
healthily’. Likewise, a significant proportion (41%) agreed that they ‘know they eat
too many ‘treats’ like cakes, biscuits, chocolates or sweets every day’. This
highlights that knowledge and understanding are in themselves insufficient to
motivate changes to current eating habits.

© TNS 2016 26
FSS’s regulatory approach is in line with the principles of better regulation. It
rewards compliant businesses and supports them both in domestic and
export markets. FSS deals effectively with those that are non-compliant, to
either achieve compliance, or deliver meaningful sanctions that prevent non-
compliant businesses from operating.
8. Responsible food businesses flourish
There is widespread concern about food hygiene
when eating out, and a desire for establishments to
pay more attention to this, with 75% agreeing that
restaurants, cafes, takeaways and catering
establishments should pay more attention to food
safety and hygiene. 78% are concerned about ‘food
hygiene when eating out’.
However, price is the key factor when deciding to eat
out, and consumers primarily judge hygiene standards
of places they eat out at by appearance of the staff
and premises (78%).
A quarter of people in Scotland (25%) worry about getting food poisoning
when eating out.
This chapter focuses on factors considered when eating out, with particular
reference to food hygiene and Food Hygiene Information Scheme (FHIS) – the food
hygiene information scheme operated by FSS.
8.1 Attitudes towards eating
Nearly eight out of ten (78%) indicated that ‘food hygiene when eating out’ was a
concern to them when presented with a list 16 issues that might be of concern. This
was the fourth highest level of concern recorded at this question, with just one
percentage point more citing food poisoning (79%), use of pesticides (79%) and food
not being what the label says it is (79%). Furthermore (at the same question) just
36% indicated concern with food hygiene when eating in the home.
A difference in attitude towards food safety in the home compared to food safety
when eating out is also illustrated by the response to the question, “when you eat out
how safe would you say the food that you eat is, compared to when you eat at
home?”. Respondents were four times as likely to say that food safety was worse
when eating out, than to say it was worse when eating at home (28% and 7%
respectively).

27 © TNS 2016
In keeping with these views there was widespread agreement (75%) that
‘restaurants, cafes, takeaways and catering establishments should pay more
attention to food safety and hygiene’ (only 4% disagreed).
Furthermore, when eating out, a quarter of all respondents (25%) agreed that they
‘worry about getting food poisoning’.
8.2 Factors when deciding where to eat out
When deciding where to eat out, cleanliness and hygiene was the second most
important factor on prompting (after price). This compares with only one in ten (9%)
claiming that the results of the most recent hygiene inspection is an important factor
in their decision, thus highlighting that only a small proportion are using formal
measures to judge hygiene when eating out.
The top six factors used when deciding where to eat out are shown in Figure 8.2.
Figure 8.2 Top 5 factors when deciding where to eat out – prompted (Q14) Base: All respondents (1003)
When all respondents were asked how they would judge the hygiene standards of
the place they eat out at or buy food from, the most widely stated answer (78%) was
appearance (staff and/or premises), followed by reputation (65%) and then hygiene
certificates/stickers (40%). These results (summarised in Figure 8.3) confirm that
the official measures of hygiene are not very influential despite cleanliness and
hygiene being an important factor in deciding where to eat/buy food from.

© TNS 2016 28
Figure 8.3 Top 5 factors used to judge hygiene standards of places to eat out at/buy food from – prompted (Q47) Base: All respondents (1003)
More specific questions regarding hygiene certificates confirm that these are under–
utilised with only a quarter (26%) claiming they have clear information on ‘how to
check whether the food I am eating in a café/bar/restaurant is safe’.
There is however some awareness of the existing scheme: when shown images of
FHIS certificates, half of respondents (50%) claimed they had seen one: 44% had
seen it in a window and 6% had seen it online.
Moreover among all respondents, a quarter (26%) had used the FHIS in the previous
12 months – again predominantly looking at the window/door of an establishment
(90%) rather than through researching on the internet (8%).
Importantly, while only a minority have used this scheme to check hygiene
standards, the vast majority of who have done so (83%) said it influenced their
decision on whether or not to use that establishment (including nearly a third - 31% -
who were influenced ‘a lot’) – indicating potential for the scheme if greater
awareness can be generated.

29 © TNS 2016
FSS is trusted by people and food businesses, and the other organisations that we
interact with, to act in accordance with our Values and Principles and to put consumers
first. This section of the report explores the public’s opinion and knowledge of FSS and
its responsibilities, some eight months after the organisation was established.
9. FSS is a trusted organisation
The survey was undertaken eight months after FSS was
set up on 1 April 2015. FSS has achieved a good level
of brand recognition (44%) in that short time, and a
widespread degree of trust, with 70% of those aware
of FSS trusting the organisation to do its job.
FSS performs best in those areas where consumers
most expect it to be operating, with 49% of those
aware of FSS rating FSS as excellent or very good at
ensuring that food in Scotland is safe to eat. However there
is lower knowledge of FSS’s role in diet and nutrition, with just under half
(49%) being aware that FSS is responsible for promoting and enabling
healthy eating.
9.1 Brand recognition, trust and knowledge
At the start of the survey, all respondents were shown the FSS logo and told that
‘Food Standards Scotland’ has taken over from the ‘Food Standards Agency’ as the
organisation responsible for making sure people eat healthily and safely in Scotland.
In total 44% claimed they had heard of FSS before taking part in the survey.
Among those aware of FSS, there was a widespread degree of trust, with 70%
saying they either trust FSS ‘a little’ (51%) or ‘a lot’ (19%) and only a very small
proportion said they did not trust the organisation (<0.5%). The significant
remainder (28%) neither trust nor distrust FSS reflecting their unfamiliarity with the
organisation.
Those aware of FSS were also asked what issues they think the organisation is
responsible for (from a prompted list). As shown in Figure 7.1, the most selected
issues were ‘ensuring the food you buy is safe to eat’ and ‘to work with the food
industry to improve standards’ (selected by 80% and 75% of respondents
respectively).
© TNS 2016 30
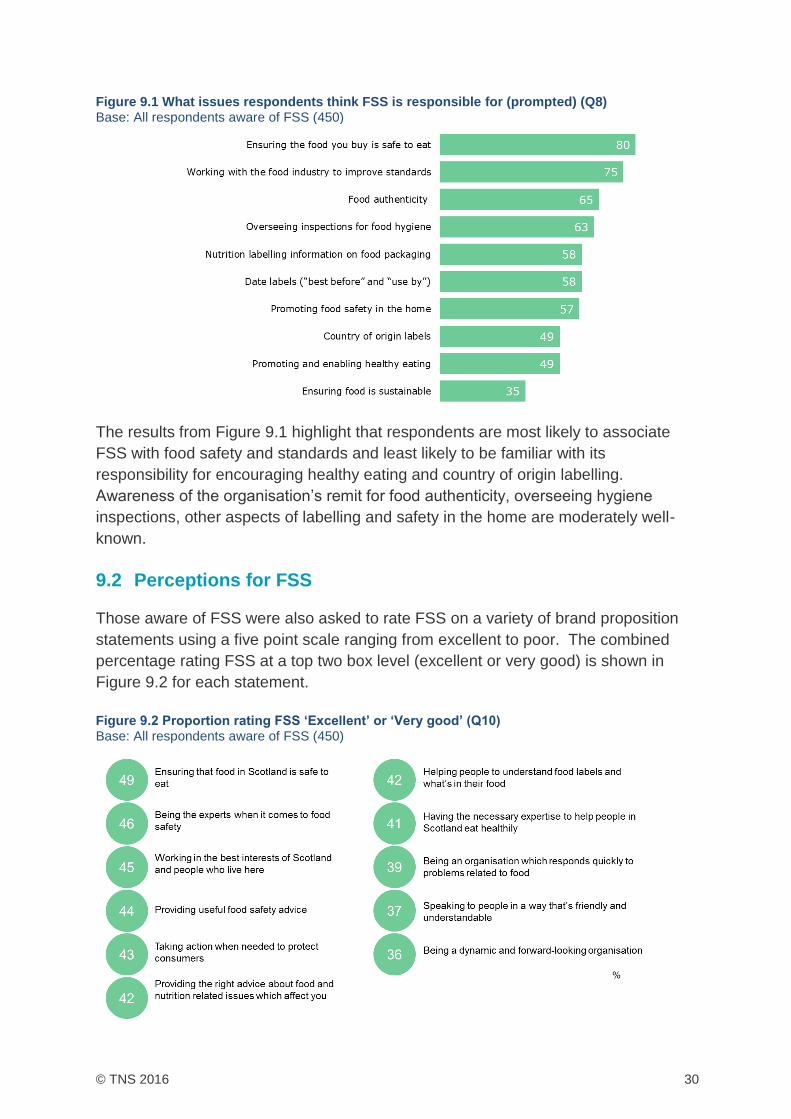
Figure 9.1 What issues respondents think FSS is responsible for (prompted) (Q8) Base: All respondents aware of FSS (450)
The results from Figure 9.1 highlight that respondents are most likely to associate
FSS with food safety and standards and least likely to be familiar with its
responsibility for encouraging healthy eating and country of origin labelling.
Awareness of the organisation’s remit for food authenticity, overseeing hygiene
inspections, other aspects of labelling and safety in the home are moderately well-
known.
9.2 Perceptions for FSS
Those aware of FSS were also asked to rate FSS on a variety of brand proposition
statements using a five point scale ranging from excellent to poor. The combined
percentage rating FSS at a top two box level (excellent or very good) is shown in
Figure 9.2 for each statement.
Figure 9.2 Proportion rating FSS ‘Excellent’ or ‘Very good’ (Q10) Base: All respondents aware of FSS (450)

31 © TNS 2016
The results show that the performance of FSS is considered strongest on ensuring
food is safe and food safety expertise, with slightly under half awarding a top two box
score for these statements (49% and 46% respectively). By comparison the
percentages indicating an ‘excellent’ or ‘very good’ rating were slightly lower with
respect to statements focusing on nutrition, food labelling and eating healthily (at
42%, 42% and 41% respectively).
The three lowest FSS ‘top two box’ scores (less than 40%) relate more to the way in
which the organisation operates, rather than its functions. Additionally, these
statements recorded the highest level of non-response, with around 15% unable to
give an opinion compared to around 10% across all other statements.
Importantly the total percentage giving a positive rating, including ‘excellent’, ‘very
good’ or ‘good’, ranged from 70% to 83% across all statements and only a tiny
minority (2% or less) indicated that any aspect was ‘poor’.
Overall therefore, FSS performs strongly across all aspects but is considered to be
performing best where consumers expect it to be operating – in protecting and
advising on food safety. The aspects with the lowest level of strong positive
endorsement also tended to have the highest level of non-response, suggesting that
ratings will improve as familiarity with FSS increases.

© TNS 2016 32
Catriona West Senior Associate Director 0131 243 3916 Alastair Graham Associate Director 0131 243 3920
Food Standards Scotland Pilgrim House Aberdeen AB11 5RL 01224 285100 [email protected] foodstandards.gov.scot