flood risk assessment damhead creek 2 power station
TRANSCRIPT

FLOOD RISK ASSESSMENT
DAMHEAD CREEK 2 POWER STATION

Name Job Title Date
Prepared Joanne Somerton Senior Consultant (Flood
Risk) 14/01/2016
Checked Kerry Whalley Technical Director 04/02/2016
Technical Review Ian Small Associate Director 15/01/2016
AMENDMENT RECORD
Issue Date Issued Date Effective Purpose of Issue and Description of Amendment
1 January 2016 January 2016 Draft for Client Comment
2 February 2016 February 2016 Final for Submission

TABLE OF CONTENTS
1. Introduction ............................................................................................................. 1
1.1 Commission ........................................................................................ Error! Bookmark not defined.
1.2 Background......................................................................................................................................... 1
1.3 Scope of Services ............................................................................................................................... 1
1.4 Data Sources ...................................................................................................................................... 2
2. Site Information....................................................................................................... 3
2.1 Site Description .................................................................................................................................. 3
2.2 Existing Development ......................................................................................................................... 4
2.3 Topography......................................................................................................................................... 5
2.4 Surface Water Resources .................................................................................................................. 5
2.5 Proposed Development ...................................................................................................................... 5
3. Policy Context ......................................................................................................... 7
3.1 National Policy .................................................................................................................................... 7
3.1.1 National Policy Statements for Energy .............................................................................. 7
3.1.2 National Planning Policy Framework ................................................................................ 7
The Sequential Test and Exception Test ......................................................................................... 8
Development and Flood Risk Vulnerability ....................................................................................... 8
3.2 Local Policy......................................................................................................................................... 9
3.2.1 Medway Local Plan ........................................................................................................... 9
3.3 Other Relevant Policy and Guidance ............................................................................................... 10
Medway Strategic Flood Risk Assessment (2012) ......................................................................... 10
Medway Draft Local Flood Risk Management Strategy (2014) ...................................................... 10
4. Flood Risk ............................................................................................................. 11
4.1 Sources of Flood Risk ...................................................................................................................... 11
4.2 Tidal Flood Risk ................................................................................................................................ 11
4.2.1 Flooding History............................................................................................................... 11
4.2.2 Modelled Flood Levels .................................................................................................... 12
4.2.3 Flood Defences ............................................................................................................... 13
Overtopping and Breaching of Defences ....................................................................................... 13

DHC2 Flood Risk Assessment 4-Feb-16
Page iv
4.3 Fluvial Flood Risk ............................................................................................................................. 14
4.4 Flooding from Artificial Sources ........................................................................................................ 15
4.5 Groundwater Flooding ...................................................................................................................... 15
4.6 Pluvial Flooding ................................................................................................................................ 16
4.7 Flooding from Drainage Infrastructure .............................................................................................. 16
5. Climate Change .................................................................................................... 18
5.1 Context ............................................................................................................................................. 18
5.2 Tidal Flooding ................................................................................................................................... 18
5.3 Fluvial Flooding ................................................................................................................................ 19
5.4 Groundwater ..................................................................................................................................... 19
5.5 Sewers .............................................................................................................................................. 19
5.6 Surface Water Run-off Generation and Overland Flow ................................................................... 19
6. Proposed Flood Risk Management Measures ...................................................... 20
6.1 Mitigation against Tidal Flooding ...................................................................................................... 20
6.2 Mitigation against Fluvial Flooding ................................................................................................... 20
6.3 Mitigation against Artificial Flooding ................................................................................................. 20
6.4 Mitigation against Groundwater Flooding ......................................................................................... 21
6.5 Mitigation against Pluvial Flooding and from Drainage Infrastructure .............................................. 21
7. Surface Water Management ................................................................................. 22
7.1 Existing Conditions ........................................................................................................................... 22
Existing Runoff from the Site .......................................................................................................... 22
7.2 Policy and Stakeholder Requirements ............................................................................................. 23
National Planning Policy Framework .............................................................................................. 23
7.3 Proposed Conceptual Strategy......................................................................................................... 24
Restricted Surface Water Runoff Rate ........................................................................................... 24
Sustainable Drainage Systems ...................................................................................................... 24
Surface Water Attenuation Volumes .............................................................................................. 24
8. Off-Site and Residual Risks .................................................................................. 26
8.1 Off-Site Impacts ................................................................................................................................ 26
8.2 Residual Risks .................................................................................................................................. 26
9. Conclusions .......................................................................................................... 27

DHC2 Flood Risk Assessment 4-Feb-16
Page v
Figures: Figure 2-1: Damhead Creek 2 CCGT Power Station Site Location
Figure 2-2: Application Site Boundary and Areas 1 to 3
Figure 4-1: Environment Agency Flood Extent Map
Tables: Table 1-1: Sources of Data Reviewed
Table 3-1: Flood Risk Vulnerability and Flood Zone Compatibility
Table 4-1: Defended Modelled Tidal Flood Levels for the Site
Table 4-2: Un-defended Modelled Tidal Flood Levels for the Site
Table 5-1: Recommended Contingency Allowances for Climate Change
Table 7-1 Site Areas and Surfacing
Table 7-2 Approximate Surface Water Runoff Rates for the Existing Site Areas 1 and 3
(litres/second)
Table 7-3 Rainfall Values
Table 7-4 Indicative Attenuation Storage Requirements
Annexes: Annex A: Data Consultation
Annex B: Topographic Survey
Annex C: Development Plans
Annex D: Proposed Permeable and Impermeable Site Areas

DHC2 Flood Risk Assessment 4-Feb-16
Page 1
1. Introduction AECOM has undertaken a Flood Risk Assessment (FRA) for the proposed Variation under Section 36(c) of the Electricity Act 1989 to the Damhead Creek 2 (DHC2) power station.
On 25 January 2011, ScottishPower secured consent under Section 36 of the Electricity Act 1989, for the development, construction and operation of a new 1,000 MW Combined Cycle Gas Turbine (CCGT) adjacent to the existing Damhead Creek Power Station. Further to this, on 28 July 2014 ScottishPower secured consent under Section 36(c) of the Electricity Act 1989 to increase the output of Damhead Creek 2 CCGT to 1,200 MW (DECC Reference 12.04.09.04/265C) and subsequently in October 2015 this was further increased to 1,800 MW output CCGT. ScottishPower now seek to further vary the existing consent to allow flexibility in the make-up of the plant to include up to 300 MW of Open Cycle Gas Turbine (OCGT) peaking plant within the 1,800 MW scheme. The proposed development therefore now comprises either a CCGT or a CCGT/OCGT power station with a total combined electrical capacity up to 1,800 MW, hereafter referred to as the proposed 1,800 MW with peaking plant scheme option. This application to vary the consent retains the option of constructing the already consented 1,800 MW CCGT-only scheme option but also includes the provision of up to 300 MW of that capacity as OCGT units such that the combined output remains at 1,800 MW. This assessment therefore focuses on the new variant including peaking plant, as the already consented CCGT option was fully assessed as part of the 2015 variation
1.1 Background The Site, comprising approximately 30.9 hectares (ha) of brownfield land, is located to the south of the Hoo Peninsula, Kent, and is centrally located upon National Grid Reference (NGR) 581230, 172810.
The Environment Agency Flood Zone Map issued in December 2015 (Annex A and Figure 4.1) indicates areas to the south; west and north-west of the Site are located within Flood Zone 3 and are classified as having a ‘high risk’ of flooding from fluvial or tidal sources. Flood Zone 3 delineates areas classed as having a greater than 0.5% (1 in 200) Annual Exceedance Probability (AEP) of flooding from tidal sources or a greater than 1% AEP (1 in 100) from fluvial sources.
Land to the east and north is located within Flood Zone 2. Areas located within Flood Zone 2 are classified as having a ‘medium risk’ of flooding from fluvial or tidal sources. Flood Zone 2 delineates areas classed as having between a 1% AEP and 0.1% (1 in 1000) AEP of fluvial flooding, or between a 0.5% AEP and 0.1% AEP of tidal flooding in any year.
The Environment Agency Flood Zone Map also indicates that the Site lies in an area classed as benefitting from flood defences.
The National Planning Policy Framework1 (NPPF) and the Planning Policy Guidance2 (PPG) specifies that planning applications for development proposals located in Flood Zone 3 should be accompanied by a FRA.
1.2 Scope The aim is to undertake a FRA that is appropriate to the nature and scale of the Proposed Development that determines flood risk posed to the Site and arising from the Proposed Development and recommends suitable mitigation measures, where required.
The objectives of this report are to:
• review existing information relating to the flood risk posed to the Proposed Development from all sources (e.g. fluvial, surface water, sewer flooding);
• consult with Medway Council and the Environment Agency in relation to flood risk and their requirements for management of any risk;
1 Communities and Local Government (2012). The National Planning Policy Framework (NPPF) 2 Communities and Local Government, (2014); Planning Policy Guidance. (http://planningguidance.planningportal.gov.uk)

DHC2 Flood Risk Assessment 4-Feb-16
Page 2
• assess the flood risk to the Proposed Development under existing and post-development conditions (taking into account climate change); and
• outline any mitigating measures needed to ensure the Proposed Development and its occupants will be safe for the lifetime of the development and to meet the requirements of the NPPF.
1.3 Data Sources The baseline conditions for the site have been established through a desk study and via consultation with the Environment Agency, Medway Council, and Southern Water Limited (SWL). This information has been used to inform the assessment made within the FRA. Data collected during the course of this assessment are described in Table 1-1.
Table 1-1Sources of Data Reviewed
Purpose Data Source Comments
Identification of Hydrological Features
• 1: 25,000 Ordnance Survey (OS) mapping.
Identifies the position of the Site and local hydrological features.
Identification of Existing Flood Risk
• Topographical survey of the Site. Provides existing Site levels.
• EA Indicative Flood Zone Map (Figure 4.1 and Annex A).
Identifies fluvial/ tidal inundation extents and historical flooding
• EA Flood Inundation Mapping (internet).
Provides information on the risk of flooding from reservoirs (artificial sources).
• Environment Agency Consultation (Annex A).
Information from the Environment Agency on existing Flood Risk (Annex A).
• Medway Strategic Flood Risk Assessment (SFRA)3,
• Medway Preliminary Flood Risk Assessment (PFRA)4;
• Medway Estuary and Swale Shoreline Management Plan5
Assesses flood risk across the Medway Council area. Includes flood risk from fluvial/tidal, sewers, overland flow and groundwater.
• British Geological Survey records. Provides details of geology and hydrogeology in the vicinity of the Site.
• PFRA including Public sewer record (SWL) details.
Identifies the local drainage system near the Site
Identification of Historical Flooding
• Environment Agency Gives details of historical flooding. • SFRAs and PFRAs.
Details of the Scheme
• Indicative Development Plans. Provides layout of the Proposed Development.
Surface Water Drainage
• OS Mapping; • SFRA.
Identifies existing Site drainage, public drainage system near the Site and details of existing surface water runoff from the Site.
3 Mott MacDonald (2006). Medway Strategic Flood Risk Assessment, Main Report 4 Medway Council (2011) Preliminary Flood Risk Report 5 Halcrow (2010) Medway Estuary and Swale Shoreline Management Plan

DHC2 Flood Risk Assessment 4-Feb-16
Page 3
2. Site Information 2.1 Site Description The Damhead Creek 2 Power Station Site comprises a roughly undeveloped, triangular shaped area of approximately 30.9 ha (the total area within the application red line indicated on Figure 2-1), approximately 8 km north east of Rochester, Kent. The Site is located to the south of the Hoo Peninsula, a tongue of land between the Thames and Medway estuaries, at NGR 581230, 172810 (see Figure 2.1).
Figure 2-1 Damhead Creek 2 CCGT Power Station Site Location
Damhead Creek CCGT Power Station and is bounded on the southern and eastern sides by earth bunds with a crest level of approximately 5.6 m Above Ordnance Datum (AOD).
The Site is bordered by industrial development to the north- west, by wetland lagoons to the north- east and by Kingsnorth Power Station to the south.
The surrounding land comprises:
• Kingsnorth Business Park to the north and north-west;
• Kingsnorth Industrial Estate to the north and north east;
• Damhead Creek to the east and south-east;
• agricultural land and the former Kingsnorth Power Station to the south; and
• the existing Damhead Creek Power Station to the west.

DHC2 Flood Risk Assessment 4-Feb-16
Page 4
2.2 Existing Development The application site is described as three main areas (see Figure 2-2):
• DHC2 main area (referred to as Area 1 in this report) as shaded grey in Figure 2-2, comprising an area of 18.1 ha (including 10.4 ha of land for DCH2 plus, 4.1 ha of CCS land and 3 ha of CCS land in an old substation plot), is where the majority of the new DHC2 will be constructed and lies to the east of the existing Damhead Creek CCGT Power Station. The area is low-lying undulating ground sloping to the south-east and comprises unmanaged grassland and some hardstanding. Area 1 was largely topsoil-stripped and disturbed during the construction of the existing Damhead Creek CCGT Power Station;
• carbon capture land and DHC1 mitigation land (referred to as Area 2 in this report) as shaded purple and yellow in Figure 2-2, comprising an area of 4.1 ha, lies to the north of the existing Damhead Creek CCGT Power Station. This land consists of hardstanding and is not currently in use; and
• carbon capture land and ecological mitigation area (referred to as Area 3 in this report) as shaded orange and green in Figure 2-2, comprising an area of 16.7 ha, lies to the north-east of the existing Damhead Creek CCGT Power Station. Land in Area 3 has previously been used to dispose of fly ash from the nearby Kingsnorth Power Station. It is bounded on the west by an ecological mitigation area associated with the existing Damhead Creek CCGT Power Station.
Figure 2-2 Application Site Boundary and Areas 1 to 3
DHC2 Flood Risk Assessment 4-Feb-16
Page 5
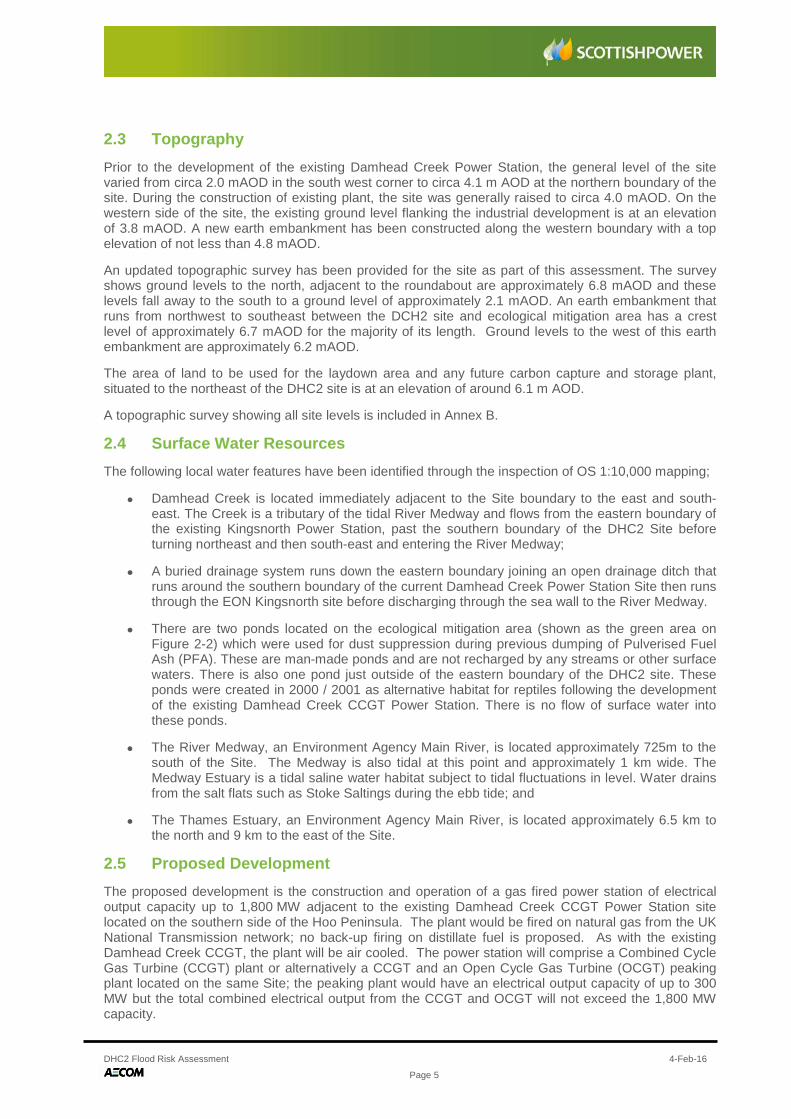
2.3 Topography Prior to the development of the existing Damhead Creek Power Station, the general level of the site varied from circa 2.0 mAOD in the south west corner to circa 4.1 m AOD at the northern boundary of the site. During the construction of existing plant, the site was generally raised to circa 4.0 mAOD. On the western side of the site, the existing ground level flanking the industrial development is at an elevation of 3.8 mAOD. A new earth embankment has been constructed along the western boundary with a top elevation of not less than 4.8 mAOD.
An updated topographic survey has been provided for the site as part of this assessment. The survey shows ground levels to the north, adjacent to the roundabout are approximately 6.8 mAOD and these levels fall away to the south to a ground level of approximately 2.1 mAOD. An earth embankment that runs from northwest to southeast between the DCH2 site and ecological mitigation area has a crest level of approximately 6.7 mAOD for the majority of its length. Ground levels to the west of this earth embankment are approximately 6.2 mAOD.
The area of land to be used for the laydown area and any future carbon capture and storage plant, situated to the northeast of the DHC2 site is at an elevation of around 6.1 m AOD.
A topographic survey showing all site levels is included in Annex B.
2.4 Surface Water Resources The following local water features have been identified through the inspection of OS 1:10,000 mapping;
• Damhead Creek is located immediately adjacent to the Site boundary to the east and south-east. The Creek is a tributary of the tidal River Medway and flows from the eastern boundary of the existing Kingsnorth Power Station, past the southern boundary of the DHC2 Site before turning northeast and then south-east and entering the River Medway;
• A buried drainage system runs down the eastern boundary joining an open drainage ditch that runs around the southern boundary of the current Damhead Creek Power Station Site then runs through the EON Kingsnorth site before discharging through the sea wall to the River Medway.
• There are two ponds located on the ecological mitigation area (shown as the green area on Figure 2-2) which were used for dust suppression during previous dumping of Pulverised Fuel Ash (PFA). These are man-made ponds and are not recharged by any streams or other surface waters. There is also one pond just outside of the eastern boundary of the DHC2 site. These ponds were created in 2000 / 2001 as alternative habitat for reptiles following the development of the existing Damhead Creek CCGT Power Station. There is no flow of surface water into these ponds.
• The River Medway, an Environment Agency Main River, is located approximately 725m to the south of the Site. The Medway is also tidal at this point and approximately 1 km wide. The Medway Estuary is a tidal saline water habitat subject to tidal fluctuations in level. Water drains from the salt flats such as Stoke Saltings during the ebb tide; and
• The Thames Estuary, an Environment Agency Main River, is located approximately 6.5 km to the north and 9 km to the east of the Site.
2.5 Proposed Development The proposed development is the construction and operation of a gas fired power station of electrical output capacity up to 1,800 MW adjacent to the existing Damhead Creek CCGT Power Station site located on the southern side of the Hoo Peninsula. The plant would be fired on natural gas from the UK National Transmission network; no back-up firing on distillate fuel is proposed. As with the existing Damhead Creek CCGT, the plant will be air cooled. The power station will comprise a Combined Cycle Gas Turbine (CCGT) plant or alternatively a CCGT and an Open Cycle Gas Turbine (OCGT) peaking plant located on the same Site; the peaking plant would have an electrical output capacity of up to 300 MW but the total combined electrical output from the CCGT and OCGT will not exceed the 1,800 MW capacity.

DHC2 Flood Risk Assessment 4-Feb-16
Page 6
It is expected that DHC2 will operate in various running modes including full load (maximum continuous rating) and two shifting where the plant can be operated on and off during the day to meet peak demands. The plant will occasionally be shut down for brief periods of essential maintenance and statutory inspections. DHC2 is expected to have an annual availability of the order of 93% with the remainder of the time dedicated to annual maintenance and unplanned plant failures. The operational life time of the development will be of the order of 35 years. It is envisaged that the peaking plant will operate for up to 1,500 hours per year, to respond to peak demand on the UK transmission system although the CCGT units are expected to run at higher load factors – of up to 80% in the early years of operation, reducing through time as new renewables come on line.
The previously consented 1,800 MW scheme comprised either a single shaft or a multi-shaft combined cycle arrangement with up to three gas turbines, each with a heat recovery steam generator (HRSG), and connected to either a dedicated steam turbine or a single steam turbine respectively, depending on the plant configuration. The total electrical output was 1,800 MW based on ISO conditions. For the 1,800 MW CCGT with peaking plant scheme option, a multi-shaft arrangement has been considered for the CCGT units, comprising two gas turbines, each with a heat recovery steam generator (HRSG), and connected to a single steam turbine. This is to allow sufficient space for the peaking plant to be accommodated within the Site footprint without compromising the space to be retained for the CCR land. The peaking plant capacity will be generated through up to two OCGTs which will be gas fired with no diesel back-up.
The General Arrangement Plan for the 1,800 MW CCGT with peaking scheme option (Annex C) is based on this arrangement of the multi shaft CCGT and up to two peaking plant units and comprises the following plant:
• Turbine Hall (comprising 2 No. gas turbine buildings 72 m x 31 m x 30 m and 1 No. steam turbine building 60 m x 30 m x 25 m);
• 2 No. peaking plant stacks up to 50 m x approximately 8.4 m external diameter and 2 No. HRSG stacks modelled up to 95 m x approximately 8.4 m external diameter;
• HRSG enclosure (1 HRSG building approximately 36 m x 34 m x 45 m); and
• Air Cooled Condenser (1 No. unit approximately 84 m x 135 m x 46.5 m).
The exact dimensions for the proposed 1,800 MW CCGT with peaking plant scheme option cannot be confirmed until the detailed design stage and will be agreed with Medway Council prior to the commencement of construction. The above dimensions however represent the likely sizes of the main components based on ScottishPower’s discussions with OEMs
The total electrical output of the proposed development would therefore be up to 1,800 MW at ISO conditions.
Both the currently consented 1,800 MW CCGT-only scheme option and the proposed 1,800 MW CCGT with peaking plant scheme option would export the electricity generated to the National Grid via the existing Kingsnorth substation, which lies approximately 500 m to the south of the existing Damhead Creek CCGT Power Station boundary.
The CHP-Readiness study (Appendix D to the EIR) has demonstrated that there are no potential heat users in the area. The plant will, however, be designed in such a way that future connections will be possible to export heat if heat users are identified.
DHC2 Flood Risk Assessment 4-Feb-16
Page 7
3. Policy Context Flood risk and surface water management related planning policies and guidance that are relevant to the Proposed Development are described below.
3.1 National Policy
3.1.1 National Policy Statements
A number of National Policy Statements (NPS) for Energy Infrastructure were designated by the Secretary of State (SoS) under the Planning Act 2008 on 19th July 2011. NPS EN-26, together with the Overarching NPS for Energy (EN-1)7, provides the primary basis for decisions on applications for ‘nationally significant fossil fuel electricity generating infrastructure’ defined at Section 1.8 of EN-2, which includes gas-fired electricity generation. Whilst this application is for a variation under the previous Electricity Act regime, the NPS for Energy provides applicable context and guidance.
EN-1 states that ‘applications for energy projects of 1 hectare or greater in Flood Zone 1 and all proposals for energy projects located in Flood Zones 2 and 3 should be accompanied by a NPPF compliant flood risk assessment’.
In determining an application for development consent, the Planning Inspectorate and SoS (or, in this case, DECC) should be satisfied that where relevant:
• the application is supported by an appropriate FRA;
• the Sequential Test has been applied as part of site selection;
• a sequential approach has been applied at the site level to minimise risk by directing the most vulnerable uses to areas of lowest flood risk;
• the proposal is in line with the relevant national and local flood risk management strategy;
• priority has been given to the use of SuDs; and
• in flood risk areas the project is appropriately flood resilient and resistant, including safe access and escape routes where required, and that any residual risk can be safely managed over the lifetime of the development.
3.1.2 National Planning Policy Framework
The NPPF is supported by the PPG, an online resource published in March 2014. The PPG supersedes the PPS25 Practice Guide8 and the Technical Guidance to the National Planning Policy9, as detailed in the Ministerial Statement ‘Making the planning system work more efficiently and effectively’10.
The NPPF and PPG must be taken into account in the preparation of local and neighbourhood plans, and is a material consideration in planning decisions. It constitutes guidance for local planning authorities and decision-takers both in drawing up plans and as a material consideration in determining applications.
The NPPF and PPG recommends that Local Plans should be supported by a Strategic FRA (SFRA) and develop policies to manage flood risk from all sources, taking account of advice from the Environment 6 Department of Energy & Climate Change (2011) National Policy Statement for Fossil Fuel Electricity Generating Infrastructure
(EN-2) Planning for New Energy Infrastructure, June 2011 7 Department of Energy & Climate Change (2011) Overarching National Policy Statement for Energy (EN-1) Planning for New
Energy Infrastructure, July 2011 8 Communities and Local Government, (2012); ‘Planning Policy Statement 25: Development and Flood Risk, Practice Guidance’ 9 Communities and Local Government, (2012); ‘Technical Guidance to the National Planning Policy Framework’ 10 Communities and Local Government (2014); ‘Making the planning system work more efficiently and effectively’
DHC2 Flood Risk Assessment 4-Feb-16
Page 8
Agency and other relevant flood risk management bodies, such as Lead Local Flood Authorities (LLFAs) and Internal Drainage Boards (IDBs). Local Plans should apply a sequential, risk-based approach to the location of development to avoid, where possible, flood risk to people and property and manage any residual risk, taking account of the impacts of climate change, by:
- applying the Sequential Test;
- applying the Exception Test, if necessary;
- safeguarding land from development that is required for current and future flood management;
- using opportunities offered by new development to reduce the causes and impacts of flooding; and
- where climate change is expected to increase flood risk so that some existing development may not be sustainable in the long-term, seeking opportunities to facilitate the relocation of development, including housing, to more sustainable locations.
The Proposed Development will comply with the requirements of the NPPF and EN-1.
The Sequential Test and Exception Test
The overall aim of the Sequential Test is to steer new development to Flood Zone 1. Where there are no reasonably available sites in Flood Zone 1, local planning authorities allocating land in Local Plans or determining planning applications for development at any particular location should take into account the flood risk vulnerability of land uses and consider reasonably available sites in Flood Zone 2, applying the Exception Test if required. Only where there are no reasonably available sites in Flood Zones 1 or 2 should the suitability of sites in Flood Zone 3 be considered, taking into account the flood risk vulnerability of land uses and applying the Exception Test if required.
For the Exception Test to be passed:
• it must be demonstrated that the development provides wider sustainability benefits to the community that outweigh flood risk, informed by a SFRA where one has been prepared; and,
• a site-specific FRA must demonstrate that the development will be safe for its lifetime taking account of the vulnerability of its users, without increasing flood risk elsewhere, and, where possible, will reduce flood risk overall.
Both elements of the test will have to be passed for development to be allocated or permitted.
Development and Flood Risk Vulnerability
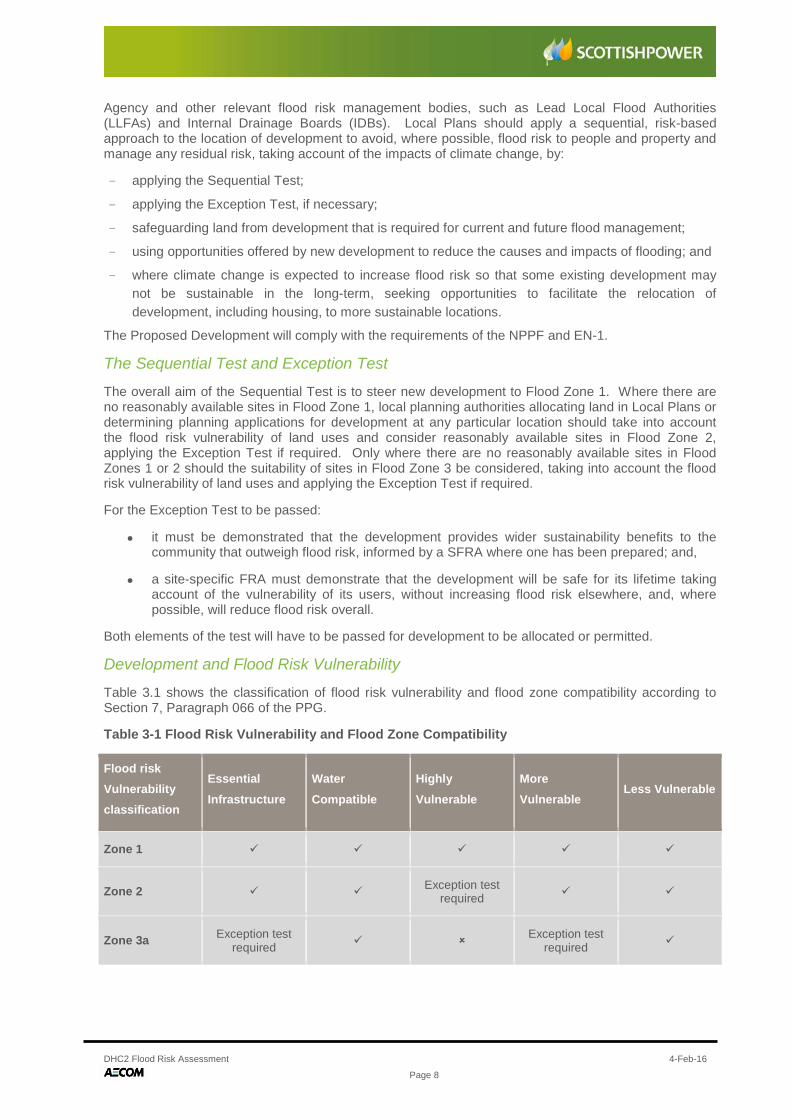
Table 3.1 shows the classification of flood risk vulnerability and flood zone compatibility according to Section 7, Paragraph 066 of the PPG.
Table 3-1 Flood Risk Vulnerability and Flood Zone Compatibility
Flood risk Vulnerability classification
Essential Infrastructure
Water Compatible
Highly Vulnerable
More Vulnerable
Less Vulnerable
Zone 1
Zone 2 Exception test required
Zone 3a Exception test required Exception test
required

DHC2 Flood Risk Assessment 4-Feb-16
Page 9
Flood risk Vulnerability classification
Essential Infrastructure
Water Compatible
Highly Vulnerable
More Vulnerable
Less Vulnerable
Zone 3b ‘Functional Flood plain’
Exception test required
Key
Development is appropriate. Development should not be permitted.
According to the PPG the Proposed Development (electricity generating power station) would be classed as ‘Essential Infrastructure.’ Essential infrastructure is defined within the PPG as “b) Essential utility infrastructure which has to be located in a flood risk area for operational reasons, including electricity generating power stations and grid and primary substations.”
Based on classification shown in Table 3.1, the Proposed Development use is appropriate in Flood Zones 1, 2 and 3a provided that the Sequential Test is passed and the Exception Test is passed for development in Flood Zone 3.
Although located within Flood Zone 3, the proposals include the redevelopment of a site that is owned by ScottishPower and is a variation to an existing consented scheme and therefore the application of the Sequential Test is not considered appropriate. In addition, the Proposed Development would be located on land already designated as part of a power station site or as land set aside for future employment under the Medway Local Plan and it is assumed that the Sequential Test for the Site was passed during the site allocation process.
The proposed development is similar to the existing consent that already exists for the site. Much of the infrastructure required for such a development already exists at the site and can support the development with minimal impact upon the surrounding environment.
In terms of wider sustainability benefits to the community, the potential increase in construction staff would result in beneficial socio-economic effects including employment of local people and sourcing of local goods, services and contractors, and indirect employment benefits. The total investment in the proposed scheme would be around £600-750 million which represents a substantial investment for the region.
The proposed development provides electricity generation that strengthens the local and regional grid network, which, in turn, underpins the development of other services within the south east region. The plant will be highly efficient when compared with other power stations currently in operation and will assist the UK Government in their aims of reducing overall emissions of carbon dioxide through the displacement of coal and oil power stations which are due to close in the coming years and contribute to security of supply.
Based on this information and the information provided within this FRA, it is considered that the Proposed Development passes the Exception Test.
3.2 Local Policy
3.2.1 Medway Local Plan
The Local Development Scheme (LDS) (June 2014) provides an updated programme for the production of a new local plan that will provide the basis for development policy in Medway (it is noted that the Issues and Options document associated with the new Local Plan was consulted on in November 2015, but this plan is not yet adopted therefore the existing policy remains the LDS). The scheme covers the period from 2014 to 2017, and updates the Medway LDS published in August 2011. However, some

DHC2 Flood Risk Assessment 4-Feb-16
Page 10
Medway Local Plan (2003) policies have been retained and will continue to be considered as robust and up-to-date policies within Medway LDS.
The following Policies are relevant to the Proposed Development in terms of flood risk and surface water management:
• Policy BNE45:Undeveloped Coast – development will be permitted in and alongside the undeveloped coast, as defined on the proposals map, only if iii) the development is not likely to be at risk from flooding or coastal erosion to the extent that it would require defence works for its safety and protection;
• Policy CF13: Tidal Flood Risk Areas – Development will not be permitted within a tidal flood risk area if; i) it harms the integrity of the flood defences; or ii) it fails to provide for a means of escape for people in the event of a flood; or iii) it introduces residential living and sleeping accommodation below the estimated flood level; or iv) it introduces mobile homes or caravans; or v) it introduces new holiday accommodation between October and May.
The Medway Local Plan identifies the Proposed Development site as an existing employment area and the site adjacent as a proposed employment area.
The Council has started work on a new Local Plan, which, once adopted, will replace the current Medway Local Plan 2003. This will be a single document, containing strategic level and development management policies, land allocations, minerals and waste, and a policies map. The process of producing a new plan is anticipated to take around three years. The plan will cover the period up to 2035 and statutory consultation process for the Issues and Options Consultation Document is underway and will conclude on 29 February 2016.
3.3 Other Relevant Policy and Guidance
Medway Strategic Flood Risk Assessment (2012)
The SFRA was prepared to assist Medway Council in spatial planning decisions that are required to inform the Development Plan preparation. Existing information and additional hydraulic modelling was undertaken to identify the level of flood risk posed in the Borough. The SFRA reported that there was a residual tidal flood risk to urban areas in the event of a breach in the flood defences along the River Medway, but there is limited historical information with regards to surface and sewer flooding.
Medway Draft Local Flood Risk Management Strategy (2014)
The Medway Local Flood Risk Management Strategy11 (LFRMS) outlines the responsibilities of the Risk Management Authorities in Medway and how they are working in partnership to coordinate local flood risk management. This includes engagement with communities, preparing for floods, responding to flood events and collaborating on flood risk studies.
11 Capita Symonds and URS (2014) Medway Council Local Flood Risk Management Strategy. Final Report June 2014.

DHC2 Flood Risk Assessment 4-Feb-16
Page 11
4. Flood Risk 4.1 Sources of Flood Risk There are five potential sources of flooding at the DCH2 site. The dominant flood sources are:
• tidal flooding from the Medway Estuary and Damhead Creek;
• fluvial flooding from inland watercourses;
• site-related flooding (surface water runoff and sewers);
• overland flow from adjacent sites; and
• groundwater flooding.
The impacts that each may have on the site are discussed in detail in the following sections.
4.2 Tidal Flood Risk Flooding from tidal sources can occur through inundation of floodplains from rivers and watercourses, or inundation of areas outside the floodplain due to the influence of bridges, embankments and other features that artificially raise water levels and/or through the overtopping of defences.
Given the distance of the Site from the Thames Estuary (approximately 6.5 km to the north and 9 km to the east of the Site) it is considered unlikely that flooding from the Thames would impact the Site. The River Medway and Damhead Creek are both tidal watercourses in this location with the main tidal influence being the River Medway (Medway Estuary) and are included in this assessment of tidal flooding.
The Flood Zone maps produced by the Environment Agency, and shown in Figure 4.1, indicate an area within the south, west and north-west of the Site lies within Flood Zone 3 of the River Medway, representing land with a high risk of flooding from tidal or fluvial sources, whilst land to the east and north lies within Flood Zone 2, representing land with a medium risk of flooding from tidal or fluvial sources.
The Flood Zone Map shows the Site is located in an area that benefits from flood defences.
4.2.1 Flooding History
Data provided by the Environment Agency (Annex A) indicates that the Site is known to have flooded in 1953, prior to the installation of flood defences, when a tide level of 4.75 m AOD was recorded.
Both the SFRA and the PFRA state that flooding in the Medway area has also been recorded in 1927 (3.92m AOD), 1949 (4.54m AOD), 1960 (3.80m AOD), 1965 (4.60m AOD), 1978 (4.51m AOD) and 2005. The December 2005 event, a tidal surge caused low level flooding in parts of Rochester but had no impact at the site of the current Damhead Creek Power Station or the Proposed Development Site. There is no record of any flooding on the DHC2 site or adjacent land since the construction of the existing Power Station development in the late 1990s.

DHC2 Flood Risk Assessment 4-Feb-16
Page 12
Figure 4-1 Environment Agency Flood Extent Map
4.2.2 Modelled Flood Levels
The Environment Agency has provided defended modelled flood levels for the River Medway located relative to the Site for the 0.5% (1 in 200) AEP event. The modelled flood water levels for the River Medway have been taken from the detailed 2D Tuflow tidal modelling of the North Kent Coast, completed in August 2013. Table 4.1 shows details of the flood levels for the floodplain grid cells relevant to the Site for both the current day 0.5% AEP and 0.1% AEP tidal events and flood levels for the 0.5% AEP climate change scenarios for 2070 and 2115. Grid cell locations are shown in Annex A.
Table 4.1 Defended Modelled Tidal Flood Levels for the Site
Node ID Return Period Water Levels for AEP shown in mAOD
0.5% (2012) 0.5% (2070) 0.5% (2115) 0.1% (2012)
1 0.0 0.0 5.95 0.0
2 0.0 5.04 5.95 0.0
3 0.0 0.0 0.0 0.0
4 0.0 0.0 0.0 0.0

DHC2 Flood Risk Assessment 4-Feb-16
Page 13
Node ID Return Period Water Levels for AEP shown in mAOD
0.5% (2012) 0.5% (2070) 0.5% (2115) 0.1% (2012)
5 0.0 4.73 6.03 0.0
6 0.0 0.0 0.0 0.0
7 0.0 0.0 0.0 0.0
8 0.0 4.73 6.02 0.0
9 0.0 4.73 6.02 0.0
Table 4.1 confirms that taking into account the presence of defences the Site does not flood during both the 0.5% (2012) AEP and 0.1% (2012) AEP flood event.
4.2.3 Flood Defences
The Site is protected from flooding associated with tidal sources due to the presence of primary flood defences along the north bank of the River Medway, to the south of the existing Damhead Creek Power Station and to the east of the Proposed Development Site.
The Environment Agency has stated that “The site is currently defended to a 1 in 1000 year standard of protection. Defences are comprised of raised earth embankments and concrete sea walls. The Environment Agency does not currently have any planned improvement works to the defences in this area”.
The previous FRA undertaken for the Site indicates the general area within which the site lies is protected by primary sea defences with a crest elevation of 5.7 m AOD or higher. It is understood that the defences are under riparian ownership and responsibility for maintenance lies with the riparian owners.
In addition to the primary sea defences, the Proposed Development is protected by secondary earth bunds adjacent to the site, with a crest elevation of approximately 5.6 m AOD. These bunds provide further protection from tidal inundation to a standard of between a 0.5% and 0.1% AEP flood event. In addition, a substantial area to the north and east of the site (proposed for the development of the carbon capture and storage/laydown area) is situated above 6 m AOD due to large quantities of PFA deposited on the site from its former use as a landfill. Therefore, based on Tables 4-1 and 4-2, much of this site area is not considered at risk from flooding during a 0.1% AEP flood event.
The North Kent Rivers Catchment Flood Management Plan12 (CFMP) is a report which has been produced by the Environment Agency and identifies flood risk management policies to assist all key decision-makers in the catchment. The North Kent Rivers CFMP indicates that the Proposed Development falls within Sub-area 4 North Kent Marshes – Policy Option 3: areas of low to moderate flood risk where the Environment Agency is generally managing existing flood risk effectively. This policy tends to be applied where the risks are currently appropriately managed and where the risk of flooding is not expected to increase significantly in the future.
Tidal flooding represents the most significant risk to the Site but the risk of tidal flooding is considered to be low as the Site is protected to the 0.1% AEP indicative standard.
Overtopping and Breaching of Defences
As the Site is afforded protection from defences up to the 0.1% AEP flood event, the primary risk from tidal sources is the residual risk from overtopping and/or failure of the defences.
12 Environment Agency (2009) The North Kent Rivers Catchment Flood Management Plan. Summary Report December 2009

DHC2 Flood Risk Assessment 4-Feb-16
Page 14
A breach analysis was undertaken as part of the Medway SFRA however the analysis concentrates largely on allocated development sites within the residential areas around Rochester and Chatham. Although inundation maps have been produced for these breaching scenarios, these do not extend as far downstream as the Site of the proposed power station.
The Site is protected by both primary sea defences and secondary earth embankments and it would take a breach of both the primary and secondary defences to cause inundation into the site.
As part of their consultation response the Environment Agency have stated, “Depending on the type of development proposed we would not necessarily expect breach modelling to be provided. An FRA for the site would need to consider the residual risk of flooding in defended areas. Reference to the undefended flood levels may aid in this assessment”.
Table 4.2 presents the undefended modelled flood water levels for the River Medway for the floodplain grid cells relevant to the Site for the 0.5% (1 in 200) AEP event. Grid cell locations are shown in Annex A.
Table 4.2 Un-Defended Modelled Tidal Flood Levels for the Site
Node ID Return Period Water Levels for AEP shown in mAOD
0.5% (2012) 0.5% (2070) 0.5% (2115) 0.1% (2012)
1 0.0 0.0 5.97 0.0
2 4.91 5.35 5.97 5.29
3 0.0 0.0 0.0 0.0
4 0.0 0.0 0.0 0.0
5 4.94 5.35 5.99 5.31
6 0.0 0.0 0.0 0.0
7 0.0 0.0 0.0 0.0
8 4.92 5.35 5.99 5.30
9 4.92 5.35 5.99 5.30
In the unlikely event that both primary and secondary defences were to fail information in Table 4.2 provides an indication as to the extent of flooding at the Site. Should a breach in the flood defences occur grid cells 5, 8 and 9 are inundated during a 0.5% AEP flood event. These grid cells (5, 8 and 9) represent Area 1 (the main DHC2 area) within the Site boundary as shown in Figure 2.2.
Ground levels in these areas of the Site are approximately 2.1 – 6.8 m AOD therefore the maximum depth of flooding, to the south of the DHC2 site, would be approximately 2.84 m. Area 3 (the CCS land and ecological mitigation area) remains unaffected as ground levels are above the modelled flood water levels for this event.
4.3 Fluvial Flood Risk Fluvial flooding most commonly occurs after intense or heavy rainfall when any water that falls will naturally migrate toward the nearest river or stream. Where there are instances of especially heavy or long term rain the volume of water may exceed the channel capacity of the river downstream resulting in water levels exceeding the height of the river bank.
DHC2 Flood Risk Assessment 4-Feb-16
Page 15
A land drainage ditch/small watercourse enters the Site from the north (Area 3) which flows from north to south. At the south east Site boundary this drain then turns west, flowing adjacent to the southern Site boundary and continuing west along the boundary of the exiting Damhead Creek Power Station. The ditch runs through the Kingsnorth site before turning north and discharging into the River Medway.
The ditches vary from 2.0 m to 2.5 m wide and approximately 1.5 m to 2.0 m deep. OS mapping suggests that this drainage ditch flows to a drain to the west of the Kingsnorth Power Station and outfalls via a sluice to the River Medway approximately 0.9 km south west of the Site.
The catchment area of the drainage pipe and ditch is relatively small, accepting flows from the Site, the adjacent existing Damhead Creek Power Station and a small area to the north. Given the dimensions of the ditch and the limited catchment area it is considered that any flooding would remain local to the drainage corridor and would be shallow in depth. The risk of flooding from fluvial sources is therefore considered to be low. The open areas of ditch have recently been dredged to allow easier flow.
4.4 Flooding from Artificial Sources The Environment Agency’s Risk of Flooding from Reservoirs Mapping shows that there is no residual risk of flooding from a large reservoir in the event of a structural failure or breach. The Reservoir Act defines a large reservoir as one that holds over 25,000 cubic metres (m3) of water, although under the Flood and Water Management Act this has been reduced to 10,000 m3.
There are no canals located in close proximity to the Site.
It is considered that the site is at low risk of flooding from artificial sources.
4.5 Groundwater Flooding Groundwater flooding can occur when groundwater levels rise above ground surface levels. The underlying geology has a major influence on where this type of flooding takes place; it is most likely to occur in low-lying areas underlain by permeable rocks (aquifers).
British Geological Survey (BGS) information shows that superficial geology beneath the majority of the Site comprises Alluvium - clay, silty, peaty, sandy deposits. A small area to the west and north is underlain with River Terrace Deposits comprising clay and silt. Environment Agency groundwater maps show that the superficial deposits at the Site are designated as Secondary Undifferentiated. This is assigned in cases where it has not been possible to attribute either category A or B to a rock type. In most cases, this means that the layer in question has previously been designated as both minor and non-aquifer in different locations due to the variable characteristics of the rock type.
The Site is underlain by a bedrock geology comprising clay and silt of the London Clay Formation overlying Upper Chalk base rock. Environment Agency groundwater maps show that the London Clay beneath the Site is designated as a non-aquifer. Non-aquifers are described as formations which are generally regarded as containing insignificant quantities of groundwater and are therefore unimportant for abstraction or supplying base flow to rivers. The Upper Chalk is designated a Principal Aquifer. These are layers of rock or drift deposits that have high intergranular and/or fracture permeability - meaning they usually provide a high level of water storage. They may support water supply and/or river base flow on a strategic scale.
Section 15 of the 2009 Damhead Creek 2 Environmental Statement13 reports “groundwater was observed under Area 1 in the Phase 2 intrusive ground investigation at depths ranging from 3.0 to 9.5 m below ground level (bgl), from where the levels rose to between 1.45 m and 4.70 m bgl over a period of 20 minutes.
Groundwater was observed under Areas 2 and 3 during the Phase 2 Intrusive Site Investigation at depths between 1.62 – 7.05 m bgl during two monitoring rounds. The relatively high groundwater levels are likely to be due to the close proximity of the site to Damhead Creek, and as such, the two are most likely in hydraulic continuity. Standpipes recorded a tidal variation of approximately 0.10 m in the groundwater”.
13 Parsons Brinkerhoff (2009) Scottish Power Damhead Creek 2 Environmental Statement Volume 1

DHC2 Flood Risk Assessment 4-Feb-16
Page 16
The Site does not lie within a Groundwater Source Protection Zone.
There are no historical records of groundwater flooding in the SFRA and the PFRA states that “no historic data is available for local groundwater flood events”.
Areas Susceptible to Groundwater Flooding (AStGWF) is a strategic scale map showing groundwater flood areas on a 1 km square grid. It was developed specifically by the Environment Agency for use by LLFAs for use in PFRA as required under the Flood Risk Regulations. The AStGW map shows the site is not located in an area susceptible to groundwater flooding.
Based on this information, the risk of flooding at the Site from groundwater sources is low.
4.6 Pluvial Flooding Overland flow results from rainfall that fails to infiltrate the surface and travels over the ground surface; this is exacerbated where the permeability of the ground is low due to the type of soil and geology (such as clay soils) or urban development with impermeable surfaces.
The Site is currently undeveloped, comprising a combination of hardstanding and grassland. It is not known if the areas of hardstanding are connected to a formal drainage system, therefore it is assumed that surface water run-off from these areas drain to the surrounding local drainage ditches and grassland and the site therefore drains via natural processes, i.e. infiltration to ground.
The site of the proposed Damhead Creek 2 plant is surrounded by earth bunds to the west, south and east therefore; the site is well protected from overland surface flooding from adjacent sites and is, in effect, self-contained. Land to the east has been previously raised to above 5.3 m AOD through the artificial deposition of PFA and is higher than the surrounding land preventing surface water run-off entering the Site.
The Environment Agency published the updated Flood Maps for Surface Water (uFMfSW) in December 2013. The maps indicate areas at risk from surface water flooding, when rainwater does not drain away through the normal drainage systems or soak into the ground, but instead pools on or flows over the ground. The mapping can be viewed on the Environment Agency website. It indicates that overall the Site is considered to be a very low to low risk of surface water flooding.
The site is considered to be at very low risk of flooding from pluvial sources.
4.7 Flooding from Drainage Infrastructure Sewer and surface water flooding are often interconnected; insufficient drainage capacity in the sewer network can result in extensive surface water flooding and, by the same rationale, large volumes of surface water can overload the public sewers, causing the sewer network to back up, surcharge and ultimately flood.
No underground asset information has been received for the development Site and therefore no information is available regarding the private drainage network within the Site.
The Site currently comprises a mixture of permeable and impermeable areas and, with the exception of one private drainage pipe, it is understood that there is no formal drainage within Site Areas 1 and 3. Permeable areas will drain via natural methods (i.e. infiltration to ground) whilst surface water from the impermeable areas will run-off and drain via the permeable Site areas. Area 2 comprises hardstanding and it is assumed that this area drains to the wider surrounding industrial estate drainage system.
The 2012 Proposed Drainage Scheme Report14 states that “the Site drains into surface ditches primarily located around the Site. The ditches vary from 2.0 m to 2.5 m wide and approximately 1.5 m to 2.0 m deep”.
The 2012 Proposed Drainage Scheme Report also notes that at the southeast corner of the existing Damhead Creek power station, a discharge pipe is located below the earth bund/headwall discharging process waste and surface runoff into Damhead Creek/ River Medway from the existing Damhead Creek power station. 14 ScottishPower (2012) Damhead Creek 2 Power Station Proposed Drainage Scheme Report

DHC2 Flood Risk Assessment 4-Feb-16
Page 17
There are no historical records of flooding from drainage infrastructure in the Medway SFRA and historical flood records based on postcode data provided by Southern Water to inform the PFRA indicate no drainage infrastructure flooding at or near the Site or in the wider area.
Based on this information the risk of flooding from drainage infrastructure is considered to be low.

DHC2 Flood Risk Assessment 4-Feb-16
Page 18
5. Climate Change 5.1 Context Environment Agency climate change guidance for the NPPF15 indicates that climate change is likely to have an impact on river flows, sea levels, rainfall intensity, wave height and wind speed. Therefore, the risk of flooding is likely to increase in the future and precautionary climate sensitivity ranges from the Environment Agency guidance are shown below in Table 5.1.
Table 5.1 Recommended Contingency Allowances for Climate Change
Parameter 1990 - 2025 2025 - 2055 2055 - 2085 2085 - 2115
Peak rainfall intensity +5% +10% +20% +30%
Peak river flow +10% +20%
Net sea level rise (East of England, East Midlands, London, SE England (south of Flamborough Head))
4.0 mm 8.5 mm 12 mm 15 mm
Extreme Wave Height +5% +10%
The outputs of the UK Climate Projections (UKCP09)16 climate change scenarios are indicative of a shift towards wetter winters over the whole of England by as much as 20% by the 2050s (Murphy et al., 2009). Shifts in seasonal patterns of rainfall are also expected, with summer and autumn becoming much drier than at present. Snowfall amounts are anticipated to decrease significantly throughout the UK, but the number of rain-days and the average intensity of rainfall are expected to increase.
5.2 Tidal Flooding The impact of climate change on flood levels within the Site for the years 2070 and 2115 are presented in Table 4.1 and Table 4.2. The operational life time of the development will be of the order of 35 years therefore a climate change horizon of 2070 has been used to assess the impact of climate change on the Proposed Development.
Based on the predictions of the tidal modelling of the North Kent Coast, the data in Table 4.2 indicates that the risk of fluvial flooding to the Site as a result of climate change will increase. Table 4.2 shows grid cells 2, 5, 8 and 9 (Areas 1 and 2) are flooded to a maximum level of approximately 5.3m AOD (Grid Cell 2). However, the general area within which the site lies is protected by primary sea defences with a crest elevation of 5.7 m AOD or higher and in addition to the primary sea defences, the Site is protected by secondary bunds adjacent to the site, with a crest elevation of circa 5.6 m AOD, therefore the impact of climate change is not expected to impact the Site over the lifetime of the development.
The Site is located within the Medway Estuary and Swale Shoreline Management Plan17 Policy Unit E4-03 Kingsnorth Power Station where the proposed policy approach over the next 100 years is to hold the line and to continue to protect the area and improve the defences that protect existing development.
It is considered that the existing defences will be maintained to an appropriate standard to keep providing protection to the area.
15 Environment Agency (2013) Climate change allowances for planners, September 2013 16 Defra (2009) UK Climate Projections (UKCP09) Briefing Summary 17 Halcrow (2010) Medway Estuary and Swale Shoreline Management Plan

DHC2 Flood Risk Assessment 4-Feb-16
Page 19
5.3 Fluvial Flooding There is no data available for the drainage pipe and ditch within the Site boundary that demonstrate the potential effects of climate change; however, Table 5.1 indicates fluvial peak flows may increase by up to 20% over the lifetime of the development.
The Proposed Development is classed as at low risk of flooding from fluvial sources and it is considered unlikely that any change to the magnitude of fluvial flooding will present a significant hazard to the Proposed Development.
5.4 Groundwater The predicted increase in the wetness of winters and the intensity of storm events could impact the groundwater level fluctuations at the Site and possibly increase the level of the water table. As the likelihood of groundwater emergence under the climate change scenario is likely to increase, the potential for groundwater flooding to impact infrastructure will also increase.
The Proposed Development is classed as at low risk of flooding from groundwater sources and it is considered unlikely that any change in groundwater levels will present a significant hazard to the Proposed Development.
5.5 Sewers It is difficult to predict precisely the impact of climate change on sewer flooding; however, the anticipated increase in rainfall intensity may cause greater volumes of rainfall to enter the foul/ combined and surface water sewer network during storm events.
AECOM does not anticipate that the risk from the wider sewer system would increase significantly to the point that it would pose a risk to the Site from the wider area; therefore the risk of sewer flooding will remain low.
5.6 Surface Water Run-off Generation and Overland Flow An increase in rainfall intensity will increase surface water runoff rates and volumes, however, as indicated in Section 4.6 the risk from this source of flooding is considered to be very low to low.
Climate change must be taken into account when considering surface water runoff generated by development sites. This is usually represented by increasing the peak rainfall intensities. An increase in intensity will increase surface water runoff rates and volumes and therefore the design of the Site’s drainage infrastructure will need to take this into account in accordance with the guidance of the NPPF, the Environment Agency and the SFRA.
DHC2 Flood Risk Assessment 4-Feb-16
Page 20
6. Proposed Flood Risk Management Measures
6.1 Mitigation against Tidal Flooding As discussed in Section 4.2, flood defences along the River Medway protect the Site against tidal flooding (based on still water levels) for events that have a 0.5% annual probability of occurring. Since the application site is protected from flooding through extensive primary and secondary flood defences, the risk of tidal flooding is considered to be low.
The undefended modelled flood water levels in Table 4.2 suggest that the Site is at risk of being flooded to significant depths (>0.5 m) in the event of a breach in both the primary and secondary defences. Although the risk to the Site in the event of a breach is high, the probability of a breach occurring is considered to be very low.
A Flood Warning and Evacuation Plan (FWEP) will be prepared for the combined site when the Damhead Creek 2 station is built. A flood warning procedure is already in place for the existing power station to ensure those present have enough time to evacuate the site should a significant flood risk occur. A FWEP will be prepared for both the construction and operational phases of the new development.
ScottishPower currently subscribe to the Environment Agency’s Flood Warning Service in the area. If notified of a possible flood event ScottishPower shut mitigation land drainage valves are to prevent backflow flooding within the site. Areas 1 and 2 within the Site boundary sit within the ‘Tidal River Medway and Medway Estuary’ Flood Warning Area.
The Flood Warning Area has two levels of warning codes:
• Flood Alert; and
• Severe Flood Warning.
Tidal flood warnings are issued based on forecast information, and therefore the lead time provided is longer than that provided for fluvial flooding. The Environment Agency aim to issue tidal Flood Warnings a minimum of 6 hours in advance, but depending on confidence in the forecast they could be issued 24 or even 36 hours in advance.
Tidal flood warnings are triggered by a combination of forecast high water (astronomical tide level plus any additional surge), forecast wind speed, and forecast wind direction. Due to the flood defences in place, it is quite rare that Flood Warnings are issued for tides. It is more common to issue the lower-level Flood Alerts, which are issued when the Environment Agency expect wave splash and wind-blown spray to cause localised pooling of water on land but no actual flooding of properties.
The Environment Agency issues direct flood warnings using their Flood Warnings Direct system (FWD). FWD is a computerised system which issues voice messages, faxes, pager and text messages. On receipt of a ‘Flood Alert’ warning from the FWD, the occupants at the Site are made aware of the possibility of flooding and prepare for possible evacuation. The scaling down of activities at the Site at this time is also be considered. On receipt of a ‘Severe Flood Warning’, the Site would be evacuated.
6.2 Mitigation against Fluvial Flooding The Site is considered to be at low risk of fluvial flooding, therefore no mitigation has been recommended.
6.3 Mitigation against Artificial Flooding The Proposed Development site is considered to be at low risk of artificial flooding. No further mitigation measures would therefore be required to manage the risk of artificial flooding to the Proposed Development.

DHC2 Flood Risk Assessment 4-Feb-16
Page 21
6.4 Mitigation against Groundwater Flooding The Proposed Development site is considered to be at low risk of groundwater flooding. No further mitigation measures would therefore be required to manage the risk of groundwater flooding to the Proposed Development.
6.5 Mitigation against Pluvial Flooding and from Drainage Infrastructure The risk from pluvial flooding and from drainage infrastructure is considered to be low at the site and the flood risk associated with pluvial flooding, presented in Section 4.6, is likely to remain the same following redevelopment of the site.
As a precaution, flood resilience measures can be incorporated into the development to minimise the amount of damage and reduce the recovery time in the unlikely case of the site becoming inundated. AECOM recommends that during construction the opportunity be taken, where possible, to adopt flood resilient design techniques for the Proposed Development (e.g. flood sensitive equipment raised a minimum of 600 mm above surrounding ground levels etc.).

DHC2 Flood Risk Assessment 4-Feb-16
Page 22
7. Surface Water Management The NPPF requires that the new development should not increase flood risk both on the Site and in the area surrounding it. Surface water runoff should therefore not exceed the volumes already generated by the existing site and betterment should be provided where possible.
Both the NPPF and the Medway SFRA include guidance that promotes the use of SuDs within new developments.
7.1 Existing Conditions The existing site is approximately 309,000 m2 (30.9 ha) of which approximately 47,000 m2 (4.7 ha) comprises impermeable surfacing (concrete and hardstanding). The remaining site area (262,000 m2/26.2 ha) comprises grass and soft landscaping and therefore drains at greenfield rates via natural infiltration to ground. Table 7.1 provides a breakdown of the Site areas and surfacing.
Table 7-1 Site Areas and Surfacing
Area No. Permeable Area (ha) Impermeable Area (ha) Total Area (ha)
1 9.5 0.6 10.1
2 0.0 4.1 4.1
3 16.7 0.0 16.7
No formal drainage information is available for the Site but it is assumed that the small area of hardstanding within Area 1 drains to the surrounding grassed areas and therefore drains at greenfield rates. The impermeable surfacing within Area 2 drains to a private drainage system within the wider industrial estate and enters the drain that runs adjacent to the access road to the east of this area and then runs through the ScottishPower mitigation land and eventually out through the sea wall to Damhead Creek.
Existing Runoff from the Site
The Scottishpower land holding to the north, shaded purple in Figure 2-2 above, forms part of the red line boundary for the Site but will not be developed initially as part of this planning application and therefore it is assumed that surface water drainage from this area of the Site will continue to drain via existing methods. The land will be retained for future CCS plant, should it ever be required, as part of this planning application.
The grey and orange areas (26.8 ha) shown in Figure 2-2 form the main areas of development for DHC2 and comprises approximately 0.6 ha of hardstanding and 26.2 ha of grassland which drains at the greenfield run-off rate. The approximate surface water runoff from the existing impermeable area has been calculated using the Wallingford Procedure, which uses a modified version of the rational method to estimate runoff based on the nature of the ground surface (hard standing, vegetation etc.) and rainfall depth, duration and frequency information for the immediate area. A runoff coefficient of 0.85 for hard standing has been used for the impermeable area.
Existing runoff values for the existing hardstanding area in these areas is shown in Table 7-2 as a function of associated rainfall values (Table 7-3).

DHC2 Flood Risk Assessment 4-Feb-16
Page 23
Table 7-2 Approximate Surface Water Runoff Rates for the Existing Site Areas 1 and 3) (litres/second)
Storm Durations (hr)
0.25 0.5 1 2 3 5 12 24 48
1.1 30.4 19.8 12.8 8.3 6.4 4.6 2.6 1.6 1.0 2 49.6 31.2 19.5 12.1 9.1 6.4 3.4 2.2 1.5 5 74.0 45.7 27.9 17.0 12.6 8.7 4.6 2.9 1.9 10 96.4 58.7 35.5 21.3 15.7 10.7 5.6 3.5 2.2 30 143.8 85.9 50.9 29.9 21.9 14.7 7.4 4.6 2.9 50 172.6 102.2 60.0 34.9 25.4 17.0 8.5 5.2 3.2 100 220.8 129.2 74.9 43.1 31.1 20.6 10.1 6.2 3.7
100+5% 231.8 135.6 78.6 45.3 32.7 21.7 10.6 6.5 3.9 100+10% 242.9 142.1 82.4 47.4 34.2 22.7 11.2 6.8 4.1 100+20% 264.9 155.0 89.9 51.7 37.4 24.7 12.2 7.4 4.5 100+30% 287.0 167.9 97.4 56.0 40.5 26.8 13.2 8.0 4.9
Table 7-3 Rainfall Values18
Storm Durations (hr)
0.25 0.5 1 2 3 5 12 24 48
1.1 5.4 7.0 9.0 11.7 13.5 16.3 22.3 27.8 34.6 2 8.8 11.0 13.8 17.0 19.3 22.4 29.1 38.0 49.5 5 13.1 16.1 19.7 24.0 26.8 30.8 38.8 49.8 63.7 10 17.0 20.7 25.0 30.0 33.3 37.9 47.1 59.5 75.2 30 25.4 30.3 35.9 42.2 46.3 51.9 62.9 78.0 96.6 50 30.5 36.1 42.3 49.3 53.8 60.0 71.8 88.3 108.3 100 39.0 45.6 52.9 60.9 65.9 72.8 85.9 104.3 126.5
100+5% 40.9 47.9 55.5 63.9 69.2 76.4 90.2 109.5 132.8 100+10% 42.9 50.1 58.1 66.9 72.5 80.1 94.5 114.7 139.1 100+20% 46.8 54.7 63.4 73.0 79.1 87.3 103.0 125.1 151.7 100+30% 50.6 59.3 68.7 79.1 85.7 94.6 111.6 135.6 164.4
In accordance with Table 7-2, the 100 year return period storm with 15 minute duration would yield a runoff value of 220.8 l/s from a 0.6 ha impermeable area.
7.2 Policy and Stakeholder Requirements There are a number of national and regional policy requirements which need consideration in the design of any drainage strategy for this site to ensure that the development will be sustainable and can, if possible, contribute to a decreased flood risk elsewhere. These are outlined below.
National Planning Policy Framework
The NPPF requires that the new development should not increase flood risk both on the site and in the area surrounding it. Surface water runoff should therefore not exceed the volumes already generated by the existing site and betterment should be provided where possible.
18 Data from: FEH CD-ROM V3 – DDR rainfall modelling (1km2 grid cell) for the site co-ordinates

DHC2 Flood Risk Assessment 4-Feb-16
Page 24
Building Standards Regulations 2000 Part H
The Building Standards Regulations 2000 Part H19 requires that surface water runoff be preferentially discharged first to soakaway, then to surface watercourse and finally to sewer.
Environment Agency
The EA Advisory Comments sets out the requirements for surface water drainage for development sites:
1) Drainage from new developments must not increase flood risk on-site or elsewhere;
2) Runoff should not exceed that of the existing site;
3) Flooding of open spaces during the 30 year rainfall event is acceptable for short periods of time and no flooding of property should occur for the 1 in 100 year rainfall event; and,
4) Sustainable drainage techniques should be used wherever possible.
7.3 Proposed Conceptual Strategy
Restricted Surface Water Runoff Rate
Following completion of the Proposed Development, the area of impermeable surfacing within the main development area (10.4 ha DHC2 development area shaded grey in Figure 2-2) will increase from 0.6 ha to approximately 6.8 ha (worst case scenario based on the layout and associated permeable and impermeable areas as shown in Annex D) and as a consequence of this surface water run-off from the Site, if not managed, will increase. The remaining Site area will remain as permeable soft landscaping.
Consultation with Medway Council has stated that run-off from developed areas of the Site, as a rule of thumb, should be restricted to the greenfield runoff rate of approximately 7 litres per second per hectare. Based on this greenfield run-off rate the restricted surface water discharge has been calculated as follows:
• Impermeable area of 6.8 ha x 7 l/s = 47.6 l/s
Sustainable Drainage Systems
There are a number of SuDS options which could be utilised to both manage and attenuate runoff, however, consideration of site characteristics must be made to ensure that the drainage system is compatible. The NPPF and the Environment Agency encourage the use of such systems where practicable, to ensure a reduction in flood risk to the site and elsewhere, and to provide water quality benefits.
It is likely, based on ground conditions across the majority of the Site (underlaid with Alluvium) that infiltration based SuDs methods would be unsuitable, however SuDs such as storage/ attenuation basins and closed pervious paving systems should be considered.
Surface Water Attenuation Volumes
In order to limit the discharge of surface water runoff to the Greenfield runoff rate of 7 l/s/ha, surface water attenuation will be required.
A restriction rate of 47.6 l/s has been used in Micro Drainage modelling software to calculate an indicative storage volume that would be required to store surface water for rainfall events up to the 1% AEP storm event plus climate change (30%) based on a 15 minute duration rainfall event.
A storm water basin will be provided to the south east of the Proposed Development to attenuate surface water runoff from the impermeable areas to the greenfield runoff rate, similar to the storm water attenuation system used for the DHC1 power station. The attenuation storage will be sized accordingly 19 Office of the Deputy Prime Minister (2002) The Building Regulations 2000, Drainage and Water Disposal (Approved Document
H)

DHC2 Flood Risk Assessment 4-Feb-16
Page 25
to provide storage for all storms up to and including the 1% AEP (1 in 100 year) critical duration storm event plus climate change (30%) before being pumped into the Damhead Creek.
WinDes modelling software was used to estimate the total storage volumes required on Site. Detailed surface water modelling will be required as part of the detailed Site design and the figures below are provided only as an indication of the volumes likely to be required.
Table 7-4 presents the minimum and maximum storage volume results obtained.
Table 7-4 Indicative Attenuation Storage Requirements
Return Period (AEP) Minimum Storage Volume (m3)
Maximum Storage Volume (m3)
1% 2577 3506
1% + 30% climate change allowance 3591 4858
During the detailed design phase it may be possible to identify methods to decrease the total impermeable area within the built development from that assumed. For example, as a worst case scenario hardstanding has been assumed beneath the Air Cooler Condenser Unit but in practice it is likely to be gravel or stone to minimise noise from the coolers. Measures such as thisand minimising hard standing in other parts of the site will therefore decrease the volume of storm water attenuation required in the storm water basin.

DHC2 Flood Risk Assessment 4-Feb-16
Page 26
8. Off-Site and Residual Risks
8.1 Off-Site Impacts The drainage strategy provides storage for up to and including the 1% AEP storm event with a 30% allowance for climate change. This will ensure that the scheme will not increase flood risk elsewhere and should provide betterment over the existing situation. The proposed surface water drainage strategy will therefore meet with the requirements of the NPPF.
It is considered that the Proposed Development will not result in any significant offsite flood risk impacts.
8.2 Residual Risks There is a residual risk of flooding from a breach in the tidal flood defences. The Site is protected by both primary sea defences and secondary earth embankments and it would take a breach of both the primary and secondary defences to cause inundation into the site. The probability of this occurring is very low due to regular inspection of the defences to ensure that they remain fit for purpose.
A further residual risk to the Site is from the surface water management scheme; this may be due to exceedance of the design event and/or failure of the drainage system. The proposed drainage strategy provides storage for up to and including the 1% AEP storm event with a 30% allowance for climate change however, if a storm event was to occur that exceeds this capacity (e.g. 0.66% and 0.5% AEP return period rainfall events) flooding from the drainage system may occur.
Regular maintenance of the drainage system should be undertaken to ensure that the system continues to perform as designed. ScottishPower will adopt the SUDS features once operational and it will be the responsibility of ScottishPower to make sure that the SUDS features are regularly inspected and maintained to ensure their design standard is not compromised over the lifetime of the development.
To manage the risk from exceedance flows, the drainage design will need to follow such guidance as CIRIA C63520 to provide flow paths such that any overland flow is directed away from impacting the proposed development.
20 Balmforth D, Digman C, Kellagher R, Butler D (2006), Designing for Exceedance in Urban drainage – Good practice, (CIRIA
635)
DHC2 Flood Risk Assessment 4-Feb-16
Page 27
9. Conclusions
The following conclusions can be made with regards to flood risk to the Site and as a result of the Proposed Development:
• The Environment Agency Flood Zone mapping identifies the Site to be located within Flood Zone 2 and Flood Zone 3, which equates to a medium to high risk of tidal flooding;
• The Site is afforded protection by primary and secondary tidal flood defences up to the 0.1% AEP flood event, as can be seen in the Environment Agency mapping. Therefore the actual risk of flooding from tidal sources is considered to be low;
• There is a residual risk of flooding from a breach in the tidal flood defences. Despite this, the likelihood of a breach occurring in both the primary and secondary flood defences during the same flood event is very low due to regular inspection of the defences to ensure that they remain fit for purpose and maintenance by the riparian owners;
• The risk of fluvial flooding from the drainage ditch within the Site and adjacent to the southern Site boundary is considered to be low;
• Based on the predictions of the tidal modelling of the North Kent Coast, the risk of fluvial flooding to the Site as a result of climate change will increase. However, the general area within which the site lies is protected by primary sea defences with a crest elevation of 5.7 m AOD or higher and in addition to the primary sea defences, the Site is protected by secondary bunds adjacent to the site, with a crest elevation of circa 5.6 m AOD, therefore the impact of climate change is not expected to impact the Site over the lifetime of the development (approximately 35 years).
• The risk of flooding from groundwater is considered to be low;
• The Site is considered to be at low risk of flooding from sewers;
• The Site is at low risk of flooding from artificial sources;
• The Site is at low risk of flooding from surface water.
• A conceptual surface water drainage strategy is included within this FRA to support the application and this incorporates suitable SUDS. Surface water runoff from hardstanding areas within the development area will be limited to a greenfield runoff rate of 7 l/s/ha;
• Areas within the Site that remain as permeable soft landscaping (grassland etc.) will continue to drain at the greenfield rate as the existing scenario;
• The required surface water attenuation could be provided via a storm water basin located to the south east of the Site although this will be confirmed at the detailed design stage. Attenuation storage will be provided up to the 1% AEP + 30% climate change and will be pumped to Damhead Creek and/ or local drainage ditches internal to the Site at the restricted rate of 47.6 l/s (or less). The actual discharge rate will be determined during final design and agreed as part of the Environmental Permit for the facility;
• The residual risk posed to the Proposed Development will be managed by a combination of the following measures:
− subscription to the Environment Agency Flood Warnings Direct Service; − flood resilience measures (being measures that minimise damage and reduce the recovery
time following a flood) will be incorporated, where possible, to adopt flood resilient design techniques for the Proposed Development (e.g. flood sensitive equipment raised a minimum of 600 mm above surrounding ground levels etc.);
DHC2 Flood Risk Assessment 4-Feb-16
Page 28
− flood-proofing or flood resistance (being measures to exclude water from specific compartments, plant or other equipment that would otherwise be sensitive to flooding, but which cannot be placed above the level of an anticipated flood); and
− a Flood warning and Evacuation Plan (FWEP) will be extended to include the new development. The FWEP will include details of evacuation procedures to be implemented if the risk of a breach is considered high, identify evacuation routes and provision of safe refuge in the event staff are unable to be safely evacuated, and will consider both construction and operational phases.
• The proposed development is a variation to an existing consent and is located on a brownfield site owned by the applicant, which is located within an area identified for employment in the Medway Local Plan. The proposed power station use is classed as ‘Essential Infrastructure’ in line with NPPF, which is considered appropriate within Flood Zone 3; therefore it is considered that the Propose Development passes the Sequential Test.
• It is considered that the Proposed Development will provide the local area and region with wider socio-economic benefits (employment of local people and sourcing of local goods, services and contractors, and indirect employment benefits etc.) and also provides electricity generation that strengthens the local and regional grid network, which, in turn, underpins the development of other services within the south east region. It is therefore considered that the Proposed Development passes the Exception Test
This FRA provides the evidence and serves to demonstrate that the Proposed Development will remain safe during its lifetime, will not increase flood risk and is, therefore, considered to be acceptable in flood risk terms.

DHC2 Flood Risk Assessment 4-Feb-16
Page 29
Limitations
AECOM Infrastructure & Environment UK Limited (hereafter referred to as AECOM, formerly known as URS) has prepared this Report for the sole use of ScottishPower DCL Limited (“Client”) in accordance with the Agreement under which our services were performed. No other warranty, expressed or implied, is made as to the professional advice included in this Report or any other services provided by AECOM. This Report is confidential and may not be disclosed by the Client nor relied upon by any other party without the prior and express written agreement of AECOM.
The conclusions and recommendations contained in this Report are based upon information provided by others and upon the assumption that all relevant information has been provided by those parties from whom it has been requested and that such information is accurate. Information obtained by AECOM has not been independently verified by AECOM, unless otherwise stated in the Report.
The methodology adopted and the sources of information used by AECOM in providing its services are outlined in this Report. The work described in this Report was undertaken between October 2014 and December 2015 and is based on the conditions encountered and the information available during the said period of time. The scope of this Report and the services are accordingly factually limited by these circumstances.
Where assessments of works or costs identified in this Report are made, such assessments are based upon the information available at the time and where appropriate are subject to further investigations or information which may become available.
AECOM disclaim any undertaking or obligation to advise any person of any change in any matter affecting the Report, which may come or be brought to AECOM’s attention after the date of the Report.
Certain statements made in the Report that are not historical facts may constitute estimates, projections or other forward-looking statements and even though they are based on reasonable assumptions as of the date of the Report, such forward-looking statements by their nature involve risks and uncertainties that could cause actual results to differ materially from the results predicted. AECOM specifically does not guarantee or warrant any estimate or projections contained in this Report.
Where field investigations are carried out, these have been restricted to a level of detail required to meet the stated objectives of the services. The results of any measurements taken may vary spatially or with time and further confirmatory measurements should be made after any significant delay in issuing this Report.
Copyright
© This Report is the copyright of AECOM Infrastructure & Environment UK Limited, a wholly owned subsidiary of AECOM. Any unauthorised reproduction or usage by any person other than the addressee is strictly prohibited
DHC2 Flood Risk Assessment 4-Feb-16
Page 30
Annex A – Data Consultation
Orchard House, Endeavour Park, London Road, Addington, West Malling, Kent, ME19 5SH. Email: [email protected]
Product 4 (Detailed Flood Risk) for: Damhead Creek Requested by: Joanne Somerton - AECOM Reference: KSL151124/KR58 Date: 11 December 2015 Contents
• Flood Map Confirmation • Flood Map Extract • Model Output Data • Data Point Location Map • Modelled Flood Outlines Map • Defence Details • Historic Flood Data • Historic Flood Event Map • Additional Data • Environment Agency Standard Notice
The information provided is based on the best data available as of the date of this letter. You may feel it is appropriate to contact our office at regular intervals, to check whether any amendments/ improvements have been made to the data for this location. Should you re-contact us after a period of time, please quote the above reference in order to help us deal with your query. This information is provided subject to the enclosed notice which you should read.

Orchard House, Endeavour Park, London Road, Addington, West Malling, Kent, ME19 5SH. Email: [email protected]
Flood Map Confirmation The Flood Map: Our Flood Map shows the natural floodplain for areas at risk from river and tidal flooding. The floodplain is specifically mapped ignoring the presence and effect of defences. Although flood defences reduce the risk of flooding they cannot completely remove that risk as they may be over topped or breached during a flood event. The Flood Map indicates areas with a 1% (0.5% in tidal areas), Annual Exceedance Probability (AEP) - the probability of a flood of a particular magnitude, or greater, occurring in any given year, and a 0.1% AEP of flooding from rivers and/or the sea in any given year. The map also shows the location of some flood defences and the areas that benefit from them. The Flood Map is intended to act as a guide to indicate the potential risk of flooding. When producing it we use the best data available to us at the time, taking into account historic flooding and local knowledge. The Flood Map is updated on a quarterly basis to account for any amendments required. These amendments are then displayed on the internet at www.gov.uk/prepare-for-a-flood. At this Site: The Flood Map shows that this site lies within the outline of the 0.5% chance of flooding in any given year from the sea. Enclosed is an extract of our Flood Map which shows this information for your area. Method of production The Flood Map at this location has been derived using detailed tidal modelling of the North Kent Coast, completed in August 2013.

© Environment Agency Copyright and/or database rights 2015. All rights reserved. © Crown copyright and database rights 2015.All rights reserved. Ordnance Survey licence number 100026380.Contact us: National Customer Contact Centre, PO Box 544, Rotherham, S60 1BY. Tel: 03708 506 506. Email:[email protected]
0 250 500
Meters
Scale 1:10,000
¯Legend
Main RiversFlood DefencesAreas Benefiting From Flood DefenceFlood Zone 3Flood Zone 2
Flood Map Centred on Damhead CreekCreated 11 December 2015 (Ref KSL151124/KR58)

Orchard House, Endeavour Park, London Road, Addington, West Malling, Kent, ME19 5SH. Email: [email protected]
Model Output Data You have requested flood levels for various return periods at this location. The modelled flood levels for the closest most appropriate model grid cells, any additional information you may need to know about the modelling from which they are derived and/or any specific use or health warning for their use are set out below. Using a 2D TuFLOW model the floodplain has been represented as a grid. The flood water levels have been calculated for each grid cell. A map showing the location of the points from which the data is taken is enclosed. Please note you should read the notice enclosed for your specific use rights. Table 1: Defended Modelled Tidal Flood levels for Annual Exceedance Probability shown in mAOD
Node Location ID
Modelled Tidal Flood levels for Annual Exceedance Probability shown in mAOD
National Grid Ref Defended
Easting Northing 5% AEP 2012 0.5% AEP 2012 0.5% AEP 2070 0.5% AEP 2115 0.1% AEP (2012)
1 580919 173228 0.00 0.00 0.00 5.95 0.00 2 581078 173165 0.00 0.00 5.04 5.95 0.00 3 581376 173102 0.00 0.00 0.00 0.00 0.00 4 581618 172993 0.00 0.00 0.00 0.00 0.00 5 581138 172933 0.00 0.00 4.73 6.03 0.00 6 581370 172907 0.00 0.00 0.00 0.00 0.00 7 581525 172834 0.00 0.00 0.00 0.00 0.00 8 581151 172755 0.00 0.00 4.73 6.02 0.00 8 581356 172751 0.00 0.00 4.73 6.02 0.00

Orchard House, Endeavour Park, London Road, Addington, West Malling, Kent, ME19 5SH. Email: [email protected]
Table 2: Undefended Modelled Tidal Flood levels for Annual Exceedance Probability shown in mAOD
Node Location ID Modelled Tidal Flood levels for Annual Exceedance Probability shown in mAOD
National Grid Ref Undefended Easting Northing 5% AEP 2012 0.5% AEP 2012 0.5% AEP 2070 0.5% AEP 2115 0.1% AEP 2012
1 580919 173228 0.00 0.00 0.00 5.97 0.00 2 581078 173165 0.00 4.91 5.35 5.97 5.29 3 581376 173102 0.00 0.00 0.00 0.00 0.00 4 581618 172993 0.00 0.00 0.00 0.00 0.00 5 581138 172933 4.44 4.94 5.35 5.99 5.31 6 581370 172907 0.00 0.00 0.00 0.00 0.00 7 581525 172834 0.00 0.00 0.00 0.00 0.00 8 581151 172755 4.44 4.92 5.35 5.99 5.30 8 581356 172751 4.44 4.92 5.35 5.99 5.30
Data taken from North Kent Coast Modelling and Mapping Study, completed by JBA Consulting, in August 2013. There are no health warnings or additional information for these levels or the model from which they were produced.
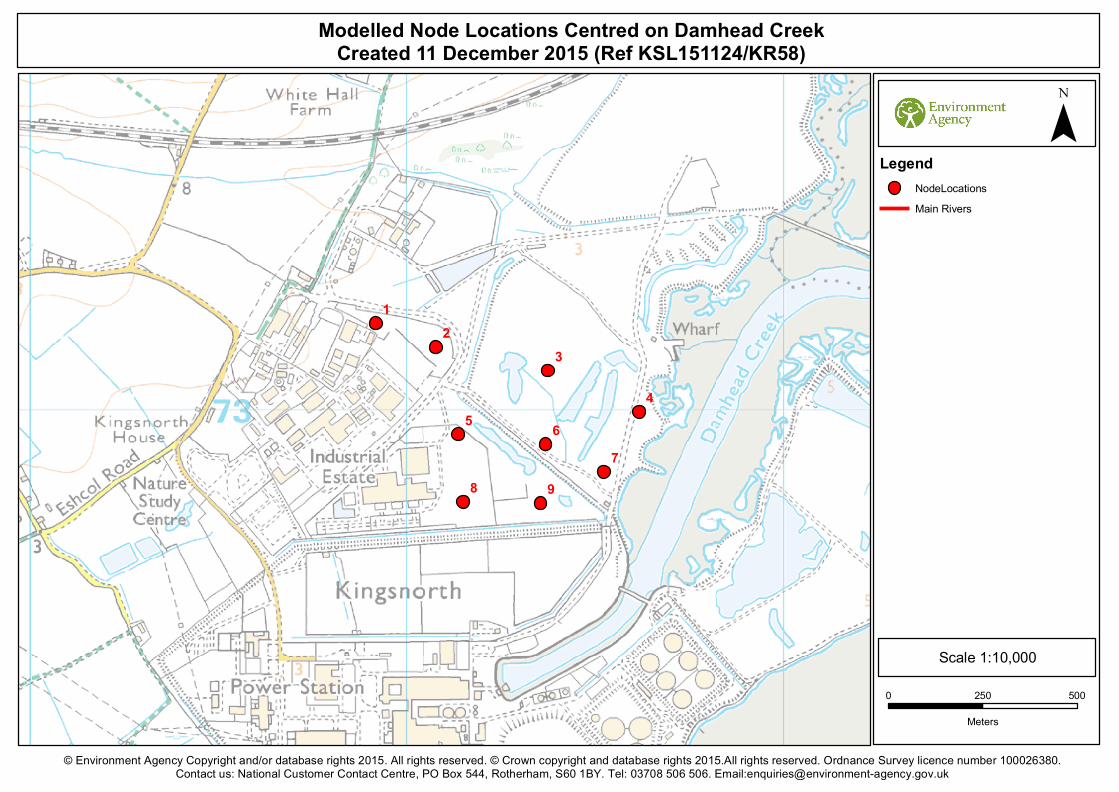
987
654
32
1
© Environment Agency Copyright and/or database rights 2015. All rights reserved. © Crown copyright and database rights 2015.All rights reserved. Ordnance Survey licence number 100026380.Contact us: National Customer Contact Centre, PO Box 544, Rotherham, S60 1BY. Tel: 03708 506 506. Email:[email protected]
0 250 500
Meters
Scale 1:10,000
¯Legend
NodeLocationsMain Rivers
Modelled Node Locations Centred on Damhead CreekCreated 11 December 2015 (Ref KSL151124/KR58)

© Environment Agency Copyright and/or database rights 2015. All rights reserved. © Crown copyright and database rights 2015.All rights reserved. Ordnance Survey licence number 100026380.Contact us: National Customer Contact Centre, PO Box 544, Rotherham, S60 1BY. Tel: 03708 506 506. Email:[email protected]
0 250 500
Meters
Scale 1:10,000
Annual Exceedance Probability (AEP) The probability of a flood
of a particular magnitude, or greater occuring in any given
year.
¯Legend
Main Rivers5% AEP (2012)0.1% AEP (2012)
Defended Modelled Tidal Flood Outlines Centred on Damhead CreekCreated 11 December 2015 (Ref KSL151124/KR58)

© Environment Agency Copyright and/or database rights 2015. All rights reserved. © Crown copyright and database rights 2015.All rights reserved. Ordnance Survey licence number 100026380.Contact us: National Customer Contact Centre, PO Box 544, Rotherham, S60 1BY. Tel: 03708 506 506. Email:[email protected]
0 250 500
Meters
Scale 1:10,000
Annual Exceedance Probability (AEP) The probability of a flood
of a particular magnitude, or greater occuring in any given
year.
¯Legend
Main Rivers0.5% AEP (2012)0.5% AEP (2070)0.5% AEP (2115)
Defended Modelled Tidal Flood Outlines Centred on Damhead CreekCreated 11 December 2015 (Ref KSL151124/KR58)
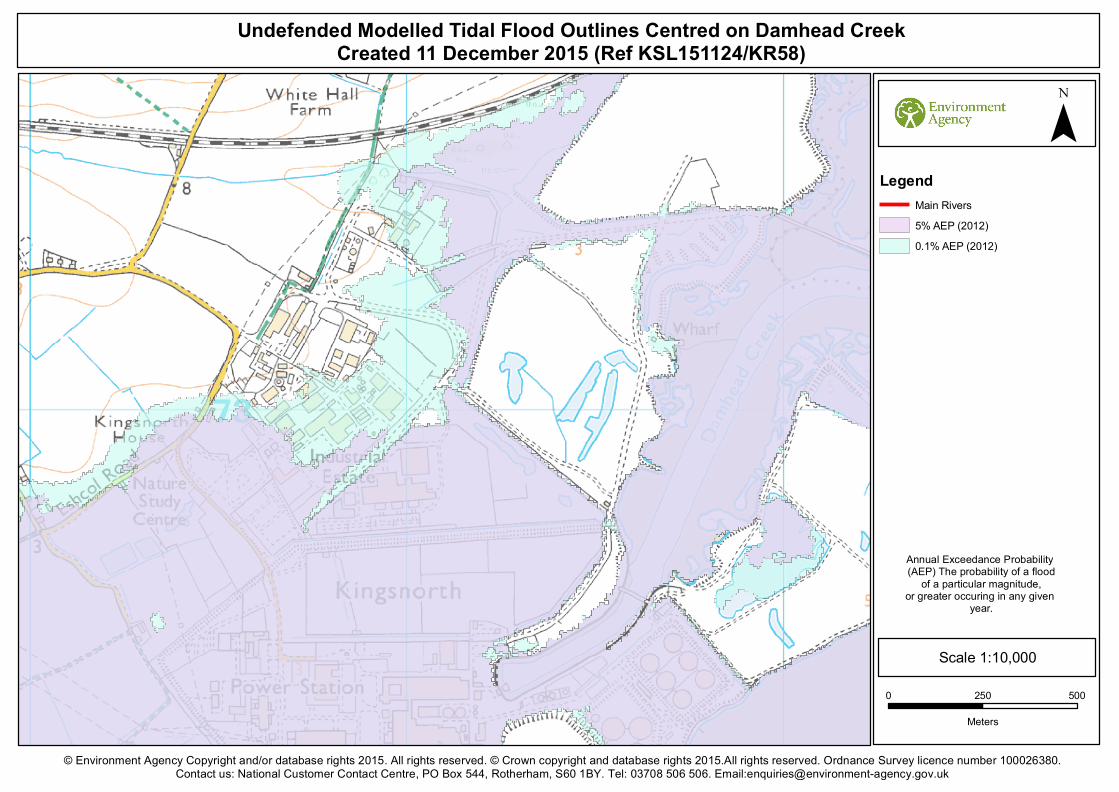
© Environment Agency Copyright and/or database rights 2015. All rights reserved. © Crown copyright and database rights 2015.All rights reserved. Ordnance Survey licence number 100026380.Contact us: National Customer Contact Centre, PO Box 544, Rotherham, S60 1BY. Tel: 03708 506 506. Email:[email protected]
0 250 500
Meters
Scale 1:10,000
Annual Exceedance Probability (AEP) The probability of a flood
of a particular magnitude, or greater occuring in any given
year.
¯Legend
Main Rivers5% AEP (2012)0.1% AEP (2012)
Undefended Modelled Tidal Flood Outlines Centred on Damhead CreekCreated 11 December 2015 (Ref KSL151124/KR58)

© Environment Agency Copyright and/or database rights 2015. All rights reserved. © Crown copyright and database rights 2015.All rights reserved. Ordnance Survey licence number 100026380.Contact us: National Customer Contact Centre, PO Box 544, Rotherham, S60 1BY. Tel: 03708 506 506. Email:[email protected]
0 250 500
Meters
Scale 1:10,000
Annual Exceedance Probability (AEP) The probability of a flood
of a particular magnitude, or greater occuring in any given
year.
¯Legend
Main Rivers0.5% AEP (2012)0.5% AEP (2070)0.5% AEP (2115)
Undefended Modelled Tidal Flood Outlines Centred on Damhead CreekCreated 11 December 2015 (Ref KSL151124/KR58)

Orchard House, Endeavour Park, London Road, Addington, West Malling, Kent, ME19 5SH. Email: [email protected]
Defence Details The site is currently defended to a 1 in 1000 year standard of protection. Defences are comprised of raised earth embankments and concrete sea walls. The Environment Agency does not currently have any planned improvement works to the defences in this area.

Orchard House, Endeavour Park, London Road, Addington, West Malling, Kent, ME19 5SH. Email: [email protected]
Historic Flood Data We hold records of historic flood events from rivers and the sea. Information on the floods that may have affected the area local to your site are provided on the enclosed map (if relevant). Flood Event Data Please note that our records are not comprehensive. We would therefore advise that you make further enquiries locally with specific reference to flooding at this location. You should consider contacting the relevant Local Planning Authority and/or water/sewerage undertaker for the area. We map flooding to land, not individual properties. Our historic flood event record outlines are an indication of the geographical extent of an observed flood event. Our historic flood event outlines do not give any indication of flood levels for individual properties. They also do not imply that any property within the outline has flooded internally. Please be aware that flooding can come from different sources. Examples of these are: - from rivers or the sea; - surface water (i.e. rainwater flowing over or accumulating on the ground before it is able to enter rivers or the drainage system); - overflowing or backing up of sewer or drainage systems which have been overwhelmed, - groundwater rising up from underground aquifers Currently the Environment Agency can only supply flood risk data relating to the chance of flooding from rivers or the sea. However you should be aware that in recent years, there has been an increase in flood damage caused by surface water flooding or drainage systems that have been overwhelmed.

© Environment Agency Copyright and/or database rights 2015. All rights reserved. © Crown copyright and database rights 2015.All rights reserved. Ordnance Survey licence number 100026380.Contact us: National Customer Contact Centre, PO Box 544, Rotherham, S60 1BY. Tel: 03708 506 506. Email:[email protected]
0 250 500
Meters
Scale 1:10,000
¯Legend
Main RiversFeb 1953
Historic Flood Outlines Centred on Damhead CreekCreated 11 December 2015 (Ref KSL151124/KR58)

Orchard House, Endeavour Park, London Road, Addington, West Malling, Kent, ME19 5SH. Email: [email protected]
Additional Information Use of Environment Agency Information for Flood Risk / Flood Consequence Assessments Depending on the enquiry, we may also provide advice on other issues related to our responsibilities including flooding, waste, land contamination, water quality, biodiversity, navigation, pollution, water resources, foul drainage or Environmental Impact Assessment. In England, you should refer to the Environment Agency’s Flood Risk Standing Advice, the technical guidance to the National Planning Policy Framework and the existing PPS25 Practice Guide for information about what flood risk assessment is needed for new development in the different Flood Zones. These documents can be accessed via: https://www.gov.uk/government/publications/flood-risk-standing-advice-for-local-planning-authorities-frsa http://planningguidance.planningportal.gov.uk/ You should also consult the Strategic Flood Risk Assessment produced by your local planning authority. You should note that:
1. Information supplied by the Environment Agency may be used to assist in producing a Flood Risk / Consequence Assessment (FRA /
FCA) where one is required, but does not constitute such an assessment on its own.
2. This information covers flood risk from main rivers and the sea, and you will need to consider other potential sources of flooding, such as groundwater or overland runoff. The information produced by the local planning authority referred to above may assist here.
3. Where a planning application requires a FRA / FCA and this is not submitted or deficient, the Environment Agency may well raise an
objection.
4. For more significant proposals in higher flood risk areas, we would be pleased to discuss details with you ahead of making any planning application, and you should also discuss the matter with your local planning authority.

Orchard House, Endeavour Park, London Road, Addington, West Malling, Kent, ME19 5SH. Email: [email protected]
Surface Water We have provided two national Surface Water maps, under our Strategic Overview for flooding, to your Lead Local Flood Authority – Medway Council, who are responsible for local flood risk (i.e. surface runoff, ground water and ordinary watercourse), which alongside their existing local information will help them in determining what best represents surface water flood risk in your area. Medway Council have reviewed these and determined what it believes best represents surface water flood risk. You should therefore contact this authority so they can provide you with the most up to date information about surface water flood risk in your area. You may also wish to consider contacting the appropriate relevant Local Planning Authority and/or water/sewerage undertaker for the area. They may be able to provide some knowledge on the risk of flooding from other sources. We are working with these organisations to improve knowledge and understanding of surface water flooding.
Orchard House, Endeavour Park, London Road, Addington, West Malling, Kent, ME19 5SH. Email: [email protected]
Standard Notice [not for use with Special Data, Personal Data or unlicensed 3rd
party rights]
Information warning We (The Environment Agency) do not promise that the Information supplied to You will always be accurate, free from viruses and other malicious or damaging code (if electronic), complete or up to date or that the Information will provide any particular facilities or functions or be suitable for any particular purpose. You must ensure that the Information meets your needs and are entirely responsible for the consequences of using the Information. Please also note any specific information warning or guidance supplied to you. Permitted use The Information is protected by intellectual property rights and whilst you have certain statutory rights which include the right to read the Information, you are granted no additional use rights whatsoever unless you agree to the licence set out below. Commercial use is subject to payment of a £50 licence fee (+VAT) for each person seeking the benefit of the licence, except for use as an Environment Agency contractor or for approved media use. To activate this licence you do not need to contact us (unless you need to pay us a Commercial licence fee) but if you make any use in excess of your statutory rights you are deemed to accept the terms below. Licence We grant you a worldwide, royalty-free, perpetual, non-exclusive licence to use the Information subject to the conditions below. You are free to: You must (where you do any of the above): These are important conditions and if you fail to comply with them the rights granted to you under this licence, or any similar licence granted by us will end automatically. No warranty The Information is licensed ‘as is’ and We exclude all representations, warranties, obligations and liabilities in relation to the Information to the maximum extent permitted by law. We are not liable for any errors or omissions in the Information and shall not be liable for any loss, injury or damage of any kind caused by its use. We do not guarantee the continued supply of the Information. Governing Law This licence is governed by the laws of England and Wales. Definitions + “Information” means: the information that is protected by copyright or by database right (for example, literary and artistic works, content, data and source code) offered for use under the terms of this licence. + “Commercial” means:
- offering a product or service containing the Information, or any adaptation of it, for a charge, or - Internal Use for any purpose, or offering a product or service based on the Information for indirect
commercial advantage, by an organisation that is primarily engaged in trade, commerce or a profession
acknowledge the source of the Information by including the following attribution statement: “Contains Environment Agency information © Environment Agency and database right” ensure that you do not use the Information in a way that suggests any official status or that We endorse you or your use of the Information ensure that you do not mislead others or misrepresent the Information or its source or use the Information in a way that is detrimental to the environment, including the risk of reduced future enhancement ensure that your use of the Information does not breach the Data Protection Act 1998 or the Privacy and Electronic Communications (EC Directive) Regulations 2003
copy, publish, distribute and transmit the Information adapt the Information exploit the Information commercially, for example, by combining it with other Information, or by including it in your own product or application

1
Somerton, Joanne
From: mumby, priscilla <[email protected]>
Sent: 11 January 2016 10:43
To: Somerton, Joanne
Cc: Mike Watson
Subject: RE: Email Enquiry - Land near Damhead Creek - Flood Risk Assessment
Joanne,
Do you have any more information regarding the proposed development? Size, type, etc. I assume it’s industrial. I
believe there is a site wide drainage strategy for the area – the case officer should be able to advise further on this
as it will be attached to the outline application.
A general rule of thumb here would be to attenuate discharges to ditches to the greenfield runoff rate (7 litres per
second per hectare). Most of the ditches here are under the remit of the Lower Medway Internal Drainage Board
(Clerk and Engineer is Mike Watson, Cc’d). They will also review any planning application for the area and advise of
any additional requirements, but we’d need a more detailed location plan to ascertain which ditches would be
impacted. Consent under the Land Drainage Act 1991 will likely be required for any works to the
ditches/connections/outfalls.
We’d recommend rainwater harvesting where possible to deal with water at source and limit the impact on the
ditch network. I’m not aware of any local drainage issues but Mike may be able to advise further.
Best regards,
Priscilla
Priscilla Mumby Flood, Drainage & Special Projects Officer
Tel: 01634 331420
Fax: 01634 332862 E-mail: [email protected]
From: Somerton, Joanne [mailto:[email protected]]
Sent: 08 January 2016 16:16 To: mumby, priscilla
Subject: RE: Email Enquiry - Land near Damhead Creek - Flood Risk Assessment Importance: High
Priscilla
Please see the string of emails below. We are looking to submit the report in the next week or so and are still
awaiting a response from the Council
Kind Regards
Jo Somerton MSc BSc (Hons) Senior Flood Risk Consultant, Flood and Water Management DD: +44 (0)113 204 5028 Mob: +44(0)7917 503 650 [email protected]

DHC2 Flood Risk Assessment 4-Feb-16
Page 31
Annex B – Topographic Survey
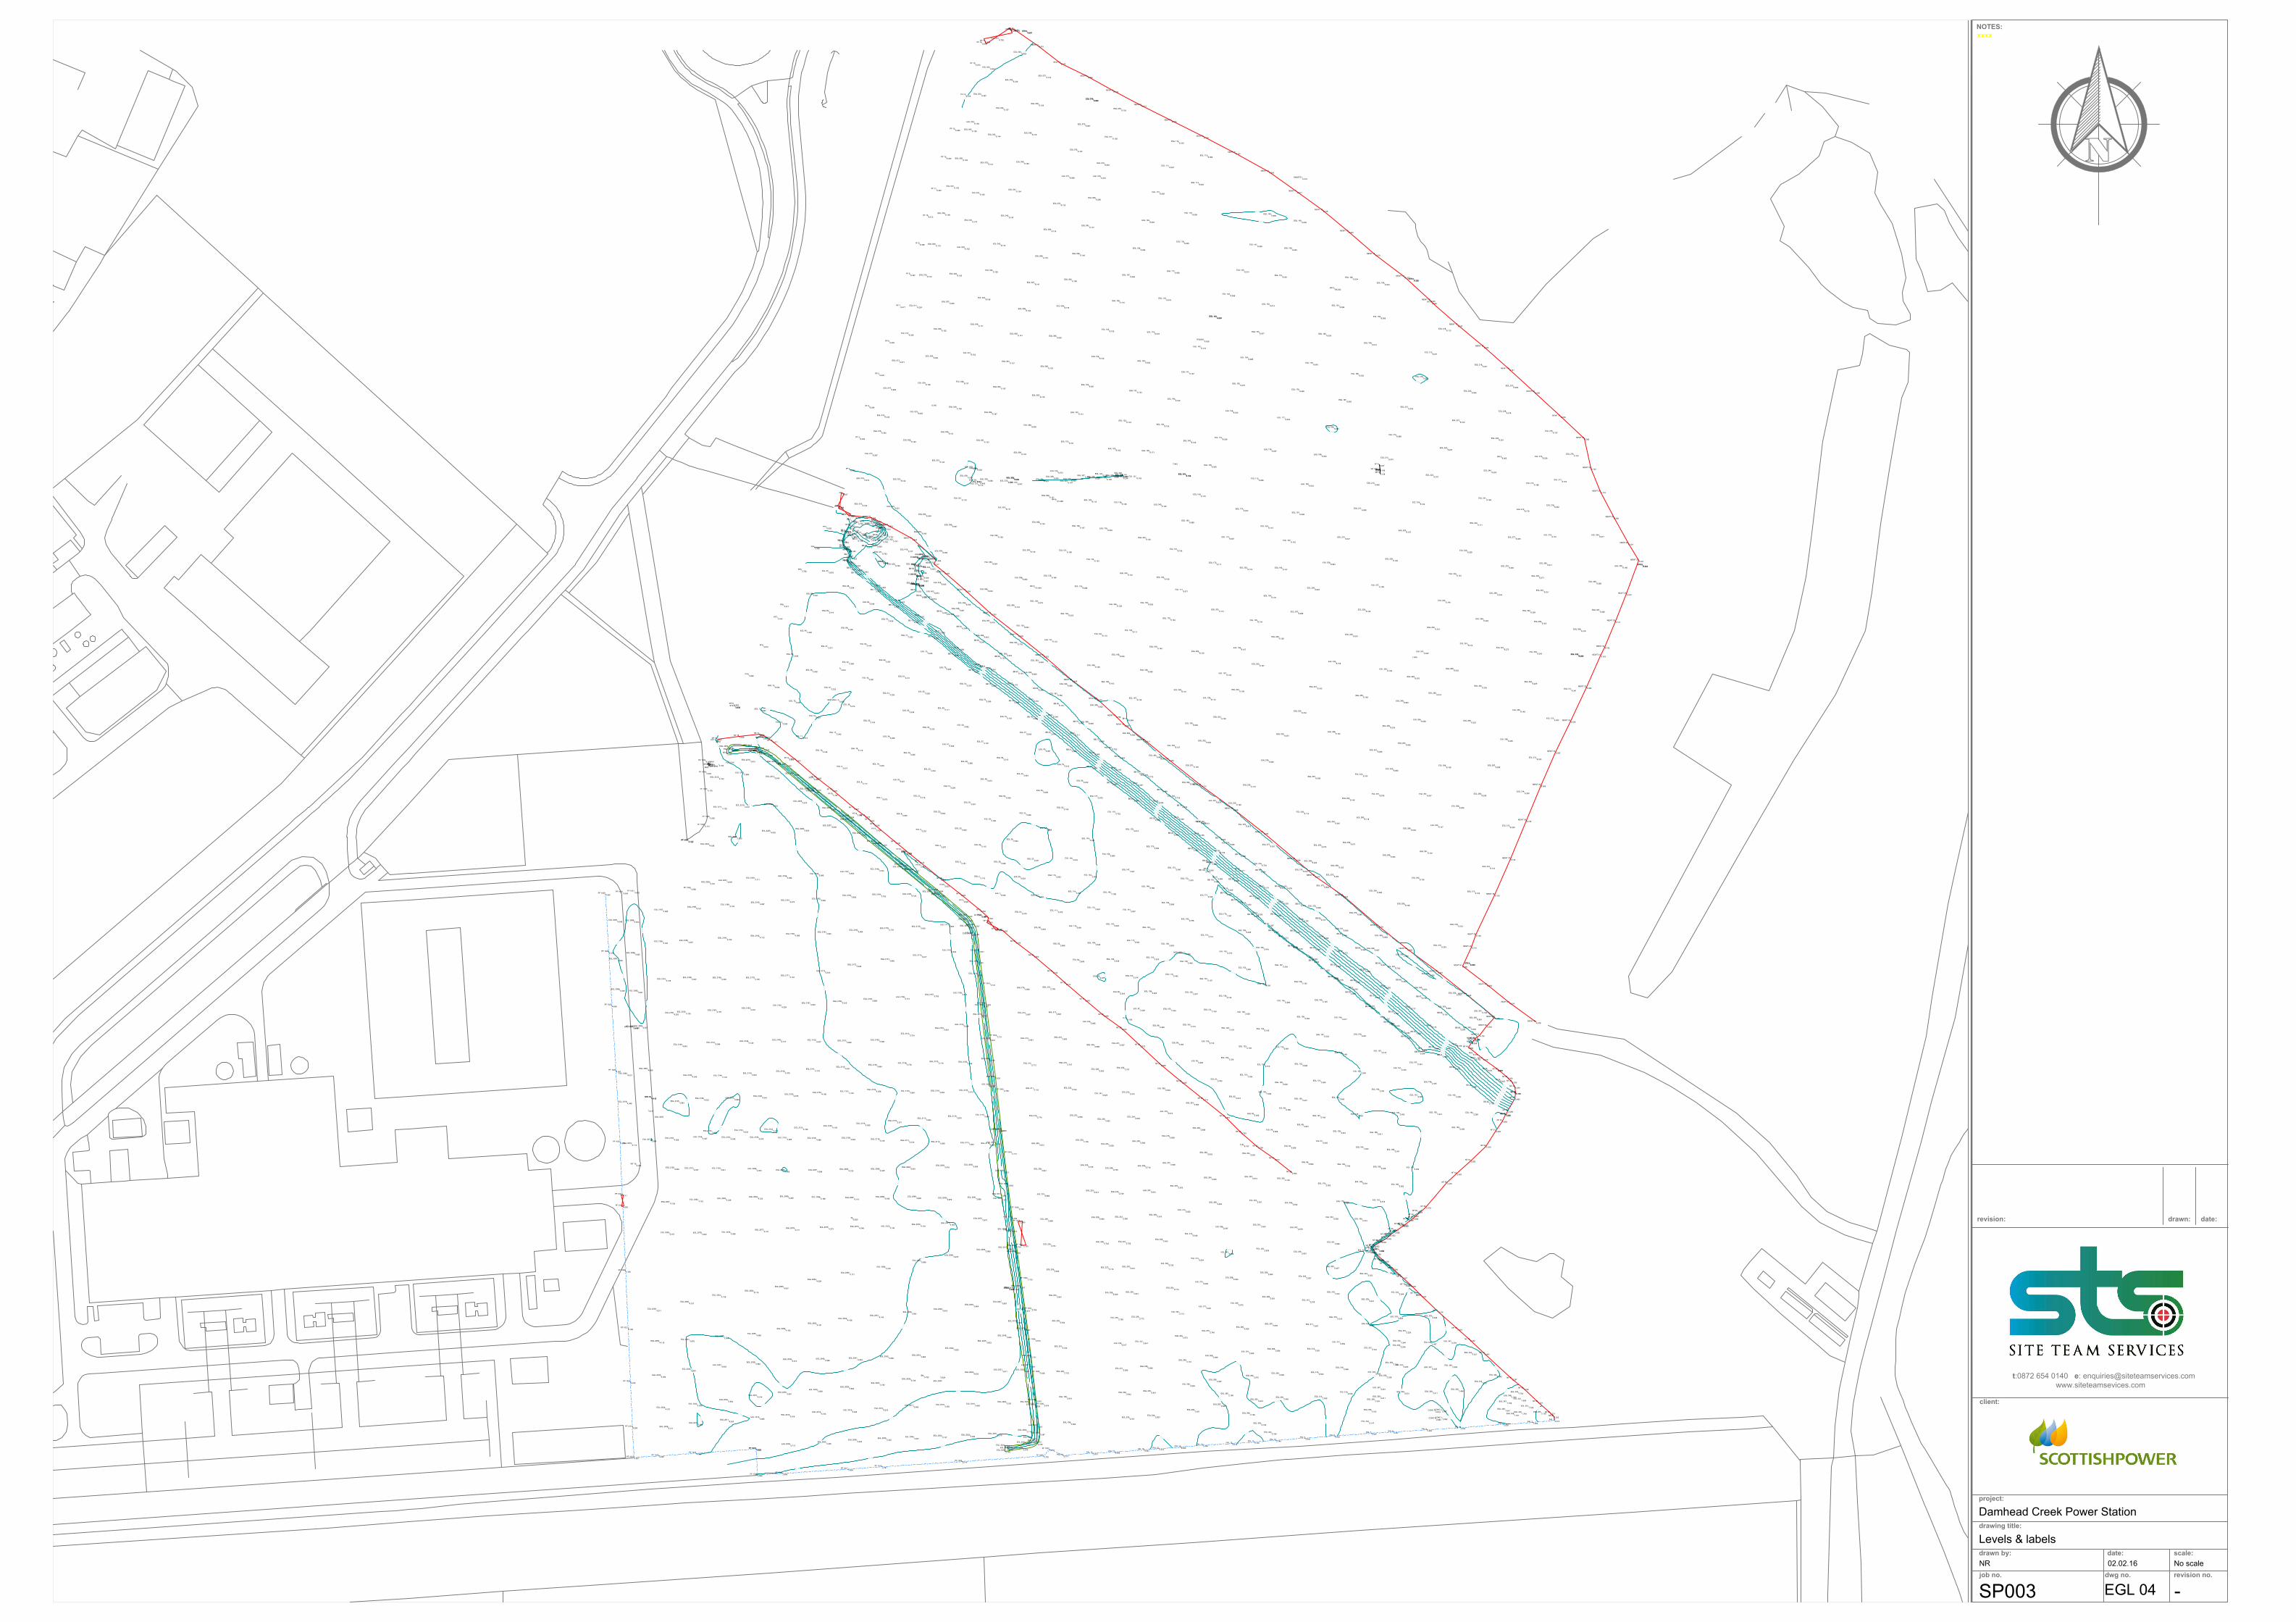
6
.
5
6
.
5
2
.
5
2
.
5
2.5
2.5
2
.
5
2
.
5
2
.
5
2
.
5
2
.
5
2
.
5
2.5
2
.
0
2.5
2
.
5
2
.
5
2
.
5
2
.
5
3
.
0
3
.
0
2
.
5
3
.
5
2
.
0
2
.
0
5
.
0
5
.
0
5
.
0
5
.
0
5
.
0
5
.
0
5
.
0
5
.
0
5
.
0
5
.
0
5
.
0
5
.
0
4
.
5
4
.
5
4
.
5
4
.
5
4
.
5
4
.
5
4
.
5
4
.
5
4
.
5
4
.
5
4
.
5
4
.
5
4
.
0
4
.
0
4
.
0
4
.
0
4
.
0
4
.
0
4
.
0
4
.
0
4
.
0
4
.
0
4
.
0
4
.
0
3
.
5
3
.
5
3
.
5
3
.
5
3
.
5
3
.
5
3
.
5
3
.
5
3
.
5
3
.
5
3
.
5
3
.
5
3
.
5
3.5
3
.
5
3
.
5
3
.
5
3
.
5
3
.
5
3
.
5
3.5
3
.
5
3.5
3.5
3.5
3.5
3.5
3.5
3
.
5
3.5
3
.
5
3
.
5
3
.
0
3
.
0
3
.
0
3
.
0
3
.
0
3
.
0
3
.
0
3
.
0
3
.
0
3.0
3.0
3
.
0
3
.
0
3
.
0
3
.
0
3
.
0
3.0
3
.
0
3
.
0
3
.
0
3.0
3.0
3.0
3.0
3.0
3.0
3.0
3.0
3
.
0
3.0
3.0
2
.
5
2
.
5
2
.
5
2
.
5
2
.
5
2
.
5
2
.
5
2
.
5
2
.
5
2.5
2
.
5
2
.
5
2
.
5
2
.
5
2.5
2
.
5
2.5
2
.
5
6
.
0
6
.
0
6
.
0
6
.
0
6
.
0
6
.
0
6
.
0
6
.
0
6
.
0
6
.
0
6
.
0
6
.
0
6
.
0
6
.
0
5
.
5
5
.
5
5
.
5
5
.
5
5
.
5
5
.
5
5
.
5
5
.
5
5
.
5
5
.
5
5
.
5
5
.
5
5
.
5
4
.
0
4.0
4
.
0
4.0
4
.
0
4
.
0
4
.
0
4
.
0
4.0
4
.
0
4
.
0
4
.
0
4
.
0
4
.
0
4
.
0
4
.
0
4
.
0
2.5
2.5
2.5
2.5
2.5
2.5
2.5
2.5
2.5
2.5
2
.
5
2
.
5
2
.
5
2
.
5
2
.
5
2
.
5
2.5
2.5
2.5
2.5
2.5
2.0
2.0
2.0
2.0
2.0
6
.
5
6
.
5
6
.
5
6.5
6
.
5
6
.
5
6
.
5
6
.
5
6
.
5
6
.
5
6.5
6
.
5
6
.
5
6
.
5
6
.
5
6
.
5
6
.
5
6
.
5
6
.
5
6
.
5
6
.
5
6
.
5
7
.
0
6
.
0
6.0
6
.
5
6
.
5
7
.
0
7
.
5
2
.
5
2
.
5
2
.
5
4
.
0
4.0
4.0
4
.
0
4
.
0
4
.
0
4
.
0
4
.
0
4.0
4
.
0
4
.
0
6.5
6.5
6.5
6
.
0
6.0
6
.
0
6.0
6.0
6.0
2
.
5
2
.
5
2
.
5
2
.
5
3.0
2
.
5
3
.
0
3
.
0
2.5
3.0
EGL 3090
4.048
EGL 3089
3.955
EGL 3088
3.925
EGL 3087
4.006
EGL 3086
4.039
EGL 3085
3.931
EGL 3084
3.915
EGL 3083
3.946
EGL 3082
4.007
EGL 3081
4.066
EGL 3080
4.031
EGL 3079
4.048
EGL 3078
4.015
EGL 3077
3.999
EGL 3076
4.114
WT 10
4.034
EGL 3075
2.337
EGL 3074
2.010
EGL 3073
1.957
EGL 3072
2.028
EGL 3071
1.894
EGL 3070
1.867
EGL 3069
2.052
EGL 3068
1.950
EGL 3067
2.014
EGL 3066
2.121
EGL 3065
2.041
EGL 3064
2.066
EGL 3063
2.167
EGL 3062
2.153
EGL 3061
2.139
EGL 3060
2.036
EGL 3059
2.140
EGL 3058
2.314
EGL 3057
2.390
EGL 3056
2.425
EGL 3055
2.407
EGL 3054
2.522
EGL 3053
2.710
EGL 3052
2.754
EGL 3051
2.854
EGL 3050
3.726
EGL 3049
3.554
EGL 3048
3.475
EGL 3047
3.359
EGL 3046
3.210
EGL 3045
3.184
EGL 3044
3.050
EGL 3043
3.027
EGL 3042
2.854
EGL 3041
2.840
EGL 3040
2.907
EGL 3039
2.821
EGL 3038
2.894
EGL 3037
2.947
EGL 3036
2.932
EGL 3035
2.825
EGL 3034
2.854
EGL 3033
2.799
EGL 3032
2.781
EGL 3031
2.872
EGL 3030
2.731
EGL 3029
2.819
EGL 3028
2.587
EGL 3027
2.730
EGL 3026
2.916
EGL 3025
2.783
EGL 3024
2.788
EGL 3023
2.829
EGL 3022
3.014
EGL 3021
3.112
EGL 3020
3.361
EGL 3019
3.574
EGL 3018
3.704
EGL 3017
3.684
EGL 3016
3.522
EGL 3015
3.571
EGL 3014
3.346
EGL 3013
3.361
EGL 3012
2.957
EGL 3011
2.873
EGL 3010
2.912
EGL 3009
3.014
EGL 3008
3.083
EGL 3007
3.188
EGL 3006
3.164
EGL 3005
3.281
EGL 3004
3.240
EGL 3003
3.202
EGL 3002
3.293
EGL 3001
3.411
MH6
3.413MH5
3.848
MH4
4.384
MH3
4.371
MH2
4.404
MH1
4.397
EGL 2216
4.194
EGL 2215
3.875
EGL 2214
3.840
EGL 2213
3.989
EGL 2212
4.163
EGL 2211
4.102
EGL 2210
4.012
EGL 2209
4.002
EGL 2208
3.814
EGL 2207
3.835
EGL 2206
3.959EGL 2205
4.093
EGL 2204
3.990
EGL 2203
4.036
EGL 2202
4.181
EGL 2201
4.045
EGL 2200
4.111
EGL 2199
4.054
EGL 2198
3.995
EGL 2197
3.838
EGL 2196
3.704
EGL 2195
3.745
EGL 2194
3.752
EGL 2193
3.802
EGL 2192
3.990
EGL 2191
4.076
EGL 2190
4.087
EGL 2189
4.143
EGL 2188
4.161
EGL 2187
4.085
EGL 2186
4.120
EGL 2185
4.257
EGL 2184
4.230
EGL 2183
4.123
EGL 2182
4.099
EGL 2181
3.945
EGL 2180
3.854
EGL 2179
3.778
EGL 2178
3.605
EGL 2177
3.525
EGL 2176
3.502
EGL 2175
3.617
EGL 2174
3.865
EGL 2173
3.946
EGL 2172
3.973
EGL 2171
4.152
EGL 2170
4.190
EGL 2169
4.206
EGL 2168
4.097
EGL 2167
4.135
EGL 2166
4.202
EGL 2165
4.135
EGL 2164
4.187
EGL 2163
4.232
EGL 2162
4.229
EGL 2161
4.093
EGL 2160
3.915
EGL 2159
3.898
EGL 2158
3.713
EGL 2157
3.703
EGL 2156
3.614
EGL 2155
3.629
EGL 2154
3.681
EGL 2153
3.734
EGL 2152
3.785
EGL 2151
3.899
EGL 2150
4.037
EGL 2149
4.115
EGL 2148
4.120
EGL 2147
4.094
EGL 2146
4.043
EGL 2145
4.040
EGL 2144
4.116
EGL 2143
4.043
EGL 2142
4.079
EGL 2141
4.119
EGL 2140
4.051
EGL 2139
3.864
EGL 2138
3.778
EGL 2137
3.716
EGL 2136
3.566
EGL 2135
3.675
EGL 2134
3.803
EGL 2133
3.964
EGL 2132
4.056
EGL 2131
4.140
EGL 2130
4.180EGL 2129
4.076EGL 2128
4.041EGL 2127
3.989
EGL 2126
4.033
EGL 2125
3.983
EGL 2124
3.988
EGL 2123
4.030
EGL 2122
3.977
EGL 2121
4.166
EGL 2120
4.128
EGL 2119
4.050
EGL 2118
3.971
EGL 2117
3.963
EGL 2116
3.870
EGL 2115
3.656
EGL 2114
3.696
EGL 2113
3.861
EGL 2112
3.958
EGL 2111
4.074
EGL 2110
4.018
EGL 2109
4.093
EGL 2108
4.086
EGL 2107
4.056
EGL 2106
4.075
EGL 2105
4.045
EGL 2104
4.027
EGL 2103
4.039
EGL 2102
4.085
EGL 2101
4.047
EGL 2100
4.041
EGL 2099
4.063
EGL 2098
3.993
EGL 2097
4.098
EGL 2096
4.120
EGL 2095
4.045
EGL 2094
3.961
EGL 2093
3.916
EGL 2092
3.949
EGL 2091
3.899
EGL 2090
3.879
EGL 2089
3.880
EGL 2088
4.048
EGL 2087
4.110
EGL 2086
4.188
EGL 2085
4.280
EGL 2084
4.233
EGL 2083
4.238
EGL 2082
4.142
EGL 2081
4.138
EGL 2080
4.157
EGL 2079
4.004
EGL 2078
4.098
EGL 2077
4.147
EGL 2076
4.211
EGL 2075
4.273
EGL 2074
4.248
EGL 2073
4.194
EGL 2072
4.134
EGL 2071
4.005
EGL 2070
3.974
EGL 2069
3.980
EGL 2068
3.975
EGL 2067
3.989
EGL 2066
4.079
EGL 2065
4.171
EGL 2064
4.228
EGL 2063
4.067
EGL 2062
4.176
EGL 2061
4.136
EGL 2060
4.157
EGL 2059
4.211
EGL 2058
4.178
EGL 2057
3.976
EGL 2056
3.994
EGL 2055
4.060
EGL 2054
4.162
EGL 2053
4.181
EGL 2052
4.168
EGL 2051
4.140
EGL 2050
3.981
EGL 2049
3.919
EGL 2048
3.864
EGL 2047
3.887
EGL 2046
3.840
EGL 2045
3.833
EGL 2044
3.825
EGL 2043
3.869
EGL 2042
3.968
EGL 2041
4.044
EGL 2040
4.089
EGL 2039
4.073
EGL 2038
3.980
EGL 2037
3.945
EGL 2036
4.003
EGL 2035
4.094
EGL 2034
4.231
EGL 2033
4.005
EGL 2032
3.964
EGL 2031
4.014
EGL 2030
3.987
EGL 2029
3.893
EGL 2028
3.894
EGL 2027
3.782
EGL 2026
3.735
BH
3.722
EGL 2023
3.624
EGL 2022
3.633
EGL 2021
3.671
EGL 2020
3.331
EGL 2019
3.406
EGL 2018
3.392
EGL 2017
3.458
EGL 2016
3.616EGL 2015
3.638EGL 2014
3.733
EGL 2013
3.816
EGL 2012
3.985
EGL 2011
4.030
EGL 2010
3.994
EGL 2009
4.211
EGL 2008
3.717
EGL 2007
3.446
EGL 2006
3.404
EGL 2005
3.332
EGL 2004
3.221
EGL 2003
3.137
EGL 2002
3.054
EGL 2001
3.015
EGL 2000
3.116
PF 1046
2.805
PF 1045
2.758
PF 1044
2.773
PF 1043
2.755
PF 1042
2.721
PF 1041
2.731
PF 1040
2.797
PF 1039
4.360
PF 1038
4.246
PF 1037
4.175
PF 1036
4.239
PF 1035
4.131
PF 1034
4.102
PF 1033
4.106
PF 1032
4.068
PF 1031
4.032
PF 1030
4.049
PF 1029
4.062
PF 1028
4.016
PF 1027
4.069
PF 1026
4.007
PF 1025
4.279
PF 1024
4.117
PF 1023
4.093
PF 1022
4.160
PF 1021
4.186
PF 1020
4.230
PF 1019
4.299
PF 1018
4.281
PF 1017
4.026
PF 1016
4.055
PF 1015
3.822
PF 1014
3.828
PF 1013
2.966
PF 1012
2.958
PF 1011
2.859
PF 1010
2.781
PF 1009
2.717
PF 1008
2.702
PF 1007
2.619
PF 1006
2.616
PF 1005
2.638
PF 1004
2.613
PF 1003
2.709
PF 1002
2.722
PF 1001
2.703
33
5.825
STS 10
4.415
STS 9
4.022
4.462
STS 7
3.283
3.836
EGL 422
5.741
EGL 421
5.763
EGL 420
5.789
EGL 419
5.747
EGL 418
5.785
EGL 417
5.706
EGL 416
5.921
EGL 415
5.824
EGL 414
5.845
EGL 413
6.504
EGL 412
6.506
EGL 411
6.546
EGL 410
6.821
EGL 409
6.939
EGL 408
7.058
EGL 407
6.842
EGL 406
6.610
EGL 405
6.325
EGL 404
6.803
EGL 403
6.935
EGL 402
6.973
EGL 401
6.619
EGL 400
6.523
EGL 399
6.881
EGL 398
6.785
EGL 397
6.816
EGL 396
6.852
EGL 395
6.829
EGL 394
6.778
EGL 393
6.848
EGL 392
6.860
EGL 391
6.762
EGL 390
6.886
EGL 389
6.923
EGL 388
6.895
EGL 387
6.752
EGL 386
6.965
EGL 385
6.883
EGL 384
6.770
EGL 383
6.732
EGL 382
6.957
EGL 381
6.870
EGL 380
6.651
EGL 379
6.656
EGL 378
6.872
EGL 377
6.921
EGL 376
6.734
EGL 375
6.535
EGL 374
6.812
EGL 373
6.883
EGL 372
6.622
EGL 371
6.668
EGL 370
6.886
EGL 369
6.859
EGL 368
6.697
EGL 367
6.782
EGL 366
7.069
EGL 365
7.025
EGL 364
6.824
EGL 363
6.803
EGL 362
6.919
EGL 361
6.738
EGL 360
6.881
EGL 359
6.660
EGL 358
6.113
EGL 357
6.098
EGL 356
6.102
EGL 355
6.149
EGL 354
6.148
EGL 353
6.115
EGL 352
6.119
EGL 351
6.151
EGL 350
6.139
EGL 349
6.101
EGL 348
6.146
EGL 347
6.110
EGL 346
6.126
EGL 345
6.152
EGL 344
6.152
EGL 343
6.125
EGL 342
6.156
EGL 341
6.158
EGL 340
6.126
EGL 339
6.491
EGL 338
6.513
EGL 337
6.555
EGL 336
6.521
EGL 335
6.532
EGL 334
6.523
EGL 333
6.457
EGL 332
6.400
EGL 331
6.124
EGL 330
6.058
EGL 329
6.014
EGL 328
6.084
EGL 327
6.062
EGL 326
6.143
EGL 325
6.246
EGL 324
6.106
EGL 323
6.107
EGL 322
6.047
EGL 321
6.114
BH 6
-91.298
BH 5
-91.049
BH 4
-90.884
BH 3
-90.202
WT 6
6.036
WT 5
6.047
WT 4
6.172
WT 3
6.189
WT 2
6.138
BH 2
6.065
6.364
BH1
6.374
EGL 319
6.253
EGL 318
6.233
EGL 317
6.183
EGL 316
6.119
EGL 315
6.320
EGL 314
6.280
EGL 313
6.323
EGL 312
6.303
EGL 311
6.341
EGL 310
6.208
EGL 309
6.209
EGL 308
6.319
EGL 307
6.426
EGL 306
6.266
EGL 305
6.196
EGL 304
6.217
EGL 303
6.271
EGL 302
6.309
EGL 301
6.272
EGL 300
6.205
EGL 299
6.223
EGL 298
6.156
EGL 297
6.047
EGL 296
6.059
EGL 295
6.065
EGL 294
6.098
EGL 293
6.158
EGL 292
6.135
EGL 291
6.102
EGL 290
6.147
EGL 289
6.206
EGL 288
6.259
EGL 287
6.282
EGL 286
6.235
EGL 285
6.148
EGL 284
6.209
EGL 283
6.245
EGL 282
6.352
EGL 281
6.257
EGL 280
6.211
EGL 279
6.161
EGL 278
6.242
EGL 277
6.153
EGL 276
6.151
EGL 275
6.137
EGL 274
6.238
EGL 273
6.186
EGL 272
6.179
EGL 271
6.305
EGL 270
6.283
EGL 269
6.333
EGL 268
6.422
EGL 267
6.412
EGL 266
6.032
EGL 265
6.074
EGL 264
6.039
EGL 263
6.065
EGL 262
6.090
EGL 261
6.079
EGL 260
6.118
EGL 259
6.071
EGL 258
6.122
EGL 257
6.264
EGL 256
6.224
EGL 255
6.073
EGL 254
6.087
EGL 253
6.146
EGL 252
6.104
EGL 251
6.066
EGL 250
6.074
EGL 249
6.063
EGL 248
6.070
EGL 247
6.097
EGL 246
6.310
EGL 245
6.146
EGL 244
6.134
EGL 243
6.228
EGL 242
6.111
EGL 241
6.169
EGL 240
6.223
EGL 239
6.267
EGL 238
6.216
EGL 237
6.064
7.630
StkdSTS1
6.316
6.240
EGL 236
6.190
EGL 235
6.110
EGL 234
6.083
EGL 233
6.051
EGL 232
6.254
EGL 231
6.193
EGL 230
6.158
EGL 229
6.091
EGL 228
6.126
EGL 227
6.109
EGL 226
6.122
EGL 225
6.157
EGL 224
6.124
EGL 223
6.222
EGL 222
6.227
EGL 221
6.103
EGL 220
6.066
EGL 219
6.027
EGL 218
6.112
EGL 217
6.071
EGL 216
5.993
EGL 215
6.029
EGL 214
6.089
EGL 213
6.074
EGL 212
6.060
EGL 211
6.090
EGL 210
6.047
EGL 209
6.084
EGL 208
6.097
EGL 207
6.099
EGL 206
6.126
EGL 205
6.107
EGL 204
6.108
EGL 203
6.109
EGL 202
6.024
EGL 201
6.139
EGL 200
6.127
EGL 199
6.092
EGL 198
6.112
EGL 197
6.123
EGL 196
6.107
EGL 195
6.144
EGL 194
6.122
EGL 193
6.147
EGL 192
6.142
EGL 191
6.068
EGL 190
6.034
EGL 189
6.023
EGL 188
5.995
EGL 187
6.046
EGL 186
6.036
EGL 185
6.073
EGL 184
6.056
EGL 183
6.050
EGL 182
6.034
EGL 181
6.099
EGL 180
6.039
EGL 179
6.045
EGL 178
6.066
EGL 177
6.024
EGL 176
6.057
EGL 175
6.058
EGL 174
6.022
EGL 173
6.067
EGL 172
6.111
EGL 171
6.071
EGL 170
6.124
EGL 169
6.140
EGL 168
6.095
EGL 167
6.136
EGL 166
6.165
EGL 165
6.058
EGL 164
6.111
EGL 163
6.093
EGL 162
6.108
EGL 161
6.106
EGL 160
6.089
EGL 159
6.115
EGL 158
6.055
EGL 157
6.039
EGL 156
6.043
EGL 155
6.075
EGL 154
6.088
EGL 153
6.027
EGL 152
6.013
EGL 151
6.061
EGL 150
6.049
EGL 149
6.009
EGL 148
5.990
EGL 147
6.029
EGL 146
6.014
EGL 145
6.068
EGL 144
6.057
EGL 143
6.062
TPS0001
6.028
EGL 142
6.110
EGL 141
6.102
EGL 140
6.102
EGL 139
6.155
EGL 138
6.171
EGL 137
6.149
EGL 136
6.136
EGL 135
6.094
EGL 134
6.124
EGL 133
6.088
EGL 132
6.023
EGL 131
6.112
EGL 130
6.081
EGL 129
6.075
EGL 128
6.166
EGL 127
6.158
EGL 126
6.147
EGL 125
6.110
EGL 124
6.129
EGL 123
6.163
EGL 122
6.143
EGL 121
6.125
EGL 120
6.064
EGL 119
6.034
EGL 118
6.076
EGL 117
6.090
EGL 116
6.046
EGL 115
6.006
EGL 114
6.083
EGL 113
6.080
EGL 112
6.105
EGL 111
6.097
EGL 110
6.095
EGL 109
6.063
EGL 108
6.094
EGL 107
6.064
EGL 106
6.116
EGL 105
6.105
EGL 104
6.132
EGL 103
6.097
EGL 102
6.121
EGL 101
6.151
EGL 100
6.073
EGL 099
6.121
EGL 098
6.130
EGL 097
6.146
EGL 096
6.092
EGL 095
6.118
EGL 094
6.042
EGL 093
6.084
EGL 092
6.139
EGL 091
6.171
EGL 090
5.999
EGL 089
6.102
EGL 088
6.050
EGL 087
6.128
EGL 086
6.102
EGL 085
6.062
EGL 084
6.176
EGL 083
6.158
EGL 082
6.140
EGL 081
6.112
EGL 080
6.256
EGL 079
6.272
EGL 078
6.064
EGL 077
6.138
EGL 076
6.105
EGL 075
6.062
EGL 074
6.062
EGL 073
6.087
EGL 072
6.187
EGL 071
6.098
EGL 070
6.130
EGL 069
6.124
EGL 068
6.175
EGL 067
6.141
EGL 066
6.134
EGL 065
6.141
EGL 064
6.157
EGL 063
6.167
EGL 062
6.187
EGL 061
6.153
EGL 060
6.026
EGL 059
5.970
EGL 058
5.921
EGL 057
6.118
EGL 056
6.061
EGL 055
6.050
EGL 054
6.042
EGL 053
6.049
EGL 052
6.162
EGL 051
6.145
EGL 050
6.131
EGL 049
6.169
EGL 048
6.137
EGL 047
6.152
EGL 046
6.171
EGL 045
6.156
EGL 044
6.128
EGL 043
6.174
EGL 042
6.147
EGL 041
6.154
EGL 040
6.184
EGL 039
6.129
EGL 038
6.128
EGL 037
6.123
EGL 036
6.529
EGL 035
6.236
EGL 034
6.157
EGL 033
6.144
EGL 032
6.141
EGL 031
6.160
EGL 030
6.170
EGL 029
6.152
EGL 028
6.105
EGL 027
6.200
EGL 026
6.152
EGL 025
6.091
EGL 024
6.136
EGL 023
6.055
EGL 022
6.129
EGL 021
6.122
EGL 020
6.021
EGL 019
5.730
EGL 018
5.916
EGL 017
6.267
EGL 016
6.365
EGL 015
6.334
EGL 014
6.266
EGL 013
6.271
EGL 012
6.326
EGL 011
6.224
EGL 010
6.150
EGL 009
6.110
EGL 008
6.159
EGL 007
6.125
EGL 006
6.122
EGL 005
6.125
EGL 004
6.136
EGL 003
6.367
EGL 002
6.561
EGL 001
6.792
PF 19
6.925
PF 18
6.845
PF 17
6.804
PF 16
6.815
PF 15
6.670
PF 14
6.519
PF 13
6.466
PF 12
6.390
PF 11
6.397
PF 10
6.413
PF 9
6.456
PF 8
6.497
PF 7
6.477
PF 6
6.458
PF 5
6.420
PF 4
6.389
PF 3
6.338
PF 2
5.999
PF 1
5.633
NEWT 80
5.636
NEWT 79
5.746
NEWT 78
5.831
NEWT 77
5.843
NEWT 76
5.994
NEWT 75
6.217
NEWT 74
6.258
NEWT 73
6.204
NEWT 72
6.293
NEWT 71
6.225
NEWT 70
6.353
NEWT 69
6.485
NEWT 68
6.450
NEWT 67
6.796
NEWT 66
6.597
NEWT 65
6.371
NEWT 64
6.253
NEWT 63
6.273
NEWT 62
6.508
NEWT 61
6.234
NEWT 60
6.298
NEWT 59
6.610
NEWT 58
6.431
NEWT 57
6.351
NEWT 56
6.556
NEWT 55
6.291
NEWT 54
6.509
NEWT 53
6.449
NEWT 52
6.956
NEWT 51
6.790
NEWT 50
6.199
NEWT 44
6.248
NEWT 43
6.034
NEWT 42
6.055
NEWT 41
6.190
NEWT 40
6.274
NEWT 39
6.195
NEWT 38
6.159
NEWT 37
6.144
NEWT 36
6.155
NEWT 35
6.066
NEWT 34
6.067
NEWT 33
6.078
NEWT 32
6.084
NEWT 31
6.143
NEWT 30
6.182
NEWT 29
6.141
NEWT 28
6.037
NEWT 27
6.041
NEWT 26
6.107
NEWT 25
6.090
NEWT 24
6.118
NEWT 23
6.122
NEWT 22
6.082
NEWT 21
6.079
NEWT 20
6.099
NEWT 19
6.121
NEWT 18
6.043
NEWT 17
6.147
NEWT 16
6.000
NEWT 15
6.127
NEWT 14
6.079
NEWT 13
6.093
NEWT 12
6.128
NEWT 11
6.077
NEWT 10
6.095
NEWT 9
6.124
NEWT 8
6.118
NEWT 7
6.076
NEWT 6
6.073
NEWT 5
6.119
NEWT 4
6.084
NEWT 3
6.143
NEWT 2
6.419
NEWT 1
6.782
7.643
STS4
6.821
STS3
6.320
STS2
6.224
STS1
6.303
STS5
6.044
EGL 365
2.189
EGL 364
2.138
EGL 363
2.129
EGL 362
2.190
EGL 361
2.229
EGL 360
2.256
EGL 359
2.285
EGL 358
2.308
EGL 357
2.251
EGL 356
2.253
EGL 355
2.195
EGL 354
2.147
CONC 4
2.884
CONC 3
2.874
CONC 2
2.887
CONC 1
2.892
EGL 353
2.159
EGL 352
1.609
EGL 351
1.728
EGL 350
1.744
EGL 349
1.701
EGL 348
1.647
EGL 347
1.739
EGL 346
1.703
EGL 345
1.703
EGL 344
2.542
EGL 343
2.551
EGL 342
2.557
EGL 341
2.479
EGL 340
2.508
EGL 339
2.486
EGL 338
2.511
EGL 337
2.528
EGL 336
2.497
EGL 335
2.546
EGL 334
2.644
EGL 333
2.523
EGL 332
2.344
EGL 331
2.480
EGL 330
2.531
EGL 329
2.411
EGL 328
2.534
EGL 327
2.734
EGL 326
2.499
EGL 325
2.431
EGL 324
2.523
EGL 323
2.502
EGL 322
2.556
EGL 321
2.592
EGL 320
2.467
EGL 319
2.543
EGL 318
2.578
EGL 317
2.559
EGL 316
2.568
EGL 315
2.578
EGL 314
2.508
EGL 313
2.503
EGL 312
2.551
EGL 311
2.567
EGL 310
2.618
EGL 309
2.587
EGL 308
2.634
EGL 307
2.679
EGL 306
2.642
EGL 305
2.724
EGL 304
2.605
EGL 303
2.614
EGL 302
2.631
EGL 301
2.643
EGL 300
2.633
EGL 299
2.683
EGL 298
2.631
EGL 297
2.639
EGL 296
2.564
EGL 295
2.506
EGL 294
2.546EGL 293
2.673
EGL 292
2.572
EGL 291
2.606
EGL 290
2.626
EGL 289
2.672
EGL 288
2.644
EGL 287
3.046
EGL 286
2.787
EGL 285
2.608
EGL 284
2.665
EGL 283
2.652
EGL 282
2.686
EGL 281
2.655
EGL 280
2.532
EGL 279
2.618
EGL 278
2.669
EGL 277
2.699
EGL 276
2.633
EGL 275
2.652
EGL 274
2.648
EGL 273
2.634
EGL 272
2.698
EGL 271
2.601
EGL 270
2.748
EGL 269
2.899
EGL 268
2.297
EGL 267
2.582
EGL 266
2.621
EGL 265
2.835
EGL 264
2.710
EGL 263
2.673
EGL 262
2.713
EGL 261
2.713
EGL 260
2.722
EGL 259
2.655
EGL 258
2.578
EGL 257
2.601
EGL 256
2.719
EGL 255
2.598
EGL 254
2.535
EGL 253
2.510
EGL 252
2.701
EGL 251
2.507
EGL 250
2.685
EGL 249
2.568
EGL 248
2.553
EGL 247
2.625
EGL 246
2.692
EGL 245
2.636
EGL 244
2.739
EGL 243
2.729
EGL 242
2.546
EGL 241
2.702
EGL 240
2.670
EGL 239
2.821
EGL 238
2.712
EGL 237
2.641
EGL 236
2.896
EGL 235
2.847
EGL 234
2.823EGL 233
2.707
EGL 232
2.642
EGL 231
2.689
EGL 230
2.917
EGL 229
2.765
EGL 228
2.839
EGL 227
2.774
EGL 226
2.742
EGL 225
2.680
EGL 224
2.673
EGL 223
2.735
EGL 222
2.706
EGL 221
2.650
EGL 220
2.760
EGL 219
2.747
EGL 218
2.693
EGL 217
2.691
EGL 216
2.706
EGL 215
2.696
EGL 214
2.687
EGL 213
2.951
EGL 212
2.713
EGL 211
2.716
EGL 210
2.774
EGL 209
2.872
EGL 208
2.841
EGL 207
2.869
EGL 206
2.965
EGL 205
2.751
EGL 204
2.824
EGL 203
2.861
EGL 202
2.934
EGL 201
2.722
EGL 200
2.770
EGL 199
2.819
EGL 198
2.863
PAL 19
2.777
PAL 18
2.810
PAL 17
2.698
PAL 16
2.645
PAL 15
2.275
PAL 14
2.649
PAL 13
2.438
PAL 12
2.442
PAL 11
2.744
PAL 10
2.146
PAL 9
2.406
PAL 8
2.539
PAL 7
2.035
PAL 6
2.407
PAL 5
2.462
PAL 4
2.503
PAL 3
2.030
PAL 2
1.900
PAL 1
2.313
NF 95
2.302
NF 94
2.271
NF 93
1.871
NF 92
1.798
NF 91
2.287
0 (2)
4.197
MON WELL 2
3.632
MON WELL 1
2.952
BB 104
2.712
BB 103
2.528
BB 102
2.440
BB 101
2.357
BB 100
2.449
BB 99
2.347
BB 98
2.194
BB 97
2.185
BB 96
2.134
BB 95
2.059
BB 94
2.019
BB 93
2.194
BB 92
2.321
BB 91
2.298
EGL 197
2.324
EGL 196
2.405
EGL 195
2.259
EGL 194
2.286
EGL 193
2.356
EGL 192
2.431
EGL 191
2.526
EGL 190
2.463
EGL 189
2.811
EGL 188
2.597
EGL 187
2.492
EGL 186
2.563
EGL 185
2.636
EGL 184
2.602
EGL 183
2.769
EGL 182
2.691
EGL 181
2.515
EGL 180
2.474
EGL 179
2.499
EGL 178
2.552
BB 90
6.124
BB 89
6.250
BB 88
6.155
BB 87
6.276
BB 86
6.304
BB 85
6.297
BB 84
6.389
BB 83
6.464
BB 82
6.312
BB 81
6.474
BB 80
6.451
BB 79
6.455
BB 78
6.448
BB 77
6.484
BB 76
6.482
BB 75
6.428
BB 74
6.465
BB 73
6.301
BB 72
6.484
BB 71
6.359
BB 70
6.341
BB 69
6.101
BB 68
6.368
BB 67
6.181
BB 66
6.193
BB 65
6.240
BB 64
6.284
BB 63
6.207
BB 62
6.183
BB 61
6.002
BB 60
5.910
BB 59
5.852
BB 58
5.859
BB 57
5.966
BB 56
5.774
BB 55
5.851
BB 54
5.834
BB 53
5.903
BB 52
5.812
BB 51
5.781
BB 50
5.783
BB 49
5.909
BB 48
5.975
BB 47
6.148
BB 46
6.117
TB 73
6.280
TB 72
6.908
TB 71
7.151
TB 70
7.325
TB 69
7.669
TB 68
7.628
TB 67
7.715
TB 66
7.615
TB 65
7.579
TB 64
7.637
TB 63
7.300
TB 62
6.860
TB 61
6.905
TB 60
6.752
TB 59
6.282
TB 58
6.847
TB 57
6.472
TB 56
6.132
TB 55
6.183
TB 54
6.023
TB 53
5.245
TB 52
5.623
TB 51
5.843
TB 50
5.845
TB 49
6.012
TB 48
6.031
TB 47
5.970
TB 46
6.068
TB 45
6.033
TB 44
6.081
TB 43
6.175
TB 42
6.253
TB 41
6.346
TB 40
6.211
TB 39
6.068
TB 38
6.159
TB 37
6.249
TB 36
6.294
TB 35
6.329
TB 34
6.255
TB 33
6.139
TB 32
6.111
TB 31
6.271
TB 30
6.235
TB 29
6.194
TB 28
6.022
TB 27
6.075
TB 26
5.963
TB 25
6.056
TB 24
6.122
TB 23
6.133
TB 22
6.166
TB 21
6.192
TB 20
6.241
TB 19
6.257
TB 18
6.125
NF 90
2.339
NF 89
2.434
NF 88
2.498
NF 87
2.502
NF 86
2.550
NF 85
2.543
NF 84
2.427
NF 83
2.497
NF 82
2.470
NF 81
2.484
NF 80
2.524
NF 79
2.465
NF 78
2.480
NF 77
2.498
NF 76
2.604
NF 75
2.321
NF 74
2.481
NF 73
2.432
NF 72
2.454
NF 71
2.514
NF 70
2.337
NF 69
3.035
NF 68
3.267
NF 67
3.390
NF 66
3.858
NF 65
4.026
NF 64
4.102
NF 63
3.922
NF 62
3.897
NF 61
3.485
NF 60
3.562
NF 59
3.666
NF 58
2.647
NF 57
2.696
NF 56
2.418
NF 55
2.375
NF 54
2.403
NF 53
2.283
NF 52
2.476
NF 51
2.026
NF 50
1.859
NF 49
2.006
NF 48
2.398
NF 47
5.492
NF 46
6.179
NF 45
6.299
NF 44
6.350
NF 43
6.360
NF 42
6.319
NF 41
6.218
NF 40
6.268
NF 39
5.958
NF 38
6.178
EGL 177
2.970
EGL 176
2.722
EGL 175
2.614
EGL 174
2.524
EGL 173
2.540
EGL 172
2.575
EGL 171
2.538
EGL 170
2.381
EGL 169
2.438
EGL 168
2.418
EGL 167
2.254
EGL 166
2.165
EGL 165
2.145
EGL 164
2.217
EGL 163
2.221
EGL 162
2.313
EGL 161
2.430
EGL 160
2.491
EGL 159
2.500
EGL 158
2.497
EGL 157
2.334
EGL 156
2.384
EGL 155
2.399
EGL 154
2.506
EGL 153
2.661
EGL 152
2.775
EGL 151
2.721
EGL 150
2.758
EGL 149
2.696
EGL 148
2.769
EGL 147
2.837
EGL 146
2.865
EGL 145
3.036
EGL 144
3.033
EGL 143
3.050
EGL 142
2.789
EGL 141
2.637
EGL 140
2.501
EGL 139
2.553
EGL 138
2.442
EGL 137
2.197
EGL 136
2.132
EGL 135
2.026
EGL 134
2.195
EGL 133
2.597
EGL 132
2.699
EGL 131
2.689
EGL 130
2.480
EGL 129
2.487
EGL 128
2.667
EGL 127
2.744
EGL 126
2.672
EGL 125
2.626
EGL 124
2.519
EGL 123
2.139
EGL 122
2.191
EGL 121
2.109
EGL 120
2.237
EGL 119
2.442
EGL 118
2.523
EGL 117
2.504
EGL 116
2.646
EGL 115
2.824
EGL 114
3.032
EGL 113
3.063
EGL 112
3.002
EGL 111
2.970
EGL 110
2.891
EGL 109
2.648
EGL 108
2.538
EGL 107
2.514
EGL 106
2.465
EGL 105
2.354
EGL 104
2.214
EGL 103
2.142
EGL 102
2.226
EGL 101
2.269
EGL 100
2.560
EGL 99
2.786
EGL 98
2.821
EGL 97
2.840
EGL 96
2.862
EGL 95
2.808
EGL 94
2.668
EGL 93
2.366
EGL 92
2.274
EGL 91
2.353
EGL 90
2.284
EGL 89
2.282
EGL 88
2.429
EGL 87
2.420
EGL 86
2.543
EGL 85
2.485
EGL 84
2.606
EGL 83
2.869
EGL 82
2.903
EGL 81
2.919
NF 37
2.829
NF 36
2.662
NF 35
2.702
NF 34
2.800
NF 33
2.744
NF 32
2.714
NF 31
2.642
NF 30
2.699
NF 29
2.543
NF 28
2.573
NF 27
2.658
NF 26
2.640
NF 25
2.710
NF 24
2.551
NF 23
2.793
NF 22
2.706
NF 21
2.672
NF 20
2.692
0 (1)
4.158
EGL 80
2.972
EGL 79
3.013
EGL 78
2.967
EGL 77
3.049
EGL 76
3.163
EGL 75
3.249
EGL 74
3.320
EGL 73
3.265
EGL 72
3.423
EGL 71
3.383
EGL 70
3.426
EGL 69
3.546
EGL 68
3.534
EGL 67
3.679
EGL 66
3.491
EGL 65
3.414
EGL 64
3.439
EGL 63
3.444
EGL 62
3.287
EGL 61
3.217
EGL 60
3.226
EGL 59
3.177
EGL 58
3.092
EGL 57
3.102
EGL 56
3.013
EGL 55
3.044
EGL 54
3.056
EGL 53
3.100
EGL 52
2.998
EGL 51
3.029
EGL 50
3.049
EGL 49
3.231
EGL 48
3.286
EGL 47
3.309
EGL 46
3.220
EGL 45
3.339
EGL 44
3.293
EGL 43
3.301
EGL 42
3.358
EGL 41
3.371
EGL 40
3.460
EGL 39
3.498
EGL 38
3.438
EGL 37
3.332
EGL 36
3.214
EGL 35
3.163
EGL 34
3.269
EGL 33
3.245
EGL 32
3.234
EGL 31
3.259
EGL 30
3.097
EGL 29
3.186
EGL 28
2.943
EGL 27
2.971
EGL 26
3.023
EGL 25
3.026
EGL 24
3.115
EGL 23
3.094
EGL 22
3.064
EGL 21
3.179
EGL 20
3.201
EGL 19
3.276
EGL 18
3.176
EGL 17
3.242
EGL 16
3.521
EGL 15
3.521
EGL 14
3.528
EGL 13
3.497
EGL 12
3.488
EGL 11
3.513
EGL 10
3.168
EGL 9
3.073
EGL 8
3.114
EGL 7
3.079
EGL 6
3.006
EGL 5
3.031
EGL 4
3.097
EGL 3
3.181
EGL 2
3.119
EGL 1
2.936
TB 17
3.245
TB 16
3.489
TB 15
3.406
TB 14
3.450
TB 13
3.328
TB 12
3.397
TB 11
3.273
TB 10
3.318
TB 9
3.322
TB 8
3.335
TB 7
3.418
TB 6
3.200
TB 5
3.076
TB 4
3.122
TB 3
3.246
TB 2
3.284
TB 1
3.070
BB 45
1.995
BB 44
2.172
BB 43
2.396
BB 42
2.473
BB 41
2.363
BB 40
3.381
BB 39
3.289
BB 38
3.236
BB 37
3.343
BB 36
3.361
BB 35
3.326
BB 34
3.329
BB 33
3.371
BB 32
3.438
BB 31
3.309
BB 30
3.364
BB 29
3.205
BB 28
2.659
BB 27
2.682
BB 26
2.599
BB 25
2.630
BB 24
2.956
BB 23
2.965
BB 22
2.998
BB 21
3.085
BB 20
3.019
BB 19
3.044
BB 18
3.259
BB 17
3.239
BB 16
3.484
BB 15
3.445
BB 14
3.478
BB 13
3.632
BB 12
3.646
BB 11
3.519
BB 10
3.847
BB 9
3.551
BB 8
3.804
BB 7
4.127
BB 6
4.293
BB 5
4.501
BB 4
4.754
BB 3
5.124
BB 2
5.626
BB 1
5.793
NF 19
3.801
NF 18
3.638
NF 17
3.681
NF 16
3.607
NF 15
3.411
NF 14
3.341
NF 13
3.282
NF 12
3.328
NF 11
3.221
NF 10
3.174
NF 9
3.053
NF 8
3.220
NF 7
3.136
NF 6
3.132
NF 5
2.996
NF 4
2.820
NF 3
2.552
NF 2
2.591
NF 1
2.653
PF22
2.794
PF21
2.821
PF20
2.923
PF19
2.914
PF18
3.012
PF17
3.028
PF16
3.056
PF15
3.187
PF14
3.200
PF13
3.228
PF12
3.437
PF11
4.033
PF10
3.805
PF9
3.692
PF8
3.612
PF7
3.533
PF6
3.611
PF5
3.762
PF4
4.499
PF3
5.093
PF2
5.594
PF1
5.647
0
4.912
STS 10
4.415
STS 9
4.022
STS 8
4.462
STS 7
3.283
STS 6
3.836
STS 5
6.044
STS 4
6.821
STS 3
6.320
STS 2
6.224
STS 1
6.303
date:drawn:
revision no.
-
EGL 04
dwg no.job no.
SP003
Damhead Creek Power Station
Levels & labels
scale:
No scale02.02.16
date:
NR
drawn by:
drawing title:
project:
t:0872 654 0140 e: [email protected]
www.siteteamsevices.com
revision:
NOTES:
xxxx
client:

DHC2 Flood Risk Assessment 4-Feb-16
Page 32
Annex C – Plant Layout

Title:
Site/Project:
Date:
Jan 16
Client: Prepared:
DAMHEAD CREEK 2 POWER
STATION - SECTION 36
CONSENT VARIATION
PROPOSED CCGT WITH PEAKING
PLANT SCHEME
INDICATIVE LAYOUT

DHC2 Flood Risk Assessment 4-Feb-16
Page 33
Annex D – Proposed Permeable and Impermeable Site Areas
