johnstons creek catchment flood study final …
TRANSCRIPT
JOHNSTONS CREEK CATCHMENT
FLOOD STUDY
FINAL REPORT
SEPTEMBER 2015

Level 2, 160 Clarence Street Sydney, NSW, 2000 Tel: 9299 2855 Fax: 9262 6208 Email: [email protected] Web: www.wmawater.com.au
JOHNSTONS CREEK CATCHMENT FLOOD STUDY FINAL REPORT SEPTEMBER 2015 Project Johnstons Creek Catchment Flood Study
Project Number 111021
Client City of Sydney
Client’s Representative Shah Alam
Authors Steve Gray Dr. Chin Cheah Zac Richards
Prepared by
Date September 2015
Verified by
Revision Description Distribution Date 4 Final report Shah Alam Sep 2015 3 Draft Report for Public Exhibition Shah Alam Aug 2014 2 Draft Report Shah Alam May 2012 1 Preliminary Draft Report Shah Alam Dec 2011

JOHNSTONS CREEK CATCHMENT FLOOD STUDY
TABLE OF CONTENTS
PAGE
FOREWORD ............................................................................................................................... i
EXECUTIVE SUMMARY ............................................................................................................ ii
1. INTRODUCTION ........................................................................................................ 1
1.1. Objectives ................................................................................................... 1
1.2. Study Area .................................................................................................. 1
1.3. Catchment History ...................................................................................... 2
1.3.1. Flooding History .......................................................................................... 3
1.4. Drainage System ........................................................................................ 4
2. AVAILABLE DATA .................................................................................................... 5
2.1. Background ................................................................................................ 5
2.2. Previous Reports ........................................................................................ 5
2.2.1. Johnstons Creek SWC 55 Capacity Assessment, Sydney Water, December 1995 (Reference 1) .................................................................................. 5
2.2.2. Leichhardt Flood Study – Volume 1, Cardno Lawson Treloar, Prepared for Leichhardt Council, June 2010 (Reference 2) .......................................... 6
2.2.3. Harold Park – WSUD & Flood Risk Management (Stage 1), Cardno Lawson Treloar, Prepared for City of Sydney, January 2010 (Reference 3) .......... 6
2.2.4. South Sydney Stormwater Quality and Quantity Study, Blackwattle Bay and Johnstons Creek Catchments, Hughes Trueman & Perrens Consultants, September 2004 (Reference 6) ................................................................ 6
2.3. Survey Data ................................................................................................ 7
2.4. Pit and Pipe Data ........................................................................................ 7
2.5. Johnstons Creek Channel Cross Section .................................................... 8
2.6. Rainfall Data ............................................................................................... 8
2.6.1. Historical Rainfall Data ............................................................................... 8
2.6.2. Design Rainfall Data ................................................................................. 10
2.7. Downstream Boundary Water Levels ........................................................ 11
2.8. Johnstons Creek Channel Upstream Inflows ............................................ 11
2.9. Community Consultation ........................................................................... 12
3. APPROACH ............................................................................................................. 13
4. MODEL BUILD ......................................................................................................... 14

4.1. Overview .................................................................................................. 14
4.2. Hydrology ................................................................................................. 14
4.2.1. Rainfall on Grid Considerations ................................................................ 15
4.2.2. Check Integrity of Rainfall on Grid Methodology ....................................... 15
4.2.3. Loss Parameters ...................................................................................... 16
4.2.4. Percentage Impervious ............................................................................. 16
4.3. Hydraulic Modelling .................................................................................. 17
4.3.1. Model Build Process ................................................................................. 17
4.3.2. Model Domain and Grid ............................................................................ 17
4.3.3. Roughness Values.................................................................................... 18
4.3.4. Pit and Pipe Network ................................................................................ 18
4.3.5. Trunk Drainage Blockage ......................................................................... 19
4.3.6. Boundary Conditions ................................................................................ 19
4.4. Model Calibration/Validation Events ......................................................... 19
5. CLIMATE CHANGE ................................................................................................. 21
6. HYDRAULIC MODELLING ...................................................................................... 23
6.1. Approach .................................................................................................. 23
6.2. Verification Results ................................................................................... 23
6.3. Critical Duration ........................................................................................ 23
6.4. Overview of Results .................................................................................. 24
6.5. Results at Key Locations .......................................................................... 24
6.5.1. Major Access Road Flooding .................................................................... 29
6.6. Flood Hazard Classification ...................................................................... 29
6.7. Sensitivity Analysis ................................................................................... 30
6.8. Climate Change Results ........................................................................... 32
6.8.1. Rainfall Increase ....................................................................................... 32
6.8.2. Sea Level Rise ......................................................................................... 33
6.9. Flood Damages Assessment .................................................................... 35
6.9.1. Tangible Flood Damages .......................................................................... 37
6.9.2. Intangible Flood Damages ........................................................................ 40
7. CONCLUSIONS ....................................................................................................... 42
8. ACKNOWLEDGEMENTS ......................................................................................... 44
9. REFERENCES ......................................................................................................... 45

LIST OF APPENDICES
Appendix A: Glossary
Appendix B: Identification of Potential Flood Liable Buildings
Appendix C: Floor Level Database
Appendix D: Johnstons Creek Channel Cross Sections
LIST OF DIAGRAMS Diagram 1: Approach Adopted in a Flood Study ........................................................................ 13
Diagram 2: Flood Damages Categories (including damage and losses from permanent inundation) ................................................................................................................................ 36
LIST OF PHOTOGRAPHS Photo 1: Flooding on Sparkes Street. .......................................................................................... 3
Photo 2: Flooding on Sparkes Street ........................................................................................... 3
Photo 3: Flooding on Sparkes Street ........................................................................................... 4
Photo 4: Parking lot on Sparkes Street ....................................................................................... 4
LIST OF TABLES
Table 1: Modelled Pit and Pipe Network ..................................................................................... 8
Table 2: Rainfall Data Sources .................................................................................................... 8
Table 3: Events Identified from Annandale Gauge ...................................................................... 9
Table 4: Events Identified from Marrickville Gauge ..................................................................... 9
Table 5: IFD Data for Johnstons Creek Catchment ................................................................... 10
Table 6: Probable Maximum Precipitation Depths (rounded to the nearest 10 mm) .................. 10
Table 7: Comparable Catchment Hydrologic Model Check ....................................................... 16
Table 8: Adopted Design Rainfall Loss Parameters .................................................................. 16
Table 9: Percent Imperviousness for Various Land Uses .......................................................... 17
Table 10: Adopted Manning’s ‘n’ values .................................................................................... 18
Table 11: Peak Flood Depths (m) and Velocities (m/s) at Key Locations (refer to Figure 13) .... 25
Table 12: Peak Flood Levels (mAHD) at Key Locations (refer to Figure 13) .............................. 26
Table 13: Peak Flow Distribution (m3/s) across Key Locations in the Johnstons Ck Catchment (refer to Figure 13) .................................................................................................................... 27
Table 14: Over-floor Flood Liability for Johnstons Creek Catchment ......................................... 28
Table 15: Parramatta Road Peak Flood Depths (m) for Various Events .................................... 29
Table 16: Hazard Classification ................................................................................................. 30
Table 17: Sensitivity Analysis of Flows ...................................................................................... 31
Table 18: Sensitivity Analysis of Flood Levels ........................................................................... 31
Table 19: Results for Rainfall Increase Scenarios ..................................................................... 33
Table 20: Results for Sea Level Rise Scenarios ........................................................................ 34
Table 21: Estimated Combined Flood Damages for Johnstons Creek Catchment ..................... 38
Table 22: Estimated Residential Flood Damages for Johnstons Creek Catchment ................... 39
Table 23: Estimated Commercial and Industrial Flood Damages for Johnstons Creek Catchment ................................................................................................................................................. 40

LIST OF FIGURES Figure 1: Locality Map
Figure 2: Study Area
Figure 3: Drainage System and Hydraulic Model Layout Figure 4: Rainfall and Pluviometer Gauge Locations
Figure 5: IFD Plots of Recent Events – Annandale Gauge
Figure 6: IFD Plots of Recent Events – Sydney Observatory Hill Gauge
Figure 7: Community Consultation - Respondents
Figure 8: Community Consultation – Results
Figure 9: Hydrological Subcatchments
Figure 10: Land Use Map
Figure 11: Model Verification
Figure 12: Critical Duration Map - 1% AEP Design Flood Event Figure 13: Tabulated Flooding Locations
Figure 14: Peak Flood Depth – 5Y ARI Design Flood Event Figure 15: Peak Flood Depth - 10% AEP Design Flood Event Figure 16: Peak Flood Depth - 5% AEP Design Flood Event Figure 17: Peak Flood Depth - 2% AEP Design Flood Event Figure 18: Peak Flood Depth - 1% AEP Design Flood Event Figure 19: Peak Flood Depth - PMF Event Figure 20: Peak Flood Level - 1% AEP Design Flood Event Figure 21: Peak Flood Level - PMF Event Figure 22: Peak Flood Velocity - 1% AEP Design Flood Event Figure 23: Peak Flood Velocity - PMF Event Figure 24: Johnstons Creek Flood Profiles – All Design Flood Events
Figure 25: Johnstons Creek Flood Profiles – Climate Change Scenarios
Figure 26: Provisional Hazard Categories – 5Y ARI Design Flood Event Figure 27: Provisional Hazard Categories - 10% AEP Design Flood Event Figure 28: Provisional Hazard Categories - 5% AEP Design Flood Event Figure 29: Provisional Hazard Categories - 2% AEP Design Flood Event Figure 30: Provisional Hazard Categories - 1% AEP Design Flood Event Figure 31: Provisional Hazard Categories - PMF Event Figure 32: Preliminary Hydraulic Categories – 5Y ARI Design Flood Event Figure 33: Preliminary Hydraulic Categories - 10% AEP Design Flood Event Figure 34: Preliminary Hydraulic Categories - 5% AEP Design Flood Event Figure 35: Preliminary Hydraulic Categories - 2% AEP Design Flood Event Figure 36: Preliminary Hydraulic Categories - 1% AEP Design Flood Event Figure 37: Preliminary Hydraulic Categories - PMF Event Figure 38: Impacts – 10% Rainfall Increase - 1% AEP Design Flood Event Figure 39: Impacts – 20% Rainfall Increase - 1% AEP Design Flood Event Figure 40: Impacts – 30% Rainfall Increase - 1% AEP Design Flood Event Figure 41: Impacts – Sea Level Rise 2050 Scenario - 1% AEP Design Flood Event Figure 42: Impacts – Sea Level Rise 2100 Scenario - 1% AEP Design Flood Event Figure 43: Properties with FL Inundated for Design Flood Events
Figure 44: Locations of Bridges Along Johnstons Creek
Figure B1: Surveyed Properties

Johnstons Creek Catchment Flood Study
WMAwater 111021:JCFS_Final_Report_Sept15:September 2015 i
FOREWORD The NSW State Government’s Flood Policy provides a framework to ensure the sustainable use of floodplain environments. The Policy is specifically structured to provide solutions to existing flooding problems in rural and urban areas. In addition, the Policy provides a means of ensuring that any new development is compatible with the flood hazard and does not create additional flooding problems in other areas. Under the Policy, the management of flood liable land remains the responsibility of local government. The State Government subsidises flood mitigation works to alleviate existing problems and provides specialist technical advice to assist Councils in the discharge of their floodplain management responsibilities. The Federal Government may also provide subsidies in some circumstances. The Policy provides for technical and financial support by the Government through four sequential stages: 1. Flood Study
Determine the nature and extent of the flood problem. 2. Floodplain Risk Management
Evaluates management options for the floodplain in respect of both existing and proposed development.
3. Floodplain Risk Management Plan Involves formal adoption by Council of a plan of management for the floodplain.
4. Implementation of the Plan Construction of flood mitigation works to protect existing development, use of
Local Environmental Plans to ensure new development is compatible with the flood hazard.
The Johnstons Creek Catchment Flood Study presented herein constitutes the first stage in the Floodplain Risk Management Program for the catchment (see Figure 1 for catchment location and extent). WMAwater has been engaged by the City of Sydney to prepare the Flood Study under the guidance of Council’s floodplain management committee. This study provides the basis for the future management of those parts of the Johnstons Creek catchment which are flood liable and within the City of Sydney local government area.

Johnstons Creek Catchment Flood Study
WMAwater 111021:JCFS_Final_Report_Sept15:September 2015 ii
EXECUTIVE SUMMARY The NSW Government’s Flood Policy provides for: a framework to ensure the sustainable use of floodplain environments, solutions to flooding problems, a means of ensuring new development is compatible with the flood hazard. Implementation of the Policy requires a four stage approach, the first of which is preparation of a Flood Study to determine the nature and extent of the flood problem. The Johnstons Creek Flood Study was initiated as a result of substantial flooding of roads and residential areas, most recently in November 1984, January 1991 and April 1998. This report has been prepared by WMAwater on behalf of the City of Sydney (Council) and the Office of Environment and Heritage (OEH) under the guidance of Council’s floodplain management committee. The specific aims of the Johnstons Creek Flood Study are to: define flood behaviour in terms of flood levels, depths, velocities, flows and extents
within the Johnstons Creek catchment study area; prepare flood hazard and flood extent mapping; prepare suitable models of the catchment and floodplain for use in a subsequent
Floodplain Risk Management Study; to consider the potential effects of a climate change induced increase in design rainfall
intensities and sea level rise; and carry out a flood damages assessment using surveyed floor levels. Description of Study Area (Section 1.2 of report): The Johnstons Creek catchment is located west of the Sydney CBD. This region lies within the City of Sydney and Leichhardt Council Local Government Areas. The study area covers only a portion of the catchment (224ha, approximately 50% of the catchment area) and has been extensively developed for urban usage. The study area utilises Sydney Water’s major trunk drainage system (known as SWC55) to remove water from the region. SWC55 is composed of various branches which route flow from the upper catchment and then discharge into Rozelle Bay via a large open channel. The trunk drainage system is linked to Council’s feeder drainage system consisting of covered channels, in-ground pipes, culverts and kerb inlet pits. Parts of the catchment lie within the University of Sydney campus. A number of locations within the catchment are flood liable. This flood liability mainly relates to the nature of the topography within the study area as well as the capacity of service provided by drainage assets. The topography of the catchment is steep in the upper areas, steep and undulating in the middle sections, and then flat particularly in the lower regions close to Rozelle
Johnstons Creek Catchment Flood Study
WMAwater 111021:JCFS_Final_Report_Sept15:September 2015 iii
Bay. Urbanisation throughout the catchment occurred prior to the installation of road drainage systems in the 1900s and many buildings have been constructed on overland flow paths or in unrelieved sags. Due to these drainage restrictions, topographic depressions can cause localised flooding as excess flows have no opportunity to escape via overland flow paths. This creates a significant drainage/flooding problem in many areas throughout the catchment. Past Flooding Problems (Sections 1.3 of report): Catchment development has caused significant increases in peak runoff rates and volumes as well as restrictions in the conveyance capacity of overland flow paths. Consequently, numerous floods have occurred in the catchment with June 1949, November 1961, March 1975, November 1984, January 1991 and February 2001 being some of the most significant. Available Data (Section 2 of report): Four previous reports salient to the current study were examined. Results from the 2010 Leichhardt Flood Study carried out by Cardno (Reference 2) were used to inform upstream inflows entering into the Johnstons Creek channel that was modelled as part of this study. Airborne Laser Scanning (ALS) survey (provides a very accurate and detailed definition of the ground surface) was available for the entire study area and was used to determine catchment areas as well as to define the topography for the hydraulic models. Council provided details on the pit and pipe network within the catchment. A community questionnaire survey was undertaken during June 2011 with a return rate of 1% (59 responses) which aided in identification of problem flood regions within the catchment. Approach (Section 3 of report): In the absence of an extensive historical flood record, a flood frequency approach cannot be undertaken for the Johnstons Creek catchment. Therefore, design rainfalls have been used in conjunction with the establishment of a hydrologic/hydraulic modelling system. A variation on the direct rainfall on grid approach has been used in the hydrodynamic modelling package TUFLOW which negates the need for a separate hydrologic model. Calibration to Historical Flood Levels (Section 4.4 of report): Due to a lack of available data, calibration (matching of actual flood height data to that produced from the models and so verifying the accuracy of the models) of the TUFLOW model could not be undertaken. This situation is typical of many urban catchments where there are limited flood records available. However basic flood extents have been verified by comparisons to the data acquired from the community consultation. In addition to this, the Blackwattle Bay Flood Study (a neighboring catchment), carried out simultaneous to this study, was calibrated to historical events and the same hydrologic parameters have been used. This generally indicates that the results from TUFLOW sufficiently replicated true catchment flooding conditions. However immediately following the next major flood event both rainfall and flood level data should be collected and used to further verify the results as per the 2005 NSW Floodplain Development Manual

Johnstons Creek Catchment Flood Study
WMAwater 111021:JCFS_Final_Report_Sept15:September 2015 iv
recommendations. Determination of Design Flood Flows and Levels (Section 6.4 of report): Design rainfall data from the Bureau of Meteorology and design rainfall patterns from Australian Rainfall and Runoff (1987) were obtained and input to the modelling procedure to obtain the design flood data. Detailed mapping was undertaken for a range of design events (5 year ARI, 10%, 5%, 2%, 1% AEP events and the Probable Maximum Flood) with the results provided as maps showing:
Peak flood depths for all design flood events, Figure 14 - Figure 19; Peak flood levels for the 1% AEP and PMF flood events, Figure 20 - Figure 21; Peak flood velocity for the 1% AEP and PMF flood events, Figure 22 - Figure 23; Flood profiles for the Johnstons Creek channel for all design flood events and the climate
change scenarios, Figure 24 - Figure 25; Provisional flood hazard categorisation for all design flood events, Figure 26 - Figure 31; Preliminary flood hydraulic categorisation for all design flood events, Figure 32 - Figure
37; and Climate change scenarios (rainfall increases and sea level rise), Figure 38 - Figure 42.
Accuracy of Design Flood Levels and Extents (Sections 6.7 and 6.8): Sensitivity analyses (to assess the effects of changing various model parameters) were undertaken on model results. Part of this analysis was to assess the effects of possible increases in design rainfall (10%, 20% and 30%) due to climate change. The results indicate that the average increase (based on a comparison of the peak flood level at selected review points) in the 1% AEP event is:
low level rainfall increase of 10% = +0.1m, medium level rainfall increase of 20% = +0.1m, high level rainfall increase of 30% = +0.2m.
However the results do show some variation between locations. On the other hand, the impacts of sea level rise are largely confined to the low lying areas adjacent to Rozelle Bay and Johnstons Creek. The model results are much less sensitive to changes of the model parameter values. The most sensitive parameter was the pipe/culvert blockage factor which resulted in a maximum change in peak flood level of ±0.4m. Due to the lack of calibration data available and in view of the sensitivity analyses, it is estimated that the order of accuracy of the design flood levels is up to ±0.2m, however in many places the order of accuracy will be ±0.1m. These orders of accuracy are typical of such studies and can only be improved upon with additional observed flood data to refine the model calibration and more detailed and accurate definition of the terrain.

Johnstons Creek Catchment Flood Study
WMAwater 111021:JCFS_Final_Report_Sept15:September 2015 v
Flood Damages Assessment (Section 6.9): A flood damages assessment was undertaken for existing development in accordance to the OEH guidelines (Reference 19). The assessment was based on detailed floor level survey carried out by Council’s surveyors and flood levels produced from the modelling of design events herein. Only properties which have surveyed floor levels have been included in the flood damages assessment. Table i indicates the estimated number of building floors which are likely to be flooded for a range of event magnitudes and the corresponding tangible damages. Damages to public structures have not been assessed.
Table i: Estimated Combined Flood Damages for Johnstons Creek Catchment
Event Number of
Properties Flood Affected
No. of Properties Flooded Above Floor
Level Total Tangible Flood
Damages* Average Tangible
Damages Per Flood Affected Property
5 year ARI 111 38 $ 3,281,700 $ 29,600 10% AEP 127 61 $ 4,311,900 $ 34,000 5% AEP 138 75 $ 5,358,000 $ 38,900 2% AEP 148 82 $ 6,080,100 $ 41,100 1% AEP 159 94 $ 7,027,200 $ 44,200
PMF 180 139 $ 14,320,800 $ 79,600 Average Annual Damages (AAD) $ 2,277,900 $ 12,700
* Excludes all damages to public assets but includes external damages that may or may not occur with building floor inundation.
Outcomes: The main outcomes of this study are:
full documentation of the methodology and results, preparation of depth, velocity, hazard and extent maps for the study area, an assessment of the potential impacts of climate change on flooding, and a modelling platform that will form the basis for a subsequent Floodplain Risk
Management Study and Plan. Recommendations: This Flood Study should be adopted by Council before proceeding with the subsequent Floodplain Risk Management Study and Plan. As part of these subsequent studies a risk analysis of the implications of climate change on flooding should be undertaken. The key recommendation from this study is to highlight the importance of collecting and maintaining a database of historical rainfall and flood height data. It is vital that information from future flood events is collected within 24 hours and the magnitude and direction of flow paths through private property recorded. This information will significantly improve the accuracy of the design flood levels and extents and ensure that known flood areas are identified and assessed. Data collection can be undertaken by Council Officers digitally photographing flood marks etc (they can be surveyed later based on the photographs) and possibly mailing out a resident questionnaire requesting information and photographs. Unfortunately if this process is not done quickly, information is lost forever.

Johnstons Creek Catchment Flood Study
WMAwater 111021:JCFS_Final_Report_Sept15:September 2015 1
1. INTRODUCTION
This Flood Study has been prepared by WMAwater (formerly Webb, McKeown & Associates) on behalf of the City of Sydney (Council). The main objective of this study is to define the flood behaviour in the Johnstons Creek catchment (the catchment) under existing conditions. A flood assessment has been undertaken for a range of design storms. The findings in this report provide information to inform Council with regards to managing existing and future flood risk within the catchment. All levels provided in this report are to Australian Height Datum (AHD). A glossary of terms is provided as Appendix A. 1.1. Objectives
The information and results obtained from this Flood Study will define existing flood behaviour and provide a firm basis for the development of a subsequent Floodplain Risk Management Study and Plan. In addition to defining the flood behaviour (5 year ARI, 10%, 5%, 2%, 1% AEP events and the Probable Maximum Flood (PMF)) in the Johnstons Creek catchment, the study was developed to:
Define flood behaviour in terms of flood levels, depths, velocities, flows and flood extents within the study area;
Provide provisional flood hazard and flood extent mapping (for all design events modelled); and
Consider the potential effects of a climate change induced increase in design rainfall intensities and sea level rise in accordance with the NSW Government guidelines1.
1.2. Study Area
The Johnstons Creek catchment is located immediately west of the Sydney CBD and lies within the City of Sydney and Leichhardt Council Local Government Areas (LGA). The catchment has a total area of 460 ha, though the study area is limited to the City of Sydney LGA. This Study Area (224 ha) is approximately half of that of the total catchment area and is located in the inner city suburbs of Annandale, Camperdown, Forest Lodge, Glebe and Newtown (see Figure 1). This region has been extensively developed for urban usage. Land use is predominantly medium to high-density housing with commercial zoned regions concentrated along Parramatta Road and King Street (Newtown) and industrial land largely situated between Pyrmont Bridge Road and Parramatta Road. Regions of open space are also positioned throughout the catchment particularly in the vicinity of the University of Sydney and in recreational parks such
1 It should be noted, however that in September 2012 the NSW Government repealed mandatory compliance with the 0.4 m sea level rise by the year 2050 and 0.9 m sea level rise by the year 2100. Councils in NSW must now make their own decisions regarding the assessment of sea level rise.
Johnstons Creek Catchment Flood Study
WMAwater 111021:JCFS_Final_Report_Sept15:September 2015 2
as Camperdown Park, Harold Park, Jubilee Park, Federal Park and Bicentennial Park. The entire study area (with the exception of the immediate Sydney Harbour foreshore) drains to Sydney Water’s major trunk drainage system (known as SWC55). SWC55 is composed of various branches, the main one being Johnstons Creek, which route flow from a number of distinctly separate sub-catchments in the upper regions of the catchment. Flow is discharged into Rozelle Bay via Johnstons Creek which is a large concrete lined channel. The trunk drainage system is linked to Council’s feeder drainage system consisting of covered channels, in-ground pipes, culverts and kerb inlet pits. Further information on the drainage system is presented in Section 1.4. A number of locations within the catchment are flood liable. This flood liability mainly relates to the nature of the topography within the study area as well as the capacity of service provided by drainage assets. The topography of the catchment is steep in the upper areas, steep and undulating in the middle sections, and then flat particularly in the lower regions close to Rozelle Bay (see Figure 2). The upper regions of the catchment experience the greatest relief with a maximum elevation of approximately 45m AHD occurring in the vicinity of Kings Street (Newtown). Urbanisation throughout the catchment occurred prior to the installation of road drainage systems in the 1900s and many buildings have been constructed on overland flow paths or in unrelieved sags. Due to these drainage restrictions, topographic depressions can cause localised flooding as excess flows have no opportunity to escape via overland flow paths. This creates a significant drainage/flooding problem in many areas throughout the catchment. Significant development is proposed within the catchment in the form of the Harold Park re-development. This will see a site currently disused (previously used as a paceway) converted into a primarily residential space. Drainage features relating to the sub-catchment will be altered as the current proposal sees the existing Lillie Bridge culvert removed and replaced by an upgraded structure which is also realigned further to the east. Overall it is a requirement that the proposal not impact on upstream or downstream flood levels and as such the redevelopment is not expected to alter flood levels (Reference 20). 1.3. Catchment History
The Johnstons Creek catchment was first settled in the early 1800s. The original natural drainage system comprised numerous rock gullies draining through small pockets of mangroves and into various coves that have now been consolidated into Rozelle Bay. As development proceeded, the natural drainage lines were converted into a constructed drainage system of open channels and sub surface elements. During the late 1800s and early 1900s, urbanisation in the area spread significantly. This development led to a widespread change in land usage from predominantly pervious to largely impervious uses, greatly increasing peak flows and the overall flow volume. By the late 1900s, the majority of the upper channel system was progressively covered over and piped, with much of this system forming the backbone of today’s stormwater drainage system.

Johnstons Creek Catchment Flood Study
WMAwater 111021:JCFS_Final_Report_Sept15:September 2015 3
In summary, the effect of development was a significant increase in peak runoff rates and volumes combined with a restriction in the conveyance capacity of overland flow paths. The existing pattern and intensity of development would not permit restoration of natural conditions and sufficient land is not available to achieve this.
1.3.1. Flooding History
Historical records (i.e. photographs, reports) indicate that rainfall intensities as low as 2 year ARI levels can cause flooding at many locations within the catchment. Consequently there have been many instances of flooding in the past with June 1949, November 1961, March 1975, November 1984, January 1991 and April 1998 being some of the most significant storm events causing extensive flooding throughout the catchment. Section 2.6.1 provides details on a number of these past rainfall events responsible for the above mentioned floods. To further highlight the potential magnitude of flooding in the region, Council has provided photographs (Photo 1 to Photo 4) of Arundel Street/Sparkes Street during a recent flood that occurred on 30th of May 2011. These photographs were received in a letter from a resident detailing this event. Reports indicated that flood depths of up to 500 mm were experienced. Analysis of the rainfall at the Annandale Gauge revealed that this event had a maximum recurrence interval of 1 year (see Section 2.6.1). This location is approximately 1.5 km from the gauge and thus results indicated that this storm may have been highly localised with a large spatial gradient. Localised drainage issues are also likely to have contributed to flooding in this region during this event.
Photo 1: Flooding on Sparkes Street.
Photo 2: Flooding on Sparkes Street

Johnstons Creek Catchment Flood Study
WMAwater 111021:JCFS_Final_Report_Sept15:September 2015 4
Photo 3: Flooding on Sparkes Street
Photo 4: Parking lot on Sparkes Street
1.4. Drainage System
The catchment is serviced by a major/minor drainage system. Property drainage is directed to the kerb/gutter system where it is then able to enter the Council owned minor street drainage network. Flow is then routed into the Sydney Water Corporation (SWC) owned and maintained SWC55 trunk drainage system. This trunk drainage system is composed of numerous branches that route water from the catchment extents to the main drainage channel running south-north through the catchment. A list of the six main trunk drainage branches that are contained within the study area is presented below and illustrated in Figure 3:
Johnstons Creek Branch, • Lillie Bridge Branch, • Orphan School Creek Branch,
- Hockey Field Sub-Branch, - Physics School Relief Sub-Branch, - Saint Andrews College Sub-Branch.
The Johnstons Creek Branch starts as an open channel at Salisbury Road and then runs through the Federal, Jubilee and Bicentennial Parks before discharging into Rozelle Bay. All other branches mentioned above are in ground culverts. The capacity of the trunk drainage system in the study area varies greatly depending on location. Some reaches in this system are unable to pass an event with a 6 month recurrence interval and the large majority fail for events with flows as small as 3 year ARI discharges (Reference 1). Further details are provided in Section 2.2.1. When the capacity of the drainage system is exceeded there is the potential for velocities and/or flow depths combining to generate high hazard flooding conditions. The lack of capacity of the trunk drainage system indicates that relatively small events can cause these conditions in numerous locations throughout the study area. Section 6.5 discusses the flood liability of some key locations within the catchment.

Johnstons Creek Catchment Flood Study
WMAwater 111021:JCFS_Final_Report_Sept15:September 2015 5
2. AVAILABLE DATA
2.1. Background
Various items of data as well as reports salient to the study have been collected and reviewed. Most reports and datasets were sourced from Council and supplemented by additional survey where required. Reports were reviewed particularly for topographic/hydrologic parameters as well as observations of historical flood events. Of particular importance were the Johnstons Creek upstream inflow hydrographs obtained from Cardno from the 2010 Leichhardt Flood Study (Reference 2). These were used as a boundary condition in the modelling of the lower part of the Johnstons Creek Channel that is incorporated into the Johnstons Creek hydraulic model (see Figure 3). For further details please refer to Section 2.8. This section provides a summary of the reports as well as a description of the various forms of data utilised in the study. 2.2. Previous Reports
2.2.1. Johnstons Creek SWC 55 Capacity Assessment, Sydney Water, December 1995 (Reference 1)
This report by Sydney Water assesses the quantitative capacity of the drainage system covering the Johnston Creek stormwater drainage area. The major trunk line (SWC55) covers Johnstons Creek Drainage area which falls into three LGAs: Leichhardt, Marrickville and South Sydney (now City of Sydney). This drainage system is one of the five declared within the Johnstons Creek area and covers an area of 460 hectares. The major drainage branches covered by this report are: Stanmore Branch, Orphan School Creek Branch and Lillie Bridge Branch. These branches all drain into the main channel which then drains into Rozelle Bay. The key points regarding storm event capacity (the capacity) of the major branches are as follows:
Main Channel Branch – open portion: Relatively poor, approximately 6 month to the 3 year ARI flood event.
Orphan School Creek Branch: This branch covers a significant portion of the catchment and as such the capacity varies throughout the length of the branch. For instance the upstream portion of the branch which separates into two tributaries (in Sydney University) has a capacity averaging greater than 25 years. The presence of numerous basins/playing fields in this area also aid in the retardation of flow. Downstream of this the capacity of the Orphans Creek Branch is relatively poor having an estimated capacity of 1- 3 years.
Lillie Bridge Branch: The capacity of this branch is generally poor ranging from less than 1 year to 3-4 year ARI.

Johnstons Creek Catchment Flood Study
WMAwater 111021:JCFS_Final_Report_Sept15:September 2015 6
2.2.2. Leichhardt Flood Study – Volume 1, Cardno Lawson Treloar,
Prepared for Leichhardt Council, June 2010 (Reference 2)
This report aims to define the flood behaviour in the Leichhardt LGA and determine flooding behaviour for the 20%, 10%, 5%, 2%, 1% AEP design floods as well as the Probable Maximum Flood (PMF). The catchment for the study covers the following suburbs: Annandale, Leichhardt, Lilyfield, Rozelle, Balmain, and Balmain East. The area covered is approximately 10.7 km2 (1070 ha). Included in this study are major creek systems: White Creek, Johnstons Creek and Hawthorne Canal. The major trunk drainage systems are owned and operated by Sydney Water Corporation. The Johnstons Creek catchment is comprised of flows from Leichhardt, City of Sydney and Marrickville LGA. Due to the overlap in hydrologic boundary and LGA boundaries, the study was required to include inflows from areas outside of the area of interest (e.g. within the current study area). For this the study used hydrological modelling software XP-RAFTS, to estimate inflows from these areas. These flows were then applied in a 2D hydraulic model (SOBEK). The study area itself was modelled using the direct rainfall on grid methodology. 2.2.3. Harold Park – WSUD & Flood Risk Management (Stage 1), Cardno
Lawson Treloar, Prepared for City of Sydney, January 2010 (Reference 3)
The report contains an analysis of the existing Harold Park Paceway site covering 10.5 ha. The site is being considered for redevelopment and this study forms part of an urban design strategy by City of Sydney. The Lillie Bridge culvert catchment has an area of 46 ha which is serviced by the Lillie Bridge culvert that drains to Johnstons Creek via Harold Park. This SWC culvert is to be substantially upgraded as part of the proposed site redevelopment. The study models on site flood behaviour and identifies constraints on redevelopment, as well as flood mitigation strategies. A 1D/2D hydraulic SOBEK model was used to define flood extent and flooding behaviour. The stormwater management component of the study was modelled using MUSIC. 2.2.4. South Sydney Stormwater Quality and Quantity Study, Blackwattle
Bay and Johnstons Creek Catchments, Hughes Trueman & Perrens Consultants, September 2004 (Reference 6)
This report was commissioned by South Sydney Council (now known as City of Sydney) on behalf of a Consortium comprising Council, Sydney Water Corporation and South Sydney Development Corporation to assess the performance of the trunk drainage systems in the Johnstons Creek and Blackwattle Bay Catchments. The two trunk drainage systems SWC17

Johnstons Creek Catchment Flood Study
WMAwater 111021:JCFS_Final_Report_Sept15:September 2015 7
and SWC55 (Blackwattle Bay and Johnston Creek respectively) lie within the City of Sydney LGA. The study aims at providing stormwater management options for Johnston Creek and Blackwattle Bay. Key issues examined in the report are as follows:
Analysis of the origin and causes of stormwater flows that contribute to stormwater flooding;
Strategies for managing stormwater flooding; Options for reducing stormwater flooding; Water quantity and quality management opportunities; and Water quality improvement.
The study modelled stormwater flows using the DRAINS modelling package. The DRAINS model was then used to produce a summary of pipe flows estimates, estimates of potential overland flow paths and estimates of flood depths in sag points. 2.3. Survey Data
Airborne Laser Scanning (ALS) data of the site was obtained from Council to define ground surface elevations. The ALS data provided was a combination of data collected in 2007 and 2008 with a 1.3 m average point separation. The ALS provides ground level spot heights from which a Digital Elevation Model (DEM) can be constructed. For well defined points mapped in areas of clear ground, the expected nominal point accuracies (based on a 68% confidence level) are ±0.15 metre (vertical accuracy). When interpreting the above, it should be noted that the accuracy of the ground definition can be adversely affected by the nature and density of vegetation and/or the presence of steeply varying terrain. This data formed the foundation of the 2D hydraulic model build process. 2.4. Pit and Pipe Data
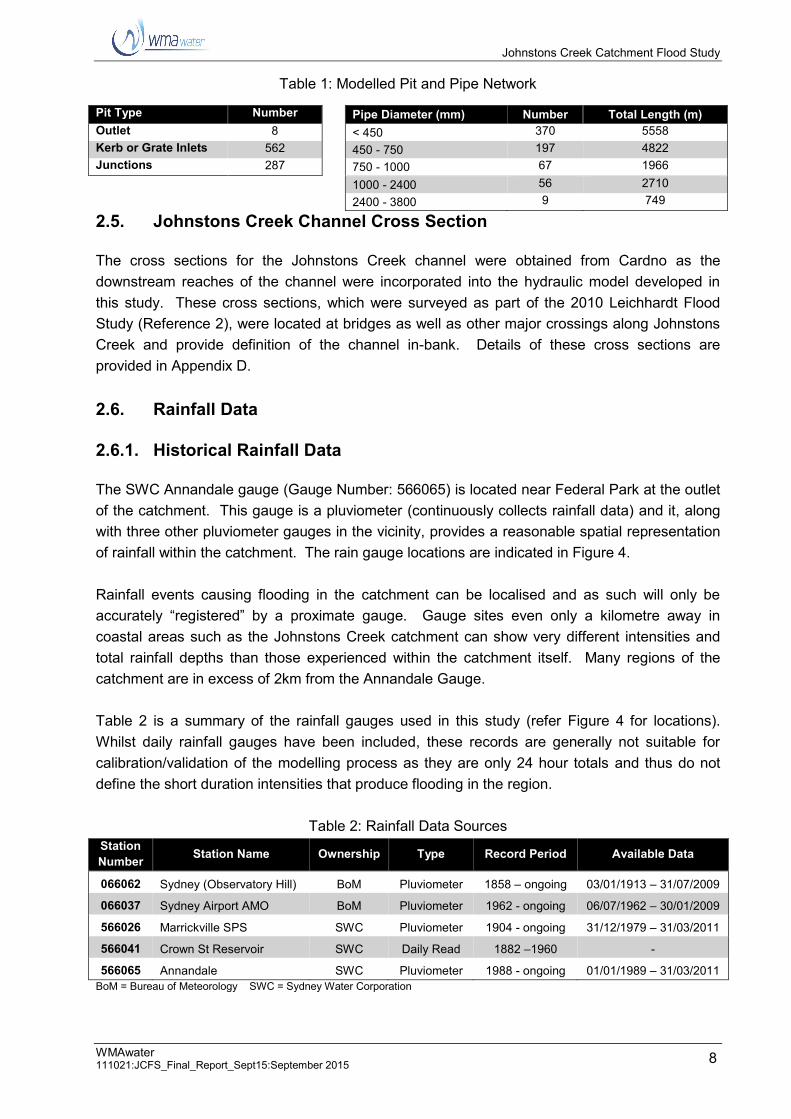
Council provided a database of the pit and pipe network dated 21st March 2011, a summary of which is shown in Figure 3. The physical details included:
coordinates of each pit; linkage between pits; pipe dimensions; and pit details (type of pit, inlet type and dimensions and depth to invert).
Where the pit and pipe information was not available from Council’s database, estimates were made via StreetView in Google Maps, by site inspection or interpolation from the existing data. In these cases the pit inlet levels were obtained from the DEM. Table 1 contains a summary of the pit and pipe data used during modelling.
Johnstons Creek Catchment Flood Study
WMAwater 111021:JCFS_Final_Report_Sept15:September 2015 8
Table 1: Modelled Pit and Pipe Network
Pit Type Number Pipe Diameter (mm) Number Total Length (m) Outlet 8 < 450 370 5558 Kerb or Grate Inlets 562 450 - 750 197 4822 Junctions 287 750 - 1000 67 1966 1000 - 2400 56 2710 2400 - 3800 9 749
2.5. Johnstons Creek Channel Cross Section
The cross sections for the Johnstons Creek channel were obtained from Cardno as the downstream reaches of the channel were incorporated into the hydraulic model developed in this study. These cross sections, which were surveyed as part of the 2010 Leichhardt Flood Study (Reference 2), were located at bridges as well as other major crossings along Johnstons Creek and provide definition of the channel in-bank. Details of these cross sections are provided in Appendix D. 2.6. Rainfall Data
2.6.1. Historical Rainfall Data
The SWC Annandale gauge (Gauge Number: 566065) is located near Federal Park at the outlet of the catchment. This gauge is a pluviometer (continuously collects rainfall data) and it, along with three other pluviometer gauges in the vicinity, provides a reasonable spatial representation of rainfall within the catchment. The rain gauge locations are indicated in Figure 4. Rainfall events causing flooding in the catchment can be localised and as such will only be accurately “registered” by a proximate gauge. Gauge sites even only a kilometre away in coastal areas such as the Johnstons Creek catchment can show very different intensities and total rainfall depths than those experienced within the catchment itself. Many regions of the catchment are in excess of 2km from the Annandale Gauge. Table 2 is a summary of the rainfall gauges used in this study (refer Figure 4 for locations). Whilst daily rainfall gauges have been included, these records are generally not suitable for calibration/validation of the modelling process as they are only 24 hour totals and thus do not define the short duration intensities that produce flooding in the region.
Table 2: Rainfall Data Sources Station Number Station Name Ownership Type Record Period Available Data
066062 Sydney (Observatory Hill) BoM Pluviometer 1858 – ongoing 03/01/1913 – 31/07/2009
066037 Sydney Airport AMO BoM Pluviometer 1962 - ongoing 06/07/1962 – 30/01/2009
566026 Marrickville SPS SWC Pluviometer 1904 - ongoing 31/12/1979 – 31/03/2011
566041 Crown St Reservoir SWC Daily Read 1882 –1960 -
566065 Annandale SWC Pluviometer 1988 - ongoing 01/01/1989 – 31/03/2011 BoM = Bureau of Meteorology SWC = Sydney Water Corporation

Johnstons Creek Catchment Flood Study
WMAwater 111021:JCFS_Final_Report_Sept15:September 2015 9
Figure 5 displays the rainfall burst intensity and frequency of various historical events at the Annandale gauge. The January 1991 event had rainfall intensities of approximately a 50 year ARI but for a relatively short duration. The February 1993 and April 1998 events exceeded 10 year ARI levels for a 2 hours duration and are more likely to have caused flooding in the main channels than the 1991 event. This same analysis has been performed for the Sydney Observatory Hill gauge (Figure 6). The largest recorded event with an ARI in excess of 100 years is the November 1984 rainfall event. Both the January 1991 and April 1998 events were also significant with rainfall intensities approximating the 20 year ARI event. A summary of peak rainfalls from numerous significant storm events identified from two nearby pluviometer rainfall gauges (Annandale and Marrickville, SWC owned) is presented in Table 3 and Table 4. Not all historical rainfall events have been listed with preference being given to the more recent ones of reasonably large intensity. Events smaller than the 2 year ARI have not been displayed. Note that the available gauge data may not cover the entire period of record and there are non operational periods within the gauge record. Furthermore, only hourly data was available for analysis for the Marrickville gauge and as such calculated rainfall totals may be less than “event” rainfall depths, i.e. those calculated by use of 5 or 6 minute data.
Table 3: Events Identified from Annandale Gauge
Duration Date Time Rainfall (mm/hr) Approximate ARI 1 Hour 26/01/1991 15:00 50 5
17/02/1993 10:00 57.5 10 14/09/1993 1:00 46.5 3 10/04/1998 8:00 47.5 4 12/02/2010 22:00 45 3
2 Hour 26/01/1991 15:00 54 3 17/02/1993 9:00 86 15 14/09/1993 0:00 55 3 10/04/1998 8:00 61.5 4
Table 4: Events Identified from Marrickville Gauge
Duration Date Time Rainfall (mm/hr) Approximate ARI 1 Hour 8/11/1984 9:00 42.5 3
17/02/1993 10:00 44.5 3 14/09/1993 0:00 53.5 6 10/04/1998 8:00 48 4 13/05/2003 10:00 64 15
2 Hour 17/02/1993 9:00 81 15 10/04/1998 7:00 75.5 8 13/05/2003 10:00 66 5
Note: Rainfall values have been calculated from hourly readings and may be less than true rainfall depths.

Johnstons Creek Catchment Flood Study
WMAwater 111021:JCFS_Final_Report_Sept15:September 2015 10
2.6.2. Design Rainfall Data
Design rainfalls were obtained from the Bureau of Meteorology (BoM) and temporal patterns were obtained from Australian Rainfall and Runoff (Reference 7). The Intensity-Frequency-Duration (IFD) data for the catchment is provided in Table 5.
Table 5: IFD Data for Johnstons Creek Catchment
Probable Maximum Precipitation (PMP) rainfall depths used to determine the Probable Maximum Flood (PMF) were obtained from Reference 8 using the generalised short-duration method. The maximum duration for which the method is applicable in the region is 6 hours. The parameters used for estimating the PMP are:
Terrain classification: rough; Adjustment for catchment elevation (EAF): 1; Moisture Adjustment Factor (MAF): 0.7, and; Ellipses enclosing the catchment: A and B (refer to Reference 8 for further explanation of
ellipsoid selection).
Final rainfall depths used in the hydrological model are shown on Table 6.
Table 6: Probable Maximum Precipitation Depths (rounded to the nearest 10 mm)
Storm Duration (hours) Ellipse A (mm) Ellipse B (mm) 1 350 330 2 530 510 3 650 600 4 740 680 5 810 760 6 860 810

Johnstons Creek Catchment Flood Study
WMAwater 111021:JCFS_Final_Report_Sept15:September 2015 11
2.7. Downstream Boundary Water Levels
The downstream boundary of the study area is Rozelle Bay. Rozelle Bay is tidal so natural variability of water level is expected in the downstream areas of Johnstons Creek from both tidal and catchment flows. For design flood estimation a level in Rozelle Bay is required for calculation of water levels and pipe discharges in the lower parts of the catchment. There is no definitive approach for determining the coincidence of flooding in the catchment with a water level in the Bay. Flooding could occur on a low or high tide and be coincident with stormwater runoff from other parts of the catchment or not. An ocean anomaly could also occur (elevation of ocean level above the astronomical tide) as a result of the same meteorologic condition (low pressure system) that produces the intense rainfall. The largest recorded such event in Sydney Harbour was in May 1974 whereby the ocean level reached just over 1.4 metres AHD. However this event was not associated with very intense rainfall intensities. The highest astronomical tide (HAT) in a year is approximately 1 metre AHD. A joint probability analysis is required to fully assess the situation and such a study would be limited by the limited amount of flood event data. Best practice at the time of writing in regard to the setting of downstream boundary conditions is to refer to NSW Government guidelines (Reference 17). The guidelines indicate that the local 1% AEP flood should be run in conjunction with a 5% AEP ocean water level (approximately 1.38 mAHD in Sydney Harbour) and vice versa (i.e. a local 5% AEP rainfall event with an ocean water level of 1% AEP, depending on sensitivity of the study area to elevated ocean levels). The results derived by Cardno for the 2010 Leichhardt Flood Study (Reference 2), however, are based on using the HAT as the downstream boundary. For this study, the former approach was adopted in accordance with the OEH guidelines to establish the water levels along the Johnstons Creek Channel. 2.8. Johnstons Creek Channel Upstream Inflows
As mentioned in Section 1.2, the focus study area for this report represents only a portion of the larger Johnstons Creek catchment. The study area is separated from the rest of the catchment based on the City of Sydney LGA boundary with much of this extent bordering the Johnstons Creek Channel. In order to incorporate this channel into the current model, upstream inflow hydrographs derived for a range of design flood events from the Leichhardt Flood Study (Reference 2) have been utilised as a boundary condition with the application point located just downstream of the Booth St bridge (as indicated in Figure 3).

Johnstons Creek Catchment Flood Study
WMAwater 111021:JCFS_Final_Report_Sept15:September 2015 12
2.9. Community Consultation
A community questionnaire survey was undertaken during June 2011. 6,500 questionnaires were distributed to residents within the Johnstons Creek study area and 59 responses were received. This equates to a return rate of 0.9% and as such the views expressed by this sample may not accurately reflect that of the total population. However it is normal that responses predominately come from residents that have been affected by flooding and 59 responses are in the order of magnitude of those impacted by flooding issues in the catchment. The locations of the community consultation respondents are shown in Figure 7 along with regions identified by respondents as problem flood areas. Unfortunately no flood levels or depths were provided although the reported flood marks were able to be used as a means of model verification (for further details see Section 4.4). Following the community consultation, it was found that there was not one historic event in particular that the residents within the Johnston Creek Catchment identified as being significant. It should be noted however, that over 80% of respondents (out of the 59 who replied) are aware of flooding or have some knowledge of flooding in the study area. Further, almost half of the respondents reported flooding on roads, which serve as formalised overland flow paths in this catchment as the sub-surface drainage system is overwhelmed by the runoff volume associated with more extreme events. The full set of results from the community consultation questionnaire are summarised in Figure 8A to 8C.

Johnstons Creek Catchment Flood Study
WMAwater 111021:JCFS_Final_Report_Sept15:September 2015 13
3. APPROACH
The approach adopted in flood studies to determine design flood levels largely depends upon the objectives of the study and the quantity and quality of the data (survey, flood, rainfall, flow etc.). In the absence of an extensive historical flood record a flood frequency approach cannot be undertaken for the Johnstons Creek catchment and instead must rely on the use of design rainfalls and establishment of a hydrologic/hydraulic modelling system. A diagrammatic representation of the flood study process is shown below.
Diagram 1: Approach Adopted in a Flood Study
CATCHMENT INFORMATIONsub-areasland-use
stream lengthobserved runoff volumes or rates
RAINFALL DATAhistorical or design storm events
rainfall depths (Isohyets)temporal patterns (intensity v
time)
MODEL BOUNDARY CONDITIONSdownstream ocean/tide levelsupstream inflow hydrographsdirect rainfall - lateral inflows
CALIBRATION/VERIFICATIONComputational Modelling Software
HYDROLOGIC ANALYSIS
QUANTIFY CATCHMENT RUNOFFestimated flow hydrographs
HYDRAULIC CHARACTERISTICS
topographic databridge/culvert details
overflow weir structuresdefine flow paths
stream roughness values
OBSERVED FLOOD BEHAVIOURpeak heights
stage or flow hydrographsrelative timing of events
velocity estimatesgeneral observations
COMPUTER MODEL PARAMETERSstorage-routing coefficient
rainfall losses
CALIBRATION/VERIFICATIONComputational Modelling
Software
QUANTIFY FLOOD BEHAVIOURflood levels
flowsvelocities
HYDRAULIC ANALYSIS
REVIEW

Johnstons Creek Catchment Flood Study
WMAwater 111021:JCFS_Final_Report_Sept15:September 2015 14
4. MODEL BUILD
4.1. Overview
The hydrodynamic modelling program TUFLOW (Reference 9) has been used to model both the hydrologic and hydraulic processes in the catchment. TUFLOW is a finite difference grid based 1D/2D hydrodynamic model which uses the St Venant equations in order to route flow according to gravity, momentum and roughness. Furthermore, TUFLOW’s rainfall on grid functions allow seamless merging of the hydrologic and hydraulic models. This negates the need to use an independent hydrologic model to determine inflow hydrographs for subsequent input to the hydraulic model. TUFLOW is ideally suited to this study because it facilitates the identification of the potential overland flow paths and flood problem areas as well as inherently representing the available floodplain storage within the 2D model geometry. In addition to this, TUFLOW allows for the utilisation of breaklines at differing resolution to the main grid. Breaklines are used to ensure the correct representation of features which may affect flooding (features such as roads, embankments, kerbs, etc) which is particularly important in an urban environment. The incorporation of 1D elements into the 2D domain is another beneficial factor of TUFLOW. This allows such elements as open channels represented in 1D to function dynamically within the 2D grid. This suits the study as it facilitates the inclusion of channel flow within the context of a medium resolution 2D approach as well as facilitating the inclusion of the pit and pipe network. 4.2. Hydrology
The hydrologic model boundary covers the entire 224 ha study area shown in Figure 2. As the TUFLOW model is utilising the direct rainfall method, rainfall for particular events was generated from IFD data obtained from the BoM (see Section 2.6.2) and input directly onto the 2D grid. To remove spurious losses associated with a DEM’s tendency to exaggerate surface depressions (potentially causing a significant portion of rainfall to be retained within the catchment), rainfall is applied only to regions which are likely to collect and distribute flow such as kerbs and gutters. To achieve this, the study area has been divided into 835 sub-catchments (See Figure 9) each of which contains a region to which excess rainfall from the entire sub-catchment is applied. In addition to the study area sub-catchments mentioned above, a small region to the north-west of the catchment was modelled in the hydrologic model RAFTS. This region receives flows from the Leichhardt LGA portion of the catchment and has not been modelled in 2D. These RAFTS sub-catchments are displayed in blue in Figure 9 and the generated flows have been applied to the 2D domain at the study area boundary.

Johnstons Creek Catchment Flood Study
WMAwater 111021:JCFS_Final_Report_Sept15:September 2015 15
4.2.1. Rainfall on Grid Considerations
Given that the direct rainfall approach is a relatively new approach in hydrologic modelling studies in Australia, some discussion of the method is presented herein along with consideration of the advantages and disadvantages of the method. Many studies undertaken by specialised consultants for both private and government clients, both in Australia and overseas, have been conducted using a direct rainfall approach. Also, within the literature on hydrological/hydraulic modelling there are examples of research which demonstrate the ability of this approach to emulate more established lumped conceptual hydrological models and more importantly to match the observed data. The main advantages of the approach are that:
flows can be applied to the drainage system avoiding non-conservative over attenuation of flows due to the non-inclusion of sub grid features;
routing is based on relatively high resolution topography and the full St Venant equations and hence parameterisation of storage/routing processes is not necessary;
no double routing of flows occurs such as will likely be a result in a joint modelling system; and
the approach lends itself to the final product which is mapped flood levels to inform planning decisions.
4.2.2. Check Integrity of Rainfall on Grid Methodology
Whilst direct rainfall can be used to great advantage it is a relatively new method and as such it is best to corroborate the flows derived from the method against alternative methods (i.e. calibration/validation and comparison to other methods used to estimate design peak flow). To further test the reliability of the applied rainfall on grid method a number of flow comparisons have been made to peak flows obtained through more conventional methods. Flow results from the Rose Bay hydrologic model (DRAINS) were compared to those used in the current study. The Rose Bay catchment is located only 8 km from the Johnstons Creek catchment and they share many similar characteristics. To remove the effects that differences in catchment delineation can have on peak discharge a number of sub-catchments specific yields were determined. Specific yield is calculated by dividing the peak discharge by the area of the upstream catchment. This removes the obvious effects that differences in sub-catchment size have on peak discharge. Table 7 displays the model comparisons for three random sub-catchments from both models.

Johnstons Creek Catchment Flood Study
WMAwater 111021:JCFS_Final_Report_Sept15:September 2015 16
Table 7: Comparable Catchment Hydrologic Model Check
Sub-catchment
TUFLOW DRAINS % difference Area
(ha) Peak Discharge
(m³/s) Specific yield
(m³/s/ha) Area (ha)
Peak Discharge (m³/s)
Specific yield (m³/s/ha)
1 1.0 0.7 0.7 1.0 0.6 0.7 0 2 0.3 0.2 0.7 0.4 0.2 0.6 10 3 0.9 0.5 0.6 0.6 0.4 0.6 0
Discrepancies between the compared specific yields can be attributed to a number of reasons such as variance in loss parameters and design rainfall values, changes in land use and difference in the applied routing method. It was found that the flows produced by the two models are comparable and thus the rainfall on grid method employed is robust. 4.2.3. Loss Parameters
The Australian Rainfall and Runoff 1987 (Reference 7) suggests a range of initial losses are possible (10 to 30+ mm) and a continuing loss of 2.5 mm/hr for the pervious regions of catchments within NSW and more specifically Sydney. The conservative lower value of 10 mm initial loss has been adopted for this study. Losses from a paved or impervious area are considered to comprise only an initial loss (an amount sufficient to wet the pavement and fill minor surface depressions) and as such an initial loss of 1.5 mm has been applied with no continuing losses. A summary of losses applied to the TUFLOW model is displayed in Table 8.
Table 8: Adopted Design Rainfall Loss Parameters
Parameter Pervious Impervious Initial Loss 10 mm 1.5 mm Continuing Loss 2.5 mm/hr 0 mm/hr
The above losses are the same as adopted in the nearby Leichhardt Flood Study (Reference 2). 4.2.4. Percentage Impervious
The average perviousness of a catchment plays a significant role in determining the structure of the runoff hydrograph. It has implications for the peak flow, the total runoff volume as well as the time of concentration. Urban regions with large areas of impervious surfaces lose less rainfall to losses and flow reaches the downstream end of the catchment quicker due to the generally smoother surfaces associated with urbanisation2 (and less initial loss). Thus it is important to determine the average imperviousness throughout the catchment for any hydrologic model. For each of the sub-catchments mentioned previously an estimate of the percent imperviousness was calculated. Council provided the Local Environmental Plan (LEP) for the 2 Note: The time of concentration of a catchment is also affected by a number of other factors including the catchment slope, shape and size.

Johnstons Creek Catchment Flood Study
WMAwater 111021:JCFS_Final_Report_Sept15:September 2015 17
region which was used to distinguish areas of various zoning types. LEP zone types generally have fairly homogenous land uses and therefore a correlation is assumed between zoning and imperviousness. The mean imperviousness was calculated by detailed inspection of the representative zones. Table 9 indicates the average perviousness and imperviousness for the various land uses in the catchment. Additionally, the spatial distribution of land usages can be seen in Figure 10.
Table 9: Percent Imperviousness for Various Land Uses
Land Use Description % Pervious % Impervious Infrastructure (roads, train tracks etc) 10 90 General Residential 30 70 Mixed Use 0 100 Public Recreation (parks, ovals etc) 100 0 University of Sydney 80 20 Light Industrial 0 100 Harold Park 80 20 Local Centre 0 100 Neighbourhood Centre 30 70
4.3. Hydraulic Modelling
The hydraulic model converts applied flow (discharge generated by a hydrological model) into flood levels and velocities. In the approach used herein, where the hydraulic model also converts rainfall excess into runoff (i.e. the traditional work carried out by hydrological models), the hydraulic model is the only model run. The hydraulic model in this study takes an applied rainfall depth (net of losses) and routes it to create flood extent, level and velocity information. More importantly, TUFLOW model can clearly define spatial variations in flood behaviour across the study area. Information such as flow velocity, flood levels and hydraulic hazard can be readily mapped in detail across the model extent. This information can then be integrated easily into a GIS based environment enabling outcomes to be incorporated efficiently into Council’s planning activities. 4.3.1. Model Build Process
Model construction begins with the DEM (Digital Elevation Model) which defines a catchment’s topographical characteristics at high resolution. Finer features (such as kerbs and gutters) that have significant impacts on flows may then be incorporated via additional spatial layers of information. Also, via the inclusion of dynamically linked 1D elements, drainage pits and pipes are also incorporated. Numerous spatial layers are applied to the model with the aim of closely replicating the catchment’s true topographic conditions. 4.3.2. Model Domain and Grid
A two metre 2D grid was generated from the ALS as mentioned in Section 2.3. A computational time step of 0.25 seconds was adopted for the 2D domain and 0.1 second for the 1D domain.

Johnstons Creek Catchment Flood Study
WMAwater 111021:JCFS_Final_Report_Sept15:September 2015 18
Buildings have been excluded from the model as it is assumed that there is very little flow through the structures and minimal temporary floodplain storage. 4.3.3. Roughness Values
The Manning’s “n” values for each grid cell were estimated based on established references (e.g. Reference 21) and engineering experience. Values were applied to the 2D overland area based on land use as shown in Table 10. For 1D Manning’s roughness values see Section 4.3.4.
Table 10: Adopted Manning’s ‘n’ values
Land Use Manning’s ‘n’ Roads 0.015 Parks 0.06 Parking areas 0.02 Ponds and lakes 0.01 Dense Vegetation 0.08 Residential and mixed use* 0.05
*Buildings were nulled out in the hydraulic model
There is no definitive approach for representing buildings and fences in 2D hydraulic models. The approach to be adopted depends on a number of factors including: the nature of the development, the model extent/grid definition, and the likely impacts of the approach on flood levels and velocities. For this study it is considered that properties adjacent to the overland flow-path boundary would not be part of the effective flow path due to the presence of fences and buildings. This was achieved by nulling grid cells based on digitised building outlines which effectively constricted the available flow path. The “loss” of temporary floodplain storage by nulling the building outlines is a slightly conservative assumption as in reality some floodwaters may enter these buildings under some flooding scenarios. However this approach was adopted as it was considered that the impact of such an assumption would be negligible relative to the overall flood runoff volume. 4.3.4. Pit and Pipe Network
Pit and pipe data (see Section 2.4 for details) provided by Council was used to create a 1D drainage network in TUFLOW. As agreed in the Brief, pipes of diameter smaller than 450 mm were not included in the TUFLOW model as it was assumed that pipes of this size would suffer from blockage during storms due to leaves and debris. This is a “conservative” assumption as some of these smaller pipes may not be blocked. All pipes and culverts were allocated a Manning’s roughness of 0.013 (Reference 21).

Johnstons Creek Catchment Flood Study
WMAwater 111021:JCFS_Final_Report_Sept15:September 2015 19
4.3.5. Trunk Drainage Blockage
The effect of blockage in urban drainage systems (pipes and open channels) has become a significant factor in design flood estimation following the post flood observations from the North Wollongong August 1998 and Newcastle June 2007 events. However, recent reviews of how blockage should be included in design flood analysis are inconclusive, as it appears that the incidence of blockage is not consistent across all catchments or even within the same catchment. Thus there is no consensus regarding the design approach that should be adopted. In this study the approach adopted for all pipes and culverts of diameter larger than 450 mm (or area proportional to a 450 mm pipe) has been to assume 25% blockage. This approach has been adopted to take into account blockage caused by larger debris (such as cars, fencing, vegetation etc.) being swept into drainage structures. All blockages have been assumed to occur at the culvert/pipe level with all pit inlets at 100% capacity. Sensitivity to the selected pipe blockage values has been considered in Section 6.7. 4.3.6. Boundary Conditions
As the direct rainfall method has been applied to the model there is no need for upstream flow boundaries. The other main boundary conditions are located at:
Rozelle Bay (For further details refer to Section 2.7); and Johnstons Creek Channel (For further details refer to Section 2.8).
The first has been applied to the model as a static water level boundary while the second has been applied in the form of a flow hydrograph. 4.4. Model Calibration/Validation Events
Generally calibration/validation is a process whereby historical events are used to test a model’s ability to accurately replicate observed behaviour (i.e. match historical flood levels). This process requires rainfall data (pluviometer and daily read) and observations such as:
streamflow velocities; gauged water levels; peak flood level at specific locations; and peak flood level extent at a specific location at a specific time.
No stream gauges exist within the catchment and as such no gauged water levels or flows are available for historical events. A review of historical records was carried out to identify dates of historical events in the hope of obtaining other calibration/verification data. More recent events (since 1980) were the main focus of this review as rainfall data collected prior to this date would generally be of insufficient resolution to be used in model calibration. Unfortunately no suitable data for calibration/verification was found during this review process. With the lack of calibration data, the community consultation results have proved to be the next

Johnstons Creek Catchment Flood Study
WMAwater 111021:JCFS_Final_Report_Sept15:September 2015 20
best possibility for model verification. The community consultation asked participants to identify regions within the catchment that are prone to flooding. No specific levels or depths were provided but numerous locations throughout the catchment were mentioned. The identified flood prone areas were compared to the flood extent of the 5 year ARI design event to determine whether the model was producing reasonable results. The 5 year ARI event was selected because a significant number of people living within the study area would have experienced a storm of this magnitude due to the frequency at which they occur. For verification results see Section 6.2. In addition to the verification process mentioned previously it must be noted that the Blackwattle Bay Flood Study, undertaken simultaneously with this study, has produced a fully calibrated and verified model. The model was successfully calibrated to the 26th January 1991 flood event (maximum ARI of approximately 50 years) and validated by the 17th February 1993 flood event (approximately 20 – 50 year ARI), albeit to approximately six points in both cases. The Blackwattle Bay catchment is a neighbouring catchment which shares many geographic, climatologic and hydrological properties. All parameters such as losses, percent imperviousness and Manning’s roughness are the same for the two models so it stands that the Johnstons Creek catchment has been calibrated indirectly via use of the parameters from the Blackwattle Bay Study.

Johnstons Creek Catchment Flood Study
WMAwater 111021:JCFS_Final_Report_Sept15:September 2015 21
5. CLIMATE CHANGE
The 2005 Floodplain Development Manual (Reference 10) requires that Flood Studies and Floodplain Risk Management Studies consider the impacts of climate change on flood behaviour. The current best practice for considering the impacts of climate change (sea level rise and rainfall increase) has been evolving rapidly. Key developments in the last four years have included: release of the Fourth Assessment Report by the Inter-governmental Panel on Climate
Change (IPCC) in February 2007 (Reference 11), which updated the Third IPCC Assessment Report of 2001 (Reference 12);
preparation of Climate Change Adaptation Actions for Local Government by SMEC Australia for the Australian Greenhouse Office in mid 2007 (Reference 13);
preparation of Climate Change in Australia by CSIRO in late 2007 (Reference 14), which provides an Australian focus on Reference 13;
release of the Floodplain Risk Management Guideline Practical Consideration of Climate Change by the NSW Department of Environment and Climate Change in October 2007 (Reference 15 - referred to as the DECC Guideline 2007).
In August 2010, the former NSW Department of Environment, Climate Change and Water (DECCW) issued the Flood Risk Management Guide (Reference 17) which required incorporation of sea level rise benchmarks in flood risk assessments. In October 2012 the NSW Government repealed mandatory compliance with its 2009 Sea Level Rise Policy (Reference 16) which states that: “Over the period 1870-2001, global sea levels rose by 20 cm, with a current global average rate of increase approximately twice the historical average. Sea levels are expected to continue rising throughout the twenty-first century and there is no scientific evidence to suggest that sea levels will stop rising beyond 2100 or that the current trends will be reversed. Sea level rise is an incremental process and will have medium to long-term impacts. The best national and international projections of sea level rise along the NSW coast are for a rise relative to 1990 mean sea levels of 40 cm by 2050 and 90 cm by 2100. However, the 4th Intergovernmental Panel on Climate Change in 2007 also acknowledged that higher rates of sea level rise are possible”; Hence, Councils must now make their own decisions regarding the assessment of sea level rise. City of Sydney has made no formal statement that it is adopting a sea level rise assessment different to the Policy Statement (Reference 16) previously issued by the NSW Government. As a result of the information provided in the documents mentioned previously, and to keep up-

Johnstons Creek Catchment Flood Study
WMAwater 111021:JCFS_Final_Report_Sept15:September 2015 22
to-date with current best practice, this study incorporates an assessment of climate change. Although there are some minor variations in the sea levels predicted in these studies, policies, and guides, they all agree on an ocean level rise on the NSW coast of around 0.9 metre by the year 2100 relative to 1990 levels. The most recent guideline (Reference 17) indicates a 0.9 metre sea level rise by the year 2100 and a 0.4 metre rise by the year 2050. These changes in sea level have been modelled as part of the sensitivity analysis for this study. It should be noted that climate change and the associated rise in sea levels will continue beyond 2100. The climate change scenarios in the earlier DECC Guideline 2007 (Reference 15) suggested for undertaking rainfall sensitivity analysis in flood studies are indicated below. Increase in peak rainfall and storm volume:
low level rainfall increase = 10%, medium level rainfall increase = 20%, high level rainfall increase = 30%.
A high level rainfall increase of up to 30% is recommended for consideration due to the uncertainties associated with this aspect of climate change and to apply the “precautionary principle”. A 30% rainfall increase is probably overly conservative. However, as part of the rainfall sensitivity analysis used in this study all changes to rainfall intensities mentioned above have been modelled. The DECC Guideline 2007 (Reference 15) is currently the only NSW reference providing guidelines for rainfall increases for design flood analysis due to climate change. Results for the climate change analysis are contained in Section 6.8.

Johnstons Creek Catchment Flood Study
WMAwater 111021:JCFS_Final_Report_Sept15:September 2015 23
6. HYDRAULIC MODELLING
6.1. Approach
Limited verification was undertaken initially to ensure that the model could replicate approximate flood extents and the model was subsequently used to determine design flood flows, levels, velocities and extents. Sensitivity analysis was then undertaken to assess the effect of changing various model parameters. 6.2. Verification Results
Figure 11 displays the reported flood affected regions within the study area along with the 5 year ARI flood depths and extent. It can be seen that the majority of reported flood locations lie within the modelled flood extent. A few exceptions occur with flooding at these locations predominately due to local drainage issues such as drain blockages. The verification results show reasonable correlation for the majority of recorded flood marks. Given verification results and in light of the similarity of the approach utilised herein relative to the adjacent Blackwattle Bay study (see Section 4.4 for further details), a high degree of confidence can be had in the models definition of design flood behaviour. 6.3. Critical Duration
Critical storm duration analysis is undertaken to determine the storm duration that produces the greatest flood levels for the given design event. A range of storm durations were modelled for the 1% AEP event and it was found that the critical duration varied (ranging from 15 to 720 minutes) spatially (see Figure 12). For all design events the 2 hour duration was used to determine peak flood levels as this was the dominant duration. Flood levels produced by the 2 hour duration event were not exceeded by more that 0.1 m in any region of the study area (with the exception of Sydney University Oval number one) when compared to flood levels produced by the other tested durations. A similar process was undertaken for the PMF event with various PMP durations (1 to 6 hours) modelled so that peak flood levels and associated rainfall durations could be identified. The 3 hour duration PMP was determined to be the critical duration in the majority of regions in the catchment and was thus used to determine peak flood levels.

Johnstons Creek Catchment Flood Study
WMAwater 111021:JCFS_Final_Report_Sept15:September 2015 24
6.4. Overview of Results
A number of maps have been produced to display the flood affected regions for the various design events. It should be noted that inundation patterns and/or peak flood levels shown for design events are based on best available estimates of flood behaviour within the catchment. Inundation from local overland flow may vary depending on the actual rainfall event and local influences (parked cars, change in topography, road works etc.). Tabulated results (Table 11 - Table 15) are also provided in the following sections for ease of comparison between flood events. Further, peak flood levels have been recorded at regions of interest throughout the catchment and the locations of these readings are displayed in Figure 13. A summary of the results is provided as follows:
Peak flood depths for all design flood events, Figure 14 - Figure 19; Peak flood levels for the 1% AEP and PMF flood events, Figure 20 - Figure 21; Peak flood velocity for the 1% AEP and PMF flood events, Figure 22 - Figure 23; Flood profiles for the Johnstons Creek channel for all design flood events and the climate
change scenarios, Figure 24 - Figure 25. The locations of the bridges along the channel are shown on Figure 44;
Provisional flood hazard categorisation for all design flood events, Figure 26 - Figure 31; Preliminary flood hydraulic categorisation for all design flood events, Figure 32 - Figure
37; Climate change scenarios (rainfall increases and sea level rise), Figure 38 - Figure 42;
and Properties inundated above floor levels for all design flood events, Figure 43.
6.5. Results at Key Locations
The results for peak flood depths and velocities at key locations are shown in Table 11 while the peak flood levels are provided in Table 12 (refer to Figure 13 for locations). The performance of the stormwater drainage system within the study area is governed by the complex interaction between:
Conveyance within the formal drainage system (pipes and box culverts), and Ponding and overland flow along streets and through private land.
A large range of depths (see Figure 14 - Figure 19) and velocities (see Figure 22 - Figure 23) can be observed throughout the catchment for the design flood events. One feature of flooding within the study area is that the sub-surface drainage system generally flows at capacity (refer to Table 13) even for smaller events (i.e. 5 year ARI) and the majority of the flows traverse through the catchment via overland flow paths. A region near the lower end of Larkin Street (point 9) experiences the greatest flood depths with approximately 1.5 metres during the 5 year ARI event up to 3.1 metres in the 1% AEP event and 7.7 metres in the PMF. On the other hand, flow velocities are predominantly low throughout the catchment. Exceptions to this occur along Carillon Ave (point 1), Arundel Street (point 7), Glebe Point Road (point 23) and Eglinton Road (point 24) where velocities of over 2 m/s can occur during the 1% AEP event. A closer

Johnstons Creek Catchment Flood Study
WMAwater 111021:JCFS_Final_Report_Sept15:September 2015 25
inspection of these locations found that the local topography is characterised by steep gradients (typically >8%).
Table 11: Peak Flood Depths (m) and Velocities (m/s) at Key Locations (refer to Figure 13)
ID Location 5 year ARI 10% AEP 5% AEP 2% AEP 1% AEP PMF D V D V D V D V D V D V
1 Carillon Ave 0.1 2.3 0.2 2.4 0.2 2.7 0.2 2.8 0.2 2.9 0.4 7.2
2 Fisher Road Oval 0.2 0.1 0.2 0.0 0.3 0.0 0.3 0.1 0.3 0.1 0.5 0.2
3 Sydney Uni Oval 0.4 0.0 0.5 0.1 0.7 0.1 1.0 0.1 1.3 0.1 3.4 0.1
4 Parramatta Rd (St Johns Oval) 0.8 0.1 0.8 0.1 0.9 0.2 1.0 0.2 1.0 0.2 2.3 0.8
5 Missenden Rd & Parramatta Rd 0.0 0.0 0.0 0.0 0.0 0.0 0.0 0.0 0.0 0.0 0.1 2.0
6 Mallett St & Parramatta Rd 0.1 1.2 0.1 1.3 0.1 1.4 0.1 1.5 0.2 1.6 0.2 1.9
7 Arundel St 0.1 2.5 0.1 2.8 0.2 3.9 0.2 4.0 0.3 4.3 3.4 5.0
8 Sparkes St 0.7 0.4 0.7 0.5 0.7 0.6 1.0 0.7 1.3 0.9 6.0 1.0
9 Larkin St 1.5 0.2 1.9 0.3 2.3 0.2 2.7 0.2 3.1 0.2 7.7 0.9
10 Pyrmont Bridge Rd 0.1 0.7 0.1 0.7 0.1 0.7 0.2 0.8 0.2 0.8 1.3 2.7
11 Orphans Creek DS 0.3 0.6 0.4 0.7 0.5 0.8 0.6 0.7 0.7 0.7 2.1 2.3
12 St Johns Rd 0.6 0.7 0.6 0.7 0.6 0.7 0.7 0.6 0.7 0.6 0.9 0.8
13 Bridge Rd (Abbey) 0.5 0.4 0.5 0.4 0.6 0.5 0.6 0.5 0.6 0.6 0.8 0.8
14 Hereford St 0.5 0.5 0.6 0.6 0.6 0.7 0.7 0.8 0.7 0.8 1.0 1.1
15 Glebe Gardens 0.2 0.1 0.3 0.1 0.4 0.1 0.4 0.1 0.5 0.1 0.7 0.1
16 Wigram Rd 0.1 0.5 0.1 0.5 0.1 0.6 0.1 0.6 0.1 1.3 0.4 5.8
17 Harold Park US 0.1 0.6 0.1 0.6 0.3 0.7 0.5 0.7 0.7 0.7 2.2 0.8
18 Minogue Cres 0.0 0.0 0.0 0.0 0.0 0.0 0.0 0.0 0.0 0.0 0.0 0.0
19 Coneill Pl 0.1 0.2 0.1 0.2 0.1 0.3 0.2 0.3 0.2 0.3 1.2 0.3
20 Chapman Rd 0.3 0.4 0.4 0.6 0.5 0.8 0.6 0.9 0.6 0.9 1.2 1.5
21 Federal Park 0.6 0.2 0.7 0.2 0.8 0.2 0.8 0.2 0.9 0.2 1.3 0.5
22 Jubilee Oval 0.3 0.0 0.4 0.0 0.6 0.0 0.7 0.1 0.7 0.1 1.2 0.2
23 Glebe Point Rd 0.2 2.1 0.2 2.2 0.1 2.0 0.1 2.0 0.1 2.0 0.3 2.6
24 Eglinton Rd 0.1 0.4 0.1 0.4 0.1 0.4 0.1 0.4 0.1 2.7 0.3 4.1 Note: “D” and “V” in the second row represent the Peak Flood Depth (measured in m) and Velocity (measured in m/s) respectively.

Johnstons Creek Catchment Flood Study
WMAwater 111021:JCFS_Final_Report_Sept15:September 2015 26
Table 12: Peak Flood Levels (mAHD) at Key Locations (refer to Figure 13)
ID Location 5 year ARI 10% AEP 5% AEP 2% AEP 1% AEP PMF
1 Carillon Ave 32.2 32.2 32.2 32.2 32.2 32.5
2 Fisher Road Oval 35.9 35.9 35.9 35.9 35.9 36.2
3 Sydney Uni Oval 20.7 20.9 21.1 21.4 21.6 23.8
4 Parramatta Rd (St Johns Oval) 20.1 20.1 20.2 20.3 20.3 21.6
5 Missenden Rd & Parramatta Rd 23.8 23.8 23.8 23.8 23.8 23.9
6 Mallett St & Parramatta Rd 18.3 18.4 18.4 18.4 18.4 18.5
7 Arundel St 15.2 15.2 15.3 15.3 15.4 18.5
8 Sparkes St 13.2 13.2 13.3 13.5 13.9 18.5
9 Larkin St 12.3 12.6 13.1 13.5 13.8 18.5
10 Pyrmont Bridge Rd 15.4 15.4 15.4 15.4 15.4 16.6
11 Orphans Creek DS 3.5 3.6 3.7 3.8 3.9 5.3
12 St Johns Rd 25.4 25.4 25.5 25.5 25.5 25.7
13 Bridge Rd (Abbey) 21.1 21.1 21.2 21.2 21.2 21.4
14 Hereford St 13.0 13.1 13.1 13.2 13.2 13.5
15 Glebe Gardens 12.9 13.0 13.1 13.1 13.2 13.4
16 Wigram Rd 14.0 14.0 14.1 14.0 14.1 14.3
17 Harold Park US 6.6 6.7 6.8 7.1 7.3 8.8
18 Minogue Cres 11.4 11.4 11.4 11.4 11.4 11.4
19 Coneill Pl 3.2 3.2 3.3 3.3 3.3 4.4
20 Chapman Rd 2.2 2.3 2.4 2.4 2.5 3.0
21 Federal Park 2.1 2.2 2.3 2.4 2.4 2.9
22 Jubilee Oval 2.1 2.2 2.3 2.4 2.4 2.9
23 Glebe Point Rd 17.0 17.1 17.0 17.0 17.0 17.1
24 Eglinton Rd 5.4 5.4 5.4 5.4 5.4 5.6
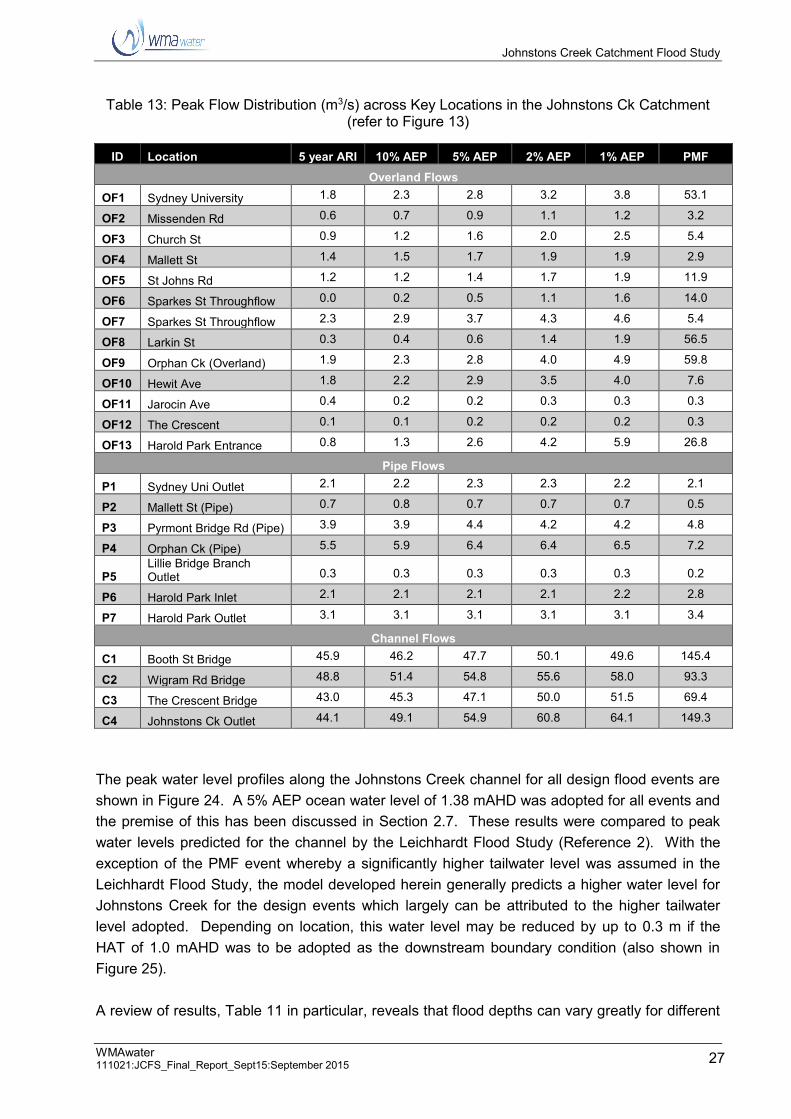
Johnstons Creek Catchment Flood Study
WMAwater 111021:JCFS_Final_Report_Sept15:September 2015 27
Table 13: Peak Flow Distribution (m3/s) across Key Locations in the Johnstons Ck Catchment
(refer to Figure 13)
ID Location 5 year ARI 10% AEP 5% AEP 2% AEP 1% AEP PMF Overland Flows
OF1 Sydney University 1.8 2.3 2.8 3.2 3.8 53.1
OF2 Missenden Rd 0.6 0.7 0.9 1.1 1.2 3.2
OF3 Church St 0.9 1.2 1.6 2.0 2.5 5.4
OF4 Mallett St 1.4 1.5 1.7 1.9 1.9 2.9
OF5 St Johns Rd 1.2 1.2 1.4 1.7 1.9 11.9
OF6 Sparkes St Throughflow 0.0 0.2 0.5 1.1 1.6 14.0
OF7 Sparkes St Throughflow 2.3 2.9 3.7 4.3 4.6 5.4
OF8 Larkin St 0.3 0.4 0.6 1.4 1.9 56.5
OF9 Orphan Ck (Overland) 1.9 2.3 2.8 4.0 4.9 59.8
OF10 Hewit Ave 1.8 2.2 2.9 3.5 4.0 7.6
OF11 Jarocin Ave 0.4 0.2 0.2 0.3 0.3 0.3
OF12 The Crescent 0.1 0.1 0.2 0.2 0.2 0.3
OF13 Harold Park Entrance 0.8 1.3 2.6 4.2 5.9 26.8
Pipe Flows P1 Sydney Uni Outlet 2.1 2.2 2.3 2.3 2.2 2.1
P2 Mallett St (Pipe) 0.7 0.8 0.7 0.7 0.7 0.5
P3 Pyrmont Bridge Rd (Pipe) 3.9 3.9 4.4 4.2 4.2 4.8
P4 Orphan Ck (Pipe) 5.5 5.9 6.4 6.4 6.5 7.2
P5 Lillie Bridge Branch Outlet 0.3 0.3 0.3 0.3 0.3 0.2
P6 Harold Park Inlet 2.1 2.1 2.1 2.1 2.2 2.8
P7 Harold Park Outlet 3.1 3.1 3.1 3.1 3.1 3.4
Channel Flows C1 Booth St Bridge 45.9 46.2 47.7 50.1 49.6 145.4
C2 Wigram Rd Bridge 48.8 51.4 54.8 55.6 58.0 93.3
C3 The Crescent Bridge 43.0 45.3 47.1 50.0 51.5 69.4
C4 Johnstons Ck Outlet 44.1 49.1 54.9 60.8 64.1 149.3
The peak water level profiles along the Johnstons Creek channel for all design flood events are shown in Figure 24. A 5% AEP ocean water level of 1.38 mAHD was adopted for all events and the premise of this has been discussed in Section 2.7. These results were compared to peak water levels predicted for the channel by the Leichhardt Flood Study (Reference 2). With the exception of the PMF event whereby a significantly higher tailwater level was assumed in the Leichhardt Flood Study, the model developed herein generally predicts a higher water level for Johnstons Creek for the design events which largely can be attributed to the higher tailwater level adopted. Depending on location, this water level may be reduced by up to 0.3 m if the HAT of 1.0 mAHD was to be adopted as the downstream boundary condition (also shown in Figure 25). A review of results, Table 11 in particular, reveals that flood depths can vary greatly for different

Johnstons Creek Catchment Flood Study
WMAwater 111021:JCFS_Final_Report_Sept15:September 2015 28
design events and locations throughout the catchment. To determine the flood liability of individual properties floor level survey has been undertaken by Council so that modelled design flood levels can be compared to property floor levels. The survey was performed on more than 140 properties throughout the catchment. The selected property locations and details on the selection criteria are provided in Appendix B. A flood damages assessment was carried out and the results are presented in Section 6.9. For properties situated nearby or adjacent to the Johnstons Creek channel (i.e. properties along Minogue Cres, Coneill Pl, and The Crescent), a comparison of their floor levels with the flood levels predicted for the channel was made and shown in Figure 24 and Figure 25 if climate change impacts were taken into account. Referring to Table 14, it was found that 94 properties are liable to over floor inundation in the 1% AEP event. In smaller events such as the 5 year ARI event this figure drops to 38 properties although this estimate is conservative given the prudent blockage assumption. This number is approximately half of the total number of properties that are flood affected, which includes those properties that are inundated in the yard but not above the building floor level. The proportion of residential properties which are flood affected is significantly higher than the commercial/industrial lots. Whilst overall flood liability numbers are not high (compared against a total number of homes of circa 6,500 inclusive of apartments), those that are flood liable are persistently so. The properties that are over floor flood liable tend to be impacted by overland rather than mainstream flows and be located in unrelieved sags. As a result many tend to be flooded in smaller events (i.e. 5 year ARI event), as well as the larger events (i.e. 1% AEP event).
Table 14: Over-floor Flood Liability for Johnstons Creek Catchment
Properties Flood Affected No. of Properties Flooded Above Floor Level
Event Residential Commercial/Industrial Total Residential Commercial/Industrial Total
5Y ARI 97 14 111 32 6 38 10% AEP 114 13 127 54 7 61 5% AEP 124 14 138 66 9 75 2% AEP 134 14 148 73 9 82 1% AEP 145 14 159 84 10 94
PMF 166 14 180 125 14 139 The locations of these flood liable properties are mapped in Figure 43. It can be observed that they are quite distributed across the catchment and primarily located along the major overland flow paths. Due to the combination of high flood depths and velocities, many regions of the catchment are affected by high hazard flows. Figure 26 to Figure 31 show the flow hazard classification throughout the catchment for various design flood events. It can be seen that during the 1% AEP flood event many roads form significant flow paths with high hazard flows, with the situation worsening for the PMF.

Johnstons Creek Catchment Flood Study
WMAwater 111021:JCFS_Final_Report_Sept15:September 2015 29
Although the NSW Floodplain Development Manual (Reference 10) provides guidelines on determining hydraulic categories it does not explicitly define each category. Consultants and authorities use different approaches for this. For the purpose of this study the preliminary hydraulic categories have been adopted based on previous experience and review of literature (e.g. Reference 18):
Floodway = Velocity * Depth > 0.25 m²/s AND Velocity > 0.25m/s OR Velocity > 1m/s Flood Storage = Depth > 0.2m (provided that NOT categorised as Floodway) Flood Fringe = Depth < 0.2m (provided that NOT categorised as Floodway or Storage)
Figure 32 to Figure 37 display the preliminary hydraulic categorisation for the various design flood events. All design flood results presented reflect conditions prior to the Harold Park redevelopment. Though it is expected that the proposed redevelopment will not result in detrimental impacts on upstream or downstream flood levels due to the development control imposed, variation to the drainage flow paths is expected to occur particularly for the proposed site as the local drainage structures will be upgraded. Therefore, the inundation patterns as shown in the figures may vary once the redevelopment is in place. 6.5.1. Major Access Road Flooding
Parramatta Road is one of the main road linkages from the city to the Western Suburbs. At the intersection of Parramatta Road and Larkin Street events with rainfall intensities as low as 5 year ARI intensities can potentially cause significant inundation. Excessive flooding of this road could potentially inhibit traffic and result in significant impacts on traffic flows throughout the region. During a significant flood event it is likely that emergency service vehicles would be required in the affected area, though access may be severely hindered by the possibility of major road closures. A summary of flood depths on Parramatta Road (near Larkin Street) is provided in Table 15.
Table 15: Parramatta Road Peak Flood Depths (m) for Various Events
ID Road Location 5 year ARI 10% AEP 5% AEP 2% AEP 1% AEP PMF 4 Parramatta Rd (St Johns Oval) 0.8 0.8 0.9 1.0 1.0 2.3
6.6. Flood Hazard Classification
The 2005 NSW Government’s Floodplain Development Manual (Reference 10) determines the provisional flood hazard categorisation of an area based on the combination of the depth and velocity of floodwaters on the land. The classification is a qualitative assessment based on a number of factors as listed in Table 16 which will be assessed in the Floodplain Risk Management Study and Plan.

Johnstons Creek Catchment Flood Study
WMAwater 111021:JCFS_Final_Report_Sept15:September 2015 30
Table 16: Hazard Classification
Criteria Weight Comment Size of the Flood TBA To be assessed in the Flood Risk Management Study
and Plan Flood Awareness of the Community TBA To be assessed in the Flood Risk Management Study
and Plan Depth and Velocity of Floodwaters TBA To be assessed in the Flood Risk Management Study
and Plan Effective Warning and Evacuation Times
TBA To be assessed in the Flood Risk Management Study and Plan
Evacuation Difficulties TBA To be assessed in the Flood Risk Management Study and Plan
Rate of Rise of Floodwaters TBA To be assessed in the Flood Risk Management Study and Plan
Duration of Flooding TBA To be assessed in the Flood Risk Management Study and Plan
Effective Flood Access TBA To be assessed in the Flood Risk Management Study and Plan
Additional Concerns such as Bank Erosion, Debris, Wind Wave Action, Sewage overflows
TBA To be assessed in the Flood Risk Management Study and Plan
Provision of Services TBA To be assessed in the Flood Risk Management Study and Plan
6.7. Sensitivity Analysis
Sensitivity analysis was carried out in order to assess the effect that adjusting model parameters had on model results. A comparison was carried out using peak flood levels and flows for the 1% AEP design event. The following scenarios were modelled:
An increase in rainfall losses of 10% (both initial and continuing losses); A decrease in rainfall losses of 10% (both initial and continuing losses); An increase in bed resistance (Manning’s ‘n’) of 20%; A decrease in bed resistance (Manning’s ‘n’) of 20%; Pipe/culvert blockage at 0%; and Pipe/culvert blockage at 50%.
A summary of the results obtained are shown in Table 17 and Table 18. The tables show the differences between the results for each tested run and the 1% AEP design flood event (base case).

Johnstons Creek Catchment Flood Study
WMAwater 111021:JCFS_Final_Report_Sept15:September 2015 31
Table 17: Sensitivity Analysis of Flows
ID Location
Base Case (m3/s)
Impact (%) Losses +10%
Losses -10%
Manning’s ‘n’ +20%
Manning’s ‘n’ -20%
Blockage 50%
Blockage 0%
Overland Flow OF1 Sydney University 3.8 -0.3% 1.7% -3.8% 8.1% -1.0% -0.8%
OF9 Orphan Ck (Overland) 4.9 -1.3% -0.9% -5.1% 2.0% 7.6% -8.8%
OF13 Harold Park Entrance 5.9 -1.7% 0.3% -4.3% 8.9% 16.2% -11.2%
Pipe Flow P1 Sydney Uni Outlet 2.2 0.0% 0.0% 0.3% -0.5% -43.4% 43.2%
P4 Orphan Ck (Pipe) 6.5 -0.4% -0.1% -0.4% -1.2% -28.8% 22.8%
P6 Harold Park Inlet 2.2 0.7% 0.0% -2.6% 5.7% -32.7% 21.2%
Channel Flow C4 Johnstons Ck Outlet 64.1 -0.5% -0.1% -1.8% -1.4% -2.2% 1.4%
Table 18: Sensitivity Analysis of Flood Levels
ID Location
Base Case
(mAHD)
Impact (m) Losses +10%
Losses -10%
Manning’s ‘n’ +20%
Manning’s ‘n’ -20%
Blockage 50%
Blockage 0%
1 Carillon Ave 32.2 0.0 0.0 -0.1 0.0 0.0 0.0
2 Fisher Road Oval 35.9 0.0 0.0 0.0 0.0 0.0 0.0
3 Sydney Uni Oval 21.6 0.0 0.0 0.0 0.0 0.3 -0.2
4 Parramatta Rd (St Johns Oval) 20.3 0.0 0.0 0.0 0.0 0.0 0.0
5 Missenden Rd & Parramatta Rd 23.8 0.0 0.0 0.0 0.1 0.0 0.0
6 Mallett St & Parramatta Rd 18.4 0.0 0.0 0.0 0.0 0.0 0.0
7 Arundel St 15.4 0.0 0.0 0.0 0.0 0.0 0.0
8 Sparkes St 13.9 0.0 0.0 0.0 0.0 0.2 -0.2
9 Larkin St 13.8 0.0 0.0 0.0 0.0 0.2 -0.2
10 Pyrmont Bridge Rd 15.4 0.0 0.0 0.0 0.0 0.0 0.0
11 Orphans Creek DS 3.9 0.0 0.0 0.0 0.0 0.0 0.0
12 St Johns Rd 25.5 0.0 0.0 0.0 0.0 0.0 0.0
13 Bridge Rd (Abbey) 21.2 0.0 0.0 0.0 0.0 0.0 0.0
14 Hereford St 13.2 0.0 0.0 0.0 0.0 0.0 0.0
15 Glebe Gardens 13.2 0.0 0.0 0.0 0.0 0.0 0.0
16 Wigram Rd 14.1 -0.1 -0.1 -0.1 0.1 0.1 0.0
17 Harold Park US 7.3 0.0 0.0 0.0 0.0 0.4 -0.3
18 Minogue Cres 11.4 0.0 0.0 0.0 0.0 0.0 0.0
19 Coneill Pl 3.3 0.0 0.0 0.0 0.0 0.0 0.0
20 Chapman Rd 2.5 0.0 0.0 0.0 0.1 0.0 0.0
21 Federal Park 2.4 0.0 0.0 0.0 0.0 0.0 0.0
22 Jubilee Oval 2.4 0.0 0.0 0.0 0.0 0.0 0.0
23 Glebe Point Rd 17.0 0.0 0.0 0.0 0.1 0.0 0.0
24 Eglinton Rd 5.4 0.1 0.0 0.0 0.1 0.0 0.1
Mean: 0.0 0.0 0.0 0.0 0.1 0.0

Johnstons Creek Catchment Flood Study
WMAwater 111021:JCFS_Final_Report_Sept15:September 2015 32
Overall, results were shown to be insensitive to the tested variables with an average impact of 0.1 m or less variation to peak flood levels at the tested locations. This can generally be accommodated within the 0.5 m freeboard (if adopted) applied to the 1% AEP results to determine the Flood Planning Levels (FPLs). In general flood levels and flows were most sensitive to adjusting the pipe/culvert blockage factor. An increase in pipe blockage from 25% (as per the base case) to 50% blockage caused an increase in overland flow of up to 16% at Harold Park (indicated as OF13 in Figure 13, with decrease flow in the pipes). This region was particularly sensitive with a car park at the southern end of Harold Park experiencing a 0.4 metre increase in the 1% AEP event flood level. This was the only tested region (the other being the Sydney Uni Oval which acts as a flood storage area during storm events) that experienced more than 0.2 metre increase. The sensitivity testing thus provides confidence that as long as the model emulates ground conditions and hydraulic structures, within a range of typical values for parameters, the model will produce accurate and reliable design flood levels. 6.8. Climate Change Results
As part of the study the following climate change scenarios have been analysed for the 1% AEP event in accordance with the DECC Guideline 2007 (Reference 15):
10% increase in design rainfall intensity, 20% increase in design rainfall intensity, 30% increase in design rainfall intensity, 0.4 m rise in tailwater level in Rozelle Bay, and 0.9 m rise in tailwater level in Rozelle Bay.
6.8.1. Rainfall Increase
The results for the rainfall increase scenarios are tabulated in Table 19. Overall, an increase in the 1% AEP design rainfalls result in generally an increase in flood levels across the study catchment. A 10% increase in design rainfall intensity results in approximately 0.3 m maximum increase in peak flood levels, a 20% rainfall increase results in approximately 0.6 m maximum increase in peak flood levels and a 30% rainfall increase results in approximately 0.8m maximum increase in peak flood levels (generally around the Sparkes St/Larkin St area, which can also be seen in Figure 38 to Figure 40). Imposing a freeboard for all new housing floor levels will account for this variation easily.

Johnstons Creek Catchment Flood Study
WMAwater 111021:JCFS_Final_Report_Sept15:September 2015 33
Table 19: Results for Rainfall Increase Scenarios
ID Location Base Case
(mAHD)
Impact (m) 10%
Increase in Rainfall
20% Increase
in Rainfall
30% Increase
in Rainfall
1 Carillon Ave 32.25 0.01 0.02 0.04
2 Fisher Road Oval 35.94 0.01 0.02 0.03
3 Sydney Uni Oval 21.62 0.22 0.42 0.60
4 Parramatta Rd (St Johns Oval) 20.31 0.05 0.09 0.14
5 Missenden Rd & Parramatta Rd 23.84 0.01 0.03 0.04
6 Mallett St & Parramatta Rd 18.40 0.01 0.03 0.04
7 Arundel St 15.37 0.03 0.06 0.04
8 Sparkes St 13.86 0.30 0.57 0.82
9 Larkin St 13.85 0.30 0.57 0.82
10 Pyrmont Bridge Rd 15.44 0.01 0.02 0.03
11 Orphans Creek DS 3.88 0.04 0.08 0.12
12 St Johns Rd 25.54 0.03 0.06 0.09
13 Bridge Rd (Abbey) 21.23 0.03 0.06 0.08
14 Hereford St 13.25 0.05 0.09 0.13
15 Glebe Gardens 13.16 0.04 0.07 0.10
16 Wigram Rd 14.06 0.05 0.12 0.32
17 Harold Park US 7.25 0.17 0.33 0.47
18 Minogue Cres 11.41 0.00 0.00 0.00
19 Coneill Pl 3.28 0.01 0.01 0.02
20 Chapman Rd 2.47 0.03 0.09 0.10
21 Federal Park 2.41 0.04 0.08 0.10
22 Jubilee Oval 2.44 0.04 0.09 0.10
23 Glebe Point Rd 17.01 0.02 0.05 0.12
24 Eglinton Rd 5.45 0.01 0.03 0.04
Mean: +0.06 +0.12 +0.18
6.8.2. Sea Level Rise
The results for the sea level rise scenarios are tabulated in Table 20. The impacts of increasing downstream water levels are largely confined to the immediate surrounds of Johnstons Creek as well as low lying areas adjacent to Rozelle Bay, as illustrated in Figure 41 and Figure 42. For the 2100 Sea Level Rise Scenario, significant impacts (>0.1 m) were seen to propagate approximately 1 km upstream of the Bay, thus also affecting properties located just upstream of The Crescent Bridge.

Johnstons Creek Catchment Flood Study
WMAwater 111021:JCFS_Final_Report_Sept15:September 2015 34
Table 20: Results for Sea Level Rise Scenarios
ID Location Base Case
(mAHD)
Impact (m)
Sea Level Rise of 0.4m
Sea Level Rise of 0.9m
1 Carillon Ave 32.25 0.00 0.00
2 Fisher Road Oval 35.94 0.00 0.00
3 Sydney Uni Oval 21.62 0.00 0.00
4 Parramatta Rd (St Johns Oval) 20.31 0.00 0.00
5 Missenden Rd & Parramatta Rd 23.84 0.00 0.00
6 Mallett St & Parramatta Rd 18.40 0.00 0.00
7 Arundel St 15.37 0.00 0.00
8 Sparkes St 13.86 0.00 0.01
9 Larkin St 13.85 0.00 0.01
10 Pyrmont Bridge Rd 15.44 0.00 0.00
11 Orphans Creek DS 3.88 0.03 0.08
12 St Johns Rd 25.54 0.00 0.00
13 Bridge Rd (Abbey) 21.23 0.00 0.00
14 Hereford St 13.25 0.00 0.00
15 Glebe Gardens 13.16 0.00 0.00
16 Wigram Rd 14.06 0.00 0.00
17 Harold Park US 7.25 0.01 0.01
18 Minogue Cres 11.41 0.00 0.00
19 Coneill Pl 3.28 0.00 0.01
20 Chapman Rd 2.47 0.10 0.18
21 Federal Park 2.41 0.10 0.19
22 Jubilee Oval 2.44 0.10 0.19
23 Glebe Point Rd 17.01 0.00 0.00
24 Eglinton Rd 5.45 0.00 0.00
Mean: +0.01 +0.03

Johnstons Creek Catchment Flood Study
WMAwater 111021:JCFS_Final_Report_Sept15:September 2015 35
6.9. Flood Damages Assessment
Flood impact can be quantified in the calculation of flood damages. Flood damage calculations do not include all impacts associated with flooding. They do, however, provide a basis for assessing the economic loss of flooding and also a non-subjective means of assessing the merit of flood mitigation works such as retarding basins, levees, drainage enhancement etc. The quantification of flood damages is an important part of the floodplain risk management process. By quantifying flood damage for a range of design events, appropriate cost effective management measures can be analysed in terms of their benefits (reduction in damages) versus the cost of implementation. The cost of damage and the degree of disruption to the community caused by flooding depends upon many factors including:
The magnitude (depth, velocity and duration) of the flood; Land use and susceptibility to damages; Awareness of the community to flooding; Effective warning time; The availability of an evacuation plan or damage minimisation program; Physical factors such failure of services (sewerage), flood borne debris, sedimentation;
and The types of asset and infrastructure affected.
The estimation of flood damages tends to focus on the physical impact of damages on the human environment but there is also a need to consider the ecological cost and benefits associated with flooding. Flood damages can be defined as being tangible or intangible. Tangible damages are those for which a monetary value can be easily assigned, while intangible damages are those to which a monetary value cannot easily be attributed. Types of flood damages are shown in Diagram 2. The assessment of flood damages not only looks at potential costs due to flooding but also identifies when properties are likely to become flood affected by either flooding on the property or by over floor flooding as shown on Figure 43.

Johnstons Creek Catchment Flood Study
WMAwater 111021:JCFS_Final_Report_Sept15:September 2015 36
Diagram 2: Flood Damages Categories (including damage and losses from permanent inundation)
Prov
isio
n of
Pub
lic S
ervi
ceD
isru
ptio
n of
Ser
vice
s,
Com
mun
ity S
ervi
ce R
elie
f G
rant
s
Rem
ove
Mud
& D
ebris
from
Fa
cilit
ies,
Pub
lic &
Priv
ate
Prop
erty
Rep
airs
(tem
pora
ry &
pe
rman
ent)
Phys
ical
Dam
age
to
Infra
stru
ctur
e: E
lect
ricity
, W
ater
, Tel
epho
ne, G
as, R
oad
& R
ail T
rans
port
Link
s
Publ
ic P
rope
rty a
nd F
acili
ties:
Pa
rks,
Sig
ns, M
achi
nery
, Eq
uipm
ent
Con
tent
s of
Pub
lic B
uild
ings
an
d Fa
cilit
ies
PUB
LIC
A
UTH
OR
ITIE
S
CO
MM
ERC
IAL
RU
RA
L
RES
IDEN
TIA
L
SOC
IAL
Cos
ts w
hich
can
not b
e ex
pres
sed
in d
olla
rs, e
g:
- stre
ss,
- los
s of
life
,- s
erio
us in
jury
,- d
epre
ssio
n,- i
ncon
veni
ence
,- i
nsec
urity
.
Cos
ts a
ssoc
iate
d w
ith
the
flood
eve
nt
occu
rrin
g, b
ut n
ot a
s re
adily
qua
ntifi
able
.
Dam
age
caus
ed b
y flo
odw
ater
s co
min
g in
to c
onta
ct w
ith it
ems.
Th
is c
an b
e ex
pres
sed
as
"Pot
entia
l" (m
ax. d
amag
e) a
nd
"Act
ual"
(red
uced
dam
ages
due
to
mov
ing
item
s).
Cos
ts w
hich
can
be
expr
esse
d in
dol
lars
.
FIN
AN
CIA
L
Loss
of e
xist
ing
&/or
Po
tent
ial T
rade
Loss
of P
rodu
ctiv
ity a
nd In
com
e,
Bank
Inte
rest
Cha
rges
Dis
pose
of d
amag
ed p
rodu
cts,
st
ock,
mat
eria
ls; C
lean
ing
and
Re-
inst
atem
ent
Phys
ical
Dam
age
to B
uild
ings
Exte
rnal
Item
s:
Vehi
cles
, Mac
hine
ry, D
ispl
ay,
Raw
Mat
eria
ls/S
tock
pile
s,
Fenc
es
Con
tent
s of
Bui
ldin
gs:
Prod
ucts
, Sto
ck, F
ittin
gs,
Tool
s, M
achi
nery
, Raw
M
ater
ials
Sow
ing
or h
arve
stin
g of
Cro
ps, S
ale
of S
tock
(at
depr
ecia
ted
valu
e or
de
pend
ent o
n m
arke
t in
fluen
ces)
Loss
of F
arm
Pro
duct
ion
and
Inco
me,
Re-
inst
atem
ent o
f Pa
stur
es, S
uppl
emen
tary
fe
edin
g of
sto
ck (b
y ha
nd o
r ou
tsid
e ag
istm
ent),
Sto
ck
mov
emen
t/ tra
nspo
rt, L
ivin
g co
sts
(tem
pora
ry a
ccom
odat
ion
and
food
)
Cle
an H
omes
tead
and
O
ut-b
uild
ings
; Rem
ove
Deb
ris;
Dis
pose
of a
ffect
ed c
rops
&/o
r st
ock
Phys
ical
Dam
age
to S
truct
ures
:
Dam
age
to H
omes
tead
, She
ds,
Acce
ss tr
acks
, Pro
tect
ion
leve
es
Exte
rnal
Item
s:
Vehi
cles
, She
ds (s
tabl
es/b
arns
), M
achi
nery
, Too
ls, F
ence
s, F
eed
stor
age,
Sad
dles
, Cro
ps &
/or
Stoc
k, Ir
rigat
ion
Syst
ems
Con
tent
s of
Bui
ldin
gs:
Clo
thes
, Car
pets
, Fur
nitu
re,
Valu
able
s, F
ittin
gs, A
pplia
nces
Not
App
licab
leLo
ss o
f wag
es, L
ivin
g co
sts
(tem
pora
ry a
ccom
odat
ion
and
food
), Ti
me
to re
pair/
repl
ace
dam
aged
item
s
Cle
an C
arpe
ts, W
alls
, C
loth
es;
Re-
inst
ate
Furn
iture
; Rem
ove
Mud
and
D
ebris
Phys
ical
Dam
age
to B
uild
ings
: G
ypro
ck, C
upbo
ards
, Sco
ur o
f Fo
otin
gs, H
ouse
s be
com
ing
buoy
ant (
float
ing
off f
ootin
gs)
Exte
rnal
Item
s:
Vehi
cles
, Lau
ndrie
s,
Car
avan
s, S
heds
, Too
ls,
Gar
dens
, Fen
ces
Con
tent
s of
Bui
ldin
gs:
Clo
thes
, Car
pets
, Fur
nitu
re,
Valu
able
s, F
ittin
gs, A
pplia
nces
OPP
OR
TUN
ITY
FIN
AN
CIA
LC
LEA
NU
PST
RU
CTU
RA
LEX
TER
NA
LIN
TER
NA
L
IND
IREC
TD
IREC
T
INTA
NG
IBLE
TAN
GIB
LE
DA
MA
GE
FRO
M F
LOO
DIN
G

Johnstons Creek Catchment Flood Study
WMAwater 111021:JCFS_Final_Report_Sept15:September 2015 37
6.9.1. Tangible Flood Damages
Tangible flood damages are comprised of two basic categories; direct and indirect damages (refer Diagram 2). Direct damages are caused by floodwaters wetting goods and possessions thereby damaging them and resulting in either costs to replace or repair or in a reduction to their value. Direct damages are further classified as either internal (damage to the contents of a building including carpets, furniture), structural (referring to the structural fabric of a building such as foundations, walls, floors, windows) or external (damage to all items outside the building such as cars, garages). Indirect damages are the additional financial losses caused by the flood for example the cost of temporary accommodation, loss of wages by employees etc. Given the variability of flooding and property and content values, the total likely damages figure in any given flood event is useful to get a feel for the magnitude of the flood problem, however it is of little value for absolute economic evaluation. However, damages estimates are useful when studying the economic effectiveness of proposed mitigation options. Understanding the total damages prevented over the life of the option in relation to current damages, or to an alternative option, can assist in the decision making process. The standard way of expressing flood damages is in terms of average annual damages (AAD). AAD represents the equivalent average damages that would be experienced by the community on an annual basis, by taking into account the probability of a flood occurrence. This means the smaller floods, which occur more frequently, are given a greater weighting than the rare catastrophic floods. Floor level survey was undertaken to quantify the damages caused by inundation for existing development. As part of this floor level survey work an indicative ground level was recorded for use in the damages assessment. This was used in conjunction with the flood level information for design events as established in this study. Damages calculations were carried out for all properties which floor level was surveyed, with the selection criteria as described in Appendix B. It should be noted that by including only a selection of properties primarily in the 1% AEP extent, properties that are inundated in rarer events have not been accounted for. Therefore damage calculations for the PMF event are likely to be underestimated. It was not considered viable to survey all properties within the PMF extent for the purpose of damage calculations. A flood damages assessment was undertaken herein for existing development in accordance with current OEH guidelines (Reference 19) and the Floodplain Development Manual (Reference 10). The damages were calculated using a number of height-damage curves which relate the depth of water above the floor with tangible damages. Each component of tangible damages is allocated a maximum value and a maximum depth at which this value occurs. Any flood depths greater than this allocated value do not incur additional damages as it is assumed that, by this level, all potential damages have already occurred. Damages were calculated for residential and commercial\industrial properties separately and the process and results are described in the following sections. The combined results are provided as Table 21. This flood damages estimate does not include the cost of restoring or maintaining

Johnstons Creek Catchment Flood Study
WMAwater 111021:JCFS_Final_Report_Sept15:September 2015 38
public services and infrastructure. It should be noted that damages calculations do not take into account flood damages to any basements or cellars, hence where properties have basements damages can be under estimated. Table 21: Estimated Combined Flood Damages for Johnstons Creek Catchment
Event Number of
Properties Flood Affected
No. of Properties Flooded Above Floor
Level Total Tangible Flood
Damages Average Tangible
Damages Per Flood Affected Property
5 year ARI 111 38 $ 3,281,700 $ 29,600 10% AEP 127 61 $ 4,311,900 $ 34,000 5% AEP 138 75 $ 5,358,000 $ 38,900 2% AEP 148 82 $ 6,080,100 $ 41,100 1% AEP 159 94 $ 7,027,200 $ 44,200
PMF 180 139 $ 14,320,800 $ 79,600 Average Annual Damages (AAD) $ 2,277,900 $ 12,700
* Excludes all damages to public assets but includes external damages that may or may not occur with building floor inundation.
6.9.1.1. Residential Properties
Flood damages assessment for residential development was undertaken in accordance with OEH guidelines (Reference 19). For residential properties, external damages (damages caused by flooding below the floor level) were set at $6,700 and additional costs for clean-up as $4,000. For additional accommodation costs or loss of rent a value of $220 per week was allowed assuming that the property would have to be unoccupied for up to three weeks. Internal (contents) damages were allocated a maximum value of $37,500 occurring at a depth of 2 m above the building floor level (and linearly proportioned between the depths of 0 to 2 m). Structural damages vary on whether the property is slab/low set or high set. For the purpose of this study, any property with a floor level of 0.5 m or more above ground level was assumed to be high set. For two storey properties, damages (apart from external damages) are reduced by a factor of 70% where only the ground floor is flooded as it is assumed some contents will be on the upper floor and unaffected and that structural damage costs will be less. In some instances external damage may occur even where the property is not inundated above floor level and therefore tangible damages include external damages which may occur with or without house floor inundation. A summary of the residential flood damages for the Johnstons Creek catchment is provided in Table 22. Overall, for residential properties in the catchment there is little difference in the average tangible damages per property for all the design events analysis up to the 1% AEP event. This is reflective of the relatively small differences in flood levels between the design flood events. Average damage per property increases at events larger than the 1% AEP when more properties become flooded above floor level. Note that the terminology used refers to a property or lot being the land within the ownership boundary. Flooding of a property does not necessarily mean flooding above floor level of a building on that property/lot.

Johnstons Creek Catchment Flood Study
WMAwater 111021:JCFS_Final_Report_Sept15:September 2015 39
Table 22: Estimated Residential Flood Damages for Johnstons Creek Catchment
Event Number of
Properties Flood Affected
No. of Properties Flooded Above Floor
Level Total Tangible Flood
Damages Average Tangible
Damages Per Flood Affected Property
5 year ARI 97 32 $ 1,910,700 $ 19,700 10% AEP 114 54 $ 2,696,100 $ 23,700 5% AEP 124 66 $ 3,220,700 $ 26,000 2% AEP 134 73 $ 3,715,200 $ 27,800 1% AEP 145 84 $ 4,322,200 $ 29,900
PMF 166 125 $ 8,700,600 $ 52,500 Average Annual Damages (AAD) $ 1,351,900 $ 8,200
6.9.1.2. Commercial and Industrial Properties
The tangible flood damage to commercial and industrial properties is more difficult to assess. Commercial and industrial damage estimates are more uncertain and larger than residential damages. Commercial and industrial damage estimates can vary significantly depending on:
Type of business – stock based or not; Duration of flooding – affects how long a business may be closed for not just whether the
business itself if closed but when access to it becomes available; Ability to move stock or assets before onset of flooding - some large machinery will not
be able to moved and in other instances there may be no sufficient warning time to move stock to dry locations; and
Ability to transfer business to a temporary location. Costs to business can occur for a range of reasons, some of which will affect some businesses more than others dependent on the magnitude of flooding and the type of businesses. Common flood costs to businesses are:
Removal and storage of stock before a flood if warning is given; Loss of production – caused by damaged stock, assets and availability of staff; Loss of stock and/or assets; Reduced stock through reduced or no supplies; Trade loss – by customers not being able to access the business or through business
closure; Cost of replacing damages or lost stock or assets; and Clean-up costs.
No specific guidance is available for assessing flood damages to non-residential properties. Therefore for this study, commercial and industrial damages were calculated using the methodology for residential properties but with the costs/damages increased to a value which is consistent with commercial/industrial development. For example, the maximum value of internal (contents) damages was increased to $250,000 since the building contents are of higher value

Johnstons Creek Catchment Flood Study
WMAwater 111021:JCFS_Final_Report_Sept15:September 2015 40
whilst loss of rent was set at $3,000 per week to account for the loss of business through having to close for a period. Flooding below floor level uses the same damages curve as the residential properties. Though the original OEH guidelines for flood damages calculations are not applicable to non-residential properties, they can still be used to create comparable damage figures. The damages value figure should not be taken as an actual likely cost rather it is useful when comparing potential management options and for benefit-cost analysis. A summary of the commercial/industrial flood damages for the Johnstons Creek catchment is provided in Table 23. AAD for the surveyed commercial/industrial properties is slightly less than that for residential properties but the number of flood affected properties for the latter is 7 to 10 times more than that of the former. This reflects the higher costs that businesses would incur compared to residential dwellings when flooded above floor level. On a per property basis the AAD is approximately 8.1 times higher when comparing the commercial/industrial properties against the residential properties. Table 23: Estimated Commercial and Industrial Flood Damages for Johnstons Creek Catchment
Event Number of
Properties Flood Affected
No. of Properties Flooded Above Floor
Level Total Tangible Flood
Damages Average Tangible
Damages Per Flood Affected Property
5 year ARI 14 6 $ 1,371,000 $ 98,000 10% AEP 13 7 $ 1,615,800 $ 124,300 5% AEP 14 9 $ 2,137,300 $ 152,700 2% AEP 14 9 $ 2,365,000 $ 169,000 1% AEP 14 10 $ 2,705,000 $ 193,300
PMF 14 14 $ 5,620,300 $ 401,500 Average Annual Damages (AAD) $ 926,100 $ 66,200
6.9.2. Intangible Flood Damages
The intangible damages associated with flooding, by their nature, are inherently more difficult to estimate in monetary terms. In addition to the tangible damages discussed previously, additional costs/damages are incurred by residents affected by flooding, such as stress, risk/loss to life, injury, loss of sentimental items etc. It is not possible to put a monetary value on the intangible damages as they are likely to vary dramatically between each flood (from a negligible amount to several hundred times greater than the tangible damages) and depend on a range of factors such as the size of flood, the individuals affected, and community preparedness. However, it is still important that the consideration of intangible damages is included when considering the impacts of flooding on a community. Post flood damages surveys have linked flooding to stress, ill-health and trauma for the residents. For example the loss of memorabilia, pets, insurance papers and other items without fixed costs and of sentimental value may cause stress and subsequent ill-health. In addition flooding may affect personal relationships and lead to stress in domestic and work situations. In

Johnstons Creek Catchment Flood Study
WMAwater 111021:JCFS_Final_Report_Sept15:September 2015 41
addition to the stress caused during an event (from concern over property damage, risk to life for the individuals or their family, clean up etc.) many residents who have experienced a major flood are fearful of the occurrence of another flood event and the associated damage. The extent of the stress depends on the individual and although the majority of flood victims recover, these effects can lead to a reduction in quality of life for the flood victims. During any flood event there is the potential for injury as well as loss of life due to causes such as drowning, floating debris or illness from polluted water. Generally, the higher the flood velocities and depths the higher the risk. Within the Johnstons Creek catchment area, the high hazard areas include Johnstons Creek and trapped low points with high flood depths, i.e. at Larkin Street upstream of Pyrmont Bridge Road. However, there will always be local high risk (high hazard) areas where flows may be concentrated around buildings or other structures within low hazard areas.

Johnstons Creek Catchment Flood Study
WMAwater 111021:JCFS_Final_Report_Sept15:September 2015 42
7. CONCLUSIONS
A flood study, reported upon herein, has been undertaken for the Johnstons Creek catchment. The flood study specifically addresses the part of the overall Johnstons Creek catchment which incorporates the City of Sydney LGA area. Mechanisms of flooding addressed include mainstream flooding (e.g. Johnstons Creek) as well as local overland flow (runoff in excess of pit/pipe drainage systems). The flood study has defined flood behaviour for a range of floods from the 5Y ARI to the PMF event and the results are presented herein. Through the course of the study a number of areas were identified which were prone to inundation of property and/or house habitable floor levels. Subsequent floor level survey and damages assessment identified 94 properties that are liable to over floor inundation in the 1% AEP event. Notably 38 properties are also flood liable (over floor inundation) in smaller events such as the 5 year ARI event although this estimate is conservative given the prudent blockage assumption. A number of hotspots were also identified in the study, i.e. locations where a number of properties are flood liable due to a shared flooding mechanism. These include: 1. Minogue Crescent and Coneill Place - a number of homes on Minogue Crescent suffer
from over floor flood liability due to Johnstons Creek levels. Note that inundation of these properties (not over floor level) will tend to occur on a more frequent basis as a result of local stormwater type flows;
2. The Crescent - commercial property in this area which is slightly raised above natural ground level is subject to inundation via Johnstons Creek. Note that this downstream reach of the creek is relatively sensitive to adopted tail water levels;
3. Intersection of Wigram Road and Ross Street - this area immediately upstream of the Harold Park track will tend to collect water. Note however that inundation above floor levels of adjoining houses does not occur for any of the modelled events;
4. Glebe Gardens/Hereford Street - a few properties here are subject to over floor inundation (located on the south side of Hereford St) for the smallest event modelled, i.e. the 5Y ARI event;
5. Depression upstream of Pyrmont Bridge Road - Pyrmont Bridge Road at a level of ~15.5 mAHD tends to retard upstream flows from the Orphan Creek catchment, much of which lies within the University of Sydney campus. With no overland flow path water will tend to accumulate causing severe flooding for some properties in this area, particularly low lying property and property closest to the upstream side of Pyrmont Bridge Road. Note that further work will be required to be carried out under the Management Study in order to properly define flood liability in this area; and
6. Upstream areas in the Lillie Bridge culvert catchment - the area between Bridge Road and St Johns Road (west of the Glebe Fire Station).

Johnstons Creek Catchment Flood Study
WMAwater 111021:JCFS_Final_Report_Sept15:September 2015 43
The subsequent Floodplain Risk Management Study and Plan will seek to address the flood liability of properties identified within the course of the study.

Johnstons Creek Catchment Flood Study
WMAwater 111021:JCFS_Final_Report_Sept15:September 2015 44
8. ACKNOWLEDGEMENTS
WMAwater wish to acknowledge the assistance of the City of Sydney staff and Floodplain Management Committee in carrying out this study as well as the NSW Government (Office of Environment and Heritage) and the residents of the Johnstons Creek catchment. This study was jointly funded by the City of Sydney and the NSW Government.

Johnstons Creek Catchment Flood Study
WMAwater 111021:JCFS_Final_Report_Sept15:September 2015 45
9. REFERENCES
1. Sydney Water Johnstons Creek (SWC 17) Capacity Assessment December 1995 2. Cardno Leichhardt Flood Study Prepared for Leichhardt Council, June 2010 3. Cardno Harold Park – WSUD & Flood Risk Management (Stage 1)
Prepared for City of Sydney, January 2010 4. Cardno Harold Park – WSUD & Flood Risk Management (Stage 2)
Prepared for City of Sydney, May 2010 5. Cardno Harold Park Redevelopment – Lot 1 Minogue Cr, Forest Lodge – Flood Study
Prepared for Mirvac, June 2011 6. Hughes Trueman & Perrens Consultants Blackwattle Bay and Johnstons Creek Catchments Prepared for Sydney Water, 2004 7. Pilgrim H (Editor in Chief) Australian Rainfall and Runoff – A Guide to Flood Estimation Institution of Engineers, Australia, 1987 8. Bureau of Meteorology The Estimation of Probable Maximum Precipitation in Australia: Generalised
Short-Duration Method June 2003 9. BMT WBM TUFLOW User Manual 2010 10. NSW Government Floodplain Development Manual April 2005 11. Fourth Assessment Report “Climate Change 2007” - Synthesis Report Intergovernmental Panel on Climate Change, 2007

Johnstons Creek Catchment Flood Study
WMAwater 111021:JCFS_Final_Report_Sept15:September 2015 46
12. Third Assessment Report “Climate Change 2001” - Synthesis Report
Intergovernmental Panel on Climate Change, 2001 13. Australian Greenhouse Office – Department of the Environment and Water Resources Climate Change Adaptation Actions for Local Government
SMEC, 2007 14. CSIRO Climate Change in Australia – Technical Report 2007 2007 15. NSW Department of Environment and Climate Change (DECC) Floodplain Risk Management Guideline - Practical Consideration of Climate
Change October 2007
16. New South Wales Government NSW Sea Level Rise Policy Statement
October 2009 17. NSW Department of Environment, Climate Change and Water Flood Risk Management Guide
August 2010 18. L Howells, D McLuckie, G Collings, N Lawson Defining the Floodway – Can One Size Fit All?
43rd Floodplain Management Conference Proceedings, 2003 19. NSW Department of Environment and Climate Change Floodplain Risk Management Guideline – Residential Flood Damages
October 2007 20. City of Sydney Sydney Development Control Plan (Harold Park) 2011
February 2011 21. VT Chow Open Channel Hydraulics
McGraw Hill, 1959


CENTRAL
WYNYARD
TOWN HALL
LEICHHARDT
MARRICKVILLE
SYDNEY HARBOUR
BONDI JUNCTION
LOCALITY MAP
FIGURE 1
Study Area
J:\
Jo
bs\1
11
02
1\G
IS\A
rcM
ap
s\J
C\R
ep
ort
_F
igu
res_
20
12
03
23
\Fig
ure
01
_Jo
hn
sto
nsC
k_
Lo
ca
lity_
Ma
p.m
xd
0 1.25 2.5 3.75 5km
´
SYDNEY HARBOUR
BELMORE
CENTRAL
HORNSBY
WYNYARDBURWOOD
KOGARAH
CRONULLA
ASHFIELD
CHATSWOOD
LINDFIELD
NORTH SYDNEY
MARRICKVILLE
BONDI JUNCTION
PARRAMATTA RIVER
SYDNEY AIRPORT

BRIDGE R
D
GLE
BE P
OIN
T R
D
BA
Y S
T
WIG
RAM R
D
ABERCROMBIE ST
ROSE ST
WES
TERN D
ISTR
IBUTER
RO
SS
ST
CARILLON AVE
NE
LS
ON
ST
PARRAMATTA RD
CITY R
D
WENTW
ORTH
PARK R
D
BOOTH ST
ST. PAULS OVAL
ST. JOHNS OVAL
VICTORIA PARK
JUBILEE OVAL
WENTWORTH PARK
HAROLD PARK PACEWAY
GLEBE
CAMPERDOWN
DARLINGTON
FOREST LODGE
WATT
LE
ST
SH
EP
HE
RD
ST
STUDY AREAJOHNSTONS CREEK
FIGURE 2
Study Area
Elevation (mAHD)
High : 66.5
Low : -2.2
J:\
Jo
bs\1
11
02
1\G
IS\A
rcM
ap
s\J
C\R
ep
ort
_F
igu
res_
20
12
03
23
\Fig
ure
02
_Jo
hn
sto
nsC
k_
Stu
dyA
rea
.mxd
0 250 500 750 1,000m
´

!
!MAIN JOHNSTONS CREEK BRANCH
LIL
LIE
BR
IDG
E B
RA
NC
H
PH
YS
ICS
SC
HO
OL S
UB
-BR
AN
CH
ST ANDREWS SUB-BRANCH
OR
PHAN
SC
HO
OL
CR
EEK B
RAN
CH
HO
CK
EY
FIE
LD
SU
B-B
RA
NC
H
DRAINAGE SYSTEM & HYDRAULIC MODEL LAYOUTJOHNSTONS CREEK
FIGURE 3
! Applied Boundary Conditions (Refer to Chapter 2)
Pits
Pipe/Culvert Diameter (m)
0.1 - 0.45
0.45 - 0.75
0.75 - 1.0
1.0 - 2.4
2.4 - 3.8
Open Channel
Study Area
J:\
Jo
bs\1
11
021
\GIS
\Arc
Ma
ps\J
C\R
ep
ort
_F
igu
res_
20
12
03
23
\Fig
ure
03
_Jo
hn
sto
nsC
k_
Hyd
rau
lic_M
od
el_
Layo
ut.
mxd
0 100 200 300 400 500m
´
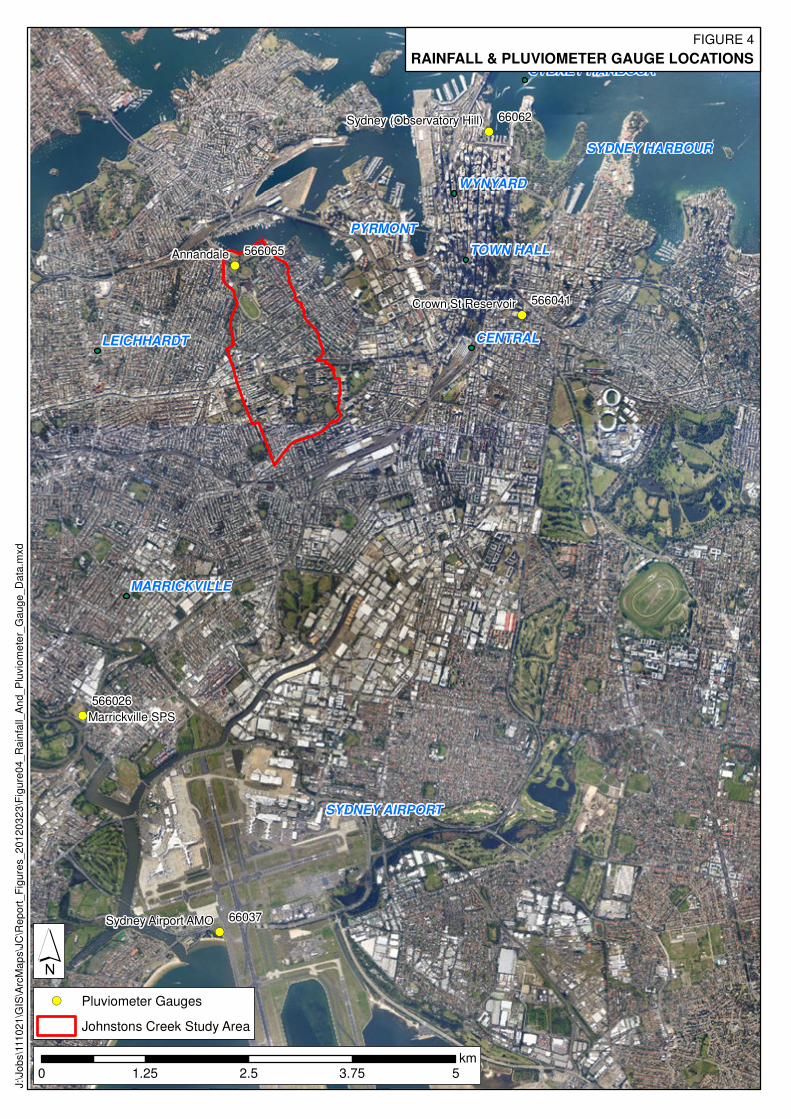
!(
!(
!(
!(
!(
66037
66062
566041
566065
566026
Annandale
Marrickville SPS
Crown St Reservoir
Sydney Airport AMO
Sydney (Observatory Hill)
CENTRAL
WYNYARD
TOWN HALL
LEICHHARDT
MARRICKVILLE
SYDNEY HARBOURRAINFALL & PLUVIOMETER GAUGE LOCATIONS
FIGURE 4
!( Pluviometer Gauges
Johnstons Creek Study Area
J:\
Jo
bs\1
11
02
1\G
IS\A
rcM
ap
s\J
C\R
ep
ort
_F
igu
res_
20
12
03
23
\Fig
ure
04
_R
ain
fall_
An
d_
Plu
vio
me
ter_
Ga
ug
e_
Da
ta.m
xd
0 1.25 2.5 3.75 5km
´
SYDNEY AIRPORT
PYRMONT
SYDNEY HARBOUR

J:\Jobs\111021\Hydrology\IFD_Bursts_ANNANDALE
1
10
100
1000
1 10 100 1000
Inte
nsit
y (m
m/h
)
Burst duration (min)
Burst Intensities and Frequency
1Y ARI
2Y ARI
5Y ARI
10Y ARI (10% AEP)
20Y ARI (5% AEP)
50Y ARI (2% AEP)
100Y ARI (1% AEP)
26th January 1991
17th February 1993
13th September 1993
10th April 1998
12th February 2010
30th May 2011
FIG
UR
E5
RA
INF
AL
L B
UR
ST
AN
D F
RE
QU
EN
CY
AN
NA
ND
AL
E G
AU
GE
J:\Jobs\111021\Hydrology\IFD_Bursts_ANNANDALE.xlsm

1
10
100
1000
1 10 100 1000
Inte
nsit
y (m
m/h
)
Burst duration (min)
Burst Intensities and Frequency
1Y ARI
2Y ARI
5Y ARI
10Y ARI (10% AEP)
20Y ARI (5% AEP)
50Y ARI (2% AEP)
100Y ARI (1% AEP)
28th February 2001
10th April 1998
9th April 1998
6th January 1989
26th January 1991
8th November 1984
FIG
UR
E6
RA
INF
AL
L B
UR
ST
AN
D F
RE
QU
EN
CY
SY
DN
EY
OB
SE
RV
AT
OR
Y H
ILL
GA
UG
E
J:\Jobs\111021\Hydrology\IFD_Bursts_MACRO.xlsm

!
!
!
!
!
!
!
!
!
!
!
!
!
!
!
!
!!
!
!
!
!
!(
!(
!(
!(
!(
!(
!(
!(
!(
!(
!(
!(!(
!(
!(
!(
!(
!(
!(
!(
!(
!(
!(
!(
!(
!(
!(
!(
!(
!(
!(
!(
!(
!(
!(
!(
!(
!(
!(
!(
!(
!(
!(
!(
!(
!(
!(
!(
!(
!(
!(
!(
!(
!(
!(
!(
!(
!(
!(
!(
COMMUNITY CONSULTATION
RESPONDENTS: JOHNSTONS CREEK
FIGURE 7
!( Questionnaire Respondents
! Respondent Identified Flood Area
Study Area
J:\
Jo
bs\1
11
021
\GIS
\Arc
Ma
ps\J
C\R
ep
ort
_F
igu
res_
20
12
03
23
\Fig
ure
07
_Jo
hn
sto
nsC
k_
Respo
nd
ents
_Lo
ca
tion
.mxd
0 100 200 300 400 500m
´
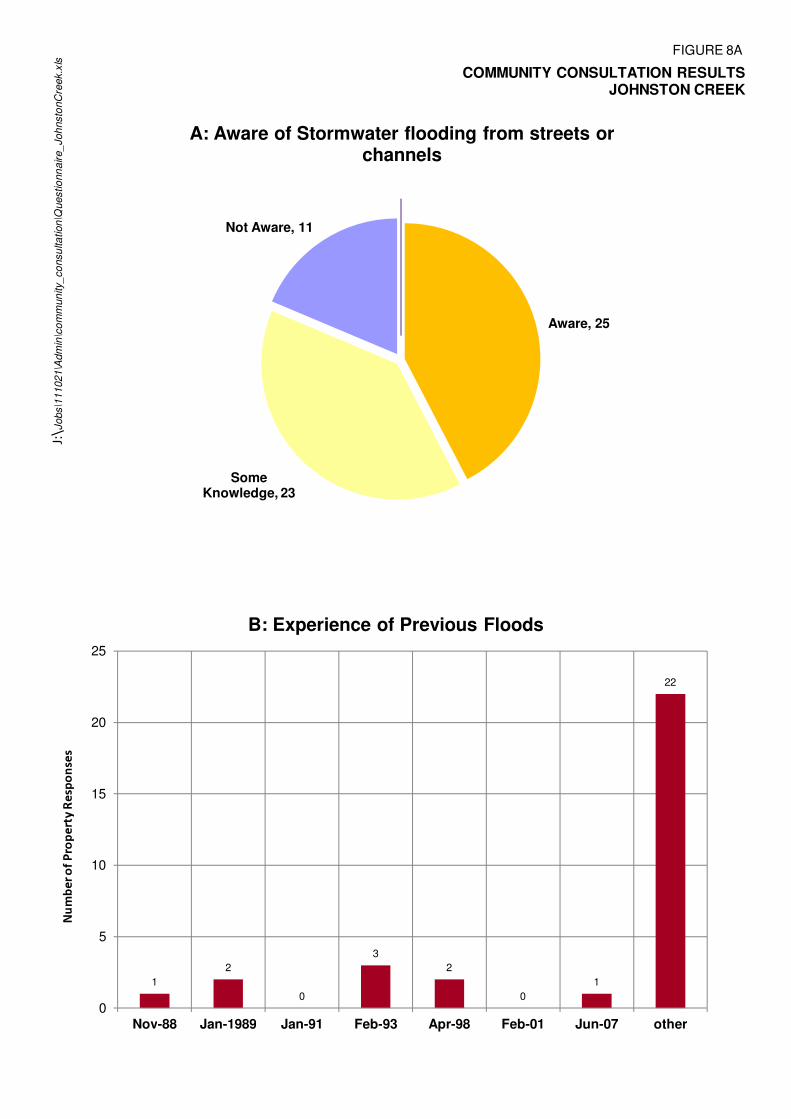
Aware, 25
Some Knowledge, 23
Not Aware, 11
A: Aware of Stormwater flooding from streets or channels
1
2
0
3
2
0
1
22
0
5
10
15
20
25
Nov-88 Jan-1989 Jan-91 Feb-93 Apr-98 Feb-01 Jun-07 other
B: Experience of Previous Floods
Nu
mb
er
of
Pro
pe
rty
Re
spo
nse
s
FIGURE 8A
COMMUNITY CONSULTATION RESULTS JOHNSTON CREEK
J:\J
obs\1
11021\A
dm
in\c
om
mun
ity_co
nsu
lta
tion\Q
uestio
nn
aire
_Joh
nsto
nC
reek.x
ls

FIGURE 8B
COMMUNITY CONSULTATION RESULTS JOHNSTON CREEK
Yes, 12
No, 47
C: Homes flooded
45
30
35
40
45
50
Nu
mb
er
of
Resp
on
ses
D: What part of the property was floodedJ:\J
obs\1
11021\A
dm
in\c
om
munity_consultation\Q
uestionnaire_Johnsto
nC
reek.x
ls
6
2 2 3 20 0 1
0
5
10
15
20
25
30
Nu
mb
er
of
Resp
on
ses
8
28
98
6
5
10
15
20
25
30
Nu
mb
er
of
Resp
on
ses
E: Other areas flooded
0
0
Residential Roads Parks Other No Response No areas flooded

FIGURE 8C
COMMUNITY CONSULTATION RESULTS JOHNSTON CREEK
19
5
9
5
1
5
24
0
5
10
15
20
25
30
Daily routine was affected.
Safety was threatened.
Access to property was
affected.
Property and/or
contents
Business was unable to
operate during
Other. No Response/ N/A
Nu
mb
er
of
Resp
on
ses
F: Number of Responders that were Inconvenienced by Floodwater
Aware , 24
Not Aware, 33
No Response, 2
G: Noticed any Bridges/Drains blocked
affected. contents damaged
operate during the flooded
period.
111021\A
dm
in\c
om
munity_consultation\Q
uestionnaire_Johnsto
nC
reek.x
lsJ:\J
obs\1
11021

HYDROLOGICAL SUBCATCHMENTS
JOHNSTONS CREEK
FIGURE 9
Study Area
TUFLOW Subcatchments
RAFTS Subcatchments
Rainfall Application Region
J:\
Jo
bs\1
11
021
\GIS
\Arc
Ma
ps\J
C\R
ep
ort
_F
igu
res_
20
12
03
23
\Fig
ure
09
_Jo
hn
sto
nsC
k_
Hyd
rolo
gic
alS
ubcatc
hm
en
ts_R
evis
ed
.mxd
0 100 200 300 400 500m
´

CAMPERDOWN
FOREST LODGE
LAND USE MAPJOHNSTONS CREEK
FIGURE 10
Study Area
Zone (Sydney LEP 2012)
Neighbourhood Centre
Local Centre
Mixed Use
SREP 26 City West
Harold Park
Light Industrial
General Residential
Public Recreation
SREP Sydney Harbour Catchment 2005
Infrastructure
J:\
Jo
bs\1
11
021
\GIS
\Arc
Ma
ps\J
C\F
inal_
Re
po
rt_
Fig
s\F
igu
re1
0_Joh
nsto
nsC
k_L
an
dU
se
Ma
p.m
xd
0 100 200 300 400 500m
´

!
!
!
!
!
!
!
!
!
!
!
!
!
!
!
!
!!
!
!
!
!
MODEL VERIFICATIONJOHNSTONS CREEK CATCHMENT
FIGURE 11
! Identified Flood Area
Study Area
Depth (m)
0.1 - 0.25
0.25 - 0.5
0.5 - 0.75
0.75 - 1
> 1
J:\
Jo
bs\1
11
021
\GIS
\Arc
Ma
ps\J
C\R
ep
ort
_F
igu
res_
20
12
03
23
\Fig
ure
11_
Jo
hnsto
nsC
k_M
od
el_
Veri
fica
tio
n.m
xd
0 100 200 300 400 500m
´
Note: Flood depths modelled as less than 0.1m are not displayed
Disclaimer:Inundation patterns and/or peak flood levels shown for design events are based on best available estimates of flood behaviour within the Catchment.Inundation from local overland flow may vary slightly to the displayed design rainfall inundation patterns .Council should be consulted to confirm flood affectation at individual allotments.

CRITICAL DURATION MAP
1% AEP DESIGN FLOOD EVENT
FIGURE 12
Study Area
Critical Duration
100y 15m
100y 30m
100y 45m
100y 60m
100y 120m
100y 180m
100y 360m
100y 540m
100y 720m
J:\
Jo
bs\1
11
021
\GIS
\Arc
Ma
ps\J
C\R
ep
ort
_F
igu
res_
20
12
03
23
\Fig
ure
12
_Jo
hn
sto
nsC
k_
Critica
l_D
ura
tion
.mxd
0 100 200 300 400 500m
´

MAIN JOHNSTONS CREEK BRANCH
OF
1
OF
2
OF13
OF9
OF5
OF12
OF
4
OF
8
OF
3
OF10
OF6
OF11
OF7
7
6
2
3
1
4
5
9
8
24
23
1920
18
21
22
14
12
13
15
11
1017
16
P7
P6
P5 P4
P3
P2
P1
C4
C3
C2
C1
TABULATED FLOODING LOCATIONS
JOHNSTONS CREEK
FIGURE 13
Channel & Pipe Flow Locations
Overland Flow Locations
Tabulated Flooding Locations
Profile Location
Study Area
J:\
Jo
bs\1
11
021
\GIS
\Arc
Ma
ps\J
C\R
ep
ort
_F
igu
res_
20
12
03
23
\Fig
ure
07
_Jo
hn
sto
nsC
k_
Respo
nd
en
ts_
Lo
ca
tio
n.m
xd
0 100 200 300 400 500m
´

PEAK FLOOD DEPTH5 YEAR ARI DESIGN FLOOD EVENT
FIGURE 14
Study Area
Depth (m)
0.1 - 0.25
0.25 - 0.5
0.5 - 0.75
0.75 - 1
> 1
0 100 200 300 400 500m
´
Note: Flood depths modelled as less than 0.1m are not displayed
Disclaimer:Inundation patterns and/or peak flood levels shown for design events are based on best available estimates of flood behaviour within the Catchment.Inundation from local overland flow may vary slightly to the displayed design rainfall inundation patterns .Council should be consulted to confirm flood affectation at individual allotments.
J:\
Jo
bs\1
11
021
\GIS
\Arc
Ma
ps\J
C\F
inal_
Re
po
rt_
Fig
s\F
igu
re1
4_P
eak_
Flo
od
_D
ep
th_
20%
_A
EP.m
xd

PEAK FLOOD DEPTH10% AEP DESIGN FLOOD EVENT
FIGURE 15
Study Area
Depth (m)
0.1 - 0.25
0.25 - 0.5
0.5 - 0.75
0.75 - 1
> 1
0 100 200 300 400 500m
´
Note: Flood depths modelled as less than 0.1m are not displayed
Disclaimer:Inundation patterns and/or peak flood levels shown for design events are based on best available estimates of flood behaviour within the Catchment.Inundation from local overland flow may vary slightly to the displayed design rainfall inundation patterns .Council should be consulted to confirm flood affectation at individual allotments.
J:\
Jo
bs\1
11
021
\GIS
\Arc
Ma
ps\J
C\F
inal_
Re
po
rt_
Fig
s\F
igu
re1
5_P
eak_
Flo
od
_D
ep
th_
10%
_A
EP.m
xd

PEAK FLOOD DEPTH5% AEP DESIGN FLOOD EVENT
FIGURE 16
Study Area
Depth (m)
0.1 - 0.25
0.25 - 0.5
0.5 - 0.75
0.75 - 1
> 1
0 100 200 300 400 500m
´
Note: Flood depths modelled as less than 0.1m are not displayed
Disclaimer:Inundation patterns and/or peak flood levels shown for design events are based on best available estimates of flood behaviour within the Catchment.Inundation from local overland flow may vary slightly to the displayed design rainfall inundation patterns .Council should be consulted to confirm flood affectation at individual allotments.
J:\
Jo
bs\1
11
021
\GIS
\Arc
Ma
ps\J
C\F
inal_
Re
po
rt_
Fig
s\F
igu
re1
6_P
eak_
Flo
od
_D
ep
th_
5%
_A
EP.m
xd

PEAK FLOOD DEPTH2% AEP DESIGN FLOOD EVENT
FIGURE 17
Study Area
Depth (m)
0.1 - 0.25
0.25 - 0.5
0.5 - 0.75
0.75 - 1
> 1
0 100 200 300 400 500m
´
Note: Flood depths modelled as less than 0.1m are not displayed
Disclaimer:Inundation patterns and/or peak flood levels shown for design events are based on best available estimates of flood behaviour within the Catchment.Inundation from local overland flow may vary slightly to the displayed design rainfall inundation patterns .Council should be consulted to confirm flood affectation at individual allotments.
J:\
Jo
bs\1
11
021
\GIS
\Arc
Ma
ps\J
C\F
inal_
Re
po
rt_
Fig
s\F
igu
re1
7_P
eak_
Flo
od
_D
ep
th_
2%
_A
EP.m
xd

PEAK FLOOD DEPTH1% AEP DESIGN FLOOD EVENT
FIGURE 18
Study Area
Depth (m)
0.1 - 0.25
0.25 - 0.5
0.5 - 0.75
0.75 - 1
> 1
0 100 200 300 400 500m
´
Note: Flood depths modelled as less than 0.1m are not displayed
Disclaimer:Inundation patterns and/or peak flood levels shown for design events are based on best available estimates of flood behaviour within the Catchment.Inundation from local overland flow may vary slightly to the displayed design rainfall inundation patterns .Council should be consulted to confirm flood affectation at individual allotments.
J:\
Jo
bs\1
11
021
\GIS
\Arc
Ma
ps\J
C\F
inal_
Re
po
rt_
Fig
s\F
igu
re1
8_P
eak_
Flo
od
_D
ep
th_
1%
_A
EP.m
xd

PEAK FLOOD DEPTHPMF EVENT
FIGURE 19
Study Area
Depth (m)
0.1 - 0.25
0.25 - 0.5
0.5 - 0.75
0.75 - 1
> 1
0 100 200 300 400 500m
´
Note: Flood depths modelled as less than 0.1m are not displayed
Disclaimer:Inundation patterns and/or peak flood levels shown for design events are based on best available estimates of flood behaviour within the Catchment.Inundation from local overland flow may vary slightly to the displayed design rainfall inundation patterns .Council should be consulted to confirm flood affectation at individual allotments.
J:\
Jo
bs\1
11
021
\GIS
\Arc
Ma
ps\J
C\F
inal_
Re
po
rt_
Fig
s\F
igu
re1
9_P
eak_
Flo
od
_D
ep
th_
PM
F.m
xd

5
10
15
20
35
30
25
15
10
5
30
15
15
20
20
5
15
10
20
20
5
15
25
5
10
15
15
PEAK FLOOD LEVEL1% AEP DESIGN FLOOD EVENT
FIGURE 20
Study Area
Major Contours (5mAHD Interval)
Minor Contours (1mAHD Interval)
Height (mAHD)
< 5
5 - 10
10 - 15
15 - 20
20 - 25
25 - 30
30 - 35
35 - 40
> 40
0 100 200 300 400 500m
´
Disclaimer:Inundation patterns and/or peak flood levels shown for design events are based on best available estimates of flood behaviour within the Catchment.Inundation from local overland flow may vary slightly to the displayed design rainfall inundation patterns .Council should be consulted to confirm flood affectation at individual allotments.
J:\
Jo
bs\1
11
021
\GIS
\Arc
Ma
ps\J
C\F
inal_
Re
po
rt_
Fig
s\F
igu
re2
0_P
eak_
Flo
od
_Le
ve
l_1%
_A
EP.m
xd

5
10
25
30
35
15
20
20
30
15
25
5 25
10
30
15
15
5
5
35
10
10
15
15
25
25
15
35
30
20
5
10
15
10
20
20
1015
30
30
10
25
PEAK FLOOD LEVELPMF EVENT
FIGURE 21
Study Area
Major Contours (5mAHD Interval)
Minor Contours (1mAHD Interval)
Height (mAHD)
< 5
5 - 10
10 - 15
15 - 20
20 - 25
25 - 30
30 - 35
35 - 40
> 40
0 100 200 300 400 500m
´
Disclaimer:Inundation patterns and/or peak flood levels shown for design events are based on best available estimates of flood behaviour within the Catchment.Inundation from local overland flow may vary slightly to the displayed design rainfall inundation patterns .Council should be consulted to confirm flood affectation at individual allotments.
J:\
Jo
bs\1
11
021
\GIS
\Arc
Ma
ps\J
C\F
inal_
Re
po
rt_
Fig
s\F
igu
re2
1_P
eak_
Flo
od
_Le
ve
l_P
MF.m
xd