flinthills usd 492 - kansas state department of educationksde.org/portals/0/school...
TRANSCRIPT

Flinthills USD 492
i
• Budget General Information (characteristics of district)
• Supplemental Information for Tables in Summary of Expenditures
• KSDE Website Information Available
• Summary of Expenditures (Sumexpen.xlsx)

1
2013-14 Budget General Information USD #: 492
Flinthills USD 492 school district covers 389 square miles in Butler and Greenwood Counties, has a general fund assessed valuation of $15,430,233 and a capital outlay and bond and interest assessed valuation of $16,829,745. The mill levy for the general fund is 20 mills. The capital outlay mill levy is 4 mills and the bond and interest mill levy is estimated to be 10.433 USD 492 also utilizes the supplemental general fund which has a mill levy of 29.484. The total mill levy for the 2013-2014 budget is 63.917 which is a .915 mill increase from last year’s 63.002 mill levy. Flinthills Primary School is located in Cassoday, Flinthills Intermediate, Middle and High Schools are located in one building in Rosalia. The schools have an estimated enrollment of 260, grades kindergarten through twelve and a staff of 29 licensed members and 20 classified employees. Flinthills USD 492 is a member of the Butler County Special Ed Cooperative located in El Dorado and South Central Kansas Educational Service Center in Clearwater.
Introduction
Flinthills is located on the western edge of the beautiful Flint hills range of eastern Kansas. Most of the district is rural. Flinthills has performed well in academic and extracurricular areas and has set high expectations. Flinthills participates in the Southern Central Border League and is a member of the Butler County Special Education Cooperative operated by USD 490. Flinthills is a member of the South Central Kansas Educational Cooperative and participates in their functions, uses their education specialists for professional development, and is a member of the Interactive Distance Learning Network.
Board Members
Pat Hannon President Justin Grunder Vice President Pam Dunham Chet Hefton Lisa Henson Travis Holcomb Jed Morse
Key Staff
Superintendent: Justin Lockwood Business Office Staff: Stephanie Girty, Clerk Leesa Smith, Treasurer

2
Curriculum & Instruction Staff: Larry Gawith Elementary / MS Principal Pam Breech Kindergarten Charlene Foster Title I Reading Specialist Deborah Anderson Grade 1 Crystal Ratcliff Grade 2 Kristin Sangals Grade 3/4 Tiffany Willard Grade 3/4 Denise Hodge Grade 5/6 Tami Gray Grade 5/6 Math and Science, 3-6 PE Laureen Simon Grade 5/6 Bret Howard HS Principal, Athletic Director Julie Lockwood K-12 Counselor Jody McCollum 7th & 8th Science, HS Chemistry, Biology, HS Health Shane Thornton 7th & 8th Grade Social Studies, HS Social Sciences Lisa Sjogren 7th & 8th Grade Language Arts Kent Harms 7th, 8th & 9th Grade Math Sharon McClure Librarian Michael Austin Art, Technology Integration Specialist Blake Long Vocal Music, Instrumental Music Joseph Harkins Anatomy/Physiology, Earth Science Calla Jarboe Agriculture Education Sallie Scribner HS Language Arts Erik Sorum PE, HS Math, Mark McNemee HS Math Patrick Holton Industrial Technology Karen Hinnen MS/HS Special Ed Patti Plett Elementary Special Ed Nancy Thomas Gifted Facilitator Julie McCreight Drama

3
Other Key Contacts: Leesa Smith Middle School/High School Administrative Assistant Katie Taylor Intermediate School Administrative Assistant Jill Greenwell Primary School Administrative Assistant Jackie Stands Primary Paraprofessional Peggy Peterson Intermediate Paraprofessional Kelli Davis Director of Food Service Berthadean Bender Cook Sheri Stephens Cook Teresa Travinchek Cook Dennis Switzer Grounds & Maintenance Sherry Hogan Custodian Vaugh Humbolt Custodian Levi Hefton Custodian Rick Oppold Transportation/Maintenance Ty Kemp Bus Driver Jim Vaught Bus Driver Tana Wight Bus Driver Patty Baker Special Ed Paraprofessional Ginger Wieckhorst Special Ed Paraprofessional Elizabeth Wiggins Special Ed Paraprofessional Casey Cartmell Special Ed Paraprofessional Gayle Reiswig Special Ed Paraprofessional Stacey Travinchek Special Ed Paraprofessional Chris Sinnes Special Ed Paraprofessional Tammy Brown Special Ed Paraprofessional

4
Organizational Flow Chart
BOARD OF EDUCATION
SUPERINTENDENT
PRINCIPALS
CLASSIFIED SUPERVISORS SUPPLEMENTAL STAFF LICENSED FACULTY
CLASSIFIED STAFF PARAPROFESSIONALS
The District’s Accomplishments and Challenges Accomplishments: The district continues to add programs and offerings. The most recent curricular offering was an Agriculture Education Program for grades 8-12. The district also continues to implement College and Career Readiness Standards. Through a strong foundation of technology and improved instructional strategies the district’s students continue to score high on state and national assessments. The district is implementing the McRel Power Walkthrough method for administrators to be able to better document the instructional processes occurring in the classrooms. The district has also switched student information systems this year as well. The conversion to Power School should help the district to remain accessible to patrons and boost the teachers’ use of online grade books as well. Challenges: The biggest challenge for the district continues to be the budget constraints due to funding cuts by the state and declining enrollment. The district’s budget cuts have forced the district to eliminate teaching positions, bus routes, and other services provided to students.

5
Supplemental Information for the Following Tables 1. Summary of Total Expenditures by Function (All Funds) 2. Summary of General Fund Expenditures by Function 3. Summary of Supplemental General Fund Expenditures by Function 4. Summary of General and Supplemental General Fund Expenditures by Function 5. Summary of Special Education Fund by Function 6. Instruction Expenditures (1000) 7. Student and Instructional Support Expenditures (2100 & 2200) 8. General Administration Expenditures (2300) 9. School Administration Expenditures (2400) 10. Operations and Maintenance Expenditures (2600) 11. Other Costs (2500 & 2900: Other Supplemental Services) (3000: Non-Instruction
Services) 12. Capital Improvements (4000) 13. Debt Services (5000)
14. Miscellaneous Information - Transfers 15. Miscellaneous Information Unencumbered Cash Balance by Fund 16. Reserve Funds Unencumbered Cash Balance 17. Other Information - FTE 18. Miscellaneous Information Mill Rates by Fund 19. Other Information – Assessed Valuation and Bonded Indebtedness Note: The FTE (full time equivalency) used in this report to calculate the “Amount Per Pupil” is defined as following: Enrollment (FTE) includes the enrollment of the district used for state aid and budget authority, and all other preschool enrollment and kindergarten students attending full time.

6
KSDE Website Information Available K-12 Statistics (Building, District or State Totals) http://svapp15586.ksde.org/k12/k12.aspx
• Attendance / Enrollment Reports • Staff Reports • Graduates / Dropouts Reports • Crime / Violence Reports
School Finance Reports and Publications http://www.ksde.org/Default.aspx?tabid=1870
• Certified Personnel • Enrollment • Dropouts • Graduates • Salary Reports
Kansas Building Report Card http://svapp15586.ksde.org/rcard/
• Attendance Rate • Graduation Rate • Dropout Rate • School Violence • Assessments
o Reading o Mathematics o Writing
• Graduates Passing Adv. Science Courses • Graduates Passing Adv. Math Courses

USD# 492
Summary of Total Expenditures By Function (All Funds)
% % % % %
2011-2012 of 2012-2013 of inc/ 2013-2014 of inc/
Actual Tot Actual Tot dec Budget Tot dec
Instruction 2,117,825 56% 2,169,083 56% 2% 2,298,986 50% 6%
Student Support Services 123,543 3% 141,372 4% 14% 271,500 6% 92%
Instructional Support Services 21,850 1% 28,553 1% 31% 77,000 2% 170%
General Administration 202,825 5% 221,076 6% 9% 216,080 5% -2%
School Administration (Building) 143,996 4% 148,691 4% 3% 243,838 5% 64%
Operations & Maintenance 465,995 12% 386,417 10% -17% 294,808 6% -24%
Transportation 212,761 6% 302,663 8% 42% 485,228 11% 60%
Food Services 155,116 4% 161,214 4% 4% 181,722 4% 13%
Capital Improvements 57,980 2% 28,703 1% -50% 175,000 4% 510%
Debt Services 306,920 8% 311,545 8% 2% 315,708 7% 1%
Other Costs 0 0% 0 0% 0% 0 0% 0%
Total Expenditures* 3,808,811 100% 3,899,317 100% 2% 4,559,870 100% 17%
Amount per Pupil $14,649 $13,218 -10% $15,457 17%
Current Expenditures** 3,415,901 100% 3,527,950 100% 3% 3,751,162 100% 6%
Amount per Pupil $13,138 $11,959 -9% $12,716 6%
Instruction*** (Total Expenditures) 2,117,825 56% 2,169,083 56% 0% 2,298,986 50% -6%
Instruction*** (Current Expenditures) 2,117,825 62% 2,169,083 61% -1% 2,298,986 61% 0%
Note: Percentages on charts are within +-1% due to rounding used. Pie graph percentages may differ from charts for this reason also.
Further definition of what goes into each category:
Instruction - 1000 Transportation - 2700
Student Support Services - 2100 Food Service - 3100
Instructional Support Services - 2200 Other Costs - 2500/2900 and 3300
General Administration - 2300 Capital Improvements - 4000
School Administration (Building) - 2400 Debt Services - 5100
Operations & Maintenance - 2600 Transfers - 5200
Percent of Expenditures
* The funds that are included in the categories above are: General, Supplemental General, Bilingual Education, At Risk(4yr Old), At Risk(K-12), Virtual Education, Capital
Outlay, Driver Education, Extraordinary School Program, Summer School, Special Education, Vocational Education, Professional Development, Bond & Interest #1, Bond &
Interest #2, No-Fund Warrant, Special Assessment, Parent Education, School Retirement, Student Materials Revolving & Textbook Rental, Tuition Reimbursement,
Gifts/Grants, KPERS Special Retirement Contribution, Contingency, Special Liability Expense, Federal Funds, Adult Education, Adult Supplemental Education, Activity Fund
and Special Education Coop Fund.
*** Instruction excludes Capital Outlay and Bond Debt expenditures (Code 16, Code 62, Code 63)
** Current Spending excludes Capital Outlay and Bond Debt expenditures (Code 16, Code 62, Code 63)
0
500,000
1,000,000
1,500,000
2,000,000
2,500,000 2,298,986
271,500 77,000
216,080 243,838 294,808 485,228
181,722 175,000 315,708
0
Summary of Total Expenditures by Function (All Funds)
2011-2012
2012-2013
2013-2014
Instruction 50%
Student Support Services
6%
Instructional Support 2%
General Administration 5%
School Administration (Building)
5%
Operations & Maintenance 6%
Transportation 11%
Food Services 4%
Capital Improvements 4%
Debt Services 7%
2013-14 Summary of Total Expenditures by Function
Instruction
Student Support Services
Instructional Support
General Administration
School Administration (Building)
Operations & Maintenance
Transportation
Food Services
Capital Improvements
Debt Services
Other Costs
9/17/2013 3:27 PM Sumexpen.xlsx Page 1 of 24

USD# 492
Summary of General Fund Expenditures
by Function
% % % % %
2011-2012 of 2012-2013 of inc/ 2013-2014 of inc/
Actual Tot Actual Tot dec Budget Tot dec
Instruction 1,257,772 64% 1,260,857 64% 0% 1,277,747 62% 1%
Student Support 5,324 0% 10,122 1% 90% 5,000 0% -51%
Instructional Support 0 0% 0 0% 0% 0 0% 0%
General Administration 174,977 9% 190,758 10% 9% 179,080 9% -6%
School Administration (Building) 132,215 7% 135,754 7% 3% 229,838 11% 69%
Operations & Maintenance 215,046 11% 212,813 11% -1% 238,308 12% 12%
Transportation 169,772 9% 155,321 8% -9% 140,104 7% -10%
Capital Improvements 0 0% 0 0% 0% 0 0% 0%
Other Costs 0 0% 0 0% 0% 0 0% 0%
Total Expenditures 1,955,106 100% 1,965,625 100% 1% 2,070,077 100% 5%
Amount per Pupil $7,520 $6,663 -11% $7,017 5%
The Summary of General Fund Expenditures chart information comes from pages 6-13 and only uses the 'General Fund' line items.
0
200,000
400,000
600,000
800,000
1,000,000
1,200,000
1,400,000 1,277,747
5,000 0
179,080 229,838 238,308
140,104
0 0
Summary of General Fund Expenditures
2011-2012
2012-2013
2013-2014
Instruction 62%
General Administration 9%
School Administration (Building)
11%
Operations & Maintenance 11%
Transportation 7%
2013-14 Summary of General Fund Expenditures by Function
Instruction
Student Support
Instructional Support
General Administration
School Administration (Building)
Operations & Maintenance
Transportation
Capital Improvements
Other Costs
9/17/2013 3:27 PM Sumexpen.xlsx Page 2 of 24

USD# 492
Summary of Supplemental General Fund Expenditures
by Function
% % % % %
2011-2012 of 2012-2013 of inc/ 2013-2014 of inc/
Actual Tot Actual Tot dec Budget Tot dec
Instruction 125,700 25% 84,842 17% -33% 110,000 23% 30%
Student Support 115,350 23% 126,020 25% 9% 145,000 31% 15%
Instructional Support 12,006 2% 11,128 2% -7% 35,000 7% 215%
General Administration 10,413 2% 17,393 3% 67% 20,000 4% 15%
School Administration (Building) 0 0% 0 0% 0% 0 0% 0%
Operations & Maintenance 220,766 45% 165,799 33% -25% 50,000 11% -70%
Transportation 11,186 2% 92,943 19% 731% 115,000 24% 24%
Capital Improvements 0 0% 0 0% 0% 0 0% 0%
Other Costs 0 0% 0 0% 0% 0 0% 0%
Total Expenditures 495,421 100% 498,125 100% 1% 475,000 100% -5%
Amount per Pupil $1,905 $1,689 -11% $1,610 -5%
The Summary of Supplemental General Fund Expenditures chart information comes from pages 6-13 and only uses the 'Supplemental
General Fund' line items.
0
50,000
100,000
150,000
200,000
250,000
110,000
145,000
35,000
20,000
0
50,000
115,000
0 0
Summary of Supplemental General Expenditures by Function
2011-2012
2012-2013
2013-2014
Instruction 23%
Student Support 31%
Instructional Support 7%
General Administration 4%
Operations & Maintenance 11%
Transportation 24%
2013-14 Summary of Supplemental General Fund Expenditures by Function
Instruction
Student Support
Instructional Support
General Administration
School Administration (Building)
Operations & Maintenance
Transportation
Capital Improvements
Other Costs
9/17/2013 3:27 PM Sumexpen.xlsx Page 3 of 24

USD# 492
Summary of General and Supplemental General Fund
Expenditures by Function
% % % % %
2011-2012 of 2012-2013 of inc/ 2013-2014 of inc/
Actual Tot Actual Tot dec Budget Tot dec
Instruction 1,383,472 56% 1,345,699 55% -3% 1,387,747 55% 3%
Student Support 120,674 5% 136,142 6% 13% 150,000 6% 10%
Instructional Support 12,006 0% 11,128 0% -7% 35,000 1% 215%
General Administration 185,390 8% 208,151 8% 12% 199,080 8% -4%
School Administration (Building) 132,215 5% 135,754 6% 3% 229,838 9% 69%
Operations & Maintenance 435,812 18% 378,612 15% -13% 288,308 11% -24%
Transportation 180,958 7% 248,264 10% 37% 255,104 10% 3%
Capital Improvements 0 0% 0 0% 0% 0 0% 0%
Other Costs 0 0% 0 0% 0% 0 0% 0%
Total Expenditures 2,450,527 100% 2,463,750 100% 1% 2,545,077 100% 3%
Amount per Pupil $9,425 $8,352 -11% $8,627 3%
The Summary of General and Supplemental General Fund Expenditures chart information comes from pages 6-13 and adds together
the 'General Fund' and 'Supplemental General Fund' line items.
0
200,000
400,000
600,000
800,000
1,000,000
1,200,000
1,400,0001,387,747
150,000 35,000
199,080 229,838 288,308 255,104
0 0
Summary of General and Supplemental General Fund Expenditures by Function
2011-2012
2012-2013
2013-2014
Instruction 55%
Student Support 6%
Instructional Support 1%
General Administration 8%
School Administration (Building)
9%
Operations & Maintenance 11%
Transportation 10%
2013-14 Summary of General and Supplemental General Fund Expenditures by Function
Instruction
Student Support
Instructional Support
General Administration
School Administration (Building)
Operations & Maintenance
Transportation
Capital Improvements
Other Costs
9/17/2013 3:27 PM Sumexpen.xlsx Page 4 of 24

USD# 492
Summary of Special Education Fund
by Function
% % % % %
2011-2012 of 2012-2013 of inc/ 2013-2014 of inc/
Actual Tot Actual Tot dec Budget Tot dec
Instruction 387,524 94% 408,179 95% 5% 464,900 95% 14%
Student Support 0 0% 0 0% 0% 0 0% 0%
Instructional Support 0 0% 0 0% 0% 0 0% 0%
General Administration 0 0% 0 0% 0% 0 0% 0%
School Administration (Building) 0 0% 0 0% 0% 0 0% 0%
Operations & Maintenance 0 0% 0 0% 0% 0 0% 0%
Transportation 25,246 6% 19,497 5% -23% 23,578 5% 21%
Capital Improvements 0 0% 0 0% 0% 0 0% 0%
Other Costs 0 0% 0 0% 0% 0 0% 0%
Total Expenditures 412,770 100% 427,676 100% 4% 488,478 100% 14%
Amount per Pupil $1,588 $1,450 -9% $1,656 14%
The Summary of Special Education Fund Expenditures chart information comes from pages 6-13 and only uses the 'Special Education Fund'
line items. (Total expenditures excludes Special Ed Coop Fund because it would include expenditures for all schools participating in the Coop.)
0
50,000
100,000
150,000
200,000
250,000
300,000
350,000
400,000
450,000
500,000
38
7,5
24
0
0
0
0
0
25
,24
6
0
0
40
8,1
79
0
0
0
0
0 1
9,4
97
0
0
46
4,9
00
0
0
0
0
0 2
3,5
78
0
0
Summary of Special Education Fund Expenditures by Function
2011-2012
2012-2013
2013-2014
Instruction 95%
Transportation 5%
2013-14 Summary of Special Education Fund by Function
Instruction
Student Support
Instructional Support
General Administration
School Administration (Building)
Operations & Maintenance
Transportation
Capital Improvements
Other Costs
9/17/2013 3:27 PM Sumexpen.xlsx Page 5 of 24
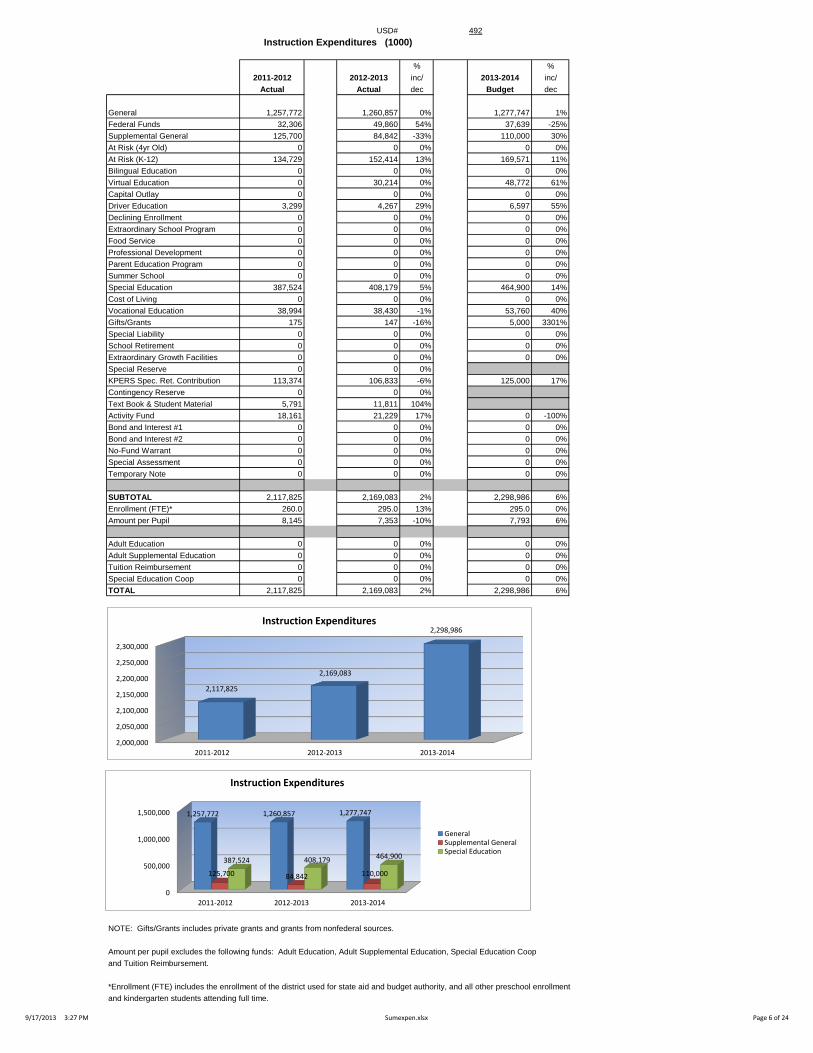
USD# 492
Instruction Expenditures (1000)
% %
2011-2012 2012-2013 inc/ 2013-2014 inc/
Actual Actual dec Budget dec
General 1,257,772 1,260,857 0% 1,277,747 1%
Federal Funds 32,306 49,860 54% 37,639 -25%
Supplemental General 125,700 84,842 -33% 110,000 30%
At Risk (4yr Old) 0 0 0% 0 0%
At Risk (K-12) 134,729 152,414 13% 169,571 11%
Bilingual Education 0 0 0% 0 0%
Virtual Education 0 30,214 0% 48,772 61%
Capital Outlay 0 0 0% 0 0%
Driver Education 3,299 4,267 29% 6,597 55%
Declining Enrollment 0 0 0% 0 0%
Extraordinary School Program 0 0 0% 0 0%
Food Service 0 0 0% 0 0%
Professional Development 0 0 0% 0 0%
Parent Education Program 0 0 0% 0 0%
Summer School 0 0 0% 0 0%
Special Education 387,524 408,179 5% 464,900 14%
Cost of Living 0 0 0% 0 0%
Vocational Education 38,994 38,430 -1% 53,760 40%
Gifts/Grants 175 147 -16% 5,000 3301%
Special Liability 0 0 0% 0 0%
School Retirement 0 0 0% 0 0%
Extraordinary Growth Facilities 0 0 0% 0 0%
Special Reserve 0 0 0%
KPERS Spec. Ret. Contribution 113,374 106,833 -6% 125,000 17%
Contingency Reserve 0 0 0%
Text Book & Student Material 5,791 11,811 104%
Activity Fund 18,161 21,229 17% 0 -100%
Bond and Interest #1 0 0 0% 0 0%
Bond and Interest #2 0 0 0% 0 0%
No-Fund Warrant 0 0 0% 0 0%
Special Assessment 0 0 0% 0 0%
Temporary Note 0 0 0% 0 0%
SUBTOTAL 2,117,825 2,169,083 2% 2,298,986 6%
Enrollment (FTE)* 260.0 295.0 13% 295.0 0%
Amount per Pupil 8,145 7,353 -10% 7,793 6%
Adult Education 0 0 0% 0 0%
Adult Supplemental Education 0 0 0% 0 0%
Tuition Reimbursement 0 0 0% 0 0%
Special Education Coop 0 0 0% 0 0%
TOTAL 2,117,825 2,169,083 2% 2,298,986 6%
NOTE: Gifts/Grants includes private grants and grants from nonfederal sources.
Amount per pupil excludes the following funds: Adult Education, Adult Supplemental Education, Special Education Coop
and Tuition Reimbursement.
*Enrollment (FTE) includes the enrollment of the district used for state aid and budget authority, and all other preschool enrollment
and kindergarten students attending full time.
0
500,000
1,000,000
1,500,000
2011-2012 2012-2013 2013-2014
1,257,772 1,260,857 1,277,747
125,700 84,842 110,000
387,524 408,179 464,900
Instruction Expenditures
GeneralSupplemental GeneralSpecial Education
2,000,000
2,050,000
2,100,000
2,150,000
2,200,000
2,250,000
2,300,000
2011-2012 2012-2013 2013-2014
2,117,825
2,169,083
2,298,986 Instruction Expenditures
9/17/2013 3:27 PM Sumexpen.xlsx Page 6 of 24

USD# 492
Student Support Expenditures (2100)
% %
2011-2012 2012-2013 inc/ 2013-2014 inc/
Actual Actual dec Budget dec
General 5,324 10,122 90% 5,000 -51%
Federal Funds 0 0 0% 0 0%
Supplemental General 115,350 126,020 9% 145,000 15%
At Risk (4yr Old) 0 0 0% 0 0%
At Risk (K-12) 0 0 0% 0 0%
Bilingual Education 0 0 0% 0 0%
Virtual Education 0 0 0% 0 0%
Capital Outlay 0 2,730 0% 115,000 4112%
Driver Training 0 0 0% 0 0%
Declining Enrollment 0 0 0% 0 0%
Extraordinary School Program 0 0 0% 0 0%
Food Service 0 0 0% 0 0%
Professional Development 0 0 0% 0 0%
Parent Education Program 0 0 0% 0 0%
Summer School 0 0 0% 0 0%
Special Education 0 0 0% 0 0%
Cost of Living 0 0 0% 0 0%
Vocational Education 0 0 0% 0 0%
Gifts/Grants 0 0 0% 0 0%
Special Liability 0 0 0% 0 0%
School Retirement 0 0 0% 0 0%
Extraordinary Growth Facilities 0 0 0% 0 0%
Special Reserve 0 0 0%
KPERS Spec. Ret. Contribution 2,869 2,500 -13% 6,500 160%
Contingency Reserve 0 0 0%
Text Book & Student Material 0 0 0%
Activity Fund 0 0 0% 0 0%
Bond and Interest #1 0 0 0% 0 0%
Bond and Interest #2 0 0 0% 0 0%
No-Fund Warrant 0 0 0% 0 0%
Special Assessment 0 0 0% 0 0%
Temporary Note 0 0 0% 0 0%
SUBTOTAL 123,543 141,372 14% 271,500 92%
Enrollment (FTE)* 260.0 295.0 13% 295.0 0%
Amount per Pupil 475 479 1% 920 92%
Adult Education 0 0 0% 0 0%
Adult Supplemental Education 0 0 0% 0 0%
Tuition Reimbursement 0 0 0% 0 0%
Special Education Coop 0 0 0% 0 0%
TOTAL 123,543 141,372 14% 271,500 92%
Amount per Pupil $481 $554 15% $920 66%
NOTE: Gifts/Grants includes private grants and grants from nonfederal sources.
Amount per pupil excludes the following funds: Adult Education, Adult Supplemental Education, Special Education Coop
and Tuition Reimbursement.
*Enrollment (FTE) includes the enrollment of the district used for state aid and budget authority, and all other preschool enrollment
and kindergarten students attending full time.
0
50,000
100,000
150,000
200,000
250,000
300,000
2011-2012 2012-2013 2013-2014
123,543 141,372
271,500
Student Support Expenditures
9/17/2013 3:27 PM Sumexpen.xlsx Page 7 of 24
USD# 492
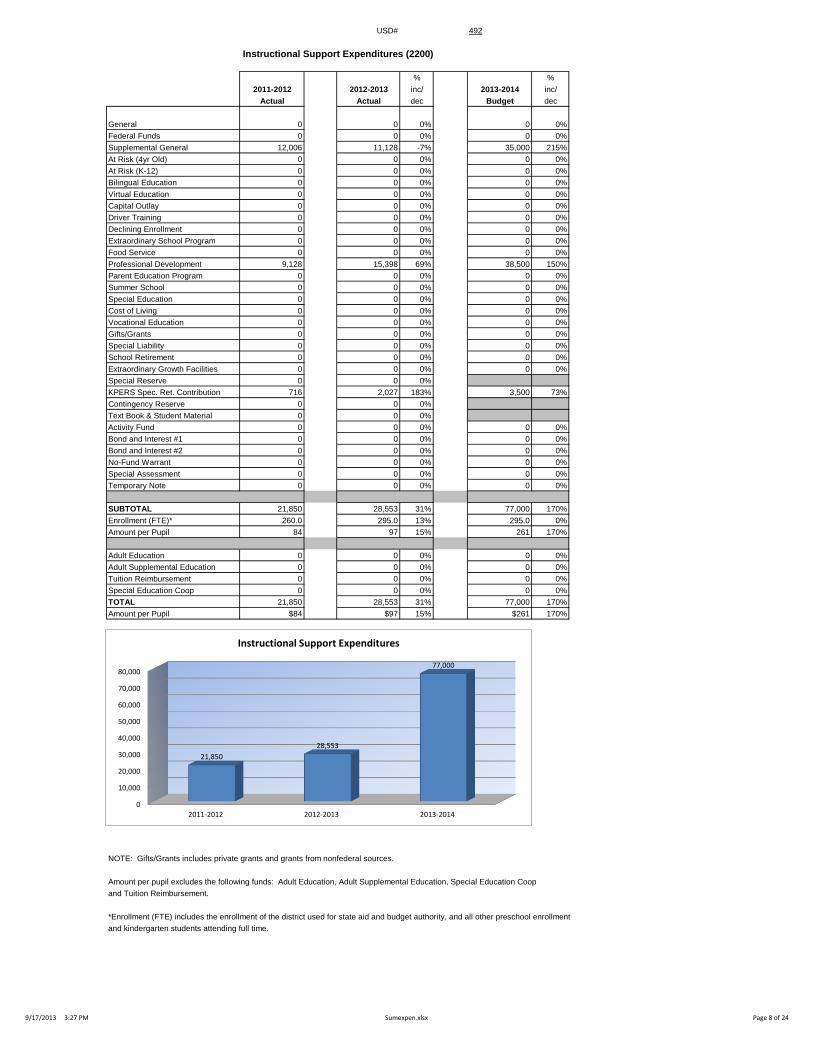
Instructional Support Expenditures (2200)
% %
2011-2012 2012-2013 inc/ 2013-2014 inc/
Actual Actual dec Budget dec
General 0 0 0% 0 0%
Federal Funds 0 0 0% 0 0%
Supplemental General 12,006 11,128 -7% 35,000 215%
At Risk (4yr Old) 0 0 0% 0 0%
At Risk (K-12) 0 0 0% 0 0%
Bilingual Education 0 0 0% 0 0%
Virtual Education 0 0 0% 0 0%
Capital Outlay 0 0 0% 0 0%
Driver Training 0 0 0% 0 0%
Declining Enrollment 0 0 0% 0 0%
Extraordinary School Program 0 0 0% 0 0%
Food Service 0 0 0% 0 0%
Professional Development 9,128 15,398 69% 38,500 150%
Parent Education Program 0 0 0% 0 0%
Summer School 0 0 0% 0 0%
Special Education 0 0 0% 0 0%
Cost of Living 0 0 0% 0 0%
Vocational Education 0 0 0% 0 0%
Gifts/Grants 0 0 0% 0 0%
Special Liability 0 0 0% 0 0%
School Retirement 0 0 0% 0 0%
Extraordinary Growth Facilities 0 0 0% 0 0%
Special Reserve 0 0 0%
KPERS Spec. Ret. Contribution 716 2,027 183% 3,500 73%
Contingency Reserve 0 0 0%
Text Book & Student Material 0 0 0%
Activity Fund 0 0 0% 0 0%
Bond and Interest #1 0 0 0% 0 0%
Bond and Interest #2 0 0 0% 0 0%
No-Fund Warrant 0 0 0% 0 0%
Special Assessment 0 0 0% 0 0%
Temporary Note 0 0 0% 0 0%
SUBTOTAL 21,850 28,553 31% 77,000 170%
Enrollment (FTE)* 260.0 295.0 13% 295.0 0%
Amount per Pupil 84 97 15% 261 170%
Adult Education 0 0 0% 0 0%
Adult Supplemental Education 0 0 0% 0 0%
Tuition Reimbursement 0 0 0% 0 0%
Special Education Coop 0 0 0% 0 0%
TOTAL 21,850 28,553 31% 77,000 170%
Amount per Pupil $84 $97 15% $261 170%
NOTE: Gifts/Grants includes private grants and grants from nonfederal sources.
Amount per pupil excludes the following funds: Adult Education, Adult Supplemental Education, Special Education Coop
and Tuition Reimbursement.
*Enrollment (FTE) includes the enrollment of the district used for state aid and budget authority, and all other preschool enrollment
and kindergarten students attending full time.
0
10,000
20,000
30,000
40,000
50,000
60,000
70,000
80,000
2011-2012 2012-2013 2013-2014
21,850
28,553
77,000
Instructional Support Expenditures
9/17/2013 3:27 PM Sumexpen.xlsx Page 8 of 24

USD# 492
General Administration Expenditures (2300)
% %
2011-2012 2012-2013 inc/ 2013-2014 inc/
Actual Actual dec Budget dec
General 174,977 190,758 9% 179,080 -6%
Federal Funds 0 0 0% 0 0%
Supplemental General 10,413 17,393 67% 20,000 15%
At Risk (4yr Old) 0 0 0% 0 0%
At Risk (K-12) 0 0 0% 0 0%
Bilingual Education 0 0 0% 0 0%
Virtual Education 0 0 0% 0 0%
Capital Outlay 0 0 0% 0 0%
Driver Training 0 0 0% 0 0%
Declining Enrollment 0 0 0% 0 0%
Extraordinary School Program 0 0 0% 0 0%
Food Service 0 0 0% 0 0%
Professional Development 0 0 0% 0 0%
Parent Education Program 0 0 0% 0 0%
Summer School 0 0 0% 0 0%
Special Education 0 0 0% 0 0%
Cost of Living 0 0 0% 0 0%
Vocational Education 0 0 0% 0 0%
Gifts/Grants 0 0 0% 0 0%
Special Liability Expense 0 0 0% 0 0%
School Retirement 0 0 0% 0 0%
Extraordinary Growth Facilities 0 0 0% 0 0%
Special Reserve 0 0 0%
KPERS Spec. Ret. Contribution 17,435 12,925 -26% 17,000 32%
Contingency Reserve 0 0 0%
Text Book & Student Material 0 0 0%
Activity Fund 0 0 0% 0 0%
Bond and Interest #1 0 0 0% 0 0%
Bond and Interest #2 0 0 0% 0 0%
No-Fund Warrant 0 0 0% 0 0%
Special Assessment 0 0 0% 0 0%
Temporary Note 0 0 0% 0 0%
SUBTOTAL 202,825 221,076 9% 216,080 -2%
Enrollment (FTE)* 260.0 295.0 13% 295.0 0%
Amount per Pupil 780 749 -4% 732 -2%
Adult Education 0 0 0% 0 0%
Adult Supplemental Education 0 0 0% 0 0%
Tuition Reimbursement 0 0 0% 0 0%
Special Education Coop 0 0 0% 0 0%
TOTAL 202,825 221,076 9% 216,080 -2%
NOTE: Gifts/Grants includes private grants and grants from nonfederal sources.
Amount per pupil excludes the following funds: Adult Education, Adult Supplemental Education, Special Education Coop
and Tuition Reimbursement.
*Enrollment (FTE) includes the enrollment of the district used for state aid and budget authority, and all other preschool enrollment
and kindergarten students attending full time.
190,000
195,000
200,000
205,000
210,000
215,000
220,000
225,000
2011-2012 2012-2013 2013-2014
202,825
221,076
216,080
General Administration Expenditures
9/17/2013 3:27 PM Sumexpen.xlsx Page 9 of 24
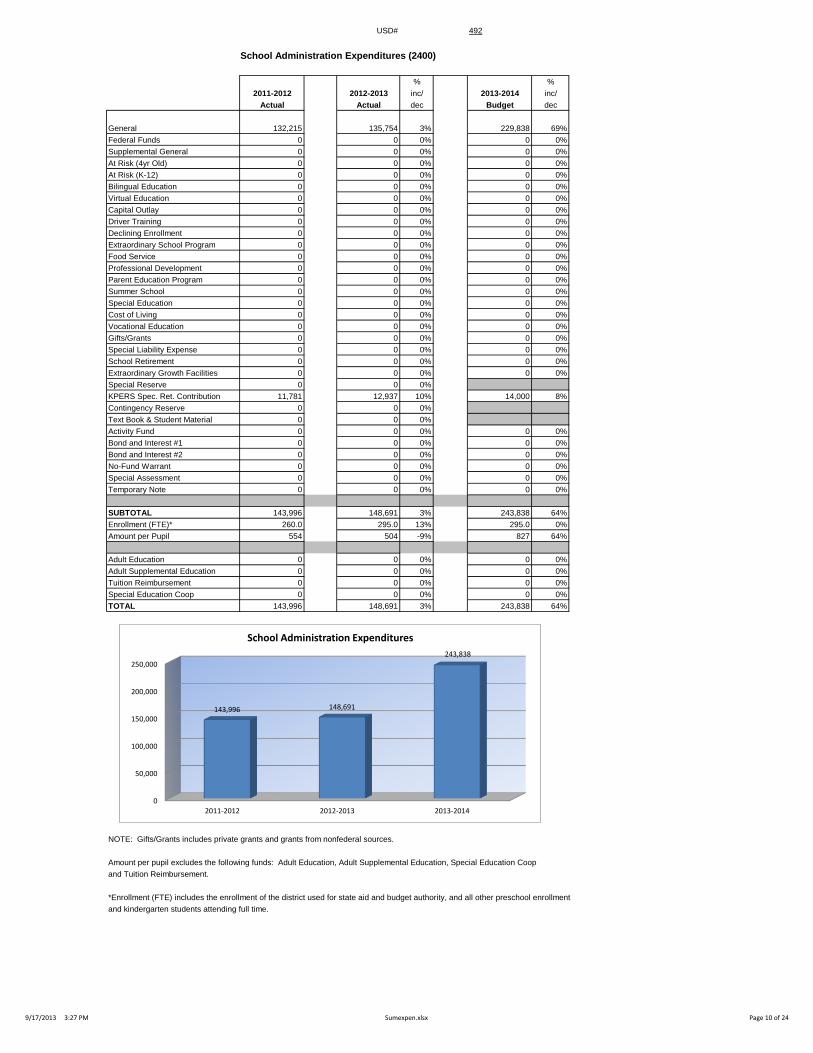
USD# 492
School Administration Expenditures (2400)
% %
2011-2012 2012-2013 inc/ 2013-2014 inc/
Actual Actual dec Budget dec
General 132,215 135,754 3% 229,838 69%
Federal Funds 0 0 0% 0 0%
Supplemental General 0 0 0% 0 0%
At Risk (4yr Old) 0 0 0% 0 0%
At Risk (K-12) 0 0 0% 0 0%
Bilingual Education 0 0 0% 0 0%
Virtual Education 0 0 0% 0 0%
Capital Outlay 0 0 0% 0 0%
Driver Training 0 0 0% 0 0%
Declining Enrollment 0 0 0% 0 0%
Extraordinary School Program 0 0 0% 0 0%
Food Service 0 0 0% 0 0%
Professional Development 0 0 0% 0 0%
Parent Education Program 0 0 0% 0 0%
Summer School 0 0 0% 0 0%
Special Education 0 0 0% 0 0%
Cost of Living 0 0 0% 0 0%
Vocational Education 0 0 0% 0 0%
Gifts/Grants 0 0 0% 0 0%
Special Liability Expense 0 0 0% 0 0%
School Retirement 0 0 0% 0 0%
Extraordinary Growth Facilities 0 0 0% 0 0%
Special Reserve 0 0 0%
KPERS Spec. Ret. Contribution 11,781 12,937 10% 14,000 8%
Contingency Reserve 0 0 0%
Text Book & Student Material 0 0 0%
Activity Fund 0 0 0% 0 0%
Bond and Interest #1 0 0 0% 0 0%
Bond and Interest #2 0 0 0% 0 0%
No-Fund Warrant 0 0 0% 0 0%
Special Assessment 0 0 0% 0 0%
Temporary Note 0 0 0% 0 0%
SUBTOTAL 143,996 148,691 3% 243,838 64%
Enrollment (FTE)* 260.0 295.0 13% 295.0 0%
Amount per Pupil 554 504 -9% 827 64%
Adult Education 0 0 0% 0 0%
Adult Supplemental Education 0 0 0% 0 0%
Tuition Reimbursement 0 0 0% 0 0%
Special Education Coop 0 0 0% 0 0%
TOTAL 143,996 148,691 3% 243,838 64%
NOTE: Gifts/Grants includes private grants and grants from nonfederal sources.
Amount per pupil excludes the following funds: Adult Education, Adult Supplemental Education, Special Education Coop
and Tuition Reimbursement.
*Enrollment (FTE) includes the enrollment of the district used for state aid and budget authority, and all other preschool enrollment
and kindergarten students attending full time.
0
50,000
100,000
150,000
200,000
250,000
2011-2012 2012-2013 2013-2014
143,996 148,691
243,838
School Administration Expenditures
9/17/2013 3:27 PM Sumexpen.xlsx Page 10 of 24
USD# 492
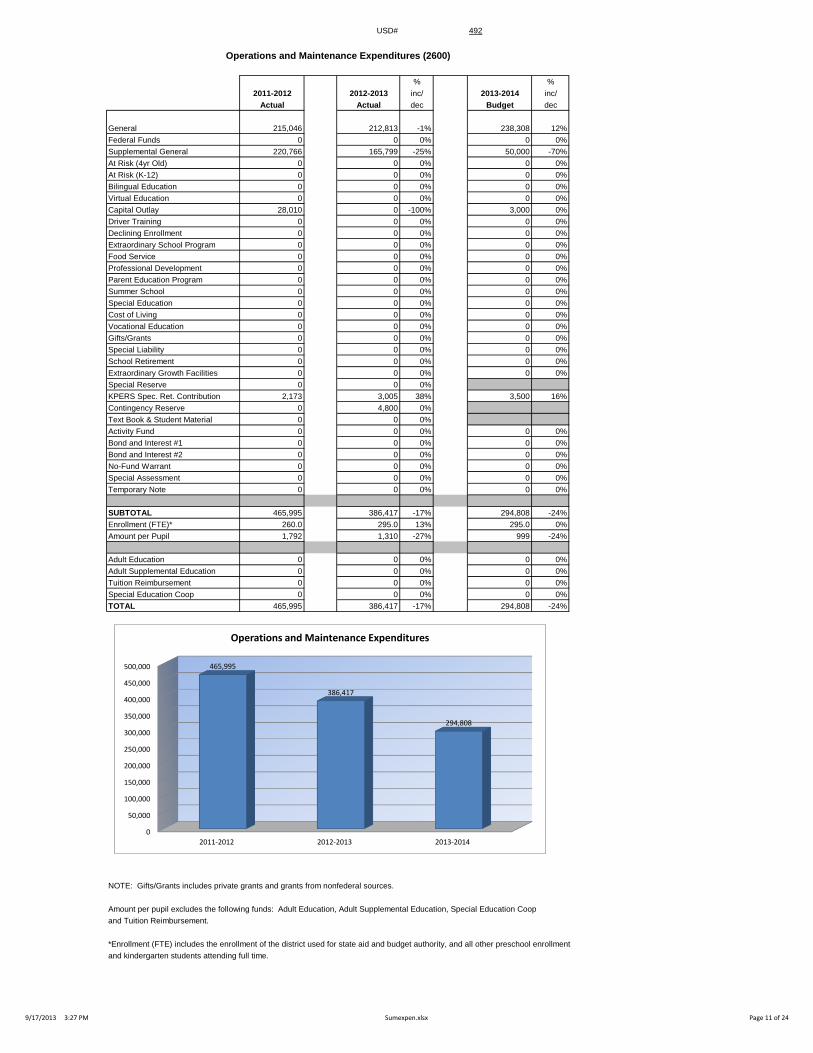
Operations and Maintenance Expenditures (2600)
% %
2011-2012 2012-2013 inc/ 2013-2014 inc/
Actual Actual dec Budget dec
General 215,046 212,813 -1% 238,308 12%
Federal Funds 0 0 0% 0 0%
Supplemental General 220,766 165,799 -25% 50,000 -70%
At Risk (4yr Old) 0 0 0% 0 0%
At Risk (K-12) 0 0 0% 0 0%
Bilingual Education 0 0 0% 0 0%
Virtual Education 0 0 0% 0 0%
Capital Outlay 28,010 0 -100% 3,000 0%
Driver Training 0 0 0% 0 0%
Declining Enrollment 0 0 0% 0 0%
Extraordinary School Program 0 0 0% 0 0%
Food Service 0 0 0% 0 0%
Professional Development 0 0 0% 0 0%
Parent Education Program 0 0 0% 0 0%
Summer School 0 0 0% 0 0%
Special Education 0 0 0% 0 0%
Cost of Living 0 0 0% 0 0%
Vocational Education 0 0 0% 0 0%
Gifts/Grants 0 0 0% 0 0%
Special Liability 0 0 0% 0 0%
School Retirement 0 0 0% 0 0%
Extraordinary Growth Facilities 0 0 0% 0 0%
Special Reserve 0 0 0%
KPERS Spec. Ret. Contribution 2,173 3,005 38% 3,500 16%
Contingency Reserve 0 4,800 0%
Text Book & Student Material 0 0 0%
Activity Fund 0 0 0% 0 0%
Bond and Interest #1 0 0 0% 0 0%
Bond and Interest #2 0 0 0% 0 0%
No-Fund Warrant 0 0 0% 0 0%
Special Assessment 0 0 0% 0 0%
Temporary Note 0 0 0% 0 0%
SUBTOTAL 465,995 386,417 -17% 294,808 -24%
Enrollment (FTE)* 260.0 295.0 13% 295.0 0%
Amount per Pupil 1,792 1,310 -27% 999 -24%
Adult Education 0 0 0% 0 0%
Adult Supplemental Education 0 0 0% 0 0%
Tuition Reimbursement 0 0 0% 0 0%
Special Education Coop 0 0 0% 0 0%
TOTAL 465,995 386,417 -17% 294,808 -24%
NOTE: Gifts/Grants includes private grants and grants from nonfederal sources.
Amount per pupil excludes the following funds: Adult Education, Adult Supplemental Education, Special Education Coop
and Tuition Reimbursement.
*Enrollment (FTE) includes the enrollment of the district used for state aid and budget authority, and all other preschool enrollment
and kindergarten students attending full time.
0
50,000
100,000
150,000
200,000
250,000
300,000
350,000
400,000
450,000
500,000
2011-2012 2012-2013 2013-2014
465,995
386,417
294,808
Operations and Maintenance Expenditures
9/17/2013 3:27 PM Sumexpen.xlsx Page 11 of 24
USD# 492
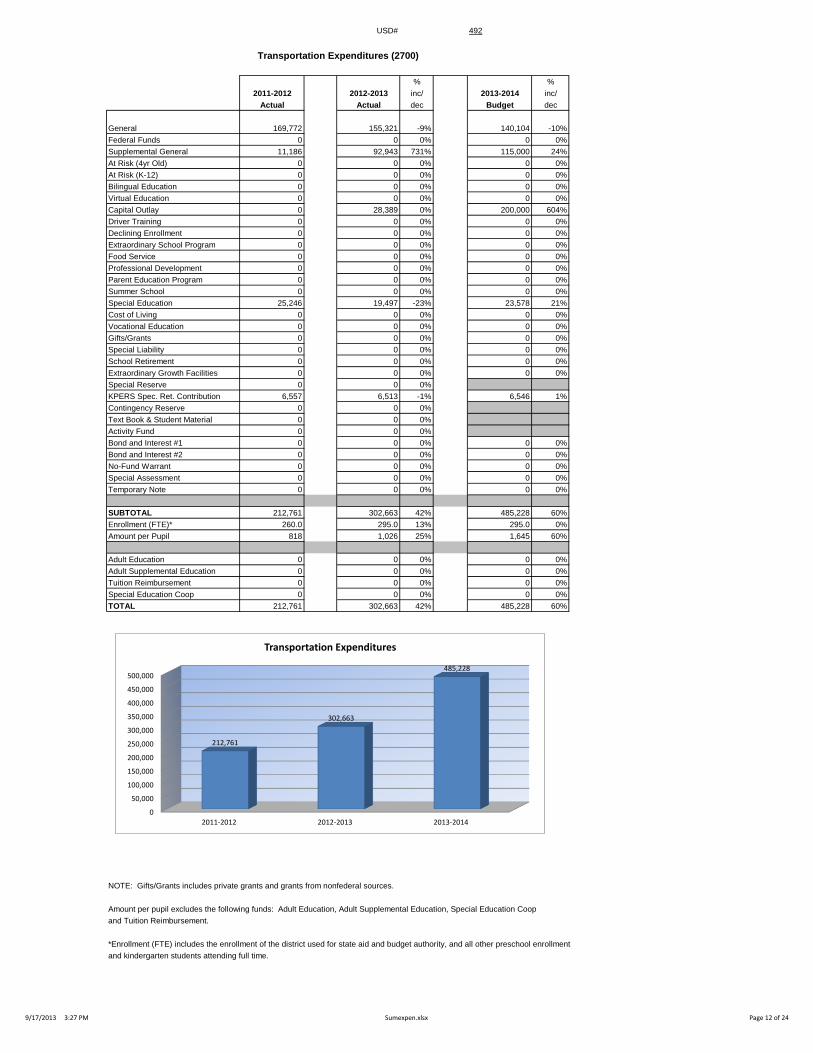
Transportation Expenditures (2700)
% %
2011-2012 2012-2013 inc/ 2013-2014 inc/
Actual Actual dec Budget dec
General 169,772 155,321 -9% 140,104 -10%
Federal Funds 0 0 0% 0 0%
Supplemental General 11,186 92,943 731% 115,000 24%
At Risk (4yr Old) 0 0 0% 0 0%
At Risk (K-12) 0 0 0% 0 0%
Bilingual Education 0 0 0% 0 0%
Virtual Education 0 0 0% 0 0%
Capital Outlay 0 28,389 0% 200,000 604%
Driver Training 0 0 0% 0 0%
Declining Enrollment 0 0 0% 0 0%
Extraordinary School Program 0 0 0% 0 0%
Food Service 0 0 0% 0 0%
Professional Development 0 0 0% 0 0%
Parent Education Program 0 0 0% 0 0%
Summer School 0 0 0% 0 0%
Special Education 25,246 19,497 -23% 23,578 21%
Cost of Living 0 0 0% 0 0%
Vocational Education 0 0 0% 0 0%
Gifts/Grants 0 0 0% 0 0%
Special Liability 0 0 0% 0 0%
School Retirement 0 0 0% 0 0%
Extraordinary Growth Facilities 0 0 0% 0 0%
Special Reserve 0 0 0%
KPERS Spec. Ret. Contribution 6,557 6,513 -1% 6,546 1%
Contingency Reserve 0 0 0%
Text Book & Student Material 0 0 0%
Activity Fund 0 0 0%
Bond and Interest #1 0 0 0% 0 0%
Bond and Interest #2 0 0 0% 0 0%
No-Fund Warrant 0 0 0% 0 0%
Special Assessment 0 0 0% 0 0%
Temporary Note 0 0 0% 0 0%
SUBTOTAL 212,761 302,663 42% 485,228 60%
Enrollment (FTE)* 260.0 295.0 13% 295.0 0%
Amount per Pupil 818 1,026 25% 1,645 60%
Adult Education 0 0 0% 0 0%
Adult Supplemental Education 0 0 0% 0 0%
Tuition Reimbursement 0 0 0% 0 0%
Special Education Coop 0 0 0% 0 0%
TOTAL 212,761 302,663 42% 485,228 60%
NOTE: Gifts/Grants includes private grants and grants from nonfederal sources.
Amount per pupil excludes the following funds: Adult Education, Adult Supplemental Education, Special Education Coop
and Tuition Reimbursement.
*Enrollment (FTE) includes the enrollment of the district used for state aid and budget authority, and all other preschool enrollment
and kindergarten students attending full time.
0
50,000
100,000
150,000
200,000
250,000
300,000
350,000
400,000
450,000
500,000
2011-2012 2012-2013 2013-2014
212,761
302,663
485,228
Transportation Expenditures
9/17/2013 3:27 PM Sumexpen.xlsx Page 12 of 24

USD# 492
Food Services Expenditures (3100)
% %
2011-2012 2012-2013 inc/ 2013-2014 inc/
Actual Actual dec Budget dec
General 0 0 0% 0 0%
Federal Funds 0 0 0% 0 0%
Supplemental General 0 0 0% 0 0%
At Risk (4yr Old) 0 0 0% 0 0%
At Risk (K-12) 0 0 0% 0 0%
Bilingual Education 0 0 0% 0 0%
Virtual Education 0 0 0% 0 0%
Capital Outlay 0 0 0% 0 0%
Driver Training 0 0 0% 0 0%
Declining Enrollment 0 0 0% 0 0%
Extraordinary School Program 0 0 0% 0 0%
Food Service 151,087 157,499 4% 177,222 13%
Professional Development 0 0 0% 0 0%
Parent Education Program 0 0 0% 0 0%
Summer School 0 0 0% 0 0%
Special Education 0 0 0% 0 0%
Cost of Living 0 0 0% 0 0%
Vocational Education 0 0 0% 0 0%
Gifts/Grants 0 0 0% 0 0%
Special Liability 0 0 0% 0 0%
School Retirement 0 0 0% 0 0%
Extraordinary Growth Facilities 0 0 0% 0 0%
Special Reserve 0 0 0%
KPERS Spec. Ret. Contribution 4,029 3,715 -8% 4,500 21%
Contingency Reserve 0 0 0%
Text Book & Student Material 0 0 0%
Activity Fund 0 0 0%
Bond and Interest #1 0 0 0% 0 0%
Bond and Interest #2 0 0 0% 0 0%
No-Fund Warrant 0 0 0% 0 0%
Special Assessment 0 0 0% 0 0%
Temporary Note 0 0 0% 0 0%
SUBTOTAL 155,116 161,214 4% 181,722 13%
Enrollment (FTE)* 260.0 295.0 13% 295.0 0%
Amount per Pupil 597 546 -8% 616 13%
Adult Education 0 0 0% 0 0%
Adult Supplemental Education 0 0 0% 0 0%
Tuition Reimbursement 0 0 0% 0 0%
Special Education Coop 0 0 0% 0 0%
TOTAL 155,116 161,214 4% 181,722 13%
NOTE: Gifts/Grants includes private grants and grants from nonfederal sources.
Amount per pupil excludes the following funds: Adult Education, Adult Supplemental Education, Special Education Coop
and Tuition Reimbursement.
*Enrollment (FTE) includes the enrollment of the district used for state aid and budget authority, and all other preschool enrollment
and kindergarten students attending full time.
140,000
145,000
150,000
155,000
160,000
165,000
170,000
175,000
180,000
185,000
2011-2012 2012-2013 2013-2014
155,116
161,214
181,722
Food Service Expenditures
9/17/2013 3:27 PM Sumexpen.xlsx Page 13 of 24

USD# 492
Other Costs
(2500 & 2900: Other Supplemental Services)
(3300: Community Services Operations)
% %
2011-2012 2012-2013 inc/ 2013-2014 inc/
Actual Actual dec Budget dec
General 0 0 0% 0 0%
Federal Funds 0 0 0% 0 0%
Supplemental General 0 0 0% 0 0%
At Risk (4yr Old) 0 0 0% 0 0%
At Risk (K-12) 0 0 0% 0 0%
Bilingual Education 0 0 0% 0 0%
Virtual Education 0 0 0% 0 0%
Capital Outlay 0 0 0% 0 0%
Driver Training 0 0 0% 0 0%
Declining Enrollment 0 0 0% 0 0%
Extraordinary School Program 0 0 0% 0 0%
Food Service 0 0 0% 0 0%
Professional Development 0 0 0% 0 0%
Parent Education Program 0 0 0% 0 0%
Summer School 0 0 0% 0 0%
Special Education 0 0 0% 0 0%
Cost of Living 0 0 0% 0 0%
Vocational Education 0 0 0% 0 0%
Gifts/Grants 0 0 0% 0 0%
Special Liability 0 0 0% 0 0%
School Retirement 0 0 0% 0 0%
Extraordinary Growth Facilities 0 0 0% 0 0%
Special Reserve 0 0 0%
KPERS Spec. Ret. Contribution 0 0 0% 0 0%
Contingency Reserve 0 0 0%
Text Book & Student Material 0 0 0%
Activity Fund 0 0 0% 0 0%
Bond and Interest #1 0 0 0% 0 0%
Bond and Interest #2 0 0 0% 0 0%
No-Fund Warrant 0 0 0% 0 0%
Special Assessment 0 0 0% 0 0%
Temporary Note 0 0 0% 0 0%
SUBTOTAL 0 0 0% 0 0%
Enrollment (FTE)* 260.0 295.0 13% 295.0 0%
Amount per Pupil 0 0 0% 0 0%
Adult Education 0 0 0% 0 0%
Adult Supplemental Education 0 0 0% 0 0%
Tuition Reimbursement 0 0 0% 0 0%
Special Education Coop 0 0 0% 0 0%
TOTAL 0 0 0% 0 0%
NOTE: Gifts/Grants includes private grants and grants from nonfederal sources.
Amount per pupil excludes the following funds: Adult Education, Adult Supplemental Education, Special Education Coop
and Tuition Reimbursement.
*Enrollment (FTE) includes the enrollment of the district used for state aid and budget authority, and all other preschool enrollment
and kindergarten students attending full time.
0
0
0
0
0
1
1
1
1
1
1
2011-2012 2012-2013 2013-2014
0 0 0
Other Costs
9/17/2013 3:27 PM Sumexpen.xlsx Page 14 of 24

USD# 492
Capital Improvements Expenditures (4000)
% %
2011-2012 2012-2013 inc/ 2013-2014 inc/
Actual Actual dec Budget dec
General 0 0 0% 0 0%
Federal Funds 0 0 0% 0 0%
Supplemental General 0 0 0% 0 0%
At Risk (4yr Old) 0 0 0% 0 0%
At Risk (K-12) 0 0 0% 0 0%
Bilingual Education 0 0 0% 0 0%
Virtual Education 0 0 0% 0 0%
Capital Outlay 57,980 28,703 -50% 175,000 510%
Driver Training 0 0 0% 0 0%
Declining Enrollment 0 0 0% 0 0%
Extraordinary School Program 0 0 0% 0 0%
Food Service 0 0 0% 0 0%
Professional Development 0 0 0% 0 0%
Parent Education Program 0 0 0% 0 0%
Summer School 0 0 0% 0 0%
Special Education 0 0 0% 0 0%
Cost of Living 0 0 0% 0 0%
Vocational Education 0 0 0% 0 0%
Gifts/Grants 0 0 0% 0 0%
Special Liability 0 0 0% 0 0%
School Retirement 0 0 0% 0 0%
Extraordinary Growth Facilities 0 0 0% 0 0%
Special Reserve 0 0 0%
KPERS Spec. Ret. Contribution 0 0 0% 0 0%
Contingency Reserve 0 0 0%
Text Book & Student Material 0 0 0%
Activity Fund 0 0 0% 0 0%
Bond and Interest #1 0 0 0% 0 0%
Bond and Interest #2 0 0 0% 0 0%
No-Fund Warrant 0 0 0% 0 0%
Special Assessment 0 0 0% 0 0%
Temporary Note 0 0 0% 0 0%
SUBTOTAL 57,980 28,703 -50% 175,000 510%
Enrollment (FTE)* 260.0 295.0 13% 295.0 0%
Amount per Pupil 223 97 -56% 593 510%
Adult Education 0 0 0% 0 0%
Adult Supplemental Education 0 0 0% 0 0%
Tuition Reimbursement 0 0 0% 0 0%
Special Education Coop 0 0 0% 0 0%
TOTAL 57,980 28,703 -50% 175,000 510%
NOTE: Gifts/Grants includes private grants and grants from nonfederal sources.
Amount per pupil excludes the following funds: Adult Education, Adult Supplemental Education, Special Education Coop
and Tuition Reimbursement.
*Enrollment (FTE) includes the enrollment of the district used for state aid and budget authority, and all other preschool enrollment
and kindergarten students attending full time.
0
20,000
40,000
60,000
80,000
100,000
120,000
140,000
160,000
180,000
2011-2012 2012-2013 2013-2014
57,980
28,703
175,000
Capital Improvements (4000)
9/17/2013 3:27 PM Sumexpen.xlsx Page 15 of 24
USD# 492
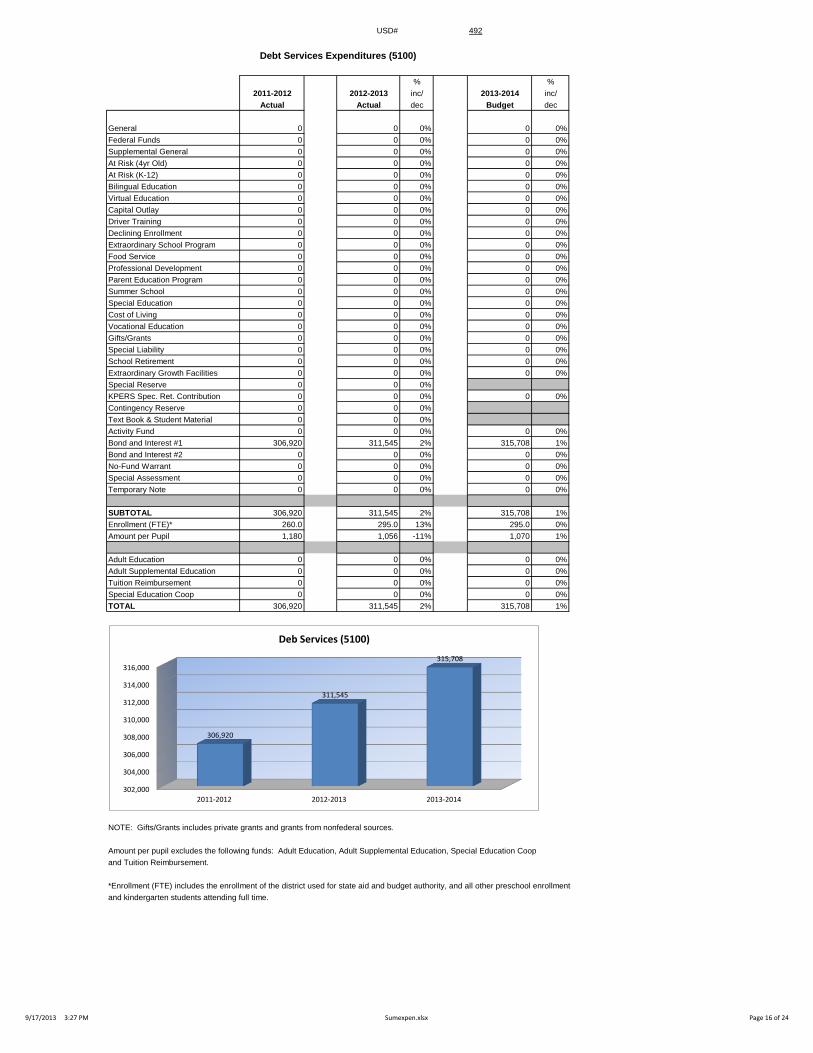
Debt Services Expenditures (5100)
% %
2011-2012 2012-2013 inc/ 2013-2014 inc/
Actual Actual dec Budget dec
General 0 0 0% 0 0%
Federal Funds 0 0 0% 0 0%
Supplemental General 0 0 0% 0 0%
At Risk (4yr Old) 0 0 0% 0 0%
At Risk (K-12) 0 0 0% 0 0%
Bilingual Education 0 0 0% 0 0%
Virtual Education 0 0 0% 0 0%
Capital Outlay 0 0 0% 0 0%
Driver Training 0 0 0% 0 0%
Declining Enrollment 0 0 0% 0 0%
Extraordinary School Program 0 0 0% 0 0%
Food Service 0 0 0% 0 0%
Professional Development 0 0 0% 0 0%
Parent Education Program 0 0 0% 0 0%
Summer School 0 0 0% 0 0%
Special Education 0 0 0% 0 0%
Cost of Living 0 0 0% 0 0%
Vocational Education 0 0 0% 0 0%
Gifts/Grants 0 0 0% 0 0%
Special Liability 0 0 0% 0 0%
School Retirement 0 0 0% 0 0%
Extraordinary Growth Facilities 0 0 0% 0 0%
Special Reserve 0 0 0%
KPERS Spec. Ret. Contribution 0 0 0% 0 0%
Contingency Reserve 0 0 0%
Text Book & Student Material 0 0 0%
Activity Fund 0 0 0% 0 0%
Bond and Interest #1 306,920 311,545 2% 315,708 1%
Bond and Interest #2 0 0 0% 0 0%
No-Fund Warrant 0 0 0% 0 0%
Special Assessment 0 0 0% 0 0%
Temporary Note 0 0 0% 0 0%
SUBTOTAL 306,920 311,545 2% 315,708 1%
Enrollment (FTE)* 260.0 295.0 13% 295.0 0%
Amount per Pupil 1,180 1,056 -11% 1,070 1%
Adult Education 0 0 0% 0 0%
Adult Supplemental Education 0 0 0% 0 0%
Tuition Reimbursement 0 0 0% 0 0%
Special Education Coop 0 0 0% 0 0%
TOTAL 306,920 311,545 2% 315,708 1%
NOTE: Gifts/Grants includes private grants and grants from nonfederal sources.
Amount per pupil excludes the following funds: Adult Education, Adult Supplemental Education, Special Education Coop
and Tuition Reimbursement.
*Enrollment (FTE) includes the enrollment of the district used for state aid and budget authority, and all other preschool enrollment
and kindergarten students attending full time.
302,000
304,000
306,000
308,000
310,000
312,000
314,000
316,000
2011-2012 2012-2013 2013-2014
306,920
311,545
315,708
Deb Services (5100)
9/17/2013 3:27 PM Sumexpen.xlsx Page 16 of 24
USD# 492
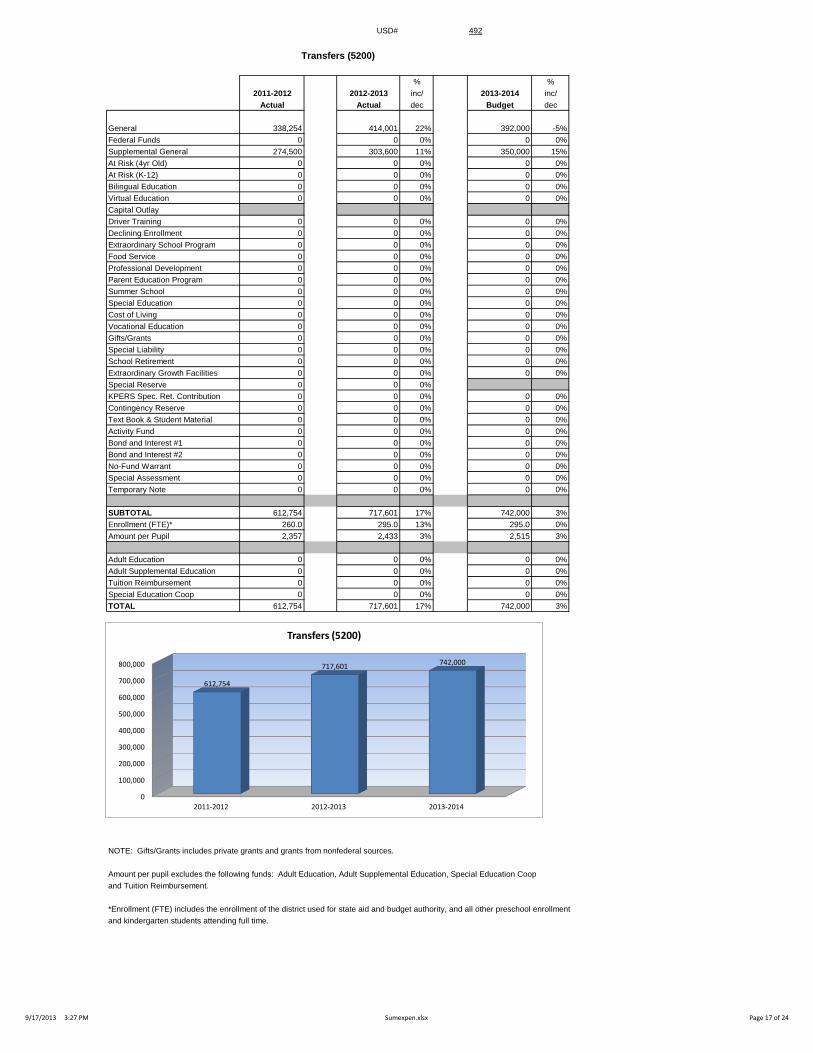
Transfers (5200)
% %
2011-2012 2012-2013 inc/ 2013-2014 inc/
Actual Actual dec Budget dec
General 338,254 414,001 22% 392,000 -5%
Federal Funds 0 0 0% 0 0%
Supplemental General 274,500 303,600 11% 350,000 15%
At Risk (4yr Old) 0 0 0% 0 0%
At Risk (K-12) 0 0 0% 0 0%
Bilingual Education 0 0 0% 0 0%
Virtual Education 0 0 0% 0 0%
Capital Outlay
Driver Training 0 0 0% 0 0%
Declining Enrollment 0 0 0% 0 0%
Extraordinary School Program 0 0 0% 0 0%
Food Service 0 0 0% 0 0%
Professional Development 0 0 0% 0 0%
Parent Education Program 0 0 0% 0 0%
Summer School 0 0 0% 0 0%
Special Education 0 0 0% 0 0%
Cost of Living 0 0 0% 0 0%
Vocational Education 0 0 0% 0 0%
Gifts/Grants 0 0 0% 0 0%
Special Liability 0 0 0% 0 0%
School Retirement 0 0 0% 0 0%
Extraordinary Growth Facilities 0 0 0% 0 0%
Special Reserve 0 0 0%
KPERS Spec. Ret. Contribution 0 0 0% 0 0%
Contingency Reserve 0 0 0% 0 0%
Text Book & Student Material 0 0 0% 0 0%
Activity Fund 0 0 0% 0 0%
Bond and Interest #1 0 0 0% 0 0%
Bond and Interest #2 0 0 0% 0 0%
No-Fund Warrant 0 0 0% 0 0%
Special Assessment 0 0 0% 0 0%
Temporary Note 0 0 0% 0 0%
SUBTOTAL 612,754 717,601 17% 742,000 3%
Enrollment (FTE)* 260.0 295.0 13% 295.0 0%
Amount per Pupil 2,357 2,433 3% 2,515 3%
Adult Education 0 0 0% 0 0%
Adult Supplemental Education 0 0 0% 0 0%
Tuition Reimbursement 0 0 0% 0 0%
Special Education Coop 0 0 0% 0 0%
TOTAL 612,754 717,601 17% 742,000 3%
NOTE: Gifts/Grants includes private grants and grants from nonfederal sources.
Amount per pupil excludes the following funds: Adult Education, Adult Supplemental Education, Special Education Coop
and Tuition Reimbursement.
*Enrollment (FTE) includes the enrollment of the district used for state aid and budget authority, and all other preschool enrollment
and kindergarten students attending full time.
0
100,000
200,000
300,000
400,000
500,000
600,000
700,000
800,000
2011-2012 2012-2013 2013-2014
612,754
717,601 742,000
Transfers (5200)
9/17/2013 3:27 PM Sumexpen.xlsx Page 17 of 24

USD# 492
Miscellaneous Information
Unencumbered Cash Balance by Fund
July 1, 2011 July 1, 2012 July 1, 2013
General 0 1 0
Federal Funds 0 952 0
Supplemental General 42,673 49,379 35,935
At Risk (4yr Old) 0 0 0
At Risk (K-12) 57,624 54,895 54,481
Bilingual Education 0 0 0
Virtual Education 0 0 11,786
Capital Outlay 728,546 727,577 769,109
Driver Training 4,872 4,639 4,627
Declining Enrollment 0 0 0
Extraordinary School Program 0 0 0
Food Service 49,807 50,630 52,360
Professional Development 37,191 38,063 45,915
Parent Education Program 0 0 0
Summer School 0 0 0
Special Education 68,838 68,822 70,997
Cost of Living 0 0 0
Vocational Education 40,785 40,791 40,677
Gifts/Grants 7,556 7,612 9,080
Special Liability 0 0 0
School Retirement 0 0 0
Extraordinary Growth Facilities 0 0 0
Special Reserve 0 0 0
KPERS Spec. Ret. Contribution 0 0 0
Contingency Reserve 240,415 240,415 235,615
Text Book & Student Material 16,862 26,924 26,927
Activity Fund 2,514 2,220 1,707
Bond and Interest #1 520,747 488,367 502,379
Bond and Interest #2 0 0 0
No Fund Warrant 0 0 0
Special Assessment 0 0 0
Temporary Note 0 0 0
SUBTOTAL 1,818,430 1,801,287 1,861,595
Enrollment (FTE)* 260.0 295.0 295.0
Amount per Pupil 6,994 6,106 6,310
Adult Education 0 0 0
Adult Supplemental Education 0 0 0
Tuition Reimbursement 0 0 0
Special Education Coop 0 0 0
TOTAL 1,818,430 1,801,287 1,861,595
NOTE: Gifts/Grants includes private grants and grants from nonfederal sources.
Amount per pupil excludes the following funds: Adult Education, Adult Supplemental Education, Special Education Coop
and Tuition Reimbursement.
*Enrollment (FTE) includes the enrollment of the district used for state aid and budget authority, and all other preschool enrollment
and kindergarten students attending full time.
0
200,000
400,000
600,000
800,000
1,000,000
1,200,000
1,400,000
1,600,000
1,800,000
2,000,000
July 1, 2011 July 1, 2012 July 1, 2013
1,818,430 1,801,287 1,861,595
Unencumbered Cash Balances by Fund
9/17/2013 3:27 PM Sumexpen.xlsx Page 18 of 24

USD# 492
Reserve Funds
Unencumbered Cash Balance
July 1, 2011 July 1, 2012 July 1, 2013
Special Reserve 0 0 0
TOTAL OTHER 0 0 0
Amount per Pupil $0 $0 $0
*School districts are authorized by law to self insure rather than purchase insurance for the following categories: Worker's Comp,
Health Insurance, Life Insurance, Property and Casualty (Risk Management) and Disability Income Insurance. Monies are placed
in the Self Insured Fund to pay for claims which may arise from the categories listed above.
0
0
0
0
0
1
1
1
1
1
1
July 1, 2011 July 1, 2012 July 1, 2013
0 0 0
Unencumbered Cash Balances by Fund (Reserve Funds Only)
9/17/2013 3:27 PM Sumexpen.xlsx Page 19 of 24
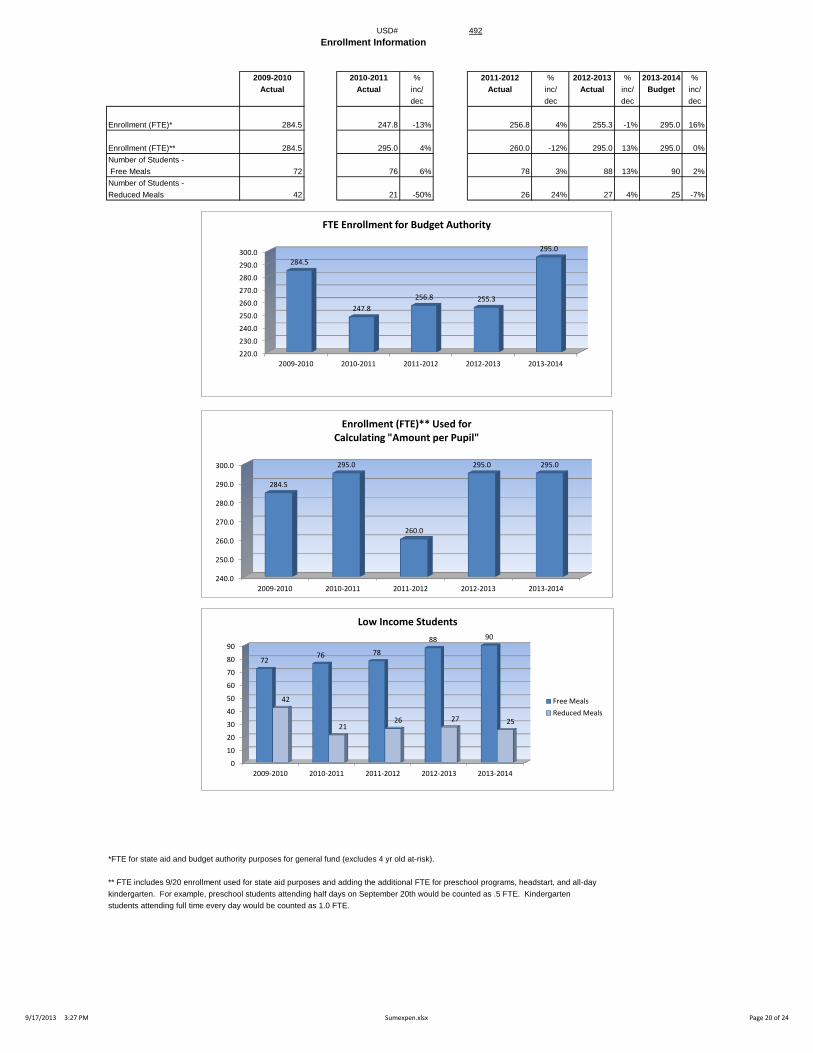
USD# 492
2009-2010 2010-2011 % 2011-2012 % 2012-2013 % 2013-2014 %
Actual Actual inc/ Actual inc/ Actual inc/ Budget inc/
dec dec dec dec
Enrollment (FTE)* 284.5 247.8 -13% 256.8 4% 255.3 -1% 295.0 16%
Enrollment (FTE)** 284.5 295.0 4% 260.0 -12% 295.0 13% 295.0 0%
Number of Students -
Free Meals 72 76 6% 78 3% 88 13% 90 2%
Number of Students -
Reduced Meals 42 21 -50% 26 24% 27 4% 25 -7%
*FTE for state aid and budget authority purposes for general fund (excludes 4 yr old at-risk).
** FTE includes 9/20 enrollment used for state aid purposes and adding the additional FTE for preschool programs, headstart, and all-day
kindergarten. For example, preschool students attending half days on September 20th would be counted as .5 FTE. Kindergarten
students attending full time every day would be counted as 1.0 FTE.
Enrollment Information
240.0
250.0
260.0
270.0
280.0
290.0
300.0
2009-2010 2010-2011 2011-2012 2012-2013 2013-2014
284.5
295.0
260.0
295.0 295.0
Enrollment (FTE)** Used for Calculating "Amount per Pupil"
0
10
20
30
40
50
60
70
80
90
2009-2010 2010-2011 2011-2012 2012-2013 2013-2014
72 76 78
88 90
42
21 26 27 25
Low Income Students
Free Meals
Reduced Meals
220.0
230.0
240.0
250.0
260.0
270.0
280.0
290.0
300.0
2009-2010 2010-2011 2011-2012 2012-2013 2013-2014
284.5
247.8
256.8 255.3
295.0
FTE Enrollment for Budget Authority
9/17/2013 3:27 PM Sumexpen.xlsx Page 20 of 24
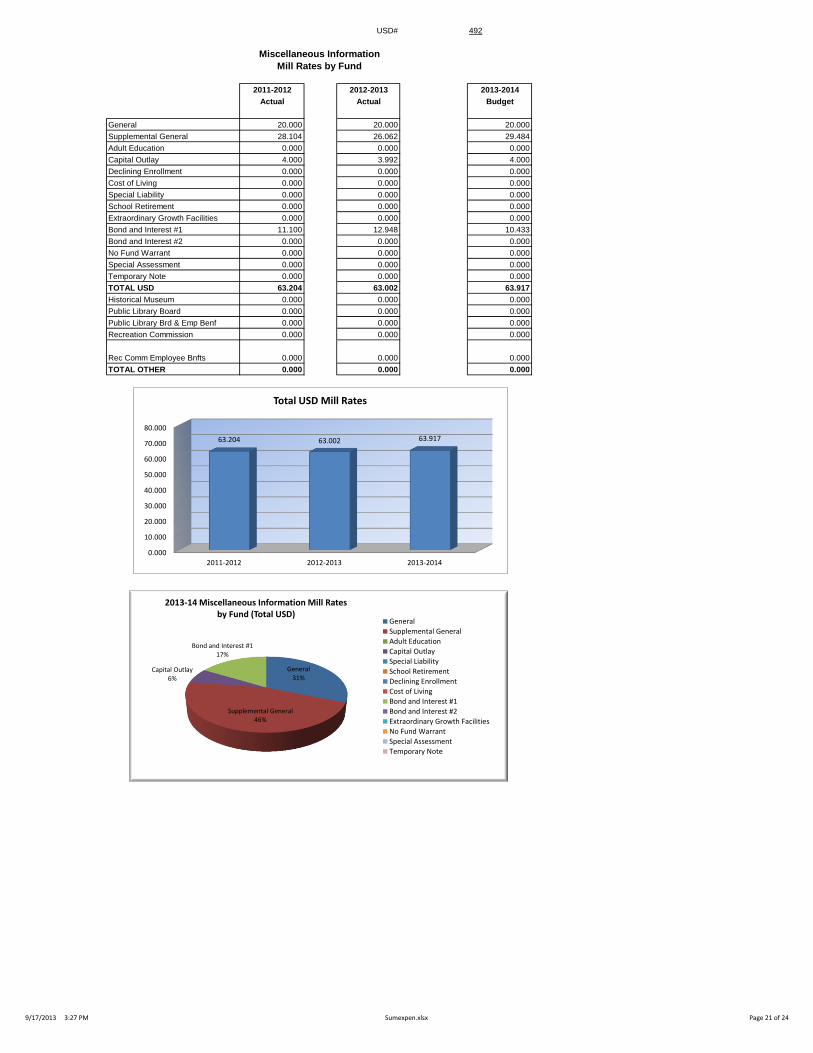
USD# 492
Miscellaneous Information
Mill Rates by Fund
2011-2012 2012-2013 2013-2014
Actual Actual Budget
General 20.000 20.000 20.000
Supplemental General 28.104 26.062 29.484
Adult Education 0.000 0.000 0.000
Capital Outlay 4.000 3.992 4.000
Declining Enrollment 0.000 0.000 0.000
Cost of Living 0.000 0.000 0.000
Special Liability 0.000 0.000 0.000
School Retirement 0.000 0.000 0.000
Extraordinary Growth Facilities 0.000 0.000 0.000
Bond and Interest #1 11.100 12.948 10.433
Bond and Interest #2 0.000 0.000 0.000
No Fund Warrant 0.000 0.000 0.000
Special Assessment 0.000 0.000 0.000
Temporary Note 0.000 0.000 0.000
TOTAL USD 63.204 63.002 63.917
Historical Museum 0.000 0.000 0.000
Public Library Board 0.000 0.000 0.000
Public Library Brd & Emp Benf 0.000 0.000 0.000
Recreation Commission 0.000 0.000 0.000
Rec Comm Employee Bnfts 0.000 0.000 0.000
TOTAL OTHER 0.000 0.000 0.000
0.000
10.000
20.000
30.000
40.000
50.000
60.000
70.000
80.000
2011-2012 2012-2013 2013-2014
63.204 63.002 63.917
Total USD Mill Rates
General 31%
Supplemental General 46%
Capital Outlay 6%
Bond and Interest #1 17%
2013-14 Miscellaneous Information Mill Rates by Fund (Total USD)
General
Supplemental General
Adult Education
Capital Outlay
Special Liability
School Retirement
Declining Enrollment
Cost of Living
Bond and Interest #1
Bond and Interest #2
Extraordinary Growth Facilities
No Fund Warrant
Special Assessment
Temporary Note
9/17/2013 3:27 PM Sumexpen.xlsx Page 21 of 24

USD# 492
Other Information
2011-2012 2012-2013 2013-2014
Actual Actual Budget
Assessed Valuation $15,536,440 $16,587,264 $16,829,745
Bonded Indebtedness $2,840,000 $2,640,000 $2,420,000
$14,800,000
$15,000,000
$15,200,000
$15,400,000
$15,600,000
$15,800,000
$16,000,000
$16,200,000
$16,400,000
$16,600,000
$16,800,000
$17,000,000
2011-2012 2012-2013 2013-2014
$15,536,440
$16,587,264
$16,829,745
Assessed Valuation
$2,200,000
$2,300,000
$2,400,000
$2,500,000
$2,600,000
$2,700,000
$2,800,000
$2,900,000
2011-2012 2012-2013 2013-2014
$2,840,000
$2,640,000
$2,420,000
Bonded Indebtedness
9/17/2013 3:27 PM Sumexpen.xlsx Page 22 of 24

USD 492
2013-14 Estimated Sources of Revenue--2013-14 Estimated
Amount July 1, 2013 State Federal Local July 1, 2014
Fund Budgeted Cash Balance Interest Transfers Other Cash Balance
General 2,462,077 0 2,172,635 0 0 289,442 XXXXXXXX
Supplemental General 825,000 35,935 286,679 502,386 XXXXXXXX
Adult Education 0 0 0 0 0 0 0 0
At Risk (4yr Old) 0 0 0 0 0 0 0
Adult Supplemental Education 0 0 0 0 0 0
At Risk (K-12) 169,571 54,481 0 0 145,000 0 29,910
Bilingual Education 0 0 0 0 0 0 0
Virtual Education 48,772 11,786 0 42,000 0 5,014
Capital Outlay 493,000 769,109 0 0 0 70,802 346,911
Driver Training 6,597 4,627 2,300 0 0 0 0 330
Declining Enrollment 0 0 0 0 XXXXXXXX
Extraordinary School Program 0 0 0 0 0 0 0
Food Service 177,222 52,360 1,356 70,502 0 35,000 64,959 46,955
Professional Development 38,500 45,915 0 0 20,000 0 27,415
Parent Education Program 0 0 0 0 0 0 0 0
Summer School 0 0 0 0 0 0 0
Special Education 488,478 70,997 0 0 0 455,000 0 37,519
Vocational Education 53,760 40,677 0 0 0 45,000 0 31,917
Special Liability Expense Fund 0 0 0 0 0
Special Reserve Fund 0 XXXXXXXX
Gifts and Grants 5,000 9,080 0 4,080
Textbook & Student Materials Revolving 26,927 XXXXXXXX
School Retirement 0 0 0 0 0
Extraordinary Growth Facilities 0 0 0 0 XXXXXXXXX
KPERS Special Retirement Contribution 180,546 0 180,546 XXXXXXXXX
Contingency Reserve 235,615 XXXXXXXXX
Activity Funds 1,707 XXXXXXXXX
Tuition Reimbursement 0 0 0 0 0
Bond and Interest #1 315,708 502,379 91,534 0 0 188,873 467,078
Bond and Interest #2 0 0 0 0 0 0 0
No Fund Warrant 0 0 0 0
Special Assessment 0 0 0 0
Temporary Note 0 0 0 0 0
Coop Special Education 0 0 0 0 0 0 0
Federal Funds 37,639 0 xxxxxxxxxxx 37,639 xxxxxxxxxxxx xxxxxxxxxxxx xxxxxxxxxxx 0
Cost of Living 0 0 xxxxxxxxxxx xxxxxxxxxxx xxxxxxxxxxxx 0 0 XXXXXXXXX
SUBTOTAL 5,301,870 1,861,595 2,735,050 108,141 0 742,000 1,116,462 997,129
Less Transfers 742,000
TOTAL Budget Expenditures $4,559,870
2011-2012 2012-2013 2013-2014
State Revenues 2,516,881 2,596,350 2,735,050
Federal Revenues 100,817 116,948 108,141
Local Revenues 1,786,724 1,963,928 1,858,462
Total Revenues 4,404,422 4,677,226 4,701,653
Revenues Per Pupil 16,940 15,855 15,938
Sources of Revenue and Proposed Budget for 2013-14
Sources of Revenue - - State, Federal, Local

Intentionally left blank