fire island inlet to moriches inlet fire island ... · this stabilization project is a one-time,...
TRANSCRIPT

FIRE ISLAND INLET TO MORICHES INLET
FIRE ISLAND STABILIZATION PROJECT
HURRICANE SANDY LIMITED REEVALUATION REPORT
Evaluation of a Stabilization Plan for Coastal Storm Risk Management
In Response to Hurricane Sandy &
Public Law 113-2
MAIN REPORT
U.S. Army Corps of Engineers
New York District
June 2014

This page left intentionally blank
I. EXECUTIVE SUMMARY This project is designed to provide coastal storm risk management from coastal erosion and tidal inundation through construction of a beach berm and dune, at Fire Island Inlet to Moriches Inlet, New York. The project area stretches from Robert Moses State Park in the west to Smith Point County Park in the east for a total of 19 miles. The purpose of the project is to provide a level of storm damage protection to mainland development protected by the barrier island. As a consequence of the severe coastal erosion during Hurricane Sandy in October 2012, the dune and berm system along Fire Island is now depleted and vulnerable to overwash and breaching during future storm events, which increases the potential for storm damage to the shore and particularly back-bay communities along Great South Bay and Moriches Bay. The Fire Island to Moriches to Inlet (FIMI) Plan was developed using background material and existing information and data to expedite the FIMI Hurricane Sandy Limited Reevaluation Report (HSLRR) in accordance with approach approved by HQUSACE in a memorandum dated 8 January 2014 and consistent with the Disaster Relief Appropriations Act of 2013 (Public Law. 113-2; herein P.L. 113-2). This Stabilization Project is a one-time, stand-alone project with its own independent utility. As developed, this project does not limit the options available in the Fire Island to Montauk Point (FIMP) Reformulation Study or pre-suppose the outcome of the Reformulation Study. After the initial placement of 6,992,145 cubic yards (cy) of sand, the project is expected to erode, and diminish in its protective capacity, eventually returning to a pre-project condition. The Project is designed with advance fill to maintain design conditions for a period of 5 years, and it is estimated that the residual effect of the fill placement would last another 5 years. After the residual effect of beachfill has diminished, there is further residual effect of 10 years that is provided by the acquisition and relocation of structures. The total period over which residual effects are expected is 10 years for sand and 20 years for structure acquisition. The project’s annual benefits and annual costs were developed using October 2013 price levels and are $18.8M and $17.5M, respectively. The Benefit to Cost Ratio is 1.1 (at 3.50% FY14 Discount Rate). The project is economically justified and the District recommends that the Stabilization project be constructed at a project cost of $207,100,000 with a total investment cost of $223,324,000. The Draft HSLRR and Environmental Assessment (EA) were released for public review. The report has been revised to account for public comments received on the project, as well as agency input received through coordination and consultation that occurred concurrently with public review of the EA. Based upon consideration of the public and agency review and consultation, including a favorable Biological Opinion, and approval of the HSLRR and EA by the North Atlantic Division, the District has signed a Finding of No Significant Impact (FONSI).
II. PERTINENT DATA Pertinent project information is summarized below. 1. Project Design and Layout The proposed project is comprised of three (3) design templates identified as “berm only” “small” and “medium”, which are described below. These features are described relative to NGVD throughout the report. The conversion to NAVD is provided below.
a. The “berm only” design template includes a berm width of 90 ft at elevation +9.5 NGVD (+8.5 ft NAVD), and no dune behind the berm (no vegetation is proposed for this design template). It includes a foreshore slope of 12 horizontal (H) on 1 vertical (V) from +9.5 to +2 ft NGVD, or mean high water (MHW), equating to an additional 115 ft of beach above MHW. This template is proposed in areas where eroded berm conditions have been observed, but where existing dune elevation and width are sufficient to reduce the risk of overwashing and breaching. Areas that meet these criteria include Robert Moses State Park, western Smith Point County Park and the TWA Memorial Beach.
b. The “small” template is intended to reduce the risk of breaching. It is proposed for areas with limited oceanfront structures. The “small” fill template includes a berm width of 90 ft, at elevation +9.5 ft NGVD (+8.5 ft NAVD) and a vegetated dune with a crest width of 25 ft at an elevation of +13 ft NGVD (+12 ft NAVD). It also includes a foreshore slope of 12H:1V from +9.5 to +2 ft NGVD, equating to an additional 115 ft of beach above MHW. It is proposed for areas with limited oceanfront structures, including Smith Point County Park.
c. Fire Island Lighthouse Tract (modified “small” design template): The dune and beach design template the NPS Fire Island Lighthouse Beach would include an unvegetated dune. The proposed 3,800 ft length of dune would be constructed at +13 NGVD (+12 ft NAVD) and have side slopes of 1V:10H, and a 25 ft crest width.
d. The “medium” design template is proposed for areas that have the greatest potential for
damages to oceanfront structures and includes the 17 communities on Fire Island (including Kismet to Lonelyville, Town Beach to Corneille Estates, Ocean Beach to Seaview, Ocean Bay Park to Point O’ Woods, Cherry Grove, Fire Island Pines, Water Island, and Davis Park). The medium design template includes a berm width of 90 ft at an elevation at +9.5 ft NGVD (+8.5 ft NAVD), and a vegetated dune with a crest width of 25 ft at an elevation of +15 ft NGVD (+14 ft NAVD). It also includes a dune slope of 1V:5H and a foreshore slope of 12H:1V.
e. West of Robbins Rest (modified “medium” design template): In the area between
Atlantique and Robbins Rest, approximately 900 ft of the proposed dune northward to the existing vegetation will be re-aligned in an effort to conserve partial overwash habitat that formed in this area due to Hurricane Sandy. The dune design template in this area includes a berm width of 90 ft at an elevation at +9.5 ft NGVD (+8.5 ft NAVD), and a vegetated dune with a crest width of 25 ft at an elevation of +15 ft NGVD (+14 ft NAVD). It also includes a dune slope of 1V:5H and a foreshore slope of 12H:1V.
f. Based upon consultation with the U.S.F.W.S. under Section 7 of the Endangered Species Act,
project features have been incorporated as habitat offsets for Piping Plover. These features have been included as non-discretionary measures in the project as defined in the Reasonable and Prudent Measures of the Biological Opinion. These reasonable and prudent measures will be implemented where consistent
with legal authority, and subject to the availability of funds. These features are provided in detail in the report, and generally include:
1 – Devegetation and topographical alteration and management in the Vicinity of Great Gunn Beach and extending eastward to Moriches Inlet, to provide approximately 33.7 hectares of piping plover nesting and foraging habitats including ephemeral pools.
2 – The creation of plover foraging and nesting habitat on six hectares of habitat in the vicinity of the dredge material management site located near New Made Island.
3 – The adaptive management of plover habitat through vegetation management to achieve sparsely vegetated overwash areas in Smith Point County Park at the Pattersquash Island Overwash, Smith Point Breach Location, and New Made Island Overwash.
4 – The development and implementation of a coordinated plover monitoring program, coordinated mammalian predator management plan, coordinated stewardship, and coordinated effectiveness monitoring to inform the adaptive management of these habitat offset areas. 2. Offshore Sand Borrow Areas Locations and Dredged Material Volumes The total initial project fill volume would be 6,992,145 yd3 which represents the volume of sand necessary to achieve the design fill, advance fill, overfill, and contingency profiles for 19 mi of beach. No renourishment cycles are planned for the proposed project. The sandy offshore habitats that are designated as sand mining areas are known as Borrow Area 2C, Borrow Area 4C and Borrow Area 5B. Material for initial construction is proposed as follows: approximately 5,000,000 cy of sand to be removed from Borrow Area 2C and placed in the fill areas between Fire Island Inlet and Davis Park. Approximately 700,000 cy to be removed from Borrow Area 4C, and approximately 1,300,000 cy to be removed from Borrow Area 5B for fill areas between Smith Point County Park and Moriches Inlet. 3. Real Estate Requirements Easements: Perpetual Beach Storm Risk Management Easements - 411 Access Agreements (on government owned properties) - 252 Temporary Construction Easements - 27 Staging Right-of-Entries - 2 (Total 692 Properties) Relocations: Home On-Site Relocations - 6 Well Relocation - 1Well Utility Fee Acquisition: Purchase of Privately-Owned Homes - 41 Properties Perpetual Beach Easement - 411 privately owned properties Damage - 17 Pools and Decks Public Law 91-646 Relocation Assistance: Relocation Construction - 6 homes Relocation Benefits/Moving Expenses - 47 Properties Relocation and Reconstruction of Ocean Beach Well System
4. Costs
(October 2013 price levels) Beachfill $105,000,000 Monitoring & Adaptive Management Costs $15.5M (10 years) O&M Costs $100K (10 years) Total Real Estate Costs $68,820,316
Total Project First Cost $207,100,000 Total Investment Cost – Fully Funded $223,324,000 5. Economics (Discounted at 3.50% over a 20-year period – FY14) Annual Project Cost $17.5M Average Annual Benefits $18.8M Benefit to Cost Ratio 1.1 COST ALLOCATION (FIRST COST – HSLRR Plan) Federal (100%) $207,100,000 Non-Federal (0 %) $0 TOTAL $207,100,000 The construction and pre-construction sequence and time schedule of the Stabilization Project is dependent on the timeliness of this report’s approval, the foregoing construction procedures, and the ability of local interests to implement items of local cooperation. These items of local cooperation are principally the furnishing of offshore borrow easements by the State of New York as well as required shoreline real estate easements, and structure acquisition and relocation.
Due to the anticipated delay in obtaining the necessary real estate requirements in the communities, the construction will be split into three contracts:
Contract 1: Smith Point County Park (MB-1A, MB-1B, MB-2A);
Contract 2: Lonelyville to Robert Moses State Park (GSB-1A, GSB-1B, GSB-2A);
Contract 3: Davis Park to Town Beach (GSB-2B, GSB-2C, GSB-2D, GSB-3A, GSB-3C, GSB-3E, GSB-3G).
The proposed construction schedule is as follows:
Contract 1: September 2014 to April 2015
Relocations: $ 0
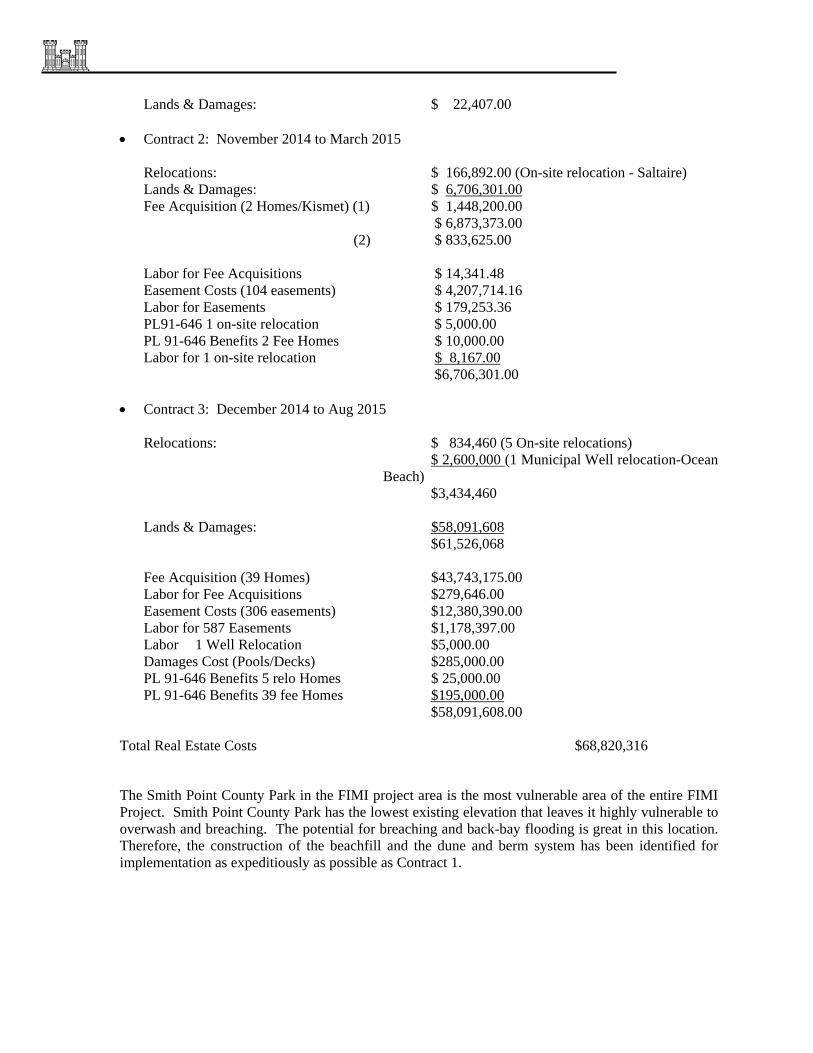
Lands & Damages: $ 22,407.00
Contract 2: November 2014 to March 2015 Relocations: $ 166,892.00 (On-site relocation - Saltaire) Lands & Damages: $ 6,706,301.00 Fee Acquisition (2 Homes/Kismet) (1) $ 1,448,200.00 $ 6,873,373.00 (2) $ 833,625.00 Labor for Fee Acquisitions $ 14,341.48 Easement Costs (104 easements) $ 4,207,714.16 Labor for Easements $ 179,253.36 PL91-646 1 on-site relocation $ 5,000.00 PL 91-646 Benefits 2 Fee Homes $ 10,000.00 Labor for 1 on-site relocation $ 8,167.00 $6,706,301.00
Contract 3: December 2014 to Aug 2015 Relocations: $ 834,460 (5 On-site relocations)
$ 2,600,000 (1 Municipal Well relocation-Ocean Beach)
$3,434,460 Lands & Damages: $58,091,608
$61,526,068
Fee Acquisition (39 Homes) $43,743,175.00 Labor for Fee Acquisitions $279,646.00 Easement Costs (306 easements) $12,380,390.00 Labor for 587 Easements $1,178,397.00 Labor 1 Well Relocation $5,000.00 Damages Cost (Pools/Decks) $285,000.00 PL 91-646 Benefits 5 relo Homes $ 25,000.00 PL 91-646 Benefits 39 fee Homes $195,000.00 $58,091,608.00
Total Real Estate Costs $68,820,316
The Smith Point County Park in the FIMI project area is the most vulnerable area of the entire FIMI Project. Smith Point County Park has the lowest existing elevation that leaves it highly vulnerable to overwash and breaching. The potential for breaching and back-bay flooding is great in this location. Therefore, the construction of the beachfill and the dune and berm system has been identified for implementation as expeditiously as possible as Contract 1.

This page left intentionally blank
FIMIStabilizationHurricaneSandyLimitedReevaluationReport–June2014 Pagei
TABLE OF CONTENTS
1.0 INTRODUCTION ................................................................................................................ 1
1.1 Report Purpose & Report Format .............................................................................2 1.2 Study Area ................................................................................................................4 1.3 Study Authority ........................................................................................................8 1.4 Study History ............................................................................................................8 1.5 Non-Federal Partners and Stakeholders .................................................................10
2.0 PROJECT AREA VULNERABILITY ............................................................................ 11
3.0 EXISTING CONDITIONS ............................................................................................... 16
3.1 Barrier Island & Shorefront Geological Processes .................................................16 3.2 Socio-Economic Conditions ...................................................................................22 3.3 Environmental Resources .......................................................................................23 3.4 Cultural and Archeological Resources ...................................................................35
4.0 WITHOUT PROJECT FUTURE CONDITION ............................................................ 40
5.0 PROBLEM IDENTIFICATION ...................................................................................... 42
5.1 General ...................................................................................................................42 5.2 Storm Damage Analysis .........................................................................................44
6.0 STUDY GOALS AND OBJECTIVES ............................................................................. 57
6.1 Study/Project Goals ................................................................................................57 6.2 Planning Objectives ................................................................................................57 6.3 Project Constraints .................................................................................................57
7.0 FORMULATION OF FIMP ALTERNATIVE PLANS ................................................. 60
7.1 FIMP Reformulation Overview ..............................................................................60 8.0 IDENTIFICATION OF FIMI STABILIZATION PLAN......................................65
8.1 Hurricane Sandy Design Considerations ................................................................66 8.2 Stabilization Plan Details .......................................................................................67
9.0 PROJECT IMPACTS ........................................................................................................ 86
9.1 Environmental Impacts ...........................................................................................86
10.0 PUBLIC LAW 113-2 CONSIDERATIONS .................................................................... 94
10.1 Fully Funded and Costs Apportionment ................................................................94 10.2 Section 902 of WRDA 1986, as amended ..............................................................95 10.3 Risks, Economics and Environmental Compliance ...............................................95 10.4 Resiliency, Sustainability and Consistency with the Comprehensive Study .........95
11. PROJECT IMPLEMENTATION .................................................................................... 97
11.1 Construction Schedule ............................................................................................97 11.2 Local Cooperation ..................................................................................................98
FIMIStabilizationHurricaneSandyLimitedReevaluationReport–June2014 Pageii
11.3 Operations, Maintenance, Repair, Replacement and Rehabilitation Plan ............101 11.4 Land Use and Management ..................................................................................102 11.5 Monitoring & Adaptive Management ..................................................................102
12. FINDINGS AND CONCLUSIONS ................................................................................ 106
13. RECOMMENDATIONS ................................................................................................. 107
14. REFERENCES ................................................................................................................. 109
APPENDIX A STUDY AREA STORM HISTORY ......................................................... 112
APPENDIX B EXISTING PHYSICAL CONDITIONS .................................................. 113
APPENDIX C TSP LAYOUTS AND VEGETATION MANAGEMENT AREAS ....... 114
APPENDIX D BACK-UP CALCULATIONS .................................................................. 115
APPENDIX E BORROW AREA PLAN ........................................................................... 116
APPENDIX F PUBLIC ACCESS PLAN .......................................................................... 117
APPENDIX G REAL ESTATE PLAN .............................................................................. 118
APPENDIX H COST APPENDIX ..................................................................................... 119
APPENDIX I PERTINENT CORRESPONDENCE ...................................................... 120
APPENDIX J LAND MANAGEMENT APPENDIX ..................................................... 121
APPENDIX K NYSDEC LETTER OF SUPPORT .......................................................... 122
FIMIStabilizationHurricaneSandyLimitedReevaluationReport–June2014 Pageiii
LIST OF FIGURES
Figure 1: FIMP Study Area .................................................................................................. 6
Figure 2: FIMI Project Area ................................................................................................ 7
Figure 3: Post Sandy Photo of Breach at Old Inlet (looking east towards Smith Point County Park) ........................................................................................................ 13
Figure 4: Post Sandy Photo Dune Erosion and Berm Lowering at Fire Island ................. 13
Figure 5: Pre- and Post-Sandy Photo at Ocean Beach ........................................................ 14
Figure 6: Post-Hurricane Sandy Photo at Davis Park ........................................................ 15
Figure 7: Barrier Island Features (after USACE, 2002) ..................................................... 16
Figure 8: Morphological Responses to Overwash and Breaching ..................................... 17
Figure 9: Post-Sandy Images Showing Overwash (Hapke et al. 2013) .............................. 44
Figure 10: Observed Beach and Dune Change on Fire Island (Hapke et al. 2013) .............. 44
Figure 11: Tentative Federally Supported Plan Overview .................................................... 64
Figure 12: Typical Beachfill Section .................................................................................... 68
Figure 13: Tentatively Selected Plan - FIMI........................................................................ 71
Figure 14: Fire Island Pines Alignment ............................................................................... 73
Figure 15: Selected Plan Borrow Area Locations ................................................................ 77
FIMIStabilizationHurricaneSandyLimitedReevaluationReport–June2014 Pageiv
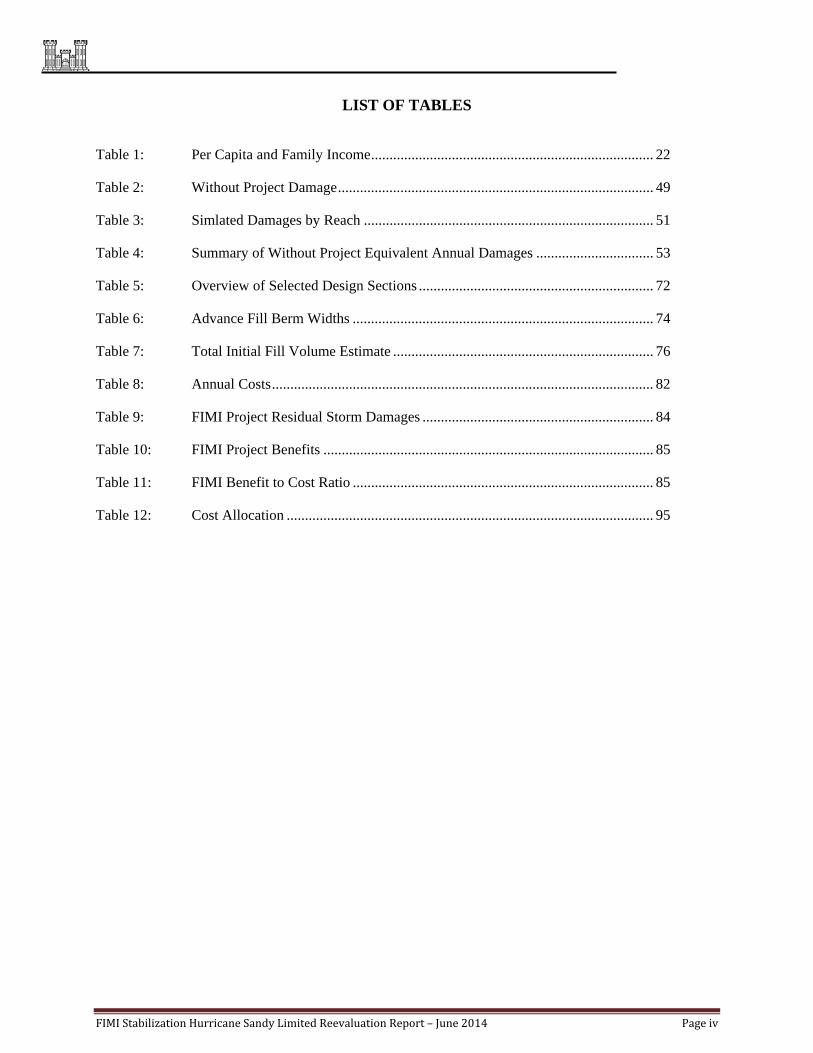
LIST OF TABLES
Table 1: Per Capita and Family Income ............................................................................. 22
Table 2: Without Project Damage ...................................................................................... 49
Table 3: Simlated Damages by Reach ............................................................................... 51
Table 4: Summary of Without Project Equivalent Annual Damages ................................ 53
Table 5: Overview of Selected Design Sections ................................................................ 72
Table 6: Advance Fill Berm Widths .................................................................................. 74
Table 7: Total Initial Fill Volume Estimate ....................................................................... 76
Table 8: Annual Costs ........................................................................................................ 82
Table 9: FIMI Project Residual Storm Damages ............................................................... 84
Table 10: FIMI Project Benefits .......................................................................................... 85
Table 11: FIMI Benefit to Cost Ratio .................................................................................. 85
Table 12: Cost Allocation .................................................................................................... 95
FIMIStabilizationHurricaneSandyLimitedReevaluationReport–June2014 Page1
1.0 INTRODUCTION
The Fire Island Inlet to Montauk Point, New York, Combined Beach Erosion Control and Hurricane Protection Project (FIMP) was first authorized by the River and Harbor Act of 14 July 1960 in accordance with House Document (HD) 425, 86th Congress, 2d Session, dated 21 June 1960, which established the authorized project. The project is being reformulated by the U.S. Army Corps of Engineers, New York District (USACE) as the lead Federal agency to identify a comprehensive long-term solution to manage the risk of coastal storm damages along the south shore of Long Island in a manner which balances the risks to human life and property while maintaining, enhancing, and restoring ecosystem integrity and coastal biodiversity. The overall FIMP reformulation study was undertaken to evaluate alternatives to determine Federal interest in participating in one or more of these alternatives, and identify a mutually agreeable joint Federal/state/locally supported plan for addressing the storm risk management needs in the study area. In addition to addressing the USACE’s national objectives of storm risk management and environmental sustainability, this collaborative effort identified alternatives for implementation by other Federal, state and local agencies to achieve broader study objectives. Prior to the Fall of 2012, the most recent effort in the FIMP Reformulation Study had been the refinement of the plan alternatives developed in 2009 and presented by the federal agencies to state and local officials in 2011, as a Tentative Federally Supported Plan (TFSP) in preparation for finalizing the overall study’s recommendation in the form of a General Reevaluation Report (GRR). The planning for the FIMP Overall Project progressed to the point of identifying a Tentative Federally Supported Plan (TFSP) through the fall of 2012 and is being finalized in the GRR. However, on October 29, 2012, Hurricane Sandy made landfall approximately five (5) miles south of Atlantic City, NJ, where it collided with a blast of arctic air from the north, creating conditions for an extraordinary and historic storm along the East Coast with the worst coastal impacts centered on the northern New Jersey, New York City, and the Long Island coastline. The highest water level ever recorded at Battery Park within nearby New York City exceeded predicted tidal elevations of the storm at 9.4 feet. Coastal erosion and damages within the FIMP study area as a result of Hurricane Sandy were severe, substantial and devastating. Post-Sandy measurements of volume loss of the beach and dunes on Fire Island indicate that on average the beach lost 55 percent of its pre-storm volume equating to a loss of 4.5 million cubic yards. A majority of the dunes on Fire Island either were flattened or experienced severe erosion and scarping, As a consequence of this severe coastal erosion during Hurricane Sandy, the dune and berm system along Fire Island is now depleted and particularly vulnerable to overwash and breaching during future storm events, which increases the potential for storm damage to shore and particularly back-bay communities along Great South Bay and Moriches Bay. In response to extensive storm damages and increased vulnerability to future events, consistent with the Disaster Relief Appropriations Act of 2013 (Public Law. 113-2; herein P.L. 113-2), and recognizing the urgency to repair and implement immediate risk management measures, particularly in the Fire Island to Moriches Inlet (FIMI) study area, USACE has proposed an approach to expedite implementation of construction through stabilization efforts independent of the FIMP Reformulation Study. This approach has gained widespread approval from New York State, Suffolk County, N.Y. and the local municipalities, who recognize the extreme vulnerability of the coast, and the need to move quickly to address this need. This approach has also gained approval from Steven L. Stockton, P.E., Director of Civil Works, USACE in a memorandum dated 8 January 2014 (Appendix I – Pertinent Correspondence) and multiple regulatory agencies.
FIMIStabilizationHurricaneSandyLimitedReevaluationReport–June2014 Page2
The subject post-Sandy Fire Island Stabilization Project, which encompasses Fire Island to Moriches Inlet, which is also known as the Fire Island to Moriches Inlet Project (FIMI) was developed based upon the Engineering, Economic, Environmental, and Planning efforts that have been undertaken through the on-going FIMP Reformulation Study that compared alternatives to identify the recommended scale and scope of a beachfill project from the TFSP, as an independent stabilization effort. The FIMI Plan was derived from utilizing background material and existing information/data that is currently included in the FIMP study to expedite the FIMI HSLRR in accordance with the HQUSACE above referenced approved Strategy Paper (dated January 8, 2014) and in response to PL 113-2. Stabilization efforts were focused on FIMI as this reach is the most subject to barrier island overwash and breach thereby exposing the back-bay to considerable damages. There is a more urgent need to advance the stabilization of this reach due to its vulnerability and potential for major damage and risk to life and property. This Stabilization effort is being undertaken in response to the highly vulnerable condition following Hurricane Sandy’s erosive forces, where expedited action is needed to stabilize this area. This FIMI stabilization effort (Reach 1) has been developed as a one-time, initial construction project to repair damages caused by Hurricane Sandy and to stabilize the island. This report demonstrates that the Stabilization Project has its own independent utility, and as developed does not limit the options available in the Reformulation Study or pre-suppose the outcome of the Reformulation Study.
The Smith Point County Park in the FIMI project area is the most vulnerable area of the entire FIMI Project. Smith Point County Park has the lowest existing elevation that leaves it highly vulnerable to overwash and breaching. The potential for breaching and back-bay flooding is great in this location. Therefore, the construction of the beachfill and the dune and berm system in this reach has been identified for implementation as expeditiously as possible.
1.1 Report Purpose & Report Format
This report has been prepared to satisfy the requirements of P.L. 113-2. Interim Report 1, prepared in response to PL 113-2, specifically designated FIMP as an "Authorized but Unconstructed" project. This report will serve as the USACE’s decision document to support the justification for the implementation of a stabilization plan for the Fire Island Inlet to Moriches Inlet (FIMI) as a post- Sandy stabilization project. This report contains an Environmental Assessment, per the requirements of the National Environmental Policy Act (NEPA) and USACE implementing regulation as contained in ER-200-1 to provide environmental analyses and determination of a Finding of No Significant Impact (FONSI) for the project area covered by this stabilization effort.
This report also addresses necessary changes in the implementation of the authorized but unconstructed (ABU) overall FIMP project (authorized by the River and Harbor Act of 14 July 1960, dated 21 June 1960, which established the authorized project. in accordance with the Disaster Relief Appropriations Act of 2013 (P.L. 113-2). Specifically, this report addresses:
1. The costs and cost-sharing to support a Project Partnership Agreement (PPA) for the FIMI Project for Coastal Storm Risk Management.
FIMIStabilizationHurricaneSandyLimitedReevaluationReport–June2014 Page3
2. The requirements of P.L. 113-2 to demonstrate that the project is economically justified, technically feasible, and environmentally acceptable.
3. The requirements of P.L. 113-2 to demonstrate resiliency, sustainability, and consistency with the North Atlantic Coast Comprehensive Study (NACCS).
This report is arranged to provide the following information:
Chapter 1 provides an overview of the overall FIMP Study Area and history of construction, the project authorization, an introduction to the FIMI Project, and an overview of the project partners.
Chapter 2 provides an overview of the storm history in the FIMP Reformulation study area and an overview of the current vulnerability of the FIMI Project Area as a result of Hurricane Sandy.
Chapter 3 provides a description of the existing conditions within the Project Area.
Chapter 4 provides a brief overview of the Future Without Project Conditions for the Project.
Chapter 5 provides the problem identification, including a detailed description of the damages expected in the without project condition for the FIMI project, and the methods used to develop these damages.
Chapter 6 introduces the planning considerations used in developing alternatives for the project, including the goals, objectives and constraints.
Chapter 7 provides an overview of the formulation of plans that was undertaken to arrive at the Tentative Federally Supported Plan (TFSP).
Chapter 8 introduces the FIMI Stabilization project, provides the specific details associated with the recommended FIMI plan and provides the costs and economic justification for the FIMI Stabilization Project.
Chapter 9 provides a brief overview of the physical, environmental and cultural effects associated with the project. Full discussion of these effects is contained in the accompanying Environmental Assessment.
Chapter 10 provides an overview of how the recommended plan meets the requirements of P.L. 113-2.
Chapter 11provides the details of the implementation required for the Project.
Finally Chapters 12 and 13 provide the conclusions and recommendations for this Stabilization Project.
Additional supporting information for the report is provided as Appendices.
FIMIStabilizationHurricaneSandyLimitedReevaluationReport–June2014 Page4
1.2 Study Area
1.2.1 Overall Fire Island to Montauk Point (FIMP) Study Area
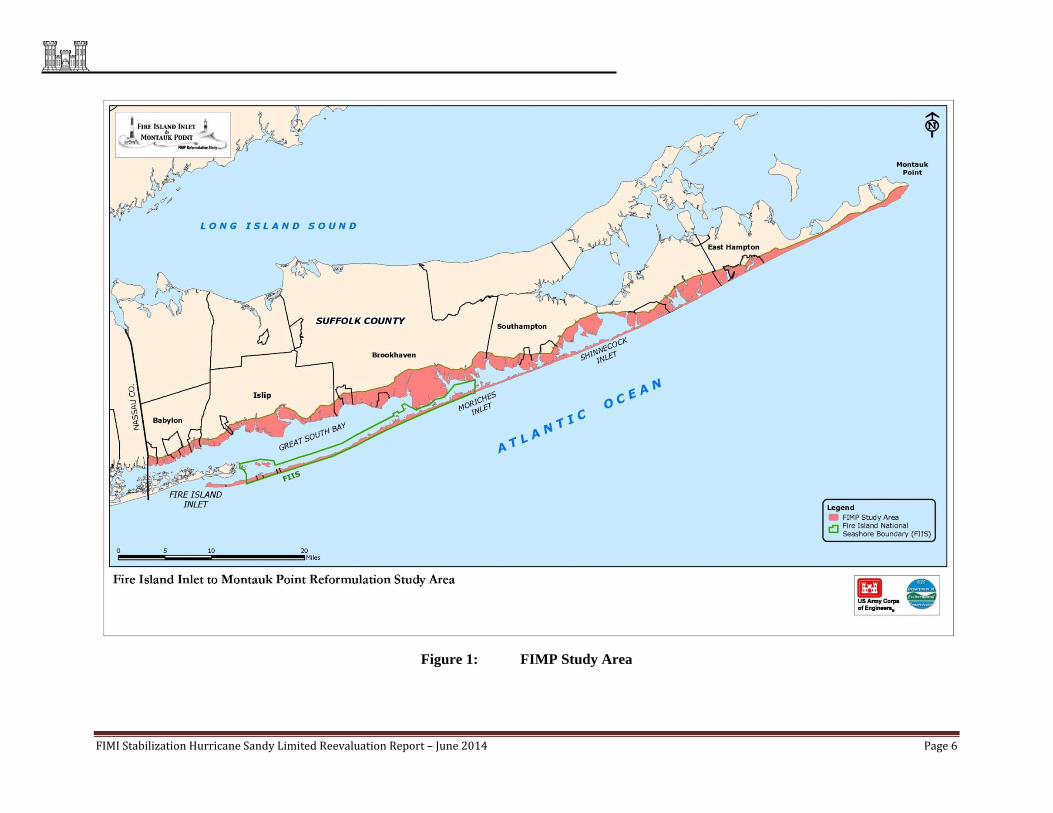
The congressionally authorized FIMP Study Area extends from Fire Island Inlet east to Montauk Point along the Atlantic Coast of Suffolk County, Long Island, New York. The study area includes the barrier island chain from Fire Island Inlet to Southampton, inclusive of the Atlantic Ocean shorelines and adjacent back-bay areas along Great South, Moriches, and Shinnecock Bays. The FIMP study area also includes Atlantic Ocean shoreline of Long Island from Southampton to Montauk Point. New York State Route 27 (the landward limit of the FIMP Study Area) runs east to west extending approximately 120 miles from Interstate 278 in Brooklyn to Montauk Point State Park on Long Island. Its two most prominent components are Sunrise Highway and Montauk Highway. Every town on the South Shore of Long Island is accessible through Sunrise Highway.
A total of 83 miles of Atlantic Ocean shoreline and over 200 miles of estuarine shorelines lie within the FIMP study area. The study area is shown in Figure 1.
This overall FIMP study area consists of a complex mosaic of ocean fronting shorelines, barrier islands, tidal inlets, estuaries, and back-bay mainland area. It functions as an interconnected system driven by large scale coastal processes with respect to hydrodynamic and sediment exchange that support diverse biological and natural resources.
1.2.2 Fire Island Inlet to Moriches Inlet
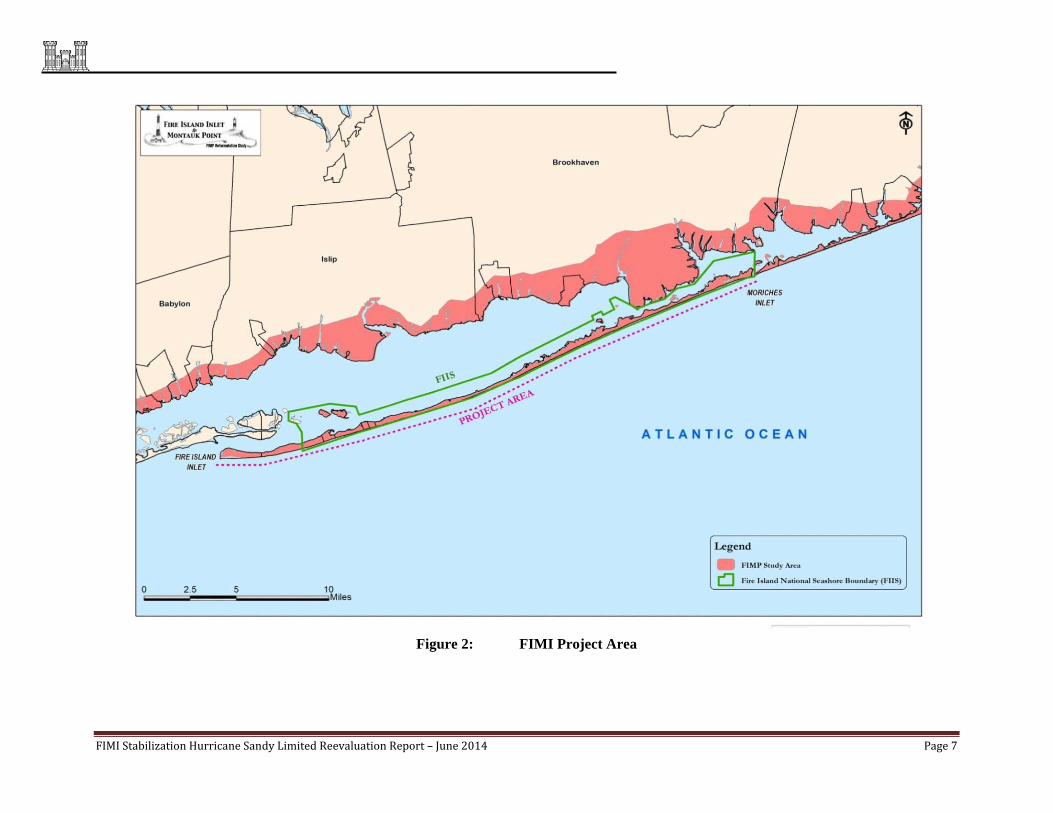
The Fire Island to Moriches Inlet (FIMI) project includes one reach within the overall FIMP project area. This HSLRR describes the immediate actions necessary for the FIMI barrier island.
Fire Island extends approximately 31 miles east from Fire Island Inlet to Moriches Inlet. Fire Island Inlet and Moriches Inlet are Federal navigation channels that connect the ocean and the bays. Beaches along the barrier island chain are generally characterized by a well-defined dune system with crest elevations ranging from +6 to +40 ft NGVD. Beach berm widths vary, ranging from approximately 30 feet to 150 feet, with average beach berm elevations of approximately +6 to +10 ft NGVD.
Fire Island includes the Fire Island National Seashore (FIIS), Robert Moses State Park and Smith Point County Park, which is included in the Fire Island National Seashore Boundary. The FIIS is approximately 26 miles long, including the 7-mile long Otis Pike Wilderness Area. The mission statement of the National Park Service (NPS) for the FIIS is to preserve natural processes and protect ecological resource such as open coast, intertidal and back-bay habitats and maritime forest. The FIMI study area also includes portions of the Towns of Babylon, Islip and Brookhaven, as well as two incorporated Villages. Of the buildings within the study area, including the back-bay area, more than 9,000 fall within the modeled 100-yr floodplain (storm with a 1% probability of occurring in any given year). The FIMI project area is shown in Figure 2.
Fire Island National Seashore
Fire Island National Seashore (FIIS) was established by Public Law 88-587 on September 11, 1964, and placed under the jurisdiction of the DOI, National Park Service. FIIS encompasses much of Fire Island, with only Robert Moses State Park on the far western end of the barrier island excluded, and represents 26 miles of the approximately 31 miles of Atlantic Ocean shoreline under consideration in this HSLRR

FIMIStabilizationHurricaneSandyLimitedReevaluationReport–June2014 Page5
for the FIMI project. The boundaries of the seashore extend 1,000 feet into the Atlantic Ocean and 4,000 feet into the Great South and Moriches Bays. The islands and marshlands adjacent to Fire Island are also included in FIIS. A General Management Plan (GMP) and the Final EIS on the General Management Plan were accepted in 1978, and have served as the basis for park management. The GMP is currently under revision, but not yet finalized.
The management strategy for the FIIS recognizes that significant areas of shorelines and back lands on Fire Island have been affected by human manipulation and population growth and now support stable communities. NPS policy directs that “Natural shoreline processes (such as erosion, deposition, dune formation, overwash, inlet formation, and shoreline migration) will be allowed to continue without interference. Where human activities or structures have altered the nature or rate of natural shoreline processes, the Service will, in consultation with appropriate state and federal agencies, investigate alternatives for mitigating the effects of such activities or structures and for restoring natural conditions. Intervention in natural geologic processes will be permitted only when
directed by Congress; necessary in emergencies that threaten human life and property; there is no other feasible way to protect natural resources, park facilities, or historic properties; intervention is necessary to restore impacted conditions and processes, such as restoring habitat
for threatened or endangered species. The Wilderness Act, which was passed by Congress on September 3, 1964, established the National Wilderness Preservation System. The Otis G. Pike High Dunes Wilderness Areas was established on December 20, 1980 under Public Law 95-585 and comprises 1,360 acres of the FIIS, the only federal wilderness area in New York State. The Wilderness Area encompasses 6 miles of alongshore distance immediately west of Smith Point Park. The cross-shore extent of the wilderness boundaries extend from the seaward toe of the dune to the bay shoreline. The Wilderness Management Plan for FIIS was accepted by the Secretary of the Interior in November 1983 and governs activities in the Wilderness Area.
The Fire Island Light Station Historic District is located at the west end of the FIIS. Established in 2010, the District expanded the original Fire Island Light Station National Register property boundaries to include the Fire Island Light Station, consisting of the present Lighthouse, the Radio Compass Station, the First Lighthouse Foundation, Keeper’s Quarters and the Old House, to incorporate the contributing landscape features of Burma Road, historic pathways from the Light Station to the shoreline, and the surrounding coastal grasslands, thicket zones and upper beach and dune vegetation. Significant views contributing to the historic district include the view to and from the Fire Island Light Station (NPS 2004).
The authorizing law for the Fire Island National Seashore also contains specific language that requires that any plan for shore protection within the boundary of Fire Island National Seashore be mutually acceptable to with the Secretary of the Interior and the Secretary of the Army, as a requirement for the project to be implemented.
FIMIStabilizationHurricaneSandyLimitedReevaluationReport–June2014 Page6
Figure 1: FIMP Study Area
FIMIStabilizationHurricaneSandyLimitedReevaluationReport–June2014 Page7
Figure 2: FIMI Project Area
FIMIStabilizationHurricaneSandyLimitedReevaluationReport–June2014 Page8
1.3 Study Authority
The Fire Island Inlet to Montauk Point (FIMP), NY, Combined Beach Erosion Control and Hurricane Protection Project was originally authorized by the River and Harbor Act of 14 July 1960 in accordance with House Document (HD) 425, 86th Congress, 2d Session, dated 21 June 1960, which established the authorized overall FIMP project. The authorized project provides for beach erosion control and hurricane protection along five reaches of the Atlantic Coast of New York from Fire Island Inlet to Montauk Point by widening the beaches along the developed areas to a minimum width of 100 feet, with an elevation of 14 feet above mean sea level, and by raising dunes to an elevation of 20 feet above mean sea level, from Fire Island Inlet to Hither Hills State Park, at Montauk and opposite Lake Montauk Harbor. This construction would be supplemented by grass planting on the dunes, by interior drainage structures at Mecox Bay, Sagaponack Lake and Georgica Pond and the construction of up to 50 groins, and by providing for subsequent beach nourishment for a period of ten years, as amended.
This authorization has been modified by Section 31 of the Water Resources Development Act (WRDA) of 1974 (P.L. 93-251), and Sections 103, 502, and 934 of the WRDA of 1986 (P.L. 99-662), which principally impact cost-sharing percentages and the period of renourishment. The project is also presented in this report considering the cost-sharing provisions within Public Law (PL) 113-2 of January 29, 2013, Disaster Relief Appropriations. The initial construction cost in accordance with the provisions of P.L. 113-2 is 100% Federal. PL 113-2 states that ‘the completion of ongoing construction projects receiving funds provided by this division shall be at full Federal expense with respect to such funds.
The authorized project was developed and implemented along five reaches. These reaches are used in the description of the implementation of the project, and are as follows:
Reach 1 – Fire Island Inlet to Moriches Inlet (FIMI)
Reach 2 – Moriches Inlet to Shinnecock Inlet
Reach 3 – Shinnecock Inlet to Southampton
Reach 4 – Southampton to Beach Hampton
Reach 5 – Beach Hampton to Montauk Point
1.4 Study History 1.4.1 1960’s Project Implementation Following the original project authorization in 1960, the preparation of a series of design memoranda (reports) covering the entire project along the South Shore of Long Island from Fire Island Inlet to Montauk Point, New York was planned. General Design Memorandum (GDM) No. 1, covering the portion of the project between Moriches and Shinnecock Inlets, was prepared and approved by the Chief of Engineers on 9 January 1964, and recommended improvements including 13 of the 23 groins authorized for construction in this portion. Local interests objected to the placement of dune and beachfill concurrently with groin construction. Therefore, the plan included initially constructing eleven groins in Reach 2 and two groins in Reach 4, with beach fill to be added as necessary but not sooner than 3 years after groin completion. The need for, and the design of, the two groins at East Hampton, in the vicinity of Georgica Pond (Reach 4), was addressed in a special report of design memorandum scope dated July 1964. Construction of 11 groins in Reach 2 was completed in September 1966. Construction of two groins in Reach 4 was completed in September 1965.

FIMIStabilizationHurricaneSandyLimitedReevaluationReport–June2014 Page9
In the years following construction of the eleven groins in Reach 2, erosion was evident in the area west of the eleven groins. In February 1969, Supplement No.1 to GDM No. 1 (Moriches to Shinnecock Reach) was prepared. That document recommended the construction of four more groins and placement of beach fill backed by a dune at an elevation of 16 ft above mean sea level (M.S.L.) in the 6,000 ft section of beach west of the 11 groin field. The four new groins were filled with 1.95 million cubic yards of sand to construct a beach and dune. This groin construction was completed in July 1970, bringing the total number of groins in Reach 2 to fifteen. Dune and beach fill was placed between October 1969 and October 1970.
1.4.2 Renewed Interest in 1978
Because of renewed interest by the New York State Department of Environmental Conservation (NYSDEC), an EIS was prepared in 1978 for the FIMP study area. The Council on Environmental Quality (CEQ) indicated that the plan formulation did not address all alternatives or adequately assess their impact. The CEQ further indicated that the entire study area should be treated as a system. The USACE concurred and directed a project reformulation. In 1980, a plan of study for project reformulation was approved by the Chief of Engineers and initiated shortly thereafter. The study was halted in 1984 due to an issue regarding the cost sharing requirements for periodic renourishment. NYSDEC withdrew its support for the project until a Congressional change was made to the authorization regarding periodic renourishment. 1.4.3 Reformulation Efforts, 1994
The cost sharing issue, including periodic renourishment, was resolved with the WRDA of 1986, in which cost sharing provisions provided for 70 percent Federal funding for periodic nourishment of continuing construction at Westhampton Beach for a period of 20 years. With this resolution, the State was willing to participate in a plan for Reach 2 (Westhampton Beach). In light of the State of New York's willingness to participate in a plan for this reach, the most critically eroded of the overall study area; the USACE resumed the efforts of the Reformulation Study in 1994. The USACE, as requested by Congressional and local interests, was charged to evaluate the feasibility of interim projects which could be implemented pending completion of the Reformulation Study. Several interim projects were considered for sections of the study area including a Breach Contingency Plan (BCP) designed to achieve breach closure within 3 months. The Westhampton Interim Project, which was already under study prior to the breach in December 1992, culminated in a Technical Support Document for Westhampton which was finalized in July 1995. That report demonstrated the feasibility of this interim project by evaluating the project costs and benefits, and comparing it to the authorized plan to establish that the interim plan was within the envelope of a larger (potentially National Economic Development - NED) plan, which would provide greater net excess benefits than the proposed interim plan. The report identified a plan to provide interim protection to the Westhampton Beach area west of Groin 15 and affected mainland communities north of Moriches Bay. The project provides for a protective beach berm 90 feet wide and a dune of +15 ft NGVD1, tapering of the western two existing groins (groins 14 and 15) and construction of an intermediate groin (groin 14a)
1 National Geodetic Vertical Datum of 1929 (NGVD29 or NGVD) is approximately 1.06 feet higher than North American Vertical Datum of 1988 (NAVD88 or NAVD) within the FIMP study area.

FIMIStabilizationHurricaneSandyLimitedReevaluationReport–June2014 Page10
between these two. The project also includes periodic nourishment, as necessary to ensure the integrity of the project design, for up to 30 years, until 2027. Beachfill for this interim project also includes placement within the existing groin field to fill the groin compartments and encourage sand transport to the areas west of groin 15. The interim plan was determined to be in the Federal interest to provide protection until the findings of the FIMP reformulation effort are available. Initial construction of the project was completed in December 1997. The interim project has been subsequently renourished in 2001, 2004 and 2008, and has required less sand at longer intervals than was estimated when designed. In 1996, the USACE Headquarters (HQUSACE) approved a Breach Contingency Plan (BCP) which provides a rapid response to close breaches along the barrier islands within the authorized project area. However, this is only a response action to restore the barrier island to an elevation of +9 feet NGVD in order to provide a limited level of protection and to provide the basis for future efforts (a 5-year level of protection). A barrier island where the BCP is to be implemented is characterized by low-lying areas likely to be overwashed and subsequently breached again during relatively minor events. In parallel with these interim efforts, the Reformulation Study continued with a goal to identify a long-term (50-year) plan to manage the risk of storm damages, while maintaining, enhancing or restoring the existing environment. In order to address the data collection and analysis challenges of the study area the Interagency Reformulation Group (IRG) was assembled, including representatives from the USACE, New York State, the Cooperating Agencies of National Park Service and U.S. Fish and Wildlife Service, as well as representatives from National Marine Fisheries Service, and the Environmental Protection Agency. A number of Technical Management Groups (TMG’s) were also established, responsive to this IRG, who were responsible for the scoping, and reviewing of specific technical issues, and included members from the agencies, non-governmental organizations, and academics.
1.5 Non-Federal Partners and Stakeholders
The non-Federal partner for the overall FIMP project and also for this FIMI Stabilization project is the New York State Department of Environmental Conservation (NYSDEC). In addition to the non-Federal partner, there has been extensive coordination with study stakeholders including:
Department of the Interior; U.S. National Parks Service; U.S. Fish and Wildlife Service U.S. Environmental Protection Agency NOAA/National Marine Fisheries Service Federal Emergency Management Agency New York State Department of State; Emergency Management Office Suffolk County Associated Towns and Villages
NPS is a land owner on Fire Island, and Suffolk County is both a landowner for Smith Point County Park and a sub-sponsor for the project. The role of the Fire Island National Seashore is addressed in the prior section. Specific roles of the regulatory agencies are described in the Environmental Assessment.
FIMIStabilizationHurricaneSandyLimitedReevaluationReport–June2014 Page11
2.0 PROJECT AREA VULNERABILITY
2.1 Storm History
A detailed storm history is provided in Appendix A. The following is a discussion of the most recent storms impacting the area.
This history and the recent experience with Hurricane Sandy illustrate the potential for storm risk now and in the future, and illustrate the immediate need for action to address vulnerable areas on Fire Island. Severe coastal storms in the last few decades have caused significant damage and resulted in the barrier island even more susceptible to overwashes and breaching.
The December 1992 Nor’easter resulted in significant damages along barrier islands and back-bays. Overwashes of the island were also observed along western Fire Island, at Smith Point County Park, Old Inlet. On the mainland at Mastic Beach the water reached 2 to 4 feet deep in the streets as a result of back-bay flooding from the breaches.
The March 1993 (“Storm of the Century”) resulted in severe wave action that scoured the beaches along the entire barrier island. The dunes were overtopped, lowering the height of the dunes. It was reported that homes were destroyed or severely damaged in several communities on Fire Island and in the back-bay.
The most recent major storm events to impact the project area are Hurricane Irene (2011) and Hurricane Sandy (2012). Hurricane Irene caused coastal flooding along Fire Island as water levels reached 7.0 feet NAVD 88 at Sandy Hook, NJ. Measured wave heights 15 nautical miles offshore exceeded 25 feet during the peak of the storm.
Hurricane Sandy made landfall near Atlantic City, NJ on October 29th with wind speeds equivalent to a Category 1 hurricane. The orientation of Hurricane Sandy’s wind field prior to landfall caused strong winds to blow across the continental shelf towards New York. Because the peak storm surge was in phase with the peak high tide, storm-induced flooding was exacerbated. Hurricane Sandy’s unusually large diameter resulted in long fetch lengths generating extreme wave heights at the study area. These three factors (track, timing, and extraordinary size) resulted in record water levels and wave heights in the New York Bight. The maximum water level at the Battery, NY is estimated to have reached elevation 11.6 feet NAVD88 exceeding the previous record by over 4 feet (USACE, 2013).
A team from the USGS went to Fire Island before and after Hurricane Sandy to survey the beach and assess morphological changes. The following excerpt from their field report provides a summary of the impacts along Fire Island immediately after the storm (USGS, 2012):
“The impacts to the island were extensive. The majority of oceanfront homes in the communities within Fire Island National Seashore were damaged or destroyed. Enormous volumes of sand were carried from the beach and dunes to the central portion of the island, forming large overwash deposits, and the island was breached in multiple locations. With few exceptions, lower-relief dunes were overwashed and flattened. High dunes, which are more commonly found within undeveloped portions of the island, experienced severe erosion and overwash. The elevation of the beach was lowered and the dunes form vertical scarps where they survived.”
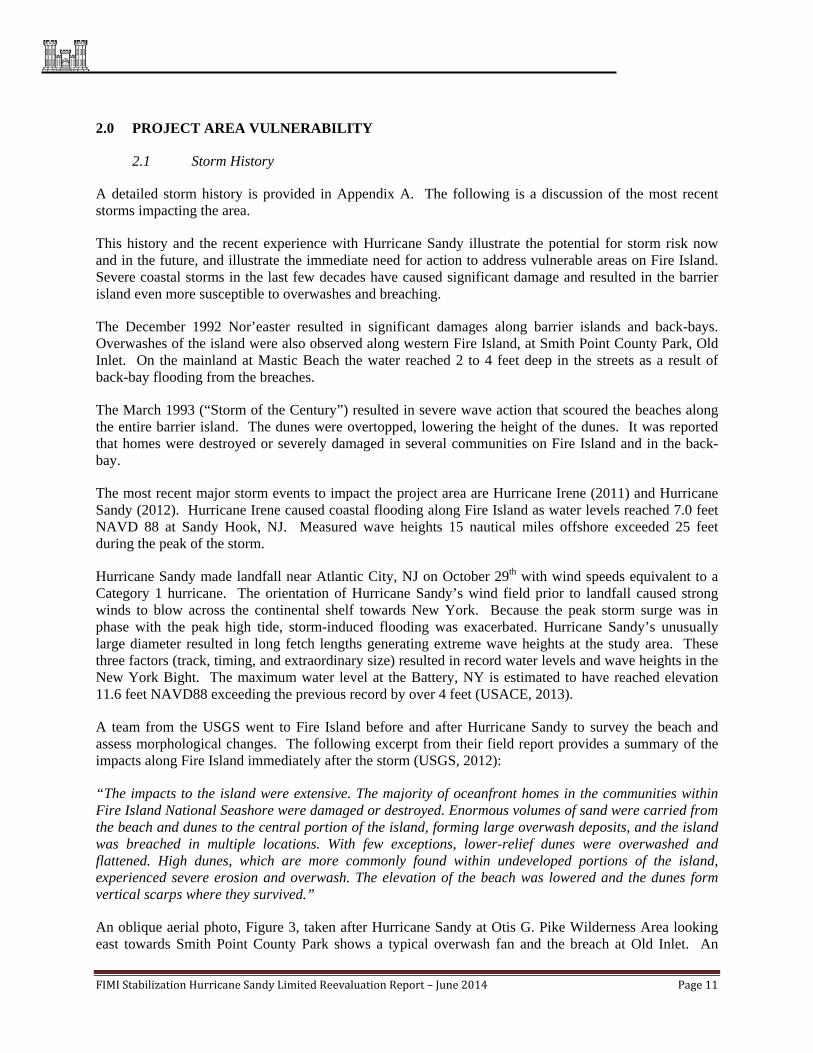
An oblique aerial photo, Figure 3, taken after Hurricane Sandy at Otis G. Pike Wilderness Area looking east towards Smith Point County Park shows a typical overwash fan and the breach at Old Inlet. An

FIMIStabilizationHurricaneSandyLimitedReevaluationReport–June2014 Page12
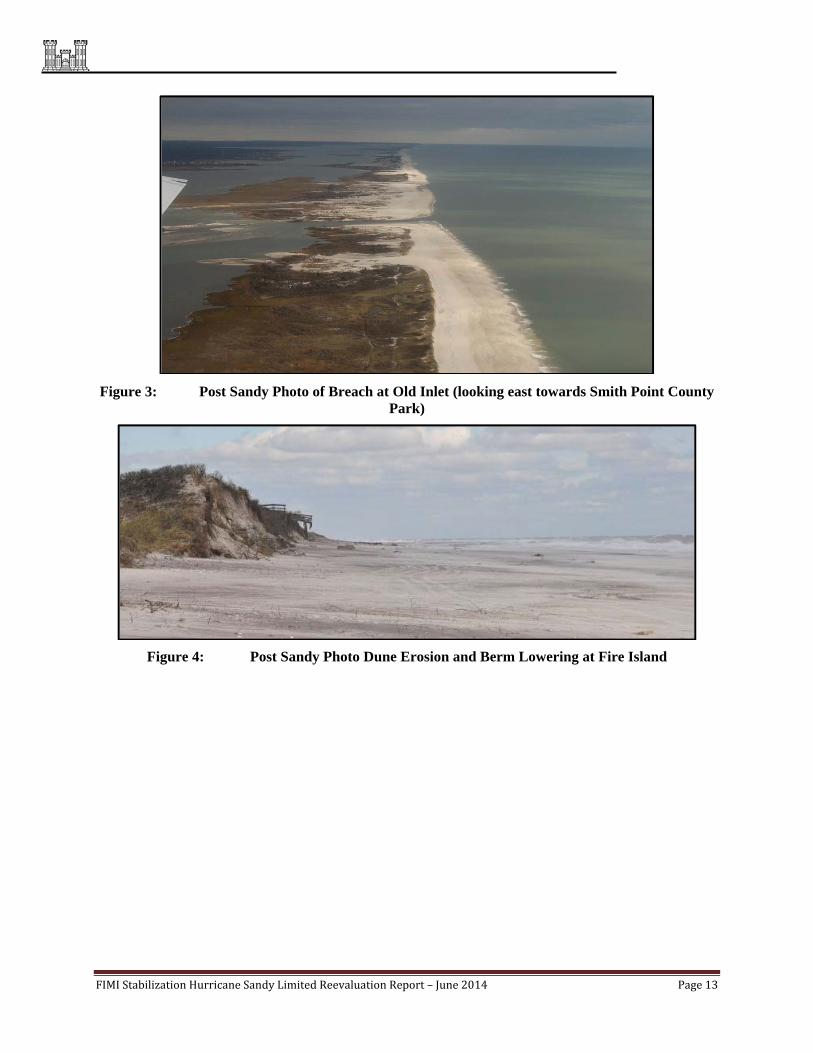
example of dune scarping and berm lowering during Hurricane Sandy is shown in Figure 4. Pre- and post-Sandy aerial photos at Ocean Beach show an example of a location where the dunes were overwashed and flattened as well as the extensive damage to ocean front structures as shown in Figure 5. Another example dune flattening and severe damage is provided in Figure 6 at Davis Park.
Two of the breaches, Smith Point County Park and Cupsogue (just east of Moriches Inlet), were closed shortly after the storm following the protocol established by the Breach Contingency Plan. A third breach at Old Inlet within the boundaries of the Otis G. Pike Wilderness Area on Fire Island has not been closed, and remains a relatively stable small tidal inlet. It continues to be monitored by the National Park Service, SOMAS, and USGS.
Additional storm history for the study area is located in Appendix A.
FIMIStabilizationHurricaneSandyLimitedReevaluationReport–June2014 Page13
Figure 3: Post Sandy Photo of Breach at Old Inlet (looking east towards Smith Point County Park)
Figure 4: Post Sandy Photo Dune Erosion and Berm Lowering at Fire Island

FIMIStabilizationHurricaneSandyLimitedReevaluationReport–June2014 Page14
Figure 5: Pre- and Post-Sandy Photo at Ocean Beach

FIMIStabilizationHurricaneSandyLimitedReevaluationReport–June2014 Page15
Figure 6: Post-Hurricane Sandy Photo at Davis Park
FIMIStabilizationHurricaneSandyLimitedReevaluationReport–June2014 Page16
3.0 EXISTING CONDITIONS
This section provides a detailed summary of the natural and human environment within the FIMI study area and serves as a reference point to understand future without project condition and impacts associated with project alternatives. More detailed physical existing conditions information pertaining to the overall FIMP study is included in Appendix B.
3.1 Barrier Island & Shorefront Geological Processes
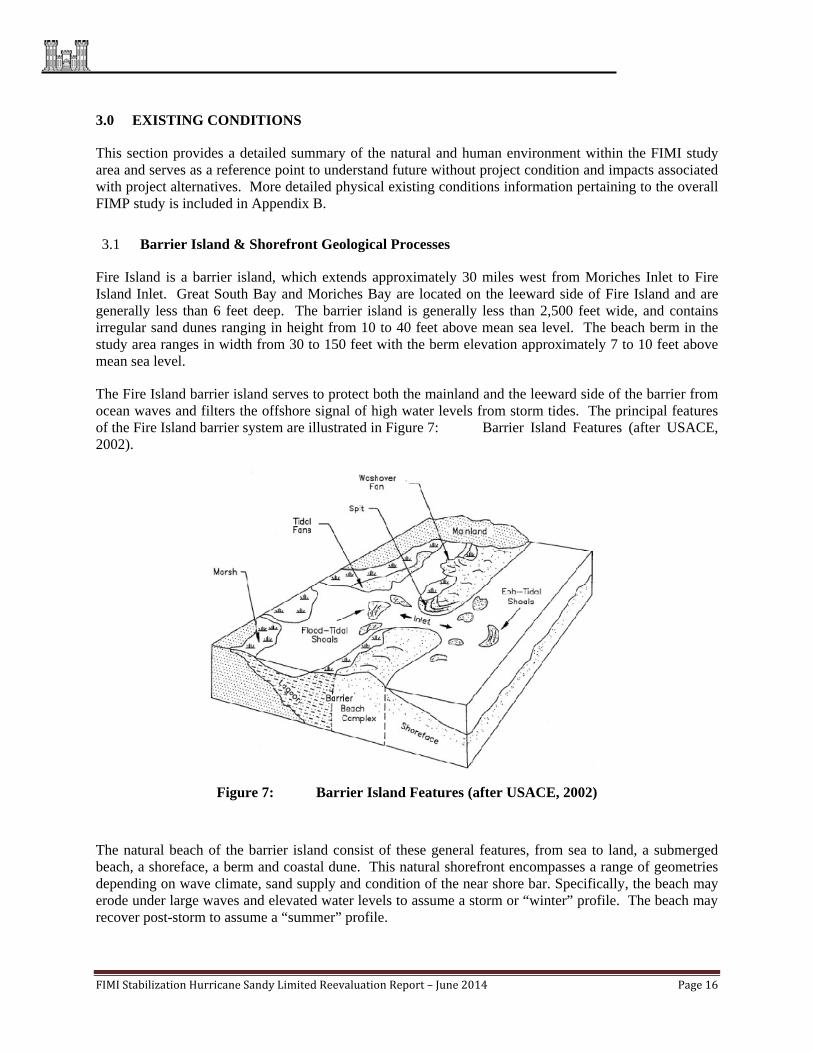
Fire Island is a barrier island, which extends approximately 30 miles west from Moriches Inlet to Fire Island Inlet. Great South Bay and Moriches Bay are located on the leeward side of Fire Island and are generally less than 6 feet deep. The barrier island is generally less than 2,500 feet wide, and contains irregular sand dunes ranging in height from 10 to 40 feet above mean sea level. The beach berm in the study area ranges in width from 30 to 150 feet with the berm elevation approximately 7 to 10 feet above mean sea level.
The Fire Island barrier island serves to protect both the mainland and the leeward side of the barrier from ocean waves and filters the offshore signal of high water levels from storm tides. The principal features of the Fire Island barrier system are illustrated in Figure 7: Barrier Island Features (after USACE, 2002).
Figure 7: Barrier Island Features (after USACE, 2002)
The natural beach of the barrier island consist of these general features, from sea to land, a submerged beach, a shoreface, a berm and coastal dune. This natural shorefront encompasses a range of geometries depending on wave climate, sand supply and condition of the near shore bar. Specifically, the beach may erode under large waves and elevated water levels to assume a storm or “winter” profile. The beach may recover post-storm to assume a “summer” profile.
FIMIStabilizationHurricaneSandyLimitedReevaluationReport–June2014 Page17
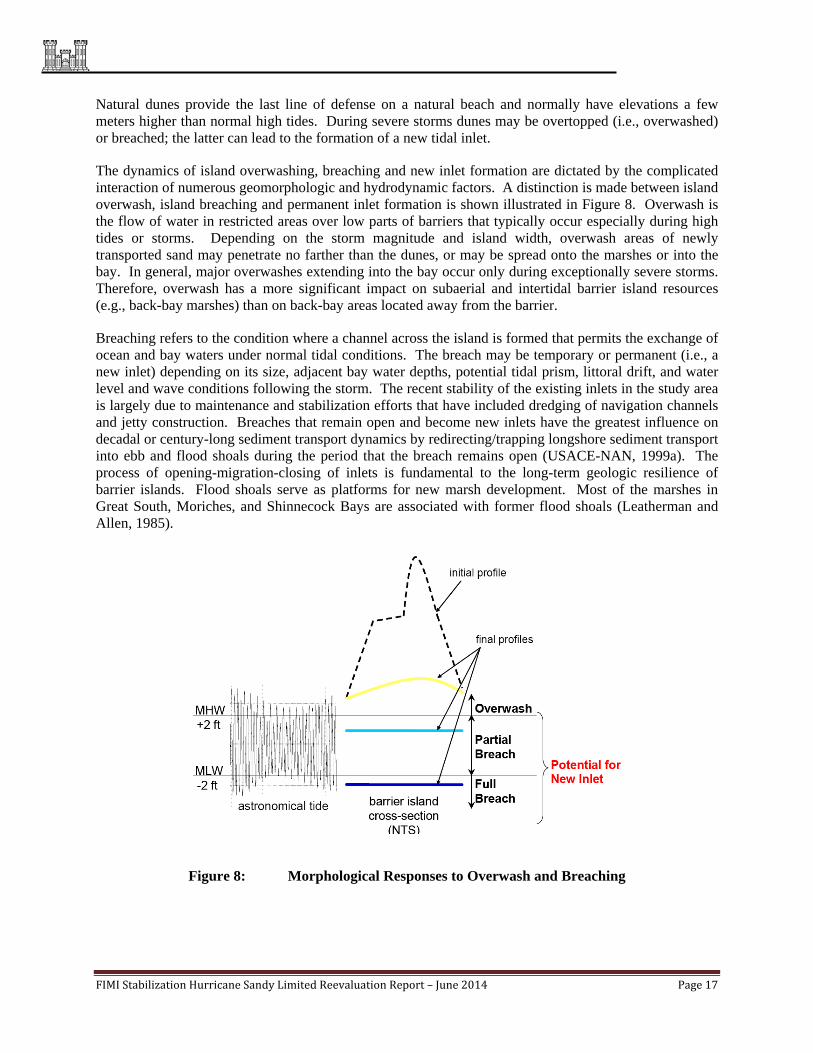
Natural dunes provide the last line of defense on a natural beach and normally have elevations a few meters higher than normal high tides. During severe storms dunes may be overtopped (i.e., overwashed) or breached; the latter can lead to the formation of a new tidal inlet.
The dynamics of island overwashing, breaching and new inlet formation are dictated by the complicated interaction of numerous geomorphologic and hydrodynamic factors. A distinction is made between island overwash, island breaching and permanent inlet formation is shown illustrated in Figure 8. Overwash is the flow of water in restricted areas over low parts of barriers that typically occur especially during high tides or storms. Depending on the storm magnitude and island width, overwash areas of newly transported sand may penetrate no farther than the dunes, or may be spread onto the marshes or into the bay. In general, major overwashes extending into the bay occur only during exceptionally severe storms. Therefore, overwash has a more significant impact on subaerial and intertidal barrier island resources (e.g., back-bay marshes) than on back-bay areas located away from the barrier.
Breaching refers to the condition where a channel across the island is formed that permits the exchange of ocean and bay waters under normal tidal conditions. The breach may be temporary or permanent (i.e., a new inlet) depending on its size, adjacent bay water depths, potential tidal prism, littoral drift, and water level and wave conditions following the storm. The recent stability of the existing inlets in the study area is largely due to maintenance and stabilization efforts that have included dredging of navigation channels and jetty construction. Breaches that remain open and become new inlets have the greatest influence on decadal or century-long sediment transport dynamics by redirecting/trapping longshore sediment transport into ebb and flood shoals during the period that the breach remains open (USACE-NAN, 1999a). The process of opening-migration-closing of inlets is fundamental to the long-term geologic resilience of barrier islands. Flood shoals serve as platforms for new marsh development. Most of the marshes in Great South, Moriches, and Shinnecock Bays are associated with former flood shoals (Leatherman and Allen, 1985).
Figure 8: Morphological Responses to Overwash and Breaching
FIMIStabilizationHurricaneSandyLimitedReevaluationReport–June2014 Page18
Sea Level Rise
By definition, sea level rise (SLR) is an increase in the mean level of the ocean. Eustatic sea level rise is a change in global average sea level brought about by an alteration to the volume of the world’s oceans. Relative sea level rise takes into consideration the eustatic increases in sea level as well as local land movements of subsidence or lifting. The historic sea level rise rate is approximately 0.0126 feet/year or about 1.3 feet/century. There are various projections of accelerated sea level rise, from 2.6 feet/century up to almost 5.4 feet/century. A significant increase in relative sea level could result in extensive shoreline erosion and inundation. Higher relative sea level elevates flood levels, and as a result, smaller, more frequent storms could result in flooding equivalent to larger less frequent storms. The more frequent flood events on top of higher sea level may affect more property, resulting in greater damages as sea level increases,
The current guidance (ER 1165-2-212) from the USACE states that proposed alternatives should be formulated and evaluated for a range of possible future eustatic rates of SLR. Three possible eustatic SLR rates, low, intermediate, and high, are provided in the guidance. These rates of rise correspond to 0.7 ft, 1.3 ft, and 2.7 ft over the 50 year period of analysis for the low, medium and high rates of relative sea level rise.
Offshore Sediment Characteristics
Since the 1960’s, efforts have been undertaken in the study area to identify locations offshore which contain sediment (sand) that would be a suitable source for beach nourishment. This includes considerations for compatibility to native beach grain size, the amount of volume available, environmental considerations, and distance to the project site. Twelve potential offshore sites and seven potential upland source sites were identified as possible sources for the beach nourishment measures (across the FIMP area). The specific results of the borrow area investigations for design purposes are included in the Borrow Area Appendix E.
Shoreline Changes
Historic Shoreline Rate-of-Change (SRC) values in the FIMP study are documented in Gravens et al. (1999), which examined three non-overlapping time intervals using available shoreline data sets. The first period, representative of the epoch prior to significant human influence on the barriers, is 63 years long (1870 to 1933). The second period, representative of initial development on the barriers and the initiation of human intervention with natural processes including inlet stabilization and significant beach fill placements, is approximately 46 years long (1933 to 1979). The third period, reflecting the beach nourishment practices, is approximately 15 years long (1979 to 1995). The Fire Island barrier has, in general, been eroding at a historically consistent rate of about 0.4 m/year (1.3 feet/year). Average shoreline recession has increased to 0.7 m/year (2.3 feet/year) over the last 15-year time interval studied by Gravens on Fire Island. It is important to note that these SRC values are average values for the entire 30-mile barrier island and that the standard deviation in the SRC is between 3 and 4 times larger than the mean. The comparatively large SRC standard deviation indicates significant variation in the shoreline change signal along Fire Island. The Back-Up Calculations Appendix includes more recent data on placed beachfill volumes from 2000 to 2009 and volumetric erosion rates (1998-2012 and 2009-2012) based on profile data collected in the communities. This data was primarily used to estimate future renourishment volumes (which will not be used in this FIMI project) and to support the beachfill diffusion analysis used to locate the fill baseline.

FIMIStabilizationHurricaneSandyLimitedReevaluationReport–June2014 Page19
Figure 7 in the Back Calculations Appendix shows the volumetric erosion rates from Fire Island Lighthouse Tract to Davis Park after removing placed beachfill volumes.
In relationship with shoreline change, Lentz, et al, 2013 examined three shoreline data sets (1969 Aerial Photography, 1999 and 2009 Lidar data). The analysis includes the influence of human modifications (beachfills) within the time periods to develop shoreline change rates.
Inlets
As presented previously, there are two inlets in the Project Area: Fire Island Inlet and Moriches Inlet, both of which are Federal navigation projects. Moriches and Fire Island inlets also increase the tidal prism and amplitude within the bays because the navigation channels are larger and more efficient than the unstructured tidal exchange. Both inlets allow the exchange of water, sediments, nutrients, planktonic organisms, and pollutants. These existing inlets contribute to flooding in the back-bay that occurs during storm events. They are exchanged between the open sea and the protected back-bays behind the barriers. The inlets play an important role in the regional sediment budget by either trapping sediment within its ebb and flood tidal shoals or bypassing sediment downdrift. Mature inlets with well-developed ebb and flood shoals are generally more efficient at bypassing sediment. The stabilization / jetties of the inlets act to confine flows within a relatively narrow area compared to natural inlets; they also act to deepen the inlet throat and shift the ebb tidal delta further offshore than a natural inlet. Accordingly, the inlets have acted to trap sand.
Existing Shore Protection Activities
In response to the storm history described in Chapter 2, a number of construction measures have been implemented within the FIMI project area to mitigate storm impacts. These include measures which have been implemented either as other Federal initiatives, State actions, or undertaken by local municipalities, taxing districts, or by individual homeowners. Collectively, these actions have had a dramatic influence on the functioning of the existing coastal system.
The following section provides a description of the major coastal engineering actions which have been undertaken in the project area, which shape the current conditions. This section focuses on the major constructed elements along Fire Island since these activities influence the functioning of the barrier island system and need to be accounted for in planning. This does not try to capture all of the local projects that have been constructed, or all of the activities that have taken place along the back-bay areas.
It is recognized that there have been significant activities undertaken in the backbay area. Much of the bay shoreline both on the north side of the barrier island and along the mainland shoreline has been bulkheaded or otherwise stabilized, with the exception of the remaining natural areas. There is also an extensive network of navigation channels in the bay systems that have been dredged and maintained. Additionally, in recent years, there have also been a number of home elevation programs that have been implemented under various programs.
Beachfill
Following the hurricane of 1938, there is a consistent record of beachfill activities undertaken in response to storm events. A large percentage of historical beachfill volumes have been placed adjacent to Fire Island and Moriches Inlet as a byproduct of inlet dredging. Following the 1962 nor’easter, USACE contracted the placement of 9,529 linear feet of dune and 37,000 linear feet of berm along Fire Island as
FIMIStabilizationHurricaneSandyLimitedReevaluationReport–June2014 Page20
part of the Disaster Recovery Operation (USACE, 1963). Beachfill projects were also undertaken by local communities at Point of Woods, Cherry Grove and Ocean Beach following 1962. It is estimated that a total of 6.9 million cubic yards of beachfill was placed along Fire Island from 1933-1989 (Gravens et al, 1999).
Since 1990, beachfill has been performed by the USACE adjacent to the inlets as a byproduct of inlet maintenance dredging, and by the local communities in response to storm events. In response to the storms in the 1990’s local communities placed approximately 1 million cubic yards of beachfill (CPE, 2013). In 1997 an additional 650,000 cubic yards of beachfill was placed by the communities in Fire Island Pines.
Two major beachfill projects were undertaken by local communities along Fire Island between 2000 and 2009. In 2003-2004 several communities in Fire Island placed approximately 1.28 million cubic yards of beachfill in Western Fire Island and Fire Island Pines, and in 2009 1.82 million cubic yards of sand was placed in eleven communities along Fire Island (CPE, 2013). In addition to these two major beachfill projects, 172,000 cy and 21,000 cy of sand were placed at Smith County Park and Davis Park respectively in 2007.
Ocean Beach Groins
Two shore perpendicular structures were constructed in the winter of 1970 within the Village of Ocean Beach, on Fire Island. Both groins are 200 feet long from landward crest to seaward crest, with the offshore portion about 85 feet of the total length. The groins were constructed in an area of higher erosion, to add stability to the ocean shoreline seaward of the Ocean Beach water tower and pumping stations (wells). Since this time, the water tower has been moved north in the Village, on Village owned land, however the three wells remain just landward of the eastern groin, within three village owned facilities. A separate Village maintenance facility is also located in the same Village property containing the wells.
Smith Point County Park Bulkhead
Following the storms of the early and mid-1990’s Suffolk County constructed a steel sheetpile bulkhead fronting the existing pavilion at Smith Point County Park. In the mid-1990’s conditions were such that the pavilion and its infrastructure were at risk to future damage. The structure was constructed in conjunction with a beachfill project, to protect the bulkhead. Following construction of the structure, a memorial for TWA Flight 800 (which crashed in the Atlantic Ocean off of Moriches Inlet in July 1996) was constructed. The memorial was located outside the alongshore extent of the sheetpile structure, and in a location vulnerable to erosion. In 2005, Suffolk County extended the sheetpile structure to provide protection inclusive of the memorial.
Fire Island Inlet
Fire Island Inlet is located at the western end of Fire Island and connects the Atlantic Ocean with Great South Bay. Available records indicate that Fire Island Inlet has existed continuously since the early 1700’s. The position of the inlet, however, has varied significantly over time and has migrated a total distance of about 5 miles from a point east of its present position between 1825 and 1940. Federal jetty construction at Democrat Point in 1941, as part of the Fire Island Inlet Navigation Project halted this westward migration. Due to chronic erosion on the western shore, modification of the Federal project was authorized in 1971 to provide for a sand bypassing system at Fire Island Inlet. Since this time, continued dredging of the inlet has been performed to both maintain a navigable channel, and to provide shore

FIMIStabilizationHurricaneSandyLimitedReevaluationReport–June2014 Page21
protection on the westerly, downdrift beaches and to protect the Ocean Parkway. Dredged material has also been placed in Robert Moses State Park to alleviate chronic erosion.
Moriches Inlet
Moriches Inlet is located along the Atlantic Coast in the Town of Brookhaven and connects the Atlantic Ocean with Moriches Bay through the narrow barrier island. Available maps and records indicate that numerous inlets to Moriches Bay have existed during the last several centuries. The present Moriches Inlet was opened during a storm on 4 March 1931. The inlet migrated about 3,500 feet west from 1931 to 1947 at which time its migration was halted when non-federal interests constructed a long stone revetment on its western bank in an effort to stabilize the Inlet. During a storm on 15 May 1951 Moriches Inlet closed as a result of reduced hydraulic efficiency. Non-federal interests constructed jetties on both sides of the inlet from 1952 to 1953 and the inlet was reopened during construction by a storm on 18 September 1953.
In 1983, the USACE completed a General Design Memorandum for Moriches Inlet Navigation, which recommended Federal participation in inlet improvements including the following: (1) a 100-foot wide by 6-foot deep inner channel extending from the Intercoastal Waterway to Moriches Inlet, (2) an outer channel extending from the ocean to the inner channel with a width of 200 feet, a low water depth of 10 feet and an advanced maintenance deposition basin. Construction activities were completed by 1986, and since this time the inlet has been maintained as a Federal Navigation Channel.
3.1.2 Estuarial (Bayside) System Conditions
The project area estuarial system is comprised of Great South Bay and Moriches Bay and is connected to the Atlantic Ocean through Fire Island and Moriches Inlets respectively. The bays are also connected to each other through narrow tidal waterways of the Long Island Intracoastal Waterway (ICW). A summary of hydrodynamic and water quality conditions is presented in the following paragraphs.
Hydrodynamics and Hydrology
Bay water levels are generally controlled by tidal elevations at Fire Island and Moriches Inlets. The uniformity of tide ranges throughout both Great South and Moriches Bays is a characteristic of the so-called “pumping mode” of inlet-bay hydraulics where water levels within an embayment remain nearly horizontal during ebb and flood tide phases. Bay tide amplitudes are generally less than ocean tides and lag the ocean tides. The difference between ocean and bay tides is particularly significant within eastern Great South Bay. The tidal range at the ocean end of Fire Island Inlet is approximately 4.0 feet, whereas the average tidal range in the bay is approximately 1 foot. The tidal range at the ocean side of Moriches Inlet is approximately 3.4 feet; the average tidal range within the bay is estimate to be 2 feet (NOAA Technical Memorandum NOS CS 21, Yang, et al. 2010). Maximum current velocities occur near the inlet mouth, where values exceed 4 feet/second. Peak velocities in the bays away from the inlets are typically less than 1 feet/sec. Additional details for the hydrodynamics and hydrology are included in Appendix B of this report.

FIMIStabilizationHurricaneSandyLimitedReevaluationReport–June2014 Page22
3.2 Socio-Economic Conditions
The following details the development patterns and land use on Fire Island and the back-bay areas of Great South Bay and Moriches Bay.
Intensive human habitation was not documented on Fire Island until the second half of the 19th century. The establishment of permanent communities began shortly before the 20th century. The first of these, the Point O’ Woods Association, began in 1898. Other communities quickly followed, although the youngest community, Dunewood, was formed in 1958. The number of buildings and the summer population began to grow. According to an analysis of aerial photographs, approximately 950 structures were found on Fire Island in 1928. This number grew slowly to 1,260 in 1955, and the number of structures had doubled to about 2,400 in 1962. The number of structures reached about 3,500 in the 1970’s and now stands at approximately 4,150. All of the communities on Fire Island have greatly increased populations during the summer months from an influx of day visitors, short-term renters, and seasonal homeowners.
Land Use and Management
Land use differs throughout the study area. The FIMI barrier island study area is generally more developed to the west in the communities of Saltaire, Ocean Beach, Cherry Grove and Fire Island Pines with no development in the middle, wilderness area. Smith Point County Park is located on the easternmost side of the FIMI project area, while Robert Moses State Park is located on the westernmost end of Fire Island. State coastal policies support protecting natural protective features, siting buildings and development in places that minimize risk, and avoiding actions that impair natural sediment processes. Additional Land Use and Management is included in Section 10.4 of this Report and Appendix J.
There is significant variation in the per capita and family income among study area towns as shown in Table 1. Per capita income in most of the study area is slightly above the state average. Median family incomes in the study area towns are all higher than the median family income for New York State.
Table 1: Per Capita and Family Income
Location Per Capita Income Median Family Income
New York State $31,796 $69,202
Suffolk County $36,588 $99,474
Town of Babylon $31,255 $90,853
Town of Islip $31,493 $92,482
Town of Brookhaven $34,201 $97,520
Source: American Community Survey 2007-2011 5-year Estimate
Economy
The largest segment of the study area population is employed in the education, health and social services sector. Retail trade, professional/management services and manufacturing also employ a large portion of the population. In the eastern end of the study area more people are employed in the agricultural field, while fewer are employed in the retail and manufacturing sectors.

FIMIStabilizationHurricaneSandyLimitedReevaluationReport–June2014 Page23
Transportation
The Robert Moses Causeway provides access over Great South Bay to Captree State Park and then over the Fire Island Inlet to Robert Moses State Park. The William Floyd Parkway (County Route 46) provides access over Narrow Bay to Smith Point County Park and the FIIS Smith Point Visitor Center.
Private transportation is the predominant method of access to Fire Island, with approximately 5.1 million visitors (70 percent of total visitors) accessing the island by automobile. 3.8 million visitors travel to Robert Moses State Park annually and over 1.5 million visitors travel to Smith Point County Park on an annual basis. Private access is also provided by boat, water taxi, bicycle and seaplane. Ferries account for approximately 1.2 million visitors travel to Fire Island annually.
On Island Circulation
The only vehicular traffic currently on Fire Island is at the western and eastern ends of the island. Vehicular access to Fire Island is allowed at Robert Moses State Park and Smith Point County Park; other areas on the island are vehicle accessible only by a special permit issued by the town. Due to the lack of roadway infrastructure and prohibition of cars, travel around the island is an access issue. While on the island, day visitors can venture to neighboring communities by water taxi or on foot. Vehicles without a special permit are prohibited in the Fire Island National Seashore.
Water taxis provide convenient lateral transportation between the communities. The sandy “Burma Road” provides a route for construction, utility, and pedestrian traffic between the communities. Segments of Burma Road are difficult for pedestrian transit because of the large distance separating several communities. In addition, the sandy composition of Burma Road makes bicycle use difficult.
3.3 Environmental Resources
The study area is a complex array of marine, coastal and estuarine ecosystems expected in a barrier island environment. There are 25 Federally/State-listed species in the study area including sturgeon, two mammals, 10 reptiles, 10 birds, and three plant species.
Resource agency coordination has been conducted and roles/actions taken may be found in Table 11 of the attached Environmental Assessment.
3.3.1 Marine Offshore Ecosystem
The Marine Offshore Ecosystem includes the Marine Offshore habitat, which consists of the deeper water areas of the Atlantic Ocean within the study area. The borrow areas are located in the Marine Offshore habitat.
3.3.2 Natural Resources
Physical Description. The Marine Offshore habitat is an oceanic area with water depths ranging from 10 to 30 m. The habitat is relatively homogeneous throughout the entire southern Long Island coastline from Rockaway Inlet, through Fire Island National Seashore and east to Montauk Point. The habitat includes pelagic and benthic zones which support different assemblages of organisms. The pelagic zone refers to the water column and organisms within it, whereas the benthic zone refers to the bottom or substrate and includes sediments and other material present on the ocean floor. The benthic zone

FIMIStabilizationHurricaneSandyLimitedReevaluationReport–June2014 Page24
substrate is primarily sand within the study area. Through geo-morphological analyses, sand suitable for beach nourishment has been identified at nine locations. These locations, referred to as borrow areas, are located within the Marine Offshore habitat and are less than one mile offshore. Three of the identified borrow areas will be utilized for the FIMI project. With the exception of sea turtles and birds, all biota associated with the Marine Offshore habitat are exclusively aquatic. Aquatic biota that utilize the Marine Offshore habitat primarily include primarily fish and benthic invertebrates, as well as marine mammals. Marine Invertebrates. Marine benthic invertebrates are bottom-dwelling species that can be grouped into two categories: infaunal (i.e., benthic invertebrates living within the substrate) and epifaunal (i.e., benthic invertebrates living on the surface of the substrate). Benthic invertebrates are found in the substrate of potential borrow areas. Polychaetes (segmented worms with bristles) are an important component of the benthic infaunal community; epifaunal biota include amphipods, crabs, horseshoe crabs (Limulus polyphemus), echinoderms (e.g., sea stars, sand dollars), and bivalves (e.g., surf scallops [Aequipecten sp.], Atlantic surfclams [Spisula solidissima]). Marine invertebrates provide an important food source for bottom feeding fish and also include species that are commercially and recreationally important. The benthic invertebrates of the Marine Offshore habitat include a variety of taxa common to generally clean, well-oxygenated, coarse sandy marine habitats. Finfish. The Marine Offshore habitat supports a variety of pelagic and benthic finfish, some of which are recreationally or commercially important. The pelagic zone contains few truly resident fish populations; rather it is dominated primarily by a variety of migratory and highly mobile species including hake (Urophycis sp.), scup (Stenotomus chrysops), Atlantic butterfish (Peprilus triacanthus), bluefish (Pomatomus saltator), and striped bass (Morone sexualities). Similarly, benthic fish species that occur in the Marine Offshore habitat are largely mobile and migratory; important benthic species include both summer flounder (Paralichthys dentatus) and winter flounder (Pseudopleuronectes americanus). Marine Mammals. The pelagic zone also provides habitat for marine mammals. The harbor seal (Phoca vitulina), which is listed as a protected species by New York State is the only marine mammal expected to frequent the Marine Offshore habitat within the study area. Marine mammals such as the right whale (Eubalaena glacialis; Federally Endangered) and Pygmy- sperm whale (Kogia breviceps) may also use this habitat from time to time. Gray seals (Halichoerus grypus) may also be found in this habitat.
Reptiles. Several species of sea turtles, including Kemps ridley (Lepidochelys kempii; State and Federally Endangered), green (Chelonia mydas; State and Federally Endangered), and loggerhead (Caretta caretta; State and Federally Threatened) may also pass through the Marine Offshore habitat from time to time. Birds. The Marine Offshore is part of a flyway that is used by a wide array of avifauna during certain portions of the year. Waterfowl such as sea ducks and diving ducks use offshore areas in winter. Common waterfowl species observed in the area include white-winged scoter (Melanitta deglandi), surf scoter (M. perspicillata), oldsquaw (Clangula hyemalis), and red-breasted merganser (Mergus serrator). 3.3.3 Atlantic Shores and Inlets Ecosystem The Atlantic Shores and Inlets Ecosystem extends from a depth of 10 m in the Atlantic Ocean of the study area past the mean high water (MHW) line to the line of vegetation or toe of the primary
FIMIStabilizationHurricaneSandyLimitedReevaluationReport–June2014 Page25
dune. The ecosystem includes the Marine Nearshore, Marine Intertidal, Marine Beach and Inlets habitats. Marine Nearshore Physical Description. The Marine Nearshore habitat is landward of the Marine Offshore habitat and consists of the area between mean low water (MLW) to 10m in depth. Similar to the Marine Offshore habitat, the Marine Nearshore habitat is divided into pelagic and benthic zones and the substrate is predominantly sand. Since the Marine Nearshore Habitat is a transitional area between the deeper offshore waters of the Marine Offshore habitat and the shallow, Marine Intertidal habitat, it includes biota that are common to both of these areas. Marine Invertebrates. The benthic community of the nearshore environment includes a variety of benthic invertebrates, several of which are commercially and recreationally important. Within the Marine Nearshore habitat of the study area, there is a high degree of spatial and seasonal uniformity in both species composition and abundance (USACE 2004). Benthic invertebrate communities in the Marine Nearshore habitat are generally similar in distribution and composition to the Marine Offshore habitat and consist of a variety of taxa common to generally clean, well-oxygenated, coarse sandy, subtidal marine habitats. Dominant invertebrates include: segmented worms (phylum Annelida), snails, clams and squids (phylum Mollusca), crabs, lobster and shrimp (phylum Arthropoda, class Crustacea) and sea urchins and sea stars (phylum Echinodermata). Commercially important benthic species such as surf clams, American lobster (Homarus americanus) and long finned squid (Loligo pealeii) also use the Marine Nearshore habitat (USACE 2004). Finfish. Fish communities are similar in distribution and composition to the Marine Offshore habitat. The pelagic zone contains few truly resident fish populations; rather it is dominated primarily by a variety of migratory and highly mobile species including commercially and recreationally important bluefish and striped bass. Marine Mammals. Harbor seals are the most common marine mammal in the Marine Nearshore habitat and are found particularly on the eastern end of the study area. Gray seals may also be found in this habitat.
Reptiles. Several species of sea turtles, including Kemps ridley, and loggerhead, may also be found in the Marine Nearshore habitat from time to time. Birds. Shallower Marine Nearshore waters provide feeding habitat for a variety of birds, including osprey (Pandion haliaetus; State Special Concern), common tern (Sterna hirundo; State threatened), least tern (Sterna antillarum; State Threatened) and roseate tern (Sterna dougallii; State and Federally Endangered). The availability of prey fish and benthic invertebrates also attracts piscivorous (fish-eating) species such as the cormorant (Family Phalacrocoracidae). Recreationally important sea ducks also utilize the Marine Nearshore habitat. Waterfowl such as sea ducks and diving ducks use Marine Nearshore, as well as offshore, habitats in winter. Common waterfowl species observed in the area include white-winged scoter, surf scoter, oldsquaw, and red-breasted merganser. Marine Intertidal Physical Description. The Marine Intertidal habitat extends from the boundary of the Marine Nearshore at MLW to MHW. Within the study area, this habitat is predominantly sandy; however, there are also rocky areas in the east end of the study area, and areas with hardened shorelines, such as bulkheads. The area is typically highly turbid with very high wave energy and exhibits a varying pelagic

FIMIStabilizationHurricaneSandyLimitedReevaluationReport–June2014 Page26
zone due to the tidal cycle. Biota that use the Marine Intertidal habitat are adapted for life in physically stressful conditions and as a result, this habitat zone is characterized by fewer organisms. Vegetation. Owing to the dynamic nature of high energy wave action in much of the Marine Intertidal habitat and the lack of surface for attachment, there is little aquatic vegetation in the FIMI project area. Marine Invertebrates. Because of the alternate inundation and drying of this zone, the benthic community tends to have a lower species richness than the other marine habitats described. A variety of polychaetes, amphipods, isopods, bivalves and crabs are commonly found in sandy intertidal areas that typify the study area. Invertebrates adapted to the rocky intertidal zone that occurs in the east portion of the study area include barnacles (Balanus spp.), blue mussels (Mytilus edulis), common eastern chitons (Chaetopleura apiculata), hermit crabs (Pagurus spp.) and snails (e.g., common periwinkle, Littorina littorea). Other common taxa in the Marine Intertidal habitat include the polychaete (e.g., Scolelepis sp.), the bivalve (e.g., Donax sp.), and the mole crab (Emerita sp.) aquatic worms (Class Oligochaeta), and round worms (phylum Nematoda) are also present. Finfish. The Marine Intertidal habitat provides limited habitat for fish depending on the tidal cycle; consequently the fish diversity in this habitat is relatively low. Marine Mammals. The Marine Intertidal habitat also provides habitat to marine mammals such as harbor and gray seals. Reptiles. The sea turtles that may be found in the Marine Offshore and Marine Nearshore habitats do not nest in the study area and therefore, are not likely to be found in the Marine Intertidal habitat. Birds. The Marine Intertidal habitat is an important feeding area for shorebirds, colonial waterbirds, gulls and waterfowl. Shorebird species that forage on invertebrates along the beaches and intertidal zones of the study area include, but are not limited to: dunlin (Calidris alpina), sanderling (C. alba), red knot (C. canutus), semipalmated sandpiper (C. pusilla), piping plover (Charadrius melodus; State and Federally Endangered), semipalmated plover (C. semipalmatus), black-bellied plover (Pluvialis squatarola), lesser yellowlegs (Tringa flavipes), greater yellowlegs (T. melanoleuca), willet (Catoptrophorus semipalmatus), American oystercatcher (Haematopus palliates). Seabird species include least tern, common tern, roseate tern, and Forster’s tern (Sterna forsteri; State protected). Marine Beach Physical Description. The Marine Beach habitat extends from the MHW line, or upper boundary of the Marine Intertidal habitat, to the line of vegetation or to the seaward toe of the primary dune. The Marine Beach habitat is made up of sand and is typically unvegetated or only sparsely vegetated and not subject to regular inundation. The Marine Beach habitat is generally low in biological diversity in relation to other study area habitats; however, this habitat does support several threatened and/or endangered plant and animal species, as presented in the following paragraphs. Vegetation. In most areas, the Marine Beach habitat is not particularly suitable for the establishment and maintenance of vegetative communities. The poor nutrient content and moisture holding capacity of the sandy substrate restricts colonization by all but the most specialized forms. In undeveloped areas, the backshore of the beach (high tide line to dunes) can be sparsely vegetated by species such as sea-rocket (Cakile edentula) and seaside spurge (Euphorbia polygonifolia). In addition, seabeach amaranth (Amaranthus pumilus; State Threatened [S2], Federally Threatened) and seaside

FIMIStabilizationHurricaneSandyLimitedReevaluationReport–June2014 Page27
knotweed (Polygonum glaucum; State Rare [S3]) are adapted to the conditions in this habitat and can be found in the study area. Wrack. Wrack is an onshore accumulation of washed up seagrasses and/or seaweed, and can play an important role in the sandy beach ecosystem, acting as both habitat and a food source. Several species of scavengers are known to feed upon beach wrack, including crustaceans and insects. Invertebrate species associated with wrack may also be preyed upon by shorebirds, such as Piping plovers. Removal of wrack, as a management practice, has been associated with a lower species abundance compared to sandy beaches where wrack remained and was allowed to be incorporated into the food web (Dugan et al. 2003). Invertebrates. Dominant invertebrate groups collected in the wrack zone of the Marine Beach habitat include oligochaetes and nematodes (USACE 2005). The dominant invertebrate taxa collected using pitfall samplers were the crustacean beach fleas (Talitrus spp). A variety of beetles, ants and flying insects also are also present in this habitat. The major taxonomic orders include Coleoptera (beetles), Diptera (true flies) and Amphipoda (scuds). Annelids (segmented worms) are also common. Beach invertebrates were much more abundant in the Spring than in the Fall. Terrestrial Mammals. Red fox (Vulpes vulpes) are known to use the Marine Beach habitat within the study area. Birds. A variety of birds use the beach for resting, nesting, and feeding including several state and/or federally listed threatened and endangered species, including the least and common terns, and piping plover. These birds prefer dry, sandy, open beaches well above the high tide line breeding habitat. Grassless areas in remote beaches are traditionally utilized, although openings in grassy dunes as small as 200 to 300 feet wide may also be used (Wilcox 1959). Piping plover nests have been seen along the southern shore of Long Island in grassy areas at the edges of dunes, and sometimes behind dunes in blowout areas. Herring gulls (Larus argentatus), great black-backed gulls (L. marinus), and ring-billed gulls (L. delawarensis) are common year-round in the study area and northern gannet (Morus bassanus) are frequently present in winter. Black-bellied plovers (Pluvialis squatarola) and sanderlings (Calidris alba) are also common shorebirds in the study area.
Inlets Physical Description. There are two inlets within the study area, Fire Island and Moriches Inlets are areas of water interchange between the backbay and ocean zones. The tidal movement of water through these small gaps in the barrier island creates a zone of high water velocity and during storm events these conditions are enhanced. Inlet hydrodynamics affect sedimentation rates and movements, and distributions in the bays. These are unique habitats for many species, as well as being a transit zone between the bay and ocean for fish and other organisms. Finfish. Inlets permit local movement and migration of commercially important fish species such as the winter and summer flounder, scup, tautog, butterfish, bluefish, herrings, striped bass, weakfish, black sea bass, and American eel (Anguilla rostrata). Reptiles. In some areas, inlets provide a conduit for seasonal or periodic movement of Kemps- ridley, loggerhead and green sea turtles between the ocean and bays.

FIMIStabilizationHurricaneSandyLimitedReevaluationReport–June2014 Page28
Birds. Recreationally important ducks including the scaup and black duck use inlets for the variety of prey items available for forage. Other less sensitive, more common birds such as gulls, grebe (Family Podicipedidae), cormorant, and common loon (Gavia immer; State Special Concern) also use this area.
3.3.4 Barrier Island Ecosystem
The Barrier Island Ecosystem extends from the landward boundary of the Marine Beach habitat of the Atlantic Shores and Inlets Ecosystem to the MHW boundary of the Bay Intertidal habitat of the Backbay Ecosystem on the bay side of the island. The Barrier Island Ecosystem includes the Dunes and Swales, Terrestrial Upland, Maritime Forest and Bayside Beach habitats of the barrier island proper. Dunes and Swales Physical Description. The landscape and plant communities of the barrier island ecosystem are highly variable both geographically and temporally. Due to water and aeolian sediment transport processes the landforms are often transitional. Breaching, overwash, and windblown deposits alter portions of the landscape over varying time scales. The native ecological communities are adapted to these changes and some species depend on them. The Dunes and Swales habitat is located between the landward edge of the Marine Beach and the Terrestrial Upland habitat of the Barrier Island Ecosystem. Dunes and Swales habitat typically has a sand substrate and is not regularly inundated by tides. Freshwater ponds, wetlands, and shrubby or forested vegetation communities may occur in between dunes and swales and are included in what is considered the Dunes and Swales habitat of the study area. Vegetation. Different vegetation communities can be found within the Dune and Swale habitat, depending on site specific conditions. The maritime freshwater interdunal swale community, which occupies the low-lying and wet areas between the dunes, generally supports a variety of plants designated as rare or unique by the NYSDEC Natural Heritage Program and hence, has been designated as a Significant Habitat by NYSDEC. American beachgrass (Ammophila breviligulata) is a pioneer plant that dominates the Dune and Swale vegetation community, especially in areas most exposed to wind and salt spray such as the ocean face of the foredune and crests of dunes. Just inland of this zone, at the toe of the dune, beachgrass occurs along with dusty miller (Artemesia stelleriana), beach pea (Lathyrus japonica), and saltwort (Salsola kali). On the primary dunes, beachgrass is dominant along with seaside goldenrod (Solidago sempervirens); on the backside of the dunes, beach heather (Hudsonia tomentosa), bearberry (Arctostaphylos uva-ursi), and bayberry (Myrica pensylvanica) occur. A shrub thicket typically develops on the lee side of the primary dune and covers the less exposed areas on the secondary dunes. Wetlands sometimes form in interdunal swales, where blowouts in the dunes intersect the water table. Typical wetland plants such as sedges, rushes, herbs, and low shrubs can become established in swales. Typical wetland swale species include twig-rush (Cladium mariscoides), purple gerardia (Agalinis purpurea), sundews (Drosera spp.), cranberry (Vaccinium macrocarpon), highbush blueberry (V. corymbosum), and bayberry. The upland transition zone at Atlantic Double Dunes has stands of shrublands/woodlands dominated by bayberry, shadbush (Amelanchier sp.), arrowwoods (Viburnum spp.), and pitch pine (Pinus rigida). Terrestrial Mammals. Terrestrial mammals that use the Dunes and Swales habitat include white- tailed deer (Odocoileus virginianus), red fox and raccoon (Procyon lotor).

FIMIStabilizationHurricaneSandyLimitedReevaluationReport–June2014 Page29
Reptiles and Amphibians. The Dunes and Swales habitat provide breeding areas for the Fowler’s toad (Bufo fowleri) and the eastern hognose snake (Heterodon platyrhinos; State Special Concern). The fence lizard (Sceloporus undulatus; State Threatened), and Eastern box turtle (Terrapene carolina; State Special Concern) are also potential inhabitants of the Dune and Swale habitat (Wetlands Institute 2005). Diamondback terrapin (Malaclemys terrapin; Federal Species of Concern, State Special Regulations) also utilize this habitat. Birds. Many of the shorebirds and waterbirds that utilize the habitats previously described may also utilize the Dunes and Swales habitat. In addition, piping plover, short-eared owl (Asio flammeus; State Endangered), horned lark (Eremophila alpestris), snow bunting (Plectrophenax nivalis) and snowy owl (Bubo scandiacus) may be found in this habitat. Terrestrial Upland Physical Description. The Terrestrial Upland habitat extends from the landward boundary of the Dunes and Swales habitat on the ocean side to MHW on the bay side of the barrier island. It includes primarily vegetated upland, as well as freshwater wetland communities. Vegetation. Terrestrial Upland habitats of the barrier island may be vegetated with a variety of herbaceous, scrub-shrub and forest layer species that occur primarily in forests and shrublands. Vegetation communities include pitch pine, red maple (Acer rubrum) swamp forest, maritime scrub, and maritime oak/holly forest. Remnants of Pine Barren community types also occur in portions of the study area. Developed and disturbed areas are frequently colonized by non-indigenous vegetation such as common reed (Phragmites australis). The Maritime Forest is a unique vegetation community within the Terrestrial Upland habitat and, therefore, is described separately. Invertebrates. Invertebrates of the Barrier Island Upland habitat include a variety of insects and spiders. Ants and burrowing spiders are common since they are able to construct deep underground tunnels to escape the hot summer temperatures. Terrestrial Mammals. A variety of terrestrial mammals frequent both developed and non- developed vegetated areas of the Terrestrial Upland habitat. Small mammals known to use these areas include the white-tailed deer, red fox, raccoon, white-footed mouse (Peromyscus leucopus), voles (Microtus spp.) and moles (Scalopus aquaticus). Reptiles and Amphibians. Reptiles and amphibians that use the Terrestrial Upland habitat, including the Maritime Forest, include the diamondback terrapin, the Eastern mud turtle (Kinosternon subrubrum; State Endangered), Eastern box turtle, spotted turtle (Clemmys guttata; State Special Concern), Eastern hognose snake, and the tiger salamander (Ambystoma tigrinum; State Endangered). Birds. A variety of birds use vegetated portions of the Terrestrial Upland habitat for nesting, and feeding, including several threatened and endangered species. More than 150 species of songbirds, about 40 different shorebirds, and various raptors utilize the barrier islands within the study area. The least and common terns, and piping plover are known to use the Terrestrial Upland habitats in certain portions of the study area. Raptors such as owls frequent forested areas. Migratory neotropical species and resident and migratory passerine species are also common components of the Terrestrial Upland habitats of the barrier island. Breeding and wintering songbirds use the undisturbed grass/shrub communities of the study area. Some of the more common species observed include the Eastern towhee (Pipilo erythrophthalmus), northern mockingbird (Mimus polyglottos), America robin (Turdus migratorius), mourning dove (Zenaida

FIMIStabilizationHurricaneSandyLimitedReevaluationReport–June2014 Page30
macroura), common grackle (Quiscalus quiscula), common yellowthroat (Geothlypis trichas), prairie warbler (Dendroica discolor), song sparrow (Melospiza melodia), red-winged blackbird (Agelaius phoeniceus), northern bobwhite quail (Colinus virginianus), field sparrow (Spizella pusilla), and tree swallow (Tachycineta bicolor). Non-developed, upland portions of the barrier island provide important grounds for raptors migrating along the coast. American kestrels, merlins, peregrine falcons (Falco peregrinus; State Endangered), sharp-shinned hawks, and Cooper's (Accipiter cooperii; State Special Concern) hawks have been documented at Amagansett during migration. Snowy owls, short-eared owls , northern harrier (Circus cyaneus) and rough-legged hawks (Buteo lagopus) have also been documented during the winter months. Maritime Forest The Maritime Forest is a unique vegetation community within the Terrestrial Upland habitat. The only Maritime Forest within the study area is the Sunken Forest, which is a 40-acre, 200- to 300- year old Ilex opaca (American holly)-Sassafras albidum (white sassafras)-Amelanchier spp (shadbush) forest located in Sailors Haven, in the central portion of the Fire Island National Seashore section of the barrier island. Shallow groundwater provides hydrology to support freshwater wetlands within the Maritime Forestthat in turn support hydrophytic vegetation such as ferns, mosses (e.g., Sphagnum spp.), cattails (Typha sp.), rushes, and other wetland species. In addition to the smaller wetlands dominated by native vegetation found throughout the Maritime Forest, one large common reed (non native) dominated marsh is also present. Bayside Beach The Bayside Beach habitat is a transitional zone located between the Terrestrial Upland and Intertidal Bay habitats. The Bayside Beach extends from MHW on the bay side landward to the Terrestrial Upland habitat. The border between the Terrestrial Upland and Bayside Beach habitats is formed by vegetation, drastic slope change and/or structural barriers. Within the study area much of the Bayside Beach has been eliminated due to bulkhead construction, immediate upland development and/or severe erosion. Many of the biota that utilize the Terrestrial Upland habitat also can be found in the Bayside Beach habitat. 3.3.5 Backbay Ecosystem Habitats within the Backbay Ecosystem include Bay Intertidal, Sand Shoals and Mudflats, Salt Marsh, Bay Subtidal, and Submerged Aquatic Vegetation Beds (SAV). This ecosystem includes all intertidal and subtidal areas below MHW from the barrier island to the mainland. Bay Intertidal Habitat Physical Description. The Bay Intertidal habitat includes areas between MHW and MLW on the bayside of the barrier island and on the bayshore of the Long Island mainland. The substrate is periodically exposed and flooded by semidiurnal tides (two high tides and two low tides per tidal cycle). Tidal action results in alternating periods of inundation and dryness and fluctuating salinity, making this area a naturally stressed habitat suitable only for biota that are adapted to these conditions. The Bay Intertidal habitat is influenced by hydrology and sediment transport and includes areas of natural shoreline, as well as areas of hardened shorelines, such as bulkheads and riprap revetments.

FIMIStabilizationHurricaneSandyLimitedReevaluationReport–June2014 Page31
Vegetation. Vegetation within the Bay Intertidal habitat includes high marsh and low marsh areas, which are described separately in the Salt Marsh habitat section. Benthic Invertebrates. Bayside intertidal invertebrate communities of the study area support a greater density and richness of invertebrate forms, especially in the intertidal zone, owing to the more stable nature of this area compared to the Oceanside habitats (USACE 2005). Dominant benthic invertebrate groups include polychaetes, such as the worm Scolecolepides viridis, oligochaetes, nematodes and the gem clam, (Gemma gemma). Commercially important invertebrates found in the Bay Intertidal habitat include the horseshoe crab (Limulus polyphemus), blue crab (Callinectes sapidus), soft shell clam (Mya arenaria), and blue and ribbed mussels (Geukensia demissa). USACE (2002d) performed backbay invertebrate sampling as part of a backbay finfish survey. Dominant species collected included shrimps (Palaemonetes and Crangon sp.), crabs, northern moon snails (Lunatia heros), American lobsters, and hard clams (Mercenaria mercenaria). Other taxa found in abundance include jellyfish and Ctenophore species, amphipods, segmented worms, isopods, sponges and tunicates. Finfish. Numerically important fish species collected during study related sampling events included the striped killifish (Fundulus majalis), bay anchovy, American sand lance (Ammodyte americanus), mummichug (Fundulus heteroclitus), common pipefish (Syngnathus fuscus), and the Atlantic silverside. Examples of commercially and recreationally important finfish that utilize the Bay Intertidal habitat include tautog (Tautoga onitis), weakfish (Cynoscion regalis), bluefish, black sea bass (Centropristis striata), striped bass, and herring (family Clupeidae). The Bay Intertidal habitat is also important to anadromous species such as the alewife (Alosa pseudoharengus). The alewife is commercially important as a baitfish and as a forage species for striped bass and other piscviorous species. Other anadromous species include the rainbow smelt (Osmerus mordax) and sea lamprey (Petromyzon marinus). Reptiles. The diamondback terrapin may use the Bay Intertidal habitat from time to time. Birds. Terns and gulls forage for infaunal invertebrates in the intertidal habitats within the bay during low tide; during high tide, the birds forage for bait fish that frequent the flats. Species that can be found in the Bay Intertidal habitat include black skimmer (Rhynchops niger), osprey, piping plover and least tern. Additional shorebirds, wading and migratory species such as cormorant, saltmarsh sharp-tail sparrow (Ammodramus caudacutus), seaside sparrow (A. maritimus) and American oystercatcher also use these habitats. The entire backbay area from the western end of West Hempstead Bay east to Captree Point in Great South Bay, an area of approximately 25,000 acres, is an important area for shorebirds. Based on the USFWS 1997, Moriches Bay is one of the most significant shorebird congregation areas in the backbays. Highest densities of birds congregate in the Fall. The dominant species noted were semipalmated plover, black-bellied plover lesser yellowlegs (Tringa flavipes), greater yellowlegs (T. melanoleuca), ruddy turnstone (Arenaria interpres), sanderling, semipalmated sandpiper, least sandpiper (Calidris minutilla), and the short-billed dowitcher (Limnodromus griseus). Sand Shoals and Mudflats Physical Description. Sand Shoals and Mudflat habitats consist of unvegetated areas in the intertidal zone with either sand or mud substrates. As with the intertidal zone, this habitat is regularly exposed at low tide. The configuration and distribution of Sand Shoals and Mudflats are greatly influenced by local hydrology and grain size deposition or distribution (i.e., mud, clay or sand).
FIMIStabilizationHurricaneSandyLimitedReevaluationReport–June2014 Page32
Biota. Biota that can be found in the Sand Shoals and Mudflats habitat are the similar to those described for the Bay Intertidal habitat. Salt Marsh Physical Description. The Salt Marsh habitat occurs between mean higher high water (MHHW) and MLW and is regularly flooded by the tide. The Salt Marsh habitat consists of two vegetation communities, high marsh and low marsh. High marsh is located between MHHW and MHW and is irregularly flooded. Low marsh is located below MHW and is inundated twice daily. Vegetation. High marsh is dominated by salt tolerant shrubs such as marsh elder (Iva frutescens) and groundsel tree (Baccharis halimifolia) on the landward side and herbaceous vegetation such as saltmeadow cordgrass (Spartina patens), spike grass (Distichlis spicata), and saltmeadow rush(Juncus gerardii) toward the water. Low marsh vegetation is predominantly smooth cordgrass (Spartina alterniflora). Benthic Invertebrates. Key benthic species of tidal marshes include the mud snail (Ilyanassa obsoleta), the salt marsh snail (Melampus bidentatus) the ribbed mussel, blue mussel, the marsh crab (Sesarma reticulatum) and the fiddler crabs (Uca pugilator and U. pugnax) (New York Sea Grant Institute 1994). Finfish. Intertidal habitats, such as tidal marshes, function as nursery areas for a variety of fish species. Atlantic silverside and mummichog are typical dominant fish of mid-Atlantic salt marshes (NYSGI 1994). During flood tides, low numbers of larger predatory species are present feeding on these prey species; predators include bluefish, striped bass and flounders. Commercially important fish such as the tautog, weakfish, bluefish, black sea bass, striped bass, and herring also utilize the Salt Marsh habitat for all or a portion of their lives Birds. Common bird species of the tidal marsh include clapper rail (Rallus longirostris), willet, marsh wren (Cistothorus palustris) and the seaside sparrow (Ammodramus maritimus). Bay Subtidal Physical Description. The Bay Subtidal habitat extends from the MLW boundary of the Bay Intertidal habitat and includes the channels and deeper areas of the bay that are always inundated. Most subtidal areas are unvegetated; however, vegetated SAV habitat is a subtidal habitat that is described separately owing to its ecological importance and sensitivity. Mean depths in the study area bays range from 3 to 10 feet MLW. Benthic Invertebrates. Benthic invertebrates of the Bay Subtidal habitat are characteristic of fine- grained sediments typical of this habitat. As with the Marine habitats, a variety of polychaetes, amphipods, isopods and bivalves are commonly found. A variety of crabs also inhabit portions of the Bay Subtidal habitats including the Jonah crab (Cancer borealis), rock crab (C. irroratus), lady crab (Ovalipes ocellatus), green crab (Carcinus maenas), spider crab (Libinia emarginata) and the blue crab. Several of the species, especially the blue crab, are commercially and/or recreationally important. Finfish. There are a variety of finfish in the Bay Subtidal waters that retreat from the Intertidal habitat on an ebbing tide. Different species tend to be attracted to different subtidal depths and substrate types (e.g., shallow nonvegetated sand and mud, vegetated areas, mid-depth, etc.). Striped killifish, sheepshead minnow (Cyprinodon variegatus), white mullet (Mugil curema) and northern kingfish

FIMIStabilizationHurricaneSandyLimitedReevaluationReport–June2014 Page33
(Menticirrhus saxatilis), for example, have been reported as more numerous over sand bottoms (USFWS 1998). Birds. The large, open, relatively shallow waters of the Bay Subtidal habitat provide resting and staging areas for a variety of waterfowl. The study area lies within the Atlantic Flyway, and therefore, is particularly important to migratory waterfowl during the winter. Submerged Aquatic Vegetation (SAV) Physical Description/Vegetation. SAV habitat consists of subtidal areas that support submerged aquatic vegetation such as eelgrass (Zostera marina) or widgeon grass (Ruppia maritima). Within the project area, the dominant SAV is eelgrass, with widgeon grass found in areas of lower salinity. Biota. SAV is one of the most important features of the Bay Subtidal habitat. It provides nursery areas for finfish and a niche for colonization of epiphytic algae and invertebrates. SAV beds provide a unique habitat for a diverse assemblage of invertebrates, including commercially important blue and ribbed mussels and blue crabs. Epiphytic invertebrates in turn provide a food source for a variety of fish including commercially and recreationally important tautog, weakfish, bluefish, black sea bass, striped bass, herring, summer flounder, winter flounder, and American eel.
3.3.6 Mainland Upland Ecosystem
The Mainland Upland Ecosystem extends from the landward limit of the Bay Intertidal MHW line to the landward limit of the study area. The Mainland Upland habitat is characterized by a mosaic of ‘natural’ areas interspersed with various forms and densities of human development. This habitat includes the upland areas, transitional habitats, and the fringing freshwater wetlands located above the spring high tide mark along the mainland south shore and the higher elevations of the eastern shore zone. The natural resources of the Mainland Upland would be not directly influenced by the potential storm damage management measures under review, and thus no focused investigations of the natural resources of the Mainland Upland were performed as part of the Reformulation Study.
3.3.7 Threatened and Endangered Species
Two Federal agencies, the Fish and Wildlife Service (USFWS), in the Department of the Interior, and the National Oceanic and Atmospheric Administration (NOAA) Fisheries, in the Department of Commerce, share responsibility for administration of the Endangered Species Act (ESA). The USFWS is responsible for terrestrial and avian listed species, as well as freshwater aquatic species. NOAA, through the Protected Resources Division of the National Marine Fisheries Service (NMFS) is responsible for marine aquatic species. In addition to species protected under the Federal ESA, the State of New York maintains a list of species that are Threatened, Endangered, Rare, or of Special Concern in the State. Table 7 of the EA provides the listed species that may occur within the study area, and their Federal and/or State status. Table 8 lists each species and presents a summary of the habitats that they may utilize within the study area. Four species of whales: finback (Balaenoptera physalus), humpback (Megaptera novaeangliae), sei (Balaenoptera borealis) and right (Eubalaena glacialis), have the potential to pass through the waters above the borrow area. All four species are state and Federally listed endangered species. They are typically found significantly farther offshore, but have limited potential to enter the area during spring and fall migration periods. No records, present or past, indicate that the New York Bight is a high use foraging area for large cetaceans.
FIMIStabilizationHurricaneSandyLimitedReevaluationReport–June2014 Page34
The New York District completed coordination with the USFWS regarding implementation of the Stabilization Project and receiving the Biological Opinion on May 23, 2014. The USACE also coordinated under Emergency Consultation procedures with the NMFS for threatened and endangered marine species. The coordination letter from NMFS, dated May 14, 2014 is included in Attachment E, Pertinent Correspondence. The USACE response, dated June 20, 2014 (as required) to the subject letter is also included in Attachment E. Based on habitat and life history assessments, recommendations from the USFWS and a Biological Assessment prepared by the USACE and the Biological Opinion, it has determined that the following Federally- listed species are likely to occur in the FIMP Project Area:
• Piping Plover (Charadrius melodus), Federally Threatened; • Roseate Tern (Sterna dougallii), Federally Endangered; • Rufa red knot (Calidris canutus rufa), Proposed; and • Seabeach Amaranth (Amaranthus pumilus), Federally Threatened
These Federally listed species are found within essentially the same habitats. This habitat encompasses areas located between the high tide line and the area of dune formation and consists of sand or sand/cobble beaches along ocean shores, bays and inlets and occasionally in blowout areas located behind dunes. The piping plover population in the project area (Fire Island) has supported as many as 54 pairs of piping plovers (in 2008), declining to 27 pairs in 2013. According to USFWS, Hurricane Sandy created approximately 200 acres of new potential overwash habitat located within the project area.
3.3.7 Habitats of Importance
Essential Fish Habitat The NMFS is responsible for enforcing the Magnuson-Stevens Fishery Conservation and Management Act (1996 amendments) (MSA), which is intended to promote sustainable fisheries. To implement the MSA, the NMFS and the eight regional Fishery Management Councils have identified and described Essential Fish Habitat (EFH) for each managed fish species. EFH can consist of both the water column (pelagic) and the underlying surface (seafloor) of a particular area. Areas designated as EFH contain habitat essential to the long-term survival and health of our nation’s fisheries. Several habitats within the study area, including Marine Offshore, Marine Nearshore, Marine Intertidal, Inlets, Bay Intertidal, Sand Shoals and Mudflats, Salt Marsh, Bay Subtidal, and SAV, have been designated as EFH for one or more managed fish species. The overall FIMP study area contains EFH for various life stages for 27 species of managed fish. In compliance with Section 305(b)(2) of the MSA, the Reformulation Study will include an assessment of the potential effects of the proposed alternatives on Essential Fish Habitat (EFH), including all pelagic and benthic fish habitat off of Long Island, 1,000 feet seaward of mean low water (MLW) and coastal and open Atlantic Ocean. In addition, a separate EFH assessment has been prepared specifically for the FIMI Stabilization Project and is included as Attachment B. Fish occupation of waters within the project impact areas is highly variable spatially and temporally. Some of the species are strictly offshore, while others may occupy both nearshore and offshore waters. In addition, some species may be suited for the open- ocean or pelagic waters, while others may be more oriented to bottom or demersal waters. This can also vary between life stages of Federally managed species. Also, seasonal abundances are highly variable, as many species are highly migratory.

FIMIStabilizationHurricaneSandyLimitedReevaluationReport–June2014 Page35
Significant Habitats The USFWS has identified Shinnecock Bay, Moriches Bay, Great South Bay, Montauk Peninsula, and South Fork Long Island Beaches as Significant Habitats and Complexes of the New York Bight Watershed. These areas have been recognized as regionally significant habitats and species populations. In addition, all of the backbay waters, including Bay Intertidal and Bay Subtidal habitats within the study area have been designated as Significant Coastal Fish and Wildlife Habitats (SCFWH) by the New York State Department of State (NYSDOS). All or portions of the following specific SCFWH areas are within the FIMI Stabilization Project area: Great South Bay, Democrat Point, Moriches Bay and Smith Point County Park. Within the Dunes and Swales habitat, the maritime freshwater interdunal swale community, which occupies the low-lying and wet areas between the dunes, generally supports a variety of plants designated as rare or unique by the NYSDEC Natural Heritage Program and hence, has been designated as a Significant Habitat by NYSDEC. The Sunken Forest is one of three locations where maritime forests persist on the eastern seaboard. The Sunken Forest is from 200 to 300 years old and is located within Fire Island National Seashore, near the Sailors Haven marina and visitor center. Because of its uniqueness as a maritime forest community, the Sunken Forest is of particular ecological importance and warrants special protection. Submerged aquatic vegetation (SAV) is a unique vegetated intertidal habitat. The establishment of SAV is dependent on suitable water quality, substrate, depth and water currents. SAV is one of the most important features of the Backbay Ecosystem since it provides nursery areas for finfish and a niche for colonization of epiphytic algae and invertebrates.
3.4 Cultural and Archeological Resources
This section provides an overview of known and potential cultural resources and historic properties, including archaeological and architectural resources, within the Area of Potential Effect (APE). The Area of Potential effect for this proposed project extends the entire length of the Atlantic shoreline of Fire Island, from Fire Island Inlet to Moriches Inlet, extending seaward from the existing dune line into the nearshore sand placement area The APE also includes the source locations of sand from the offshore borrow areas. A number of cultural resource surveys of the study area have been prepared and are used as part of this assessment. .
Coordination with the New York State Office of Parks, Recreation and Historic Preservation (NYS SHPO), the Advisory Council on Historic Preservation (ACHP), the National Park Service, other interested parties as well as the Shinnecock Nation, is ongoing. A Programmatic Agreement is being prepared to assess potential effect, and develop strategies to avoid or minimize adverse effects of proposed project elements.
FIMIStabilizationHurricaneSandyLimitedReevaluationReport–June2014 Page36
3.4.1 Tidal Zone, Near Shore and Borrow Areas
Submerged Archaeological Resources
Known and potential submerged archaeological resources, primarily shipwrecks, in the tidal zone, near shore and borrow areas along the south shore of Fire Island have been inventoried through a number of studies.
Tidal Zone and Near Shore Beachfill Area A remote sensing investigation of the tidal zone and the near-shore beachfill area along portions of Fire Island was conducted. The survey was designed to determine the location, if present, of any targets that might represent potentially significant cultural resources or sites in the form of historic shipwrecks. The survey included a side scan sonar and magnetometer. The survey identified 26 magnetic anomalies that had characteristics potentially representative of significant submerged cultural resources. Most of the anomalies were buried beneath the seabed, with no associated, discernible above seabed side scan sonar returns. Four of the anomalies had both a magnetometer signature and an associated above seabed side-scan sonar return. These four anomalies will need additional investigation if located in an area where sand will be placed (Panamerican 2003).
Shipwrecks
Numerous shipwrecks have been documented along the Atlantic coast of Long Island and the potential number of undocumented shipwrecks far exceeds the list of known shipwrecks. Research conducted in 1998 identified approximately 155 documented wrecks in the near-shore and offshore area from Fire Island Inlet to Moriches Inlet. Some of these wrecks were later re-floated and/or removed or were wrecked at sea, offshore Fire Island; some more than 12 miles. A few were scuttled to form artificial reefs. This research identified approximately 46 vessels that were documented as having wrecked on or near the beach with locations identified as Fire Island, Fire Island Inlet, or opposite Moriches. The exact location of these vessels has not been identified but portions of wrecks have been periodically exposed or washed up along Fire Island. Based on initial historic research a number of these vessels, if identified, could be eligible for the National Register of Historic Places (Greeley-Polhemus Group 1998). In 1998 and 1999, USACE completed a remote sensing survey of much of the tidal zone and near-shore area of Fire Island to the east of Robert Moses State Park. The survey identified four anomalies with an associated above-seabed side scan sonar return located along the length of Fire Island that would require additional investigations to determine what the anomalies represent and, if any represent a potential historic property (Panamerican Consultants 2003).
The USS San Diego, an armored cruiser, also known as the USS California (Armored Cruiser No. 6) was added to the National Register of Historic Places in 1998. Launched in 1904 as the second USS California (ACR-6), it was renamed USS San Diego in 1914 and served as a flagship for the Commander-in-Chief of the Pacific Fleet. By 1918, it was ordered to the Atlantic Fleet to act as escort for convoys heading across the North Atlantic to Europe. The San Diego was sunk in July 1918 by a German mine. It currently lies in about 110 feet of water several miles off the Fire Island coastline and is a popular dive site.
Two additional dive sites, the Drumelzier and the Gluckhauf, are located within Fire Island. The Drumelzier, also known as the “Fire Island Wreck” was British steamship, which sunk in 1904 and is located offshore Robert Moses State Park. The Gluckhauf, a German tanker, ran aground in a storm in 1893. Portions of the wreck are spread over a wide area, with the stern as the most dived section.

FIMIStabilizationHurricaneSandyLimitedReevaluationReport–June2014 Page37
In 2001, USACE completed a survey of 11 borrow areas located off-shore of Fire Island and Westhampton and Southampton Beaches. This included Borrow Area 2C, located south of central section of Fire Island and 5B located off of Westhampton. The survey, consisting of magnetometer and side scan sonar, did not identify any magnetic or acoustic anomalies within the borrow area.
Drowned Terrestrial Sites
No underwater, former terrestrial archaeological sites have been identified off-shore of Long Island.
Borrow Areas In 2001, a remote sensing survey of eleven borrow areas, including Borrow Areas 2C and 5B, was conducted to assess the potential impact of proposed activities on submerged cultural resources. A total of 10 magnetic and/or acoustic anomalies were identified as follows: one in Area 2A, four in 4A, three in 5A, one in 6A, and one in 7A. No magnetic and/or acoustic anomalies were identified in Areas 2B, 2C, 3A, 4B, 5B and 8A. No additional will be required in Areas 2C and 5B, however Borrow Area 4C will require its own survey (Tidewater Atlantic Research 2001).
3.4.2 Onshore Portion of the Study Area.
Archaeological Resources
According to NY SHPO’s archaeological site files, Site A103-05-000605, lies within Robert Moses State Park, was a recreational facility built for handicapped children in the early part of the 20th century. It is located within the dunes bordering Great South Beach and is considered to be potentially eligible for the National Register of Historic Places (John Milner and Associates 2000).
In 2005, the National Park Service completed an archaeological overview and assessment of sites within the FIIS (Gray and Pape 2005). The report relocated and assessed 13 previously identified archaeological sites within FIIS. Sites located on Fire Island include Whalehouse Point, Point O’Woods Refuse Midden, Blue Point Lifesaving Station, Smith Point Coast Guard Station, Forge River Life Saving Station, Fire Island Lighthouse Tract (two areas), the Razed Factory, the Greenburg House Site, Saltaire Dump and the Casino Site. Several of these sites, including the Blue Point Lifesaving Station, the Smith Point Coast Guard Station, Whalehouse Point, and the Forge River Lifesaving Station are located or have features that are located in the dunes to the south of Burma Road (Gray and Pape 2005).
Architectural Resources
The Fire Island Light Station Historic District is located at the west end of the FIIS. Established in 2010, the District expanded the original Fire Island Light Station National Register property boundaries to include the Fire Island Light Station, consisting of the present Lighthouse, the Radio Compass Station, the First Lighthouse Foundation, Keeper’s Quarters and the Old House, to incorporate the contributing landscape features of Burma Road, historic pathways from the Light Station to the shoreline, and the surrounding coastal grasslands, thicket zones and upper beach and dune vegetation. Significant views contributing to the historic district include the view to and from the Fire Island Light Station (NPS 2004). In architectural investigation identified several potentially eligible historic resources within the study area, which were related to the historical settlement and pre-resort development, vacation/resort industry, and maritime histories of the barriers. Reconnaissance field surveys identified 22 potentially eligible resources that meet the 50-year age consideration of the NRHP. Potentially affected architectural properties were considered to be only those visible from the beach itself. It is noted that a formal
FIMIStabilizationHurricaneSandyLimitedReevaluationReport–June2014 Page38
determination of eligibility requires additional research. The properties recommended for additional consideration are:
The Robert Moses State Park Tower as a landmark within the park and along the western end of the barrier island;
Colonial Revival House, Corneille Estates, Ocean Beach vicinity, c. 1930s; Hip-roofed House, Corneille Estates, Ocean Beach vicinity, 1920s; Dutch Gable, Wood-framed House, Ocean Bay Park, c. 1930s; Gable-roofed house with shed dormers, Seaview, c. 1930s; Former Point O’Woods Life Saving Station (present Fire Island Hotel and Resort), Ocean Bay
Park, c.1900; Point O’Woods, former Chautauqua community with numerous examples of Shingle-style
architecture; Gable-front bungalow, Cherry Grove, c. 1920s; Two Eaves front bungalow, Cherry Grouve, c. 1920s; One and one-half story eaves front home, Cherry Grove, c. 1920s; Gable and hip-roofed house, Cherry Grove, c. 1920s; Eaves front house, Fire Island Pines, c. 1920s;
3.5 Essential Fish Habitat
Essential Fish Habitat The NMFS is responsible for enforcing the Magnuson-Stevens Fishery Conservation and Management Act (1996 amendments) (MSA), which is intended to promote sustainable fisheries. To implement the MSA, the NMFS and the eight regional Fishery Management Councils have identified and described Essential Fish Habitat (EFH) for each managed fish species. EFH can consist of both the water column (pelagic) and the underlying surface (seafloor) of a particular area. Areas designated as EFH contain habitat essential to the long-term survival and health of our nation’s fisheries. Several habitats within the study area, including Marine Offshore, Marine Nearshore, Marine Intertidal, Inlets, Bay Intertidal, Sand Shoals and Mudflats, Salt Marsh, Bay Subtidal, and SAV, have been designated as EFH for one or more managed fish species. The overall FIMP study area contains EFH for various life stages for 27 species of managed fish. In compliance with Section 305(b)(2) of the MSA, the Reformulation Study will include an assessment of the potential effects of the proposed alternatives on Essential Fish Habitat (EFH), including all pelagic and benthic fish habitat off of Long Island, 1,000 feet seaward of mean low water (MLW) and coastal and open Atlantic Ocean. In addition, a separate EFH assessment has been prepared specifically for the FIMI Stabilization Project and is included as Attachment B. Fish occupation of waters within the project impact areas is highly variable spatially and temporally. Some of the species are strictly offshore, while others may occupy both nearshore and offshore waters. In addition, some species may be suited for the open ocean or pelagic waters, while others may be more oriented to bottom or demersal waters. This can also vary between life stages of Federally managed species. Also, seasonal abundances are highly variable, as many species are highly migratory.
FIMIStabilizationHurricaneSandyLimitedReevaluationReport–June2014 Page39
Significant Habitats The USFWS has identified Shinnecock Bay, Moriches Bay, Great South Bay, Montauk Peninsula, and South Fork Long Island Beaches as Significant Habitats and Complexes of the New York Bight Watershed. These areas have been recognized as regionally significant habitats and species populations. In addition, all of the backbay waters, including Bay Intertidal and Bay Subtidal habitats within the study area have been designated as Significant Coastal Fish and Wildlife Habitats (SCFWH) by the New York State Department of State (NYSDOS). All or portions of the following specific SCFWH areas are within the FIMI Stabilization Project area: Great South Bay, Democrat Point, Moriches Bay and Smith Point County Park. Within the Dunes and Swales habitat, the maritime freshwater interdunal swale community, which occupies the low-lying and wet areas between the dunes, generally supports a variety of plants designated as rare or unique by the NYSDEC Natural Heritage Program and hence, has been designated as a Significant Habitat by NYSDEC. The Sunken Forest is one of three locations where maritime forests persist on the eastern seaboard. The Sunken Forest is from 200 to 300 years old and is located within Fire Island National Seashore, near the Sailors Haven marina and visitor center. Because of its uniqueness as a maritime forest community, the Sunken Forest is of particular ecological importance and warrants special protection. Submerged aquatic vegetation (SAV) is a unique vegetated intertidal habitat. The establishment of SAV is dependent on suitable water quality, substrate, depth and water currents. SAV is one of the most important features of the Backbay Ecosystem since it provides nursery areas for finfish and a niche for colonization of epiphytic algae and invertebrates.

FIMIStabilizationHurricaneSandyLimitedReevaluationReport–June2014 Page40
4.0 WITHOUT PROJECT FUTURE CONDITION
The Without Project Future Condition (WOPFC) is by definition the projection of the most-likely future conditions in the study area in the absence of a proposed project from the current study. The WOPFC serves as the base conditions for all the alternative analyses, including the engineering design, economic evaluation of alternatives, comparison of alternatives, as well as environmental, social and cultural impact assessment.
The WOPFC is a forecast based upon what has actually occurred, is currently occurring or is expected to occur in the study area if no actions are taken as a result of this study. As it is impossible to predict specifically what may occur, future activities that impact the without-project condition must be representative of what is most likely to occur, and as such must be based upon historic practice and trends, unless there is definitive evidence of new actions or policies scheduled for implementation that would influence past practices. The goal is to choose the most likely future scenario (not the only future scenario), based upon reasoned, documentable forecasting. The period of analysis for this plan is 50 years. This section provides a summary of the elements within the WOPFC, followed by a description of the likely effects of this condition.
In defining the WOPFC, the following assumptions were made to establish the framework of what is likely to occur.
1. As defined by existing Federal/State navigation authorities, the existing inlets (Fire Island, and Moriches Inlets) and their corresponding approach and back-bay navigation channels will be maintained near the present widths depths, and locations through the study period. These existing inlets will continue to contribute to back-bay flooding in the WOPFC.
2. Periodic beach fills and beach scraping will continue to be implemented by local governments and home owner associations to maintain some threshold beach condition. This condition is based on a review of historic activities including the extent of local and private activities. It is likely that future regulatory requirements may limit the size, scope, and timing of future local projects; but even with these conditions, it is expected that within their available resources, local groups will continue to maintain a minimum beach and dune condition.
3. No Federal interim storm protection projects will be considered in place except for the Westhampton Interim Project, which will be maintained until the end of the renourishment period in 2027. After 2027, the Westhampton Interim Project will be subject to agreements outside the USACE jurisdiction. Further, the West of Shinnecock Inlet (WOSI) Interim Project period of renourishment has expired as a WOPFC. (Although these projects are outside the footprint of the FIMI area, their influence has been accounted for in this project).
4. The Interim Breach Contingency Plan (BCP), which is presently in place, will not be considered as part of the WOPFC because it is intended as a temporary measure to be superseded by the results of the Reformulation Study. BCP was approved in 1996 and implemented under Advanced Measures (PL 84-99).
5. It is recognized that even in the absence of a BCP that breaches in the barrier islands will be closed either through natural closure or human intervention. This condition is based on the historic pattern of repeated breach closures, including after the storms of 1938, 1954, 1962, 1980, & 1992, and the State’s history to close breaches and conduct breach maintenance activities. In the absence of a streamlined approval process it is estimated that breach closure would occur within approximately 12 months in all areas outside of the Otis G. Pike Wilderness Area. Within

FIMIStabilizationHurricaneSandyLimitedReevaluationReport–June2014 Page41
the Wilderness Area of the Fire Island National Seashore, closure of a breach would be subject to agreement with the National Park Service, and require additional compliance to satisfy the Wilderness Management Plan.
6. It is recognized that there is an existing breach at Old Inlet, which was formed during Hurricane Sandy, and is currently open with a width greater than 1,000 ft. It is acknowledged that the decision to take action with this breach is subject to a separate decision-making process. There is the possibility that the breach could close naturally, another storm could trigger the need to close the breach under emergency provisions, a decision could be made to close the breach, or another decision could be reached as a result of the separate, decision-making process.
FIMIStabilizationHurricaneSandyLimitedReevaluationReport–June2014 Page42
5.0 PROBLEM IDENTIFICATION
5.1 General
Northeasters and hurricanes periodically impact the southern shores of Fire Island. These storms produce storm tides (predicted tides plus storm surge) and waves that cause extensive flooding and erosion to the study area. Mainland flooding along Great South and Moriches Bays is intensified when Fire Island is breached or overwashed as additional elevated ocean water can enter the bays over the island or through the breaches during storms. The topography of Fire Island serves as a barrier between Great South and Moriches Bays and the Atlantic Ocean.
While long-term erosion and large storms have posed a significant threat to the project area for many years, Hurricane Sandy has created a potentially imminent hazard of widespread overwashing and breaching at Fire Island. Severe beach erosion and dune flattening has left Fire Island vulnerable to overwash, breaching, and property damages to any storm. Although the beach width has recovered somewhat following Sandy, the dune remains in a vulnerable condition. The lack of dry beach seaward of some dunes also impedes vehicular access by residents, Park Service, and emergency personnel. This creates a potential safety hazard by limiting options for emergency response and evacuation. For discussion purposes, problems are presented as a sequence of the following three closely related components: erosion of the barrier beach and dune; leading to storm overwash and/or breaching of the barrier; resulting in widespread flooding within Great South and Moriches Bays. This section of the report draws from a recent study of coastal change from Hurricane Sandy at Fire Island published by Cheryl J. Hapke et al. (2013).
5.1.2 Beach and Dune Change
The beaches and dunes on Fire Island were severely eroded during Hurricane Sandy, resulting overwash along approximately 45 percent of the island and breaches in three locations on the eastern segment of the island (Hapke et al., 2013). Enormous volumes of sand were carried from the beach and dunes to the central portion of the island, forming large overwash deposits. Figure 9: Post-Sandy Images Showing Overwash (Hapke et al. 2013)shows the alongshore patterns of overwash and upper beach (+ 10.5 feet NGVD) migration from Hurricane Sandy (Figure from Hapke et al., 2013). A majority of the dunes were either flattened or experienced severe erosion/scarping. In addition, the elevation of the beach was lowered leaving any surviving dunes vulnerable. Hapke et al. (2013) estimates that the upper portion of the profile lost on average 54.5 percent of its volume. However, the beach width has experienced some recovery since Hurricane Sandy but remains vulnerable. Examples of pre- and post-Sandy survey profiles at three locations along Fire Island are presented in Figure 10: Observed Beach and Dune Change on Fire Island (Hapke et al. 2013) 5.1.3 Breach and Overwash Impacts
Breaches and overtopping of the barrier island occur periodically in conjunction with larger storms. During Hurricane Sandy two breaches occurred along Fire Island and one along the reach between Moriches Inlet and Shinnecock Inlet. The overwash occurred along approximately 45 percent of the island. The physical impacts of a breach or severe overwash at Great South and Moriches Bays include:
Increase in bay tide levels if breach is large enough to expose bayshore to open ocean conditions;
Increase in bay storm tide levels due to presence of large persistent breach or ocean storm tide levels overwashing the barrier island;
Changes in bay circulation patterns, residence times, and salinity due to breaches;
Increase in sediment shoaling in navigation channels and shellfish areas due to a major breach;
FIMIStabilizationHurricaneSandyLimitedReevaluationReport–June2014 Page43
Increased transport and deposition of sediment to bay including creations of overwash corridors.
Barrier island breaching often results in the formation of flood tidal deltas on the bay side of the barrier. These breaches are likely to provide suitable substrate for future SAV growth or the development of emergent tidal marshes, if the elevation is sufficient. These flood tidal deltas typically benefit a variety of wildlife species, especially shorebirds, by increasing the available foraging and loafing area, and potential nesting sites. Flood tidal deltas and the dynamic sand spits associated with bay inlets also provide optimal habitat for the rare plants, sea beach amaranth and sea beach knotweed. Overwash deposits are beneficial to natural accumulation of sand on the barrier, but suggests regional processes favor northward migration of the barrier from its present location.
5.1.4 Tidal Flooding Impacts
The presence of the existing barrier island system and topography reduces widespread inundation of low lying areas on the mainland. Both Fire Island Inlet and Narrow Bay act both as hydraulic conveyances and hydraulic constrictions which severely limit the storm surge volume entering Great South and Moriches Bays. As the tidal surge spreads out away from the inlets, the corresponding flood stage decreases. This attenuation of ocean surges becomes less pronounced for larger storm events which can overwash and breach the barrier island. Therefore, the flood problem along the mainland is linked to the topographic condition of the barrier system. Flooding occurs as a result of surge propagating through the inlets, but more severe mainland flooding can occur as a result of overtopping or breaching of a degraded barrier island, which brings more storm ocean water into the bay system during the times of moderate to severe storms.
The numerical model framework developed for FIMP is the state of the art and most advanced and comprehensive modeling study involving storm surge and barrier island system breaching and morphology. The numerical model includes all the necessary processes to accurately simulate the inlet and barrier island overwash processes and breaching processes in a system-wide and comprehensive manner for the complete FIMP project area, considering the three bay and inlet system. (Irish and Cañizares, (2009); Cañizares and Irish, (2008); Irish and Cañizares R.(2006); Alfageme and Cañizares (2005); Irish, et al., (2004); Canizares, et al., (2004); Irish, et al., (2004); Roelvink, et al., (2003); Cañizares’ et al.,(2003).
The FIMI project will not provide additional risk management from low and moderate intensity storms events that do no cause overwashing or breaching of the barrier island (even of the post-Sandy condition of the barrier), that occur frequently (monthly or yearly), elevate bay water levels by minor storm tide flooding, and cause localized, minor flooding in low lying segments along the bay shoreline of Long Island and Fire Island. Since Hurricane Sandy in October 2012, high frequency, low intensity storms have occurred (Aretxabaleta, A. L., et al., (2014)). With or without the FIMI project, localized flooding impacts along the bay shorelines will continue to occur. Aretxabaleta, A. L., et al., (2014) compared ocean water levels with western Great South Bay water levels to examine water level influence of the Old Inlet breach (which is in eastern Great South Bay) over a five month period. The model presented in Cañizares and Irish (2008) was also used to evaluate the impact of breach open conditions on bay water levels during storm conditions and that results indicated that a small breach (or even bigger than the existing breach at Old Inlet) in eastern Great South Bay has very little influence on water levels during low intensity storms at locations in western Great South Bay. Additional information on the modeling is included in Appendix B – Physical Conditions.

FIMIStabilizationHurricaneSandyLimitedReevaluationReport–June2014 Page44
Figure 9: Post-Sandy Images Showing Overwash (Hapke et al. 2013)
Figure 10: Observed Beach and Dune Change on Fire Island (Hapke et al. 2013)
5.2 Storm Damage Analysis
The development in the study area is vulnerable to damage from three mechanisms, inundation due to storm surge, undermining due to storm erosion or shoreline change, and structural failure due to intense force of wave impacts. The interaction of these processes creates complexities in the physical modeling efforts and also adds complexity to the identification of vulnerable areas to anticipate impacts to structures and populations.
FIMIStabilizationHurricaneSandyLimitedReevaluationReport–June2014 Page45
Storm-induced damages to developed areas occur due to wave attack, erosion of the beach and dune, and tidal flooding when the beach and dune elevations are exceeded. There is a long history of buildings and infrastructure being damaged or destroyed during storms, which is described further in this chapter. In addition to storm-induced infrastructure damage, the stability of the barrier island is also vulnerable and the barrier island is inherently transitional as erosion of the beach and dune system may lead to breaches of the barrier island. When a breach occurs, it impacts the Barrier Island and back-bay systems during and after the storm. If the breach continues to grow, it may migrate (move along the island), leading to further damage of buildings and infrastructure on the barrier island. Breaches also impact the hydraulic stability of the existing inlets, which may result in increased sediment deposition in the inlet channels and compromised navigability of the inlet.
In general when a breach occurs, flood elevations and damages in the back-bay and mainland increase. The overall reformulation for the FIMP project includes measures to reduce vulnerability in these Bay Shore communities. However, until those measures are implemented there is significant concern about the potential for increased damages should additional barrier breaches occur.
For analysis purposes, the study area has been divided into shorefront development and non-shorefront development. Development was considered part of the shorefront analysis if it is subject to damage from storm surge inundation, plus waves and/or erosion. Shorefront development was evaluated for all three damage mechanisms for each individual structure under a full range of storm conditions. The largest, or “critical”, damage was then identified for each building for a series of storms over the without project future conditions.
Development outside of the zone of likely erosion or wave impact was considered part of the non-shorefront analysis. The non-shorefront analysis only evaluates damage due to inundation, and includes development both on the northern side of the barrier island and along the mainland areas.
The storm damage analysis considered physical damage to structures, building contents, and cars, as well as non-physical costs, such as cleanup and temporary housing expenses. Public emergency costs associated with extreme events such as barrier island breaching are also included in the analysis.
Until Hurricane Sandy, the most recent analyses of storm damages were last completed in 2009 as part of the ongoing FIMP Reformation Study efforts. In support of this Hurricane Sandy, FIMI Stabilization Limited Reevaluation Report, the study economics were updated to current price levels and provided for the FIMI study area only. Shorefront damage models were revised to reflect post-Sandy changes to the existing condition beach morphology such as the dune crest elevation and to account for changes in the structure inventory due to the destruction of shorefront houses by Sandy. Lifecycle flood inundation models were revised to reflect post-Sandy changes to the barrier islands including the existing condition beach profile width plus accumulated sea level rise in the years since the models were developed. Models used to calculate damages specifically incurred by open breaches over the project life were revised to reflect current beach profile widths and sea level rise as per the lifecycle inundation model but also to incorporate recently acquired data related to the maximum size of potential breaches in Great South Bay. Revisions to the breach damage model also included updated breach closure costs for all potential breach locations and current mobilization and unit costs applicable in BCP maintenance actions. The component models that were developed to compute damages and benefits for this study are discussed in more detail in Section 5.2.2.
All lifecycle simulation models were adjusted to incorporate a revised project base year of 2015 and the current FY interest rate of 3.50%. The damages resulting from all revised simulation models were also updated using an index factor derived from the Engineering News-Record Building Cost Index, to
FIMIStabilizationHurricaneSandyLimitedReevaluationReport–June2014 Page46
account for increases in structure inventory value from 2005-2013 which have not been subject to detailed surveys or analysis for this interim report.
5.2.1 Shorefront Damages
For structures located along the south shore shorefront, wave attack and erosion combined with inundation to create frequent structural failures. Therefore, in addition to considering damage from inundation, the stability of the shorefront structures was analyzed to relate the wave forces at any depth of storm-induced water elevation to the structural failure and the potential for failure from the effects of long-term and storm-induced erosion, including scouring and vertical erosion.
In addition to storm-induced infrastructure damage, the stability of the barrier island is also vulnerable and the barrier island is inherently transitional as erosion of the beach and dune system may lead to breaches of the barrier island.
Wave Failure
Over half of the structures located along the south shore shorefront are constructed on piles. However, based on the results of the wave failure analysis, the anticipated primary source of storm damage to structures on piles was failure from erosion; these structures are assumed to be able to withstand wave attack as long as the wave height is below the main floor. Therefore, no wave damages are calculated for wave heights below the main floor. At wave heights at or above the main floor, damage from waves was assumed to be 100% of the value based on the analysis of the pier supported structure analysis.
Erosion
Erosion damages to shorefront structures were different based on the type of foundation of the structure.
Structures Not on Piles. Most of the structures not on piles consist of slab-on-grade foundations; thus, any undermining of the structure by erosion is expected to result in damage. Damage for erosion limits between the setback and the midpoint was assumed to be linear, from 0% to 50% of the structure value.
Structure on Piles. The combination of erosion and wave forces is the primary source of failure for structures on piles. To determine when structure failure occurs, the first task was to determine what pile embedment depth is necessary to resist wave forces at various flood depths. The stability of pile-supported structures was analyzed using both the Griffith and Czerniak equations, relating the stability at any depth of storm surge to the required pile embedment depth. The pile embedment depth at any structure was determined by comparing the eroded ground elevation to an assumed pile tip elevation of -10 feet NGVD.
Shorefront Storm Simulations
Storm Response Data. A key input to the shorefront storm damage analysis was the Storm Induced Beach Change Model (SBEACH) numerical simulation model. The SBEACH model was used to calculate beach profile changes for range of storm events. The model predicts profile response to storms as well as wave heights, wave setup and wave run-up. For the present SBEACH modeling analysis, a total of 19 specific responses were identified to satisfy input requirements for overtopping and economic analyses. These responses allow the interpolation of the profile elevation and water levels at each point on the shorefront profile. This analysis was conducted for 22 representative existing condition profiles, plus additional profiles representing potential without project future condition beach conditions.
FIMIStabilizationHurricaneSandyLimitedReevaluationReport–June2014 Page47
Storm Simulation. Because the study area shorefront is such a dynamic environment, the storm damage analysis incorporates a lifecycle approach to track the impact of multiple storm events on the future vulnerability of each individual structure. The life-cycle approach requires development of potential storm sequences which represent the random occurrence of future events. The shorefront analysis used the multivariate Empirical Simulation Technique (EST). The only assumption in the EST is that future events will be statistically similar in magnitude and frequency to past events.
Shorefront Damage Simulations. The shorefront damage simulation model is a SAS® object-oriented program that analyzes the impact of multiple storms on each shorefront structure independently, using a database of approximately one thousand 100-year storm simulations (100,000 years). Using this SBEACH, EST data, the model applied the previously described damage criteria to calculate expected flooding damage, wave impact damage, and erosion damage to each shorefront structure. Cumulative damages for each year of the project life for each simulation are tabulated, and the annual damage for the project life calculated. From the 1,000 simulations, the mean annual damage for each structure is determined and the mean annual damage for all structures combined to yield the aggregate expected annual damage.
Future Conditions. Over the project life storm damages will vary in response to several factors. The model incorporates adjustments for future variation in shoreline positions, profile shape, sea level rise and limitations on structure rebuilding. While long term erosion trends and rising sea level will contribute to an increase in future storm damages, the majority of the shorefront structures fall within the Coastal Erosion Hazard Area (CEHA) and the National Flood Insurance Program (NFIP) Special Flood Hazard Area (V-Zone), which regulate rebuilding of damaged structures. These regulations have an important impact in limiting future increases in damage.
Coastal Erosion Hazard Area: In 1981, the CEHA Act, Article 34 of Environmental Conservation Law was enacted to provide for the identification and regulation of critical erosion hazard areas along New York’s coastlines, in order to minimize damage from erosion. Article 34 established statutory authority for identifying these erosion hazard areas, restricting development in these areas, and establishing criteria for the development of a statewide Coastal Erosion Management (CEM) regulatory program. 6 NYCRR Part 505, Coastal Erosion Management Regulations, provides the framework and criteria which allow the State and local governments to administer a local CEM program that is consistent with Article 34 for affected shoreline communities. Under Article 34 and Part 505, CEHA consists of two separate jurisdictions, which include the Natural Protective Feature Area (NPFA), which is defined by the natural protective features (dune, beach, bluff and near shore areas) found along a particular stretch of shoreline, and the Structural Hazard Area (SHA), which is delineated landward of the NPFA along shorelines with a long term annual rate of shoreline recession greater than one foot per year.
Currently no SHA has been identified within the study area. Therefore, the terms CEHA and NPFA are used interchangeably throughout this report, because only the NPFA jurisdiction is applicable within the study area. However, SHA may be delineated within the project area in the future if technical data determines it to be appropriate.
CEHA jurisdiction extends from the seaward limit of the near shore area (1,000 feet seaward of mean low water or a water depth of 15 feet; whichever is greater) to the landward edge of the most landward natural protective feature. For most of the study area, the primary dune is the most landward natural protective feature. The primary dune extends 25 feet from the landward toe, as identified on the Coastal Erosion Hazard Area maps and is the landward limit of CEHA jurisdiction. Where the landward most natural protective feature is a bluff or a beach, the CEHA jurisdiction extends 25 feet landward from the crest of a bluff or 100 feet from the change of vegetation or physiographic form on a beach. Presently, all of the
FIMIStabilizationHurricaneSandyLimitedReevaluationReport–June2014 Page48
towns within the study area have in effect either a State CEHA program administered by the Department of Environmental Conservation or a certified local law administered locally.
National Flood Insurance Program: Any community seeking to register with the Federal Insurance Association, which allows homeowners to obtain flood insurance, must join FEMA’s NFIP. Participation in the NFIP requires a municipality to adopt a local floodplain management ordinance that regulates floodplain development and redevelopment following damage. The intent of the local ordinance is to reduce damage to buildings and property through the establishment of base flood elevations, building code requirements, and restrictions on allowable development in floodplain areas. Specific provisions include the requirement that the first finished floor or new construction must be elevated above the base flood elevation. All municipalities within the study area participate in the NFIP.
Damage Results
The model simulations calculate damage for each year of the lifecycle starting at year 2000. The damage in each year is multiplied by the present worth factor to adjust to base year values. The present worth of damage is summed and multiplied by the capital recovery factor (http://www.soi.wide.ad.jp/class/20070041/slides/08/18.html) to calculate the equivalent annual damage for each simulated lifecycle. Table 2 provides a summary of the equivalent annual damages for the period of analysis, a period from 2015 to 2065. This table illustrates the areas with the highest levels of expected damages along the shorefront. When looking at these numbers, it is important to consider that the damages are aggregated over different size reaches. This table illustrates that the largest amount of shorefront damages are along the area of Fire Island.
5.2.2 Non-shorefront Damages
The analysis of non-shorefront damage considers the developed areas that are not subject to direct impacts from ocean waves, erosion or inundation. The analysis includes areas on the Long Island mainland that are heavily developed, primarily with year round residential structures, and the northern, or bayside portions of the barrier islands that are primarily developed with seasonal housing.
Bayside Damage Criteria
Previously developed relationships between depth of flooding and damage as a percent of value were used to assess the inundation damages to each non-shorefront structure to estimate damage for the full range of flood events. These relationships included a series of generalized functions for residential structure and content damage developed by the USACE-IWR based on post flood inspections. Non-physical damage, including evacuation, temporary housing, and re-occupation/cleanup costs, was related to depth and structure value using a series of 1500 on site interviews distributed throughout the study area. These interviews were also used to develop physical damage relationships for non-residential structures.

FIMIStabilizationHurricaneSandyLimitedReevaluationReport–June2014 Page49
Table 2: Without Project Damage
Project Reach
Critical
Asset Name
Approximate Length (ft)
Equivalent Annual Damage
2015-2065 Fire Island Inlet
GSB GSB-1 1A Robert Moses State Park 25,700 $0
1B FI Lighthouse Tract 6,700 $0
GSB-2 2A Kismet to Lonelyville 8,900 $2,301,000
2B Town Beach to Corneille States 5,100 $1,230,000
2C Ocean Beach & Seaview 3,800 $406,000
2D OBP to Point O' Woods 7,400 $628,000
2E Sailors Haven 8,100 $0
GSB-3 3A Cherry Grove 3,000 $319,000
3B Carrington Tract 1,500 $0
3C Fire Island Pines 6,600 $232,000
3D Talisman to Water Island 7,300 $19,000
3E Water Island 2,000 $26,000
3F Water Island to Davis Park 4,700 $1,000
3G Davis Park 4,100 $166,000
3H Watch Hill 5,000 $0
GSB-4 4A Wilderness Area - West 19,000 $0
4B Old Inlet 16,000 $0
GSB Subtotal: $5,328,000
MB MB-1 1A Smith Point CP- West 6,300 $0
1B Smith Point CP - East 13,500 $0
MB-2 2A Great Gunn 7,600 $0
2B Moriches Inlet - West 6,200 $0
2C Cupsogue Co Park 7,500 $1,000
2D Pikes 9,700 $295,000
2E Westhampton 18,300 $14,000
MB Subtotal: $310,000
TOTAL $5,638,000
Bayside Damage Models
Lifecycle Simulation Models. In order to develop a true understanding of the impact of flooding, the flood stage vs. damage curves are typically combined with flood frequency data to express damage in average annual terms. Often this is completed using the HEC-FDA program, which can evaluate annual damages for both a baseline and a future condition. HEC-FDA, however, requires that changes in damage conditions occur in a predictable linear manner. Within the FIMP study area however, flood levels and therefore damages are expected to vary in relation to both future sea level and barrier island conditions. Because future barrier island conditions are strongly influenced by storm activity in prior years, it was determined that a lifecycle approach was needed to allow conditions and damages to vary in response to
FIMIStabilizationHurricaneSandyLimitedReevaluationReport–June2014 Page50
prior storm events. It should be noted that during Hurricane Sandy two (2) breaches occurred along Fire Island and one (1) breach along the reach between Moriches Inlet and Shinnecock Inlet.
Three separate damage simulation models were developed to link the hydrodynamic modeling of flood depths to the stage vs. damage data. The first simulation model was developed to evaluate Breach Open Conditions and the impact a barrier island breach will have on storm damages. The model quantifies the change in damages if a breach is open and provides input to the second model, the Breach Lifecycle Analysis. This model simulates breach occurrence and calculates average annual closure costs (including breach maintenance costs) and breach induced increases in damage over project life. The model was developed to quantify lifecycle impacts and to compare breach management alternatives. The third model is the Lifecycle Damage Analysis, which simulates storms and bay water levels including the impacts of erosion/storms in creating Future Vulnerable Conditions. Each of the models uses the @-Risk add-in to Excel to allow the calculation and processing of multiple lifecycle iterations, each representing a different series of random storms. Uncertainty in other parameters including sea level rise, erosion rates, and stage damage relationships, are also reflected using Monte Carlo sampling techniques. The reported results represent the average of numerous possible future lifecycles (between 12,500 and 25,000 depending on model) to ensure the full range of conditions are reflected in the results.
The Breach Open Condition model calculates the increase in storm damage while a breach is open. The model assumes a breach has occurred and simulates breach condition/size in the following months. Peak water levels are estimated based on the breach size, predicted increase in tide range, and the increased storm surge associated with random storm events. For each peak water level the damage is identified using the stage vs. damage curves. The key inputs to the model are the breach open water levels related to breach size, breach growth and closure rates, and the stage vs. damage relationship. A total of 27 conditions were modeled for each of the 43 reaches for each breach closure alternative. These reflect combinations of 5 different breach location scenarios (No Breach & 4 Breach Open Conditions), breaches occurring in Tropical or Ex-tropical seasons, and sea level conditions of baseline, 0.5 foot rise and 1.0 foot rise. The model results were tabulated to provide a summary of increased inundation damage for various breach conditions, closure rates and sea level rise conditions.
The Breach Only Lifecycle Model was developed to evaluate the impact of barrier island breaches and alternative closure designs and response times on the average annual storm damage and closure costs. The model considers the impacts of random storm events, and both long term and short term shoreline change at the 10 locations identified as most vulnerable to breaching. Key inputs to the model include stage frequency and storm erosion frequency relationships, post storm profile recovery rates, threshold surge elevations causing overwash, partial breaching and full breaching for various profile conditions, short term profile variability associated with shoreline undulations, and incremental damage associated with increased back-bay flood elevations and undermining of barrier island development. The model uses the @-Risk add-in to Excel to simulate the random occurrence of storms in future years, and if the surge elevation is sufficient to cause an overwash or breaching condition it calculates the associated damages, breach closure cost, or profile maintenance costs. The model tracks changes in the profile condition, and relates the breach and overwash threshold surge elevations to these changes.
The Lifecycle Damage Analysis model was developed to quantify baseline and future condition non-shorefront inundation damage. The model simulates storms and water levels including the impacts of erosion/storms in creating the Future Vulnerable Conditions and the associated increases in bay water levels. A Future Vulnerable Condition (FVC) has been developed based on historic erosion rates, the Existing Conditions Sediment Budget, Baseline Conditions numerical modeling storm surge and morphological results, historic storm impacts, and the assumed without project future condition regarding locally sponsored beach restoration and maintenance projects. The key model inputs include the bay stage frequency relationships for Baseline, Future Vulnerable, With Project and Breach Closed Conditions.

FIMIStabilizationHurricaneSandyLimitedReevaluationReport–June2014 Page51
The model applies weighting factors to interpolate between Baseline and Future Vulnerable conditions. Breach water level thresholds, ocean stage frequency, storm/long term erosion and recovery rates, temporal shoreline undulations and stage vs. damage relationships are also critical to the analysis.
The model simulates the random occurrence of both tropical and extra-tropical storms (not including Hurricane Sandy as data was not yet available), and tracks the impact of storms in altering the beach profile at the 10 locations most vulnerable to overwash and breaching. As the profile at these locations approaches the Future Vulnerable Conditions used to develop the FVC stage vs. frequency relationship, the model interpolates bay water levels between the Baseline condition stage and the FVC stage. For each year storms are simulated and the damage is identified from the stage vs. damage curves. This model was originally conducted for the GRR, and evaluated damages over a 50 year evaluation length (period of analysis). The Stabilization project will be evaluated for an evaluation period of 20 years. Since the model was used to establish stage damage relationships, this difference in study length does not overstate the impacts.
Table 3 illustrates that the greatest amount of damages are expected to occur in the area of Western and Central Great South Bay. Damages are also relatively high for Moriches Bay.
Table 4 provides a summary of the total without project equivalent annual damages for all damage categories. Following the table is an explanation of each of the damage categories.

FIMIStabilizationHurricaneSandyLimitedReevaluationReport–June2014 Page52
Table 3: Simulated Damages by Design Reach
Numb
er Mainland Reach ID
Name Buildings # Sub Bay
Equivalent Annual Inundation Damages
26.1 GSB-M-1A Unqua Point (County Line) to
Copiague Beach 1,715 WGSB $4,941,000
26.2 GSB-M-1B Copiague Beach to Venetian Shores
Beach 4,703 WGSB $3,413,000
26.3 GSB-M-1C Venetian Shores Beach to
NeGunntatogue Creek 2,323 WGSB $5,237,000
25.1 GSB-M-1D NeGunntatogue Creek to
Santapogue Point 1,960 WGSB $1,510,000
25.2 GSB-M-1E Santapogue Point to Sampawams
Point (Town Line) 2,413 WGSB $4,375,000
24 GSB-M-2A Sampawams Point (Town Line) to
Great Cove 3,175 WGSB $2,104,000
23.1 GSB-M-2B Brightwaters 364 WGSB $186,000
23.2 GSB-M-2C Lawrence Creek to Seatuck Refuge 1,746 WGSB $4,367,000
23.3 GSB-M-2D Seatuck Refuge to Heckscher Park
(Nicoll Point) 2,985 WGSB $1,419,000
28 Fire Island Lighthouse to Seaview
(Fire Island) 1,998 WGSB $10,836,000
27.1 Ocean Bay Park to Oakleyville
(Fire Island) 433 WGSB $995,000
Subtotal - Western Great South Bay Sub-Bay
23,815
$39,383,000
27.2 Sailors Haven to Water Island (Fire
Island) 712 CGSB $2,242,000
27.3 Water Island to Watch Hill (Fire
Island) 188 CGSB $585,000
22.1 GSB-M-3A Heckscher Park (Nicoll Point) to
Green Point 1,961 CGSB $9,239,000
22.2 GSB-M-3B Green Point to Blue Point (Town
Line) 2,095 CGSB $3,502,000
21.1 GSB-M-4A Blue Point (Town Line to Tuthill
Creek (BluePoint) 517 CGSB $794,000
21.2 GSB-M-4B Tuthill Creek to Swan River
(Patchogue) 1,641 CGSB $3,911,000
21.3 GSB-M-4C Swan River to Mud Creek 755 CGSB $461,000
Subtotal - Central Great South
Bay Sub-Bay7,869
$20,734,000
21.4 GSB-M-5A Mud Creek to Howell Creek 747 EGSB $1,353,000
21.5 GSB-M-5B Howell Creek to Bellport Marina 225 EGSB $120,000
21.6 GSB-M-5C Bellport Marina to Carmans River 428 EGSB $845,000
20 GSB-M-6A Carmans River to Smith Point
Bridge 571 EGSB $479,000
Subtotal - Eastern Great South
Bay Sub-Bay1,971
$2,796,000
19 Moriches Inlet to Quantuck Canal
(Westhampton Barrier) 258 MOR $5,000
18.1 MB-M-1A Smith Point Bridge to William 3,070 MOR $9,176,000

FIMIStabilizationHurricaneSandyLimitedReevaluationReport–June2014 Page53
Number
Mainland Reach ID
Name Buildings # Sub Bay
Equivalent Annual Inundation Damages
Floyd Estate
18.2 MB-M-1B William Floyd Estate to Forge
River 208 MOR $422,000
18.3 MB-M-1C Forge River to Radio Point 1,343 MOR $5,737,000
17.1 MB-M-2A Radio Point to Harts Cove 226 MOR $1,434,000
17.2 MB-M-2B Harts Cove to Seatuck Creek (Town
Line) 94 MOR $22,000
16.1 MB-M-3A Seatuck Creek (Town Line) to Fish
Creek 137 MOR $366,000
16.2 MB-M-3B Fish Creek to Speonk Point 318 MOR $1,427,000
16.3 MB-M-3C Speonk Point to Apacuck Point 432 MOR $1,668,000
16.4 MB-M-3D Apacuck Point to Quantuck Bay 611 MOR $3,158,000
Subtotal - Moriches Bay Sub-Bay 6,697 $23,416,000
Total: Back-bay Area 40,352 $86,329,000 Discount Rate 3.50%, Period of Analysis: 20 yrs Damages include the effects of Sea Level Rise over the 50 year Analysis Period
Table 4: Summary of Without Project Equivalent Annual Damages
Damage Category Without Project Equivalent
Annual Damage
Inundation from inlet and back-bay wave, breaching, and overwash:
Mainland $71,666,000
Barrier $14,663,000
Subtotal Inundation $86,329,000
Damages due to a breach remaining open:
Inundation $7,601,000
Structure Failure (barrier island) $507,000
Subtotal Breach Open Damages $8,229,000
Shorefront Damages (Fire Island Sub-Reaches only) $2,250,000
Total Storm Damage $96,8688,000 Discount Rate 3.50%, Period of Analysis: 20 years Damages include the effects of Sea Level Rise over the 50 year Analysis Period
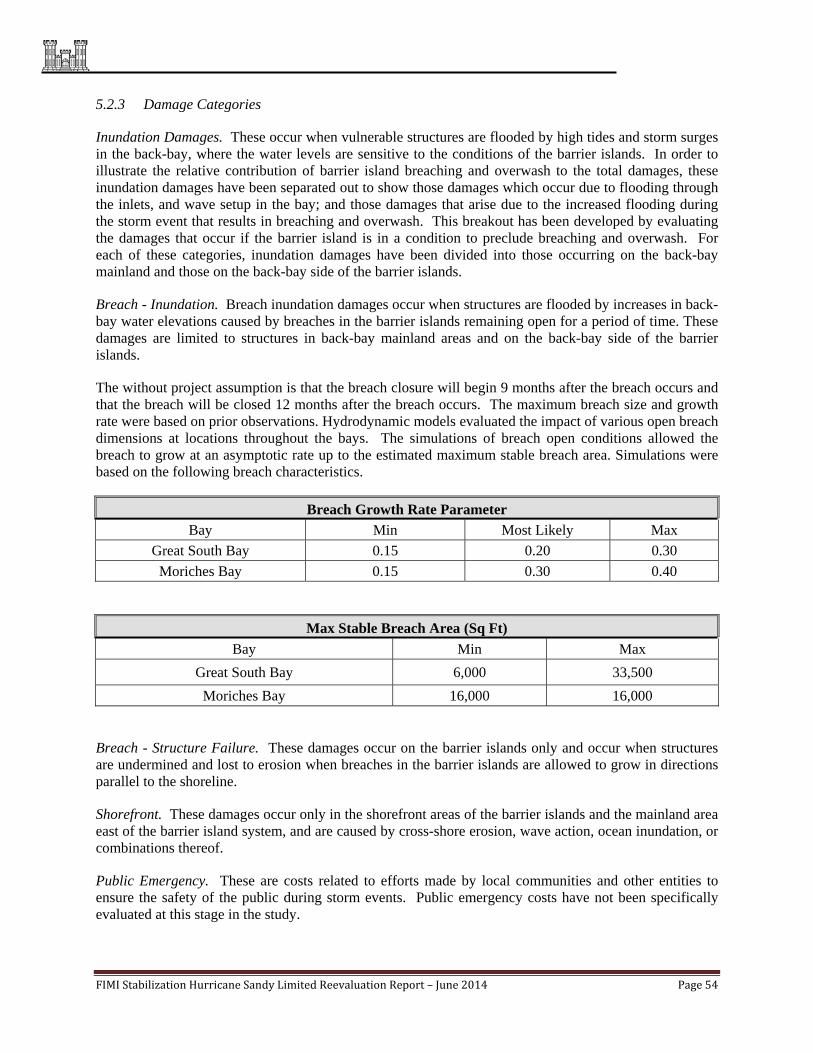
FIMIStabilizationHurricaneSandyLimitedReevaluationReport–June2014 Page54
5.2.3 Damage Categories
Inundation Damages. These occur when vulnerable structures are flooded by high tides and storm surges in the back-bay, where the water levels are sensitive to the conditions of the barrier islands. In order to illustrate the relative contribution of barrier island breaching and overwash to the total damages, these inundation damages have been separated out to show those damages which occur due to flooding through the inlets, and wave setup in the bay; and those damages that arise due to the increased flooding during the storm event that results in breaching and overwash. This breakout has been developed by evaluating the damages that occur if the barrier island is in a condition to preclude breaching and overwash. For each of these categories, inundation damages have been divided into those occurring on the back-bay mainland and those on the back-bay side of the barrier islands.
Breach - Inundation. Breach inundation damages occur when structures are flooded by increases in back-bay water elevations caused by breaches in the barrier islands remaining open for a period of time. These damages are limited to structures in back-bay mainland areas and on the back-bay side of the barrier islands.
The without project assumption is that the breach closure will begin 9 months after the breach occurs and that the breach will be closed 12 months after the breach occurs. The maximum breach size and growth rate were based on prior observations. Hydrodynamic models evaluated the impact of various open breach dimensions at locations throughout the bays. The simulations of breach open conditions allowed the breach to grow at an asymptotic rate up to the estimated maximum stable breach area. Simulations were based on the following breach characteristics.
Breach Growth Rate Parameter
Bay Min Most Likely Max
Great South Bay 0.15 0.20 0.30
Moriches Bay 0.15 0.30 0.40
Max Stable Breach Area (Sq Ft)
Bay Min Max
Great South Bay 6,000 33,500
Moriches Bay 16,000 16,000
Breach - Structure Failure. These damages occur on the barrier islands only and occur when structures are undermined and lost to erosion when breaches in the barrier islands are allowed to grow in directions parallel to the shoreline.
Shorefront. These damages occur only in the shorefront areas of the barrier islands and the mainland area east of the barrier island system, and are caused by cross-shore erosion, wave action, ocean inundation, or combinations thereof.
Public Emergency. These are costs related to efforts made by local communities and other entities to ensure the safety of the public during storm events. Public emergency costs have not been specifically evaluated at this stage in the study.

FIMIStabilizationHurricaneSandyLimitedReevaluationReport–June2014 Page55
Other. These damages include other items which have not been specifically evaluated at this stage in the study, such as damage to roads, utilities and coastal protection structures, and impacts on locally-based fishing fleets.
In addition to the damage categories outlined above, there are several additional sources of benefits which are to be analyzed separately. These include an increase in recreation use value, and prevention of loss of land. It is anticipated that the inclusion of these additional benefits (along with the damage categories mentioned above which have yet to be specifically evaluated) will not alter the results of the economic analyses completed thus far.
Table 4 helps to illustrate the storm damages that can occur, as a basis for presenting the alternatives that are available to address these problems, and the relative magnitude of each problem. This illustrates that of the $97 Million in annual damages calculated $72 Million (74%) of the damages is because of flooding of the back-bay areas that is likely to occur due to overwashing or breaching (regardless of the barrier island condition). These are the damages that need to be addressed with alternatives that directly affect these mainland areas. Another $15 Million (15%) in damages are incurred by flooding on the back-bay side of the barrier islands.
$8.2 Million in damages (8%) are due to damages that occur when a breach remains open. These are damages that can be reduced with alternatives to both reduce the likelihood of breaching, and respond to close breaches quickly.
$2.3 Million in damages, representing 2% of the total damages arise due to damages to the shorefront. These damages are reduced by the alternatives to reduce the potential for breaching, as well as with alternatives specifically developed to address shorefront damages.
5.2.4 Damage Sensitivity and Uncertainty
As described above, annual damages represent the expected average or mean results. The actual amount of future damages is highly sensitive to the timing and sequence of storms, future events that cannot be predicted. The life cycle simulation has incorporated the uncertainty of these parameters by allowing the values to vary in each simulation. In order to account for uncertainties in the timing and impacts of various storms, calculations are performed for a large number of lifecycles and mean or average value is reported.
In the WOPFC it is expected that future changes will occur within the estuaries and along the bay shores. It is expected that changes in the estuary will continue as a result of increases in sea level, and also because of future barrier island breaches. As is the case for the barrier island condition, it is expected that the spatial and temporal magnitude of the hydrodynamic changes in the estuary due to breaching and overwash would be reduced by human intervention to reduce the potential for breaching, and through breach closure. While there may be short-term changes in the inlet regime associated with Barrier Island breaching, it is expected that the future bay hydrodynamic processes would be represented by the current inlet conditions.
Sea Level Rise
In addition to considering the statistical uncertainty of damages discussed above, the analysis also considered the sensitivity of the results to the potential for accelerated rates of future sea level rise (SLR). The mean damages are based on a projection of the historic (low) mean Sea level rise trend of 0.0127 feet/year at Sandy Hook, New Jersey, as specified in ER-1100-2-8162. There are various projections of
FIMIStabilizationHurricaneSandyLimitedReevaluationReport–June2014 Page56
accelerated sea level rise which would significantly increase the storm damage risk within the study area. In order to evaluate the impact of potentially higher rates, additional lifecycle simulations were performed using a sea level rise rate (intermediate rate) of .026 feet/year, or 1.3 feet in 50 years. While the impacts of accelerated SLR on the annual damages varied considerably between the reaches (from about a 30% to a 70% increase), the overall impact of such an accelerated sea level rise is about a 45% increase in the without project damages. The sea level rise analysis was conducted for the on-going FIMP reformulation and evaluated the impacts over a 50 year evaluation length. The Stabilization effort considered the sea level rise impacts over a 20 year evaluation period, so that the impacts were not overstated. Changes in sea level over the 20 year FIMI analysis period are minimal, even using the high rate of sea level change per ER 1110-2-8162, Based on current projected sea level rise rates, impacts to barrier island morphology caused by the implementation of the FIMI project (one time placement of dune and beach berm) will be negligible over the next 20 years.
It is acknowledged that there are projections for larger increases in sea level rise, an increase of up to 2.7 feet (high rate per ER 1100-2-8162) over 50 years period of analysis. This scenario was not evaluated. This increase is so large that it is unlikely that the analysis framework we have established would predict accurate results. As an example, in Great South Bay, an increase of 2.7 feet in sea level rise would result in the flooding due to a 2-yr event (with 2.7 feet of SLR included) to have a flooding effect greater than the currently modeled 500-yr event. Under such extreme changes in sea level rise, it is highly likely that the assumptions made for actions to occur in the WOPFC would not be valid.
FIMIStabilizationHurricaneSandyLimitedReevaluationReport–June2014 Page57
6.0 STUDY GOALS AND OBJECTIVES
6.1 Study/Project Goals
The goal of the on-going and overall parallel FIMP Reformulation Study effort is to manage risks along the mainland and barrier island by reducing the potential for breaching and overwash of the barrier island, and directly addressing residual flooding risks along the bayside shoreline that occur independent of the barrier island condition.
Future breaching and overwash is considered imminent given the eroded state of the barrier as a result of the impacts of Hurricane Sandy. Therefore, the short-term goal of this FIMI Stabilization effort is to provide immediate stabilization and storm risk management to the communities on or behind the Fire Island barrier island. The stabilization project utilizes analysis conducted to date for the overall FIMP Reformulation Study, described below but does not pre-suppose the outcome of the Reformulation or limit the range of options that could be implemented as part of the overall FIMP project.
6.2 Planning Objectives
Engineering Regulation 1105-2-100 defines the Federal objective of water and related land resources project planning is to contribute to national economic development (NED), consistent with protecting the nation’s environment, pursuant to national environmental statues, applicable executive orders, and other federal planning requirements. A secondary objective of this project is to integrate opportunities for advancing National Ecosystem Restoration (NER) objectives, consistent with the NED objectives that restore the coastal processes in a manner to advance the USACE’s Strategic Vision, Environmental Operating Principles, and Regional Sediment Management Principles. These objectives have been established by the U.S Water Resources Council’s Economic and Environmental Principles and Guidelines for Water and related Land Resources Implementation Studies (P&G’s) on 10 March 1983.
The objective of this stabilization effort is to provide a separate, independent Coastal Storm Risk Management Plan that can address the extensive and immediate problems associated with the extremely vulnerable Fire Island barrier island conditions, that can proceed independent of the ongoing FIMP Study.
6.3 Project Constraints
Formulation and evaluation of alternative improvement plans are constrained by technical, environmental, economic, regional, social, and institutional considerations. These constraints must be considered in current and future project planning efforts, as summarized below.
Technical Constraints
Plans must represent sound, safe, acceptable engineering solutions. Plans must be in compliance with sound engineering practice and satisfy USACE regulations. Plans must be realistic and state-of-the-art. Reliance on future research and development of key
components is unacceptable. Plans must provide storm risk management.
FIMIStabilizationHurricaneSandyLimitedReevaluationReport–June2014 Page58
Economic Constraints
Plans must be efficient. They must represent optimal use of resources overall. Accomplishment of one economic purpose cannot unreasonably impact another economic system.
The economic justification of the proposed project must be determined by comparing the anticipated annual tangible economic benefits which should be realized over the project life with the average annual costs
Environmental Constraints
Plans cannot unreasonably impact environmental resources.
If a potential adverse impact is established, plans must consider replacement measures and should adopt such measures, if justified.
Where opportunities exist to enhance significant environmental resources, the plan should incorporate all justified measures.
Regional and Social Constraints
Reasonable opportunities for development within the study scope must be weighed relative to others, and views of State and local public interests must be solicited.
The needs of other regions must be considered and one area cannot be favored to the unacceptable detriment of another.
Institutional Constraints
The State must be willing to participate in a plan to provide storm risk management, cost-share and be responsible for the operations and maintenance of the completed project.
Federal and State participation must be contracted for the recommended period of time for implementation, although no assurances can be made that future Federal budgets will accommodate the capability funding against competing needs.
Plans must be consistent with existing Federal, State, and local laws.
Plans must be locally supported to the extent that local interests must, in the form of a signed Project Partnership Agreement (PPA), guarantee all items of local cooperation.
Local interests must agree to provide public access to the beach in accordance with Federal guidelines and with requirements of State laws and regulations.
The plan must be fair and find overall support in the region and State.
Plans must be consistent with State Coastal Zone Management Policies to the maximum extent practicable and consider such policies in plan formulation.
Each considered measure must identify environmental impacts and appropriate mitigation (mitigation measures for the FIMI project are not required).
Any plan within the jurisdictional boundaries of the National Park Service, Fire Island National Seashore must be compatible with the goals and objectives of the Fire Island National Seashore, and be mutually acceptable to the Secretary of the Army and Secretary of the Interior.

FIMIStabilizationHurricaneSandyLimitedReevaluationReport–June2014 Page59
Stabilization Constraints
The Stabilization Plan must have independent utility
The Stabilization Plan cannot foreclose on alternatives under evaluation in the overall FIMP Reformulation Study
The Stabilization Plan must be within the current FIMP authorities as authorized in the River and Harbor Act of 14 July 1960 in accordance with House Document (HD) 425, 86th Congress, 2d Session, dated 21 June 1960, which established the authorized project. The FIMP authorization precedes authorization of PL 113-2 in 2013; thus providing the authority for the Stabilization Plan as an HSLRR.
FIMIStabilizationHurricaneSandyLimitedReevaluationReport–June2014 Page60
7.0 FORMULATION OF FIMP ALTERNATIVE PLANS
This Chapter of the report provides a summary of the formulation of plans for the Reformulation Study that culminated in the identification of a Tentative Federal Selected Plan (TFSP) as an introduction to the FIMI Stabilization effort. The Fire Island Inlet to Montauk Point, New York, Combined Beach Erosion Control and Hurricane Protection Project (FIMP) was first authorized by the River and Harbor Act of 14 July 1960 which established the authorized project. The project is being reformulated by USACE as the lead Federal agency to identify a comprehensive long-term solution to manage the risk of coastal storm damages along the south shore of Long Island in a manner which balances the risks to human life and property while maintaining, enhancing, and restoring ecosystem integrity and coastal biodiversity. The overall FIMP reformulation study was undertaken to evaluate alternatives to determine Federal interest in participating in one or more of these alternatives, and identify a mutually agreeable joint Federal/state/locally supported plan for addressing the storm risk management needs in the study area. Prior to the Fall of 2012, the most recent effort in the FIMP Reformulation Study had been the refinement of the plan alternatives developed in 2009 and presented by the federal agencies to state and local officials in 2011, as a Tentative Federally Supported Plan (TFSP) in preparation for finalizing the overall study’s recommendation in the form of a General Reevaluation Report (GRR). The planning for the FIMP Overall Project progressed to the point of identifying a Tentative Supported Plan (TSP) through the fall of 2012 and is being finalized in the overall FIMP GRR.
7.1 FIMP Reformulation Overview
The FIMP authorized project provides for beach erosion control and hurricane protection along five reaches of the Atlantic Coast of New York from Fire Island Inlet to Montauk Point by widening the beaches along the developed areas and by raising dunes to an elevation of 20 feet above mean sea level, from Fire Island Inlet to Hither Hills State Park, at Montauk and opposite Lake Montauk Harbor. This construction would be supplemented by grass planting on the dunes, by interior drainage structures and the possible construction of 50 groins, and by providing for subsequent beach nourishment.
As described in the Project history section of the report, the Council on Environmental Quality (CEQ) in 1978 recommended project reformulation, to ensure the entire project is being addressed as a system. Detailed discussion and presentation of the multi-phased screening and analysis of study measures will be presented in the overall FIMP reformulation study in a draft GRR.
7.1.1 Plan Evaluation Criteria
The proposed FIMP alternatives and plans were evaluated against several different sets of evaluation criteria. Each storm risk management alternative was first evaluated relative to the NED criteria, to identify the effectiveness of the proposed alternative in addressing the primary objective. For measures developed for purposes of habitat restoration, these alternatives were evaluated relative to their ability to contribute to the NER objective. The effectiveness of the alternative in meeting a national objective is the primary evaluation method to determine if the alternative should be considered further.

FIMIStabilizationHurricaneSandyLimitedReevaluationReport–June2014 Page61
7.1.2 Summary of Alternative Plan Comparison
The following is a summary of the formulation process to date which identified the TSP.
The FIMP Reformulation Study followed three-iterations of planning to arrive at the TSP, including first an initial screening of measures, to identify what types of solutions warranted further consideration. This initial screening was followed with a design and evaluation of alternatives where each measure from the screening phase was developed for different scales of risk management and compared relative to each other to identify the optimal scale of protection. The third phase of the alternative analysis was the combination of these optimized features into plans.
The result of the design and evaluation analyses of proposed alternatives identified that a wide range of the individual alternatives are cost effective options for Storm Risk management within the Study Area. The analysis also indicated that there is not one alternative that addresses all the storm risk management problems, but rather, addressing multiple problems requires multiple solutions. In this respect, many of the alternatives considered complement each other, and Alternative Plans benefit from combinations of alternatives. In addition, the NER evaluation of measures identified that various restoration alternatives are complimentary to, or compatible with each of the Storm Risk management Plans. This phase recommended the following features be integrated into overall Plans of improvement:
Inlet bypassing Plans Breach Response Plans (Responsive Plan at +9.5 ft NGVD, Responsive or Proactive Plans at +13
ft NGVD) Non-Structural Plans (6-year and 10-year levels of risk management) - defined as those activities
to minimize potential damages through elevation, relocation, flood proofing, buyout, etc Beachfill (13 ft Dune and 15 ft Dune) - soft structural measures, generally are those constructed
of sand and are designed to “augment and/or” mimic the existing natural protective features These Alternative Plans were developed by combining the above alternatives in accordance with the procedures in the Planning Overview Chapter. The approach gives first priority to management options, particularly options that restore natural processes. The second priority is to include non-structural alternatives with beach nourishment or other structural alternatives considered last. This formulation approach ensures that Plans are consistent with the NY State Coastal Zone Management policies, and also places a priority on avoiding or minimizing any negative environmental impacts.
Based on the evaluation of the individual alternatives, combined plans were developed. First, Second and Third added plans were developed by incrementally adding Management Alternatives (Plan 1), Non-Structural Alternatives (Plan 2), and Structural Alternatives (Plan 3). The scale of the alternatives selected for inclusion was based on the results of the optimization of individual alternatives and the potential for the combined alternatives to more fully satisfy the project objectives and evaluation criteria.
Plan 1
The first series of plans (Plans 1.a and 1.b) reflect combinations of Management Alternatives & have combined the Inlet Management and BCP Alternatives. The Inlet Management Alternative includes continuation of the authorized project at the inlet, plus additional bypassing of sand from the ebb shoal to offset the erosion deficit. Inlet Management is compatible with all plans in the Great South Bay, Moriches Bay and Shinnecock Bay reaches. Plan 1.a is based on the combination of the economically optimum Inlet Management Alternative and BCP Alternative (13 feet NGVD BCP). Plan 1.b combines the optimum Inlet Management Alternative with the 9.5 feet NGVD BCP Alternative.

FIMIStabilizationHurricaneSandyLimitedReevaluationReport–June2014 Page62
Plan 1 includes breach response plans along the barrier island, and inlet bypassing at the inlets achieved by continuation of the authorized projects at the inlets, and the additional bypassing of sand through dredging of the ebb shoal in the amount of 100,000 cubic yards per year at each inlet. The results of the above analysis, shows that plan 1 (both 1a, and 1b) is marginally effective.
This plan was not a complete solution, in that it only addresses damages that occur due to a breach remaining open, and as a result reduces only aminimal percentage of the overall damages. The remaining damages that arise due to a combination of breach occurrence, bayside flooding, and shorefront damages remain unaddressed.
Plan 2
The second series of plans (Plan 2.a through Plan 2.h) reflect the addition of non-structural protection to Plan 1.a and Plan 1.b. The inclusion of non-structural protection is considered essential to address flooding from storm surge propagating through inlets into the bays and wind and wave setup within the bays. Plans 2.a through 2.d include combinations of the Management and Non-structural Alternatives without the Road Raising features, while plans 2.e through 2.h include the same combinations but with the addition of road raising at four locations.
Plan 2 includes breach response, inlet modifications, and mainland non-structural measures. All of the alternative plans are cost-effective. The plans that provide the greatest net benefits are Alternative 2F and 2H. Alternative 2H includes inlet management at the inlets (consistent with each alternative), a breach response plan with the +13 feet NGVD cross-section, non-structural plan 3, which addresses structures in the existing 10-yr floodplain, and road raising at 4 locations.
Plan 3
The third series of plans (Plan 3.a through Plan 3.g) reflects the addition of beach nourishment to Plans 2.e through Plan 2.h. The inclusion of Beach Nourishment will more fully address the various sources of flooding and will also address any significant erosion resulting from alterations of the existing shoreline stabilization structures. The Non-structural Alternatives selected for inclusion in these Plans include the Road Raising feature, which provides significant benefits above Plans 2.a through 2.d that exclude this feature.
The Beach Nourishment Alternative included in these Plans is the + 15 feet NGVD dune/ 90 foot berm width design with the minimum real estate alignment. Within the Shinnecock Bay reach the Breach Contingency Plan with the +13 feet NGVD design section has been included. For Reaches protected by Beach Nourishment, breaches would be closed to the design section as part of the project maintenance or major rehabilitation.
Within the Great South Bay and Moriches Bay Reaches there are several environmentally sensitive areas along the barrier island that present a risk of future breaching with significant damage to back-bay development, but with little or no human development on the barrier. These locations include the Otis Pike Wilderness Area (OPWA), areas designated as Major Federal Tracts (MFT) by the Fire Island National Seashore (FIIS), and the Smith Point County Park (SPCP). Plans were developed to evaluate the impact of excluding these locations on Storm Risk management Benefits, Costs and BCRs. For Plans 3.b through 3.g, at any location in the Great South Bay and Moriches Bay Reaches where beachfill has been excluded due to environmental concerns, the Breach Contingency Plan with a + 9.5 feet NGVD closure design has been included. The lower level closure design has been selected for these locations as the alternative most compatible with special environmental concerns.
FIMIStabilizationHurricaneSandyLimitedReevaluationReport–June2014 Page63
The plans, with the inclusion of beachfill advance a greater number of objectives than plan 2, (particularly in addressing all the contributors to storm damages) but still have shortcomings when compared with the criteria. These Plans are considered to provide results that vary depending upon the extent of fill that is proposed, particularly as it relates to the criteria to balance storm risk management considerations with ecosystem restoration considerations. Plan 3A is the alternative which best addresses the Storm Risk management needs, but includes beachfill throughout, and as a result does not rank highly with respect to the criteria for balancing storm risk management needs and environmental needs, and also does not rank highly with consideration of the P&G criteria for implementability, since it is contrary to NPS policies for fill within undeveloped tracts of land. Alternative 3G includes beachfill in the developed areas, and replaces beachfill within the major public tracts of land with breach response plans. While this plan is less effective in managing the risk of storm damages, it is a plan which is economically viable, is better aligned with the P&G criteria, as being more consistent with the NPS policies, and better achieves the project objectives in that this plan balances storm risk management needs and ecosystem restoration needs.
7.1.3 Summary of Reformulation Results
Alternative Plan 3 is the plan that more completely addresses the NED criteria, the USACE Planning Guidance criteria. From the Alternative Plans evaluated within the framework of Plan 3, Plan 3A is the plan that best accomplishes the storm risk management objectives, while plan 3G is identified as the plan that best balances the storm risk management objectives, the P&G criteria..
While Plan 3G advances the P&G requirements the plan still does not achieve all of the objectives of the Vision Statement. Therefore, integration of additional alternatives to satisfy these requirements was considered, including the following:
Inclusion of the groin modification plan at Westhampton, and Ocean Beach Inclusion of the recommended restoration alternatives Inclusion of Land Management Measures Inclusion of an incremental adaptive management strategy over the project life to address the
uncertainties in project implementation, including consideration of climate change and adaptive management
A plan consisting of the above features was identified as the plan that meets the project objectives. This plan was briefed to the Federal, State and local government officials, and further presented at public meetings in summer 2010. The result of this analysis and outreach was the identification of a Tentative Federally Supported Plan (TFSP), which was transmitted to New York State for their consideration.
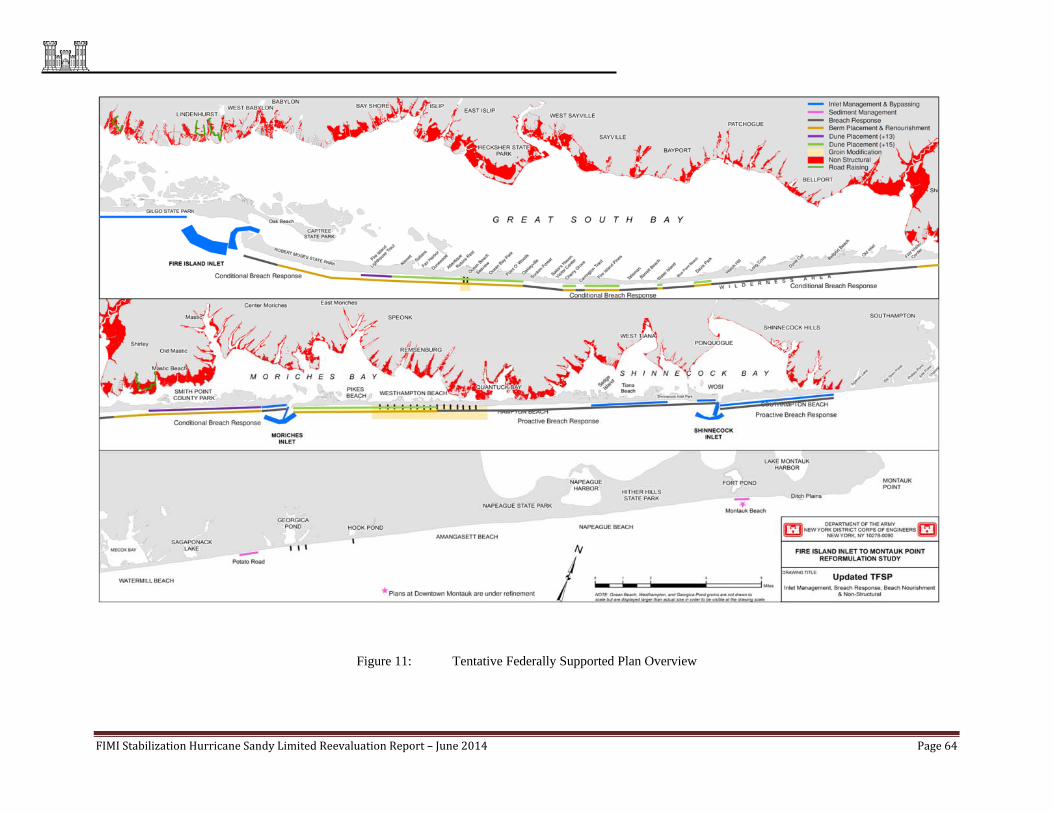
FIMIStabilizationHurricaneSandyLimitedReevaluationReport–June2014 Page64
Figure 11: Tentative Federally Supported Plan Overview

FIMIStabilizationHurricaneSandyLimitedReevaluationReport–June2014 Page65
8.0 IDENTIFICATION OF FIMI STABILIZATION PLAN
On October 29, 2012 as a consequence of severe coastal erosion during Hurricane Sandy, the dune and berm system along Fire Island reach in the FIMI study area is now depleted and particularly vulnerable to overwash and breaching during future storm events, which increases the potential for storm damage to shore and particularly back-bay communities. In response to extensive storm damages and increased vulnerability to future events, consistent with the Disaster Relief Appropriations Act of 2013 (Public Law. 113-2; herein P.L. 113-2), and recognizing the urgency to repair and implement immediate storm protection measures, particularly in the Fire Island to Moriches Inlet (FIMI) study area, USACE has proposed an approach to expedite implementation of construction of necessary stabilization efforts independent of the FIMP Reformulation Study. This approach has gained widespread approval from New York State, Suffolk County, N.Y. and the local municipalities, who recognize the extreme vulnerability of the coast, and the need to move quickly to address this need. This approach has also gained approval from Steven L. Stockton, P.E., Director of Civil Works, USACE in a memorandum dated 8 January 2014. The post-Sandy Fire Island Stabilization Project, which encompasses Fire Island to Moriches Inlet, was developed based upon the Engineering, Economic, Environmental, and Planning efforts that have been undertaken through the ongoing FIMP Reformulation Study that compared alternatives referenced in Chapter 7 of this report to identify the recommended scale and scope of a beachfill project from the TSP, as an independent stabilization effort. Stabilization efforts were focused on FIMI as this reach is the most populated and subject to barrier island overwash and breach thereby exposing the back-bay to considerable damages. There is a more urgent need to advance the stabilization of this reach due to its vulnerability and potential for major damage and risk to life and property. This stabilization effort has been developed as a one-time, stand-alone construction project to repair damages caused by Hurricane Sandy and to stabilize the island. This Chapter demonstrates that the FIMI Stabilization Project has its own independent utility, and as developed does not limit the options available in the overall FIMP Reformulation Study or pre-suppose the outcome of the Reformulation Study. After the initial placement of sand, the project is expected to erode, and diminish in its protective capacity, eventually returning to a pre-project condition. In the absence of a future decision, the area is expected to continue to be managed consistent with current practices.
Effective Project Life
The Stabilization Project has been evaluated over a 50 year period to determine that 20 year is the period of time over which there is a measurable difference between the without project future condition and with-project condition. This difference is based upon a combination of factors including the effects of both sand placement and structure acquisition. The Project is designed with advance fill to ensure that the design conditions are maintained for a period of 5 years, under normal conditions. After this time, the project will erode into the design template, and offer residual, diminished protection. It is difficult to project the amount of time that residual protection from the fill will remain. It is estimated, under typical conditions, that the residual effect of the fill placement could last another 5 years. Even after the residual effect of beachfill has diminished, there is a longer residual effect that is provided by the acquisition and relocation of structures. Based upon the setback distances and background erosion rate, it has been projected that the residual effects of relocating these buildings would be an additional 10 years. The economics modeling has confirmed that the WOPFC and with-project condition results converge after 20 years, supporting a period of analysis of 20 years.
FIMIStabilizationHurricaneSandyLimitedReevaluationReport–June2014 Page66
8.1 Hurricane Sandy Design Considerations
Hurricane Sandy caused widespread beach and dune erosion along Fire Island. Post-Sandy measurements of volume loss of the beach and dunes indicate that on average the sub-aerial profile lost approximately 55 percent of its pre-storm volume equating to a loss of 4.5 million cubic yards (Hapke et al., 2013). A majority of the dunes were either flattened or experienced severe erosion / scarping. These changes were considered in the development of the FIMI plan. There has been substantial post-storm recovery of the beach in the months since Hurricane Sandy. Construction beach fill volumes required for the design condition will be based on project implementation surveys taken prior to the development of plans and specifications. Consideration was given to the alignment of the beachfill, extent of beachfill, and the impact of these on Real Estate needs.
8.1.1 Alignment and Real Estate
In the absence of oceanfront structures, the most cost effective alignment is one that ties into the existing dune line and extends seaward from the existing shoreline only the distance necessary to achieve the required level of protection. The beachfill alignment also affects costs, as beachfill losses caused by “spreading out” or diffusion of beachfill will be greater the farther seaward an alignment is located.
Prior to Hurricane Sandy, the selected beachfill alignment, Minimum Real Estate Impacts (MREI), generally followed the existing dune alignment except within the communities where it was aligned seaward of the existing buildings to minimize real estate costs. Because of the extensive morphological changes observed during Hurricane Sandy, a landward shift in the beachfill alignment was evaluated and is required to account for, as much as possible the new existing (Post-Sandy) dune alignment.
The beachfill alignment, Updated Middle Alignment (MIDU), preserves as much as possible the existing (Post-Hurricane Sandy) dune alignment while balancing the cost of acquiring or relocating oceanfront structures versus increased beachfill needs. The selected plan requires approximately 3 million cubic yards less of initial beachfill. However, the selected alignment requires 41 real estate acquisitions, 6 real estate relocations and over 600 permanent easements for construction.
Lifecycle cost estimates for the MIDU and Minimum Real Estate Alignment (MREI) indicate that reduced annual costs in the MIDU due to the reduced initial fill volumes ($2.0 million per year) exceed the additional expense of the real estate acquisitions and relocations in the MIDU. This more landward alignment, which requires less sand is also more sustainable, and environmentally preferred, as it requires fewer sand resources.
8.1.2 Beachfill Extent
As a result of widespread dune erosion and berm flattening during Hurricane Sandy the alongshore extent of initial berm and dune fill construction was increased from the previously recommended plan. The construction has been developed to reinforce the existing dune and berm system along the island. The selected design includes beachfill at Robert Moses State Park, Fire Island Lighthouse Tract, all of the communities outside of Federal Tracts, and Smith Point County Park. Beachfill is not included in any Major Federal Tracts, except Fire Island Lighthouse which was requested by the National Park Service to protect the Lighthouse and the critical access road on and off the island. There are also incidental beachfill tapers onto adjacent Federal properties that are a necessary component of the Project. The beachfill in Smith Point County Park was also expanded to include a berm and dune features in portions of Smith Point County Park that are in an eroded condition due to the interruption of alongshore transport from updrift structures.
FIMIStabilizationHurricaneSandyLimitedReevaluationReport–June2014 Page67
8.2 Stabilization Plan Details
This Section provides the details of the Stabilization plan features recommended in this report for construction as a stabilization project. Stabilization efforts were focused on FIMI as this reach is subject to barrier island breach which exposes the back-bay to considerable damages. There is a more urgent need to advance the stabilization of this reach due to its vulnerability and potential for major damage and risk to life and property. The Stabilization Project has been developed to reinforce the existing dune and berm system along the island. The selected design includes beachfill at Robert Moses State Park, Fire Island Lighthouse Tract, all of the communities outside of Federal Tracts, and Smith Point County Park. Beachfill is not included in any Major Federal Tracts, except within Fire Island Lighthouse which was requested by the National Park Service to protect the Lighthouse, and the access road. Beachfill is also located on Federal tracts where incidental tapers are necessary for the project.
The Stabilization Project also includes acquisition and relocation of oceanfront structures, as well as construction easements. The Stabilization Project does not include renourishment of the project but is a one-time, stand-alone action.
8.2.1 Design Section
The Berm Only, Small, and Medium design templates are used in the selected plan. The Small and Medium design templates have a dune with a crest width of 25 feet and dune elevations of +13 and +15 feet NGVD, respectively. All three design templates have a berm width of 90 feet at elevation +9.5 feet NGVD. The proposed design (not construction) foreshore slope (from +9.5 to +2 feet NGVD) is roughly 12.1 on 1. Below MHW (roughly +2 feet NGVD) the submerged morphological profile, representative of each specific reach, is translated and used as the design profile.
Figure 12 shows typical design sections for a few reaches considered representative of the complete set of reaches where fill placement is considered provides an overview of the dune elevations by location along the selected plan. Detailed plan layouts (1 on 100 scale) are presented in Appendix C of this report.
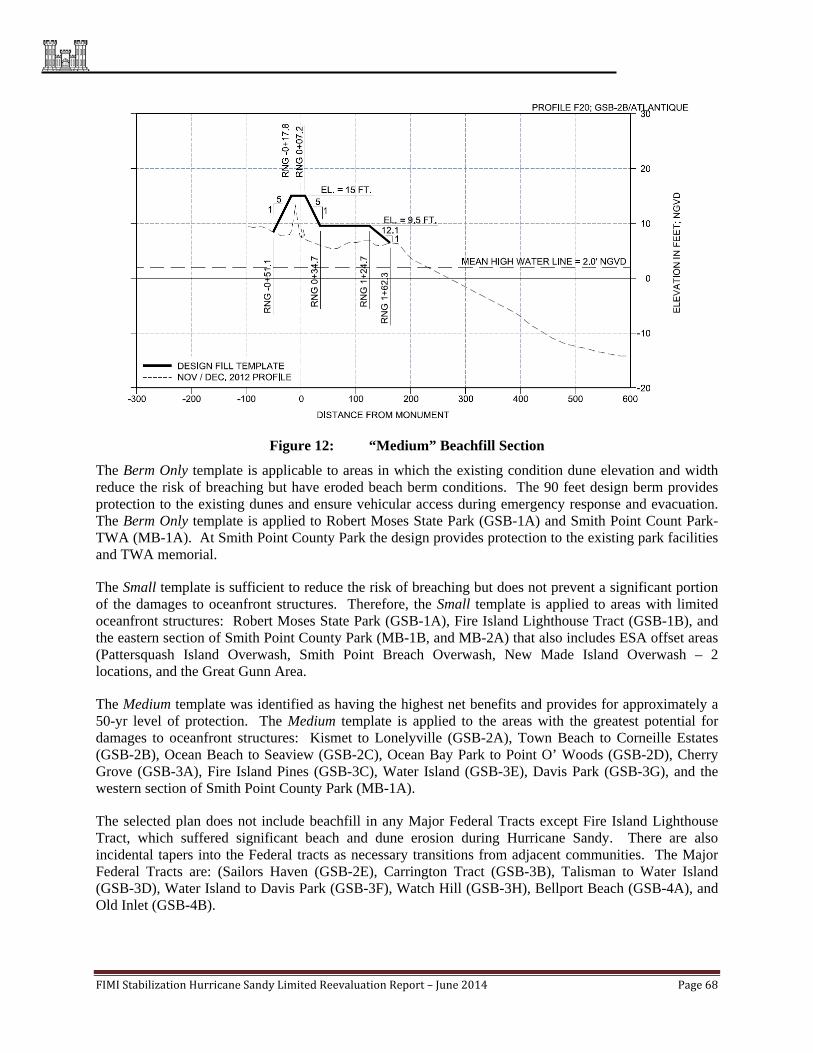
FIMIStabilizationHurricaneSandyLimitedReevaluationReport–June2014 Page68
Figure 12: “Medium” Beachfill Section
The Berm Only template is applicable to areas in which the existing condition dune elevation and width reduce the risk of breaching but have eroded beach berm conditions. The 90 feet design berm provides protection to the existing dunes and ensure vehicular access during emergency response and evacuation. The Berm Only template is applied to Robert Moses State Park (GSB-1A) and Smith Point Count Park-TWA (MB-1A). At Smith Point County Park the design provides protection to the existing park facilities and TWA memorial.
The Small template is sufficient to reduce the risk of breaching but does not prevent a significant portion of the damages to oceanfront structures. Therefore, the Small template is applied to areas with limited oceanfront structures: Robert Moses State Park (GSB-1A), Fire Island Lighthouse Tract (GSB-1B), and the eastern section of Smith Point County Park (MB-1B, and MB-2A) that also includes ESA offset areas (Pattersquash Island Overwash, Smith Point Breach Overwash, New Made Island Overwash – 2 locations, and the Great Gunn Area.
The Medium template was identified as having the highest net benefits and provides for approximately a 50-yr level of protection. The Medium template is applied to the areas with the greatest potential for damages to oceanfront structures: Kismet to Lonelyville (GSB-2A), Town Beach to Corneille Estates (GSB-2B), Ocean Beach to Seaview (GSB-2C), Ocean Bay Park to Point O’ Woods (GSB-2D), Cherry Grove (GSB-3A), Fire Island Pines (GSB-3C), Water Island (GSB-3E), Davis Park (GSB-3G), and the western section of Smith Point County Park (MB-1A).
The selected plan does not include beachfill in any Major Federal Tracts except Fire Island Lighthouse Tract, which suffered significant beach and dune erosion during Hurricane Sandy. There are also incidental tapers into the Federal tracts as necessary transitions from adjacent communities. The Major Federal Tracts are: (Sailors Haven (GSB-2E), Carrington Tract (GSB-3B), Talisman to Water Island (GSB-3D), Water Island to Davis Park (GSB-3F), Watch Hill (GSB-3H), Bellport Beach (GSB-4A), and Old Inlet (GSB-4B).
FIMIStabilizationHurricaneSandyLimitedReevaluationReport–June2014 Page69
Additional information on the Stabilization Project design sections is provided in Table 5: Overview of Selected Design Sections
8.2.1.1 Project Design Adjustments as Conservation Measures.
Extensive consultation was undertaken with the U.S. Fish and Wildlife Service and National Park Service, in coordination with New York State and Suffolk County in order to balance the needs and objectives of each party. This consultation is documented in the Biological Opinion which is attached to the Environmental Assessment. This consultation resulted in the evolution of project features for the FIMI project that were made to minimize potential effects to endangered species, maintain the effectiveness of the storm damage reduction plan, and balance the recreational use of the area. Consultation has resulted in adjustments to the plan that have been proposed as conservation measures, and adopted by the USFWS as reasonable and prudent measures, which are required for project implementation. These reasonable and prudent measures will be implemented where consistent with legal authority and subject to the availability of funds. These plan adjustments include the following:
1. Adaptive management of plover habitat through vegetation management to achieve sparsely vegetated overwash areas in Smith Point County Park at the Pattersquash Island Overwash, Smith Point Breach Location, and New Made Island Overwash
2. Devegetation and topographical alteration and management in the Vicinity of Great Gunn Beach, extending eastward to Moriches Inlet, to provide approximately 33.7 hectares of piping plover nesting and foraging habitats including ephemeral pools.
3. The creation of plover foraging and nesting habitat on six hectares of habitat in the vicinity of the dredge material management site located near New Made Island.
4. In the area of the Fire Island Lighthouse Tract, modification to the dune slope, and elimination of dune vegetation.
5. In the area of Robbins Rest, modification to the dune alignment to increase the amount of beach habitat.
6. The development and implementation of a coordinated plover monitoring program, coordinated mammalian predator management plan, coordinated stewardship, and coordinated effectiveness monitoring to inform the adaptive management of these habitat offset areas (described in Section 11.6.
Adaptive management of plover habitat through vegetation management. There are three overwash locations in Smith Point County Park (at the Pattersquash Island Overwash (13 hectares), Smith Point Breach Location (6.1 hectares), and New Made Island Overwash (10.5 hectares)) that have been identified as priority locations for maintaining early successional habitat for endangered species usage along the bayside. These areas have been identified as the area 75 feet north of the landward toe of the dune system north to the bay shoreline. In these areas the plan includes devegetation to more closely mimic conditions suitable to plovers. In addition, the plan also includes a commitment to monitor and adaptively manage these habitats should they begin to fill in with vegetation, or otherwise undergo succession to a habitat unsuitable to plovers. The proposed areas for devegetation and adaptive management are shown in Appendix C. Great Gunn Ephemeral Pool Area. The plan includes the devegetation and topographical alteration in the area of Great Gunn Beach, extending eastward to Moriches Inlet. The beach height will be lowered in this area to provide approximately 33.7 hectares of piping plover nesting and foraging habitats. The plan features (both layout and cross-section) are included in Appendix C. The plan layout reconfigures the existing dune, as necessary to maintain the existing dune height, and setback the protective dune alignment adjacent to Burma Road. Fronting the dune, the beach berm is graded to elevation +9 ft NGVD, and stepping down to an elevation of +7 ft NGVD to promote the formation of ephemeral pools.
FIMIStabilizationHurricaneSandyLimitedReevaluationReport–June2014 Page70
These plans will be further refined in plans and specifications to account for land-owner and resource agency input. This area will be adaptively managed for a period of 10 years. New Made Island Foraging and Nesting Habitat. The plan includes the creation of piping plover foraging and nesting habitat on six hectares of habitat in the vicinity of the dredge material management site located near New Made Island. Up to 6 hectare of bayside habitat will be created by lowering a portion of the existing dredge disposal dike to adjacent grades (+4 feet NGVD), regrading the existing substrate, and covering with 2 ft of clean sand. The plans are shown in Appendix C. These plans will be further refined in plans and specifications to account for land-owner and resource agency input. This area will be adaptively managed for a period of 10 years. Fire Island Lighthouse Tract. Within the Fire Island Lighthouse Tract, a portion of the area will also include modification of the dune slope, and planting. The plan includes a dune template aligned with the adjacent toe of dune, with 1V:10H seaward slope, 25 ft crest width, and 1V:10H landward slope to intersection of existing topography. These slopes have been selected to allow for shorebirds to cross the dune structure. To ensure the continued access across the dune, no vegetation planting or snow fencing would be included as a component of the project in this location. This dune alignment is shown in the attached plan sheets in Appendix C. Robbins Rest. In the Federal tract of land west of the community of Robbins Rest, the dune alignment has been adjusted landward to maintain a larger beach area for shorebird usage. This dune alignment is shown in the attached plan sheets in Appendix C. Additional information on all these features is further described in the District’s Biological Assessment, the USFWS Biological Opinion and Finding of No Significant Impact in the attached Environmental Assessment.

FIMIStabilizationHurricaneSandyLimitedReevaluationReport–June2014 Page71
Figure 13: Tentatively Selected Plan - FIMI

FIMIStabilizationHurricaneSandyLimitedReevaluationReport–June2014 Page72
Table 5: Overview of Selected Design Sections
Design Reach Location Length
(ft) Dune Elevation
(ft NGVD) GSB-1A RMSP 23,200 -
GSB-1B FILT 5,400 13
GSB-2A Kismet to Lonelyville 9,000 15
GSB-2B Town Beach to Corneille Estates 4,400 15
GSB-2C Ocean Beach to Seaview 3,800 15
GSB-2D OBP to POW 7,200 15
GSB-3A Cherry Grove 3,000 15
GSB-3C Fire Island Pines 6,400 15
GSB-3E Water Island 2,000 15
GSB-3G Davis Park 4,200 15
MB-1A SPCP-TWA 6,400 -
MB-1B SPCP 13,000 13
MB-2A MB-2A 7,800 13
8.2.2 Alignment
The beachfill alignment or baseline defines the cross-shore location of design section. The design sections are oriented to the baseline by setting the centerline of the design dune coincident with the baseline. In the absence of oceanfront real estate, the most cost effective alignment is one that ties into the existing dune line and extends seaward from the existing shoreline only the distance necessary to achieve the required level of protection.
The selected beachfill alignment, Updated Middle Alignment (MIDU), preserves as much as possible the existing (Post-Hurricane Sandy) dune alignment while balancing the cost of acquiring or relocating oceanfront structures. Lifecycle cost estimates for the MIDU and Minimum Real Estate Alignment (MREI) indicate that cost savings from the reduced initial fill volumes offset the expense of the real estate acquisitions and relocations.
The selected alignment requires a total of approximately 41 real estate acquisitions, 6 real estate relocations and over 600 permanent easements. The majority of the acquisitions are in either Ocean Bay Park (19) or Davis Park (19). The other three acquisitions are located in Dunewood (2) and Robbins Rest (1). The proposed relocations are located in Davis Park (3), Fire Island Pines (2) – Figure 14, Saltaire (1) and Ocean Beach (1). The Ocean Beach real estate relocation includes the water supply.
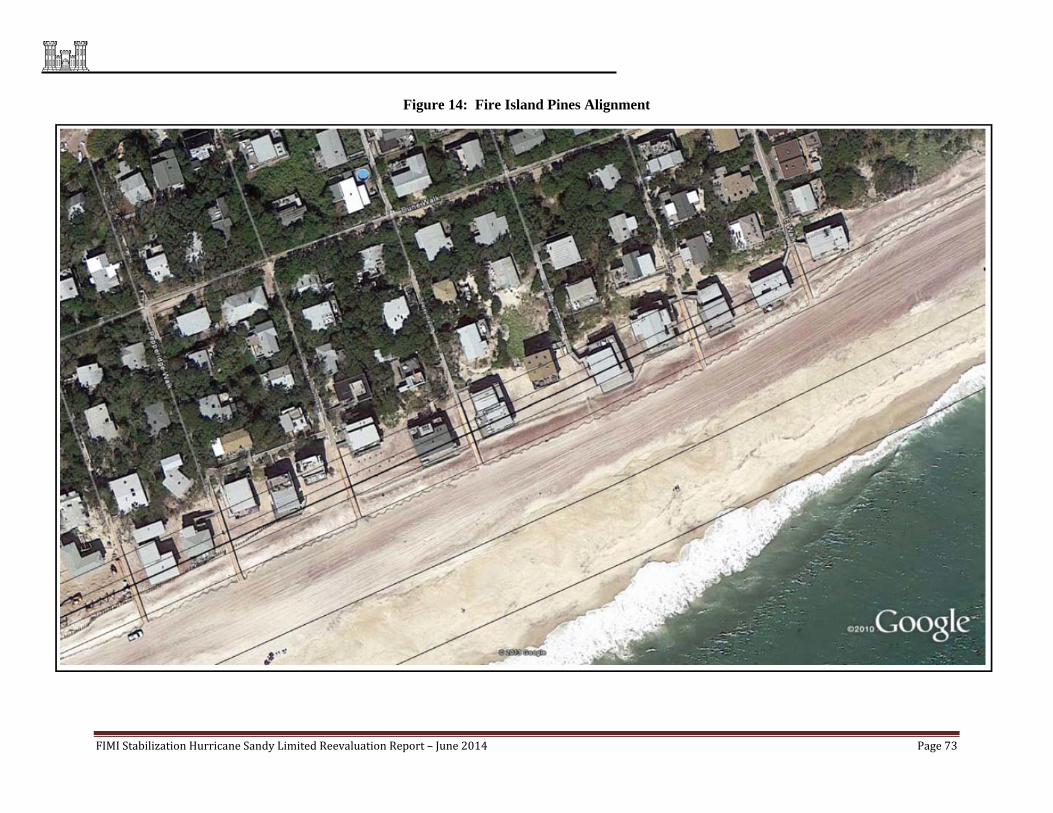
FIMIStabilizationHurricaneSandyLimitedReevaluationReport–June2014 Page73
Figure 14: Fire Island Pines Alignment
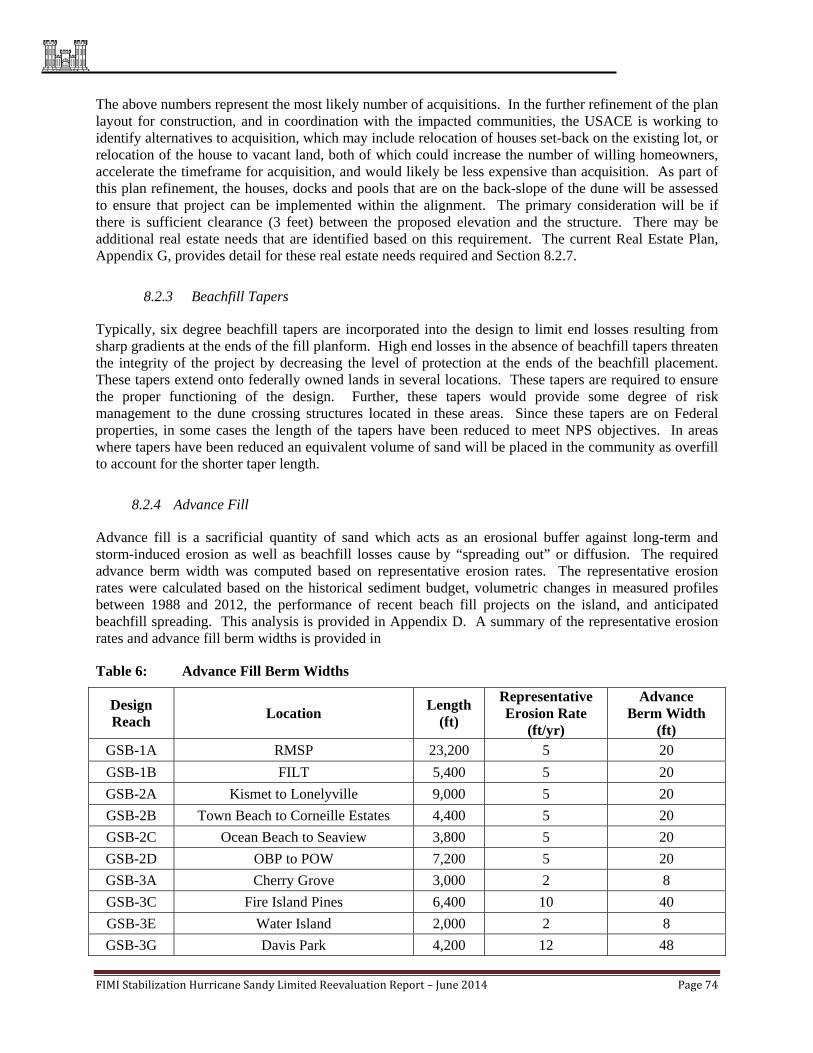
FIMIStabilizationHurricaneSandyLimitedReevaluationReport–June2014 Page74
The above numbers represent the most likely number of acquisitions. In the further refinement of the plan layout for construction, and in coordination with the impacted communities, the USACE is working to identify alternatives to acquisition, which may include relocation of houses set-back on the existing lot, or relocation of the house to vacant land, both of which could increase the number of willing homeowners, accelerate the timeframe for acquisition, and would likely be less expensive than acquisition. As part of this plan refinement, the houses, docks and pools that are on the back-slope of the dune will be assessed to ensure that project can be implemented within the alignment. The primary consideration will be if there is sufficient clearance (3 feet) between the proposed elevation and the structure. There may be additional real estate needs that are identified based on this requirement. The current Real Estate Plan, Appendix G, provides detail for these real estate needs required and Section 8.2.7.
8.2.3 Beachfill Tapers
Typically, six degree beachfill tapers are incorporated into the design to limit end losses resulting from sharp gradients at the ends of the fill planform. High end losses in the absence of beachfill tapers threaten the integrity of the project by decreasing the level of protection at the ends of the beachfill placement. These tapers extend onto federally owned lands in several locations. These tapers are required to ensure the proper functioning of the design. Further, these tapers would provide some degree of risk management to the dune crossing structures located in these areas. Since these tapers are on Federal properties, in some cases the length of the tapers have been reduced to meet NPS objectives. In areas where tapers have been reduced an equivalent volume of sand will be placed in the community as overfill to account for the shorter taper length.
8.2.4 Advance Fill
Advance fill is a sacrificial quantity of sand which acts as an erosional buffer against long-term and storm-induced erosion as well as beachfill losses cause by “spreading out” or diffusion. The required advance berm width was computed based on representative erosion rates. The representative erosion rates were calculated based on the historical sediment budget, volumetric changes in measured profiles between 1988 and 2012, the performance of recent beach fill projects on the island, and anticipated beachfill spreading. This analysis is provided in Appendix D. A summary of the representative erosion rates and advance fill berm widths is provided in
Table 6: Advance Fill Berm Widths
Design Reach
Location Length
(ft)
Representative Erosion Rate
(ft/yr)
Advance Berm Width
(ft) GSB-1A RMSP 23,200 5 20
GSB-1B FILT 5,400 5 20
GSB-2A Kismet to Lonelyville 9,000 5 20
GSB-2B Town Beach to Corneille Estates 4,400 5 20
GSB-2C Ocean Beach to Seaview 3,800 5 20
GSB-2D OBP to POW 7,200 5 20
GSB-3A Cherry Grove 3,000 2 8
GSB-3C Fire Island Pines 6,400 10 40
GSB-3E Water Island 2,000 2 8
GSB-3G Davis Park 4,200 12 48

FIMIStabilizationHurricaneSandyLimitedReevaluationReport–June2014 Page75
MB-1A SPCP-TWA 6,400 2 8
MB-1B SPCP 13,000 2 8
MB-2A MB-2A 7,800 2 8
8.2.5 Fill Volumes
The total initial project fill volume is the sum of the design fill, advance fill, and overfill and contingency. The total initial fill volumes for each design reach are presented in Table 7. The total initial fill volume for implementation is estimated at 6,992,145 cubic yards.
8.2.6 Borrow Areas
Fourteen suitable borrow areas offshore of the overall study area have been identified based on core samples. Suitability between native beach sediments and borrow sediments was evaluated using the 1984 Shore Protection Manual Overfill Method. Three of the fourteen borrow areas were selected for initial construction. These borrow areas were selected considering sand compatibility and to minimize adverse impacts to potential onshore sediment transport processes supported by data collection efforts of the USGS.
The sand required for initial construction will be obtained from three offshore borrow sites: 2C, 4C, and 5B. Borrow area 2C is located approximately 2 miles offshore of Point O’ Woods and contains an estimated 9,000,000 cubic yards of compatible sediment. In order to limit potential impacts to shoreface ridges containing modern Holocene sediments only the northeastern half of the borrow area will be dredged as shown in Figure 15. Borrow area 4C is located approximately 1.5 miles offshore of Pikes Beach and contains an estimated 700,000 cubic yards of compatible sediment. Borrow Area 5B is located approximately 1.5 miles offshore of the beach at Quantuck Bay and contains an estimated 9.5 million cy of compatible sediment. Figure 15: Selected Plan Borrow Area Locations provides the Selected Plan Borrow Area Locations.
The Borrow Area Appendix E provides further details on the selected borrow areas. Coordination with NYSDEC for Water Quality Certificate is pending. A borrow area monitoring plan is also being coordinated (See Section 11.5 for more information and Appendix E – Borrow Area Plan).
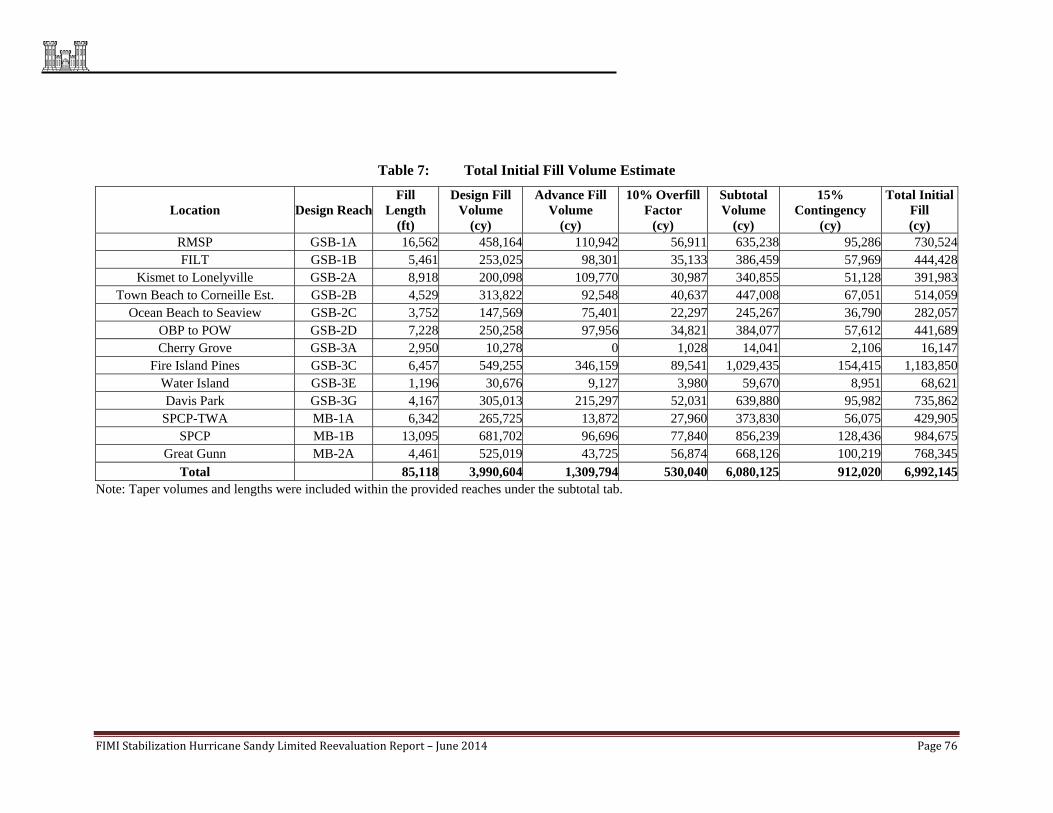
FIMIStabilizationHurricaneSandyLimitedReevaluationReport–June2014 Page76
Table 7: Total Initial Fill Volume Estimate
Location Design ReachFill
Length (ft)
Design Fill Volume
(cy)
Advance Fill Volume
(cy)
10% Overfill Factor
(cy)
Subtotal Volume
(cy)
15% Contingency
(cy)
Total Initial Fill (cy)
RMSP GSB-1A 16,562 458,164 110,942 56,911 635,238 95,286 730,524FILT GSB-1B 5,461 253,025 98,301 35,133 386,459 57,969 444,428
Kismet to Lonelyville GSB-2A 8,918 200,098 109,770 30,987 340,855 51,128 391,983Town Beach to Corneille Est. GSB-2B 4,529 313,822 92,548 40,637 447,008 67,051 514,059
Ocean Beach to Seaview GSB-2C 3,752 147,569 75,401 22,297 245,267 36,790 282,057OBP to POW GSB-2D 7,228 250,258 97,956 34,821 384,077 57,612 441,689Cherry Grove GSB-3A 2,950 10,278 0 1,028 14,041 2,106 16,147
Fire Island Pines GSB-3C 6,457 549,255 346,159 89,541 1,029,435 154,415 1,183,850Water Island GSB-3E 1,196 30,676 9,127 3,980 59,670 8,951 68,621Davis Park GSB-3G 4,167 305,013 215,297 52,031 639,880 95,982 735,862
SPCP-TWA MB-1A 6,342 265,725 13,872 27,960 373,830 56,075 429,905SPCP MB-1B 13,095 681,702 96,696 77,840 856,239 128,436 984,675
Great Gunn MB-2A 4,461 525,019 43,725 56,874 668,126 100,219 768,345Total 85,118 3,990,604 1,309,794 530,040 6,080,125 912,020 6,992,145
Note: Taper volumes and lengths were included within the provided reaches under the subtotal tab.
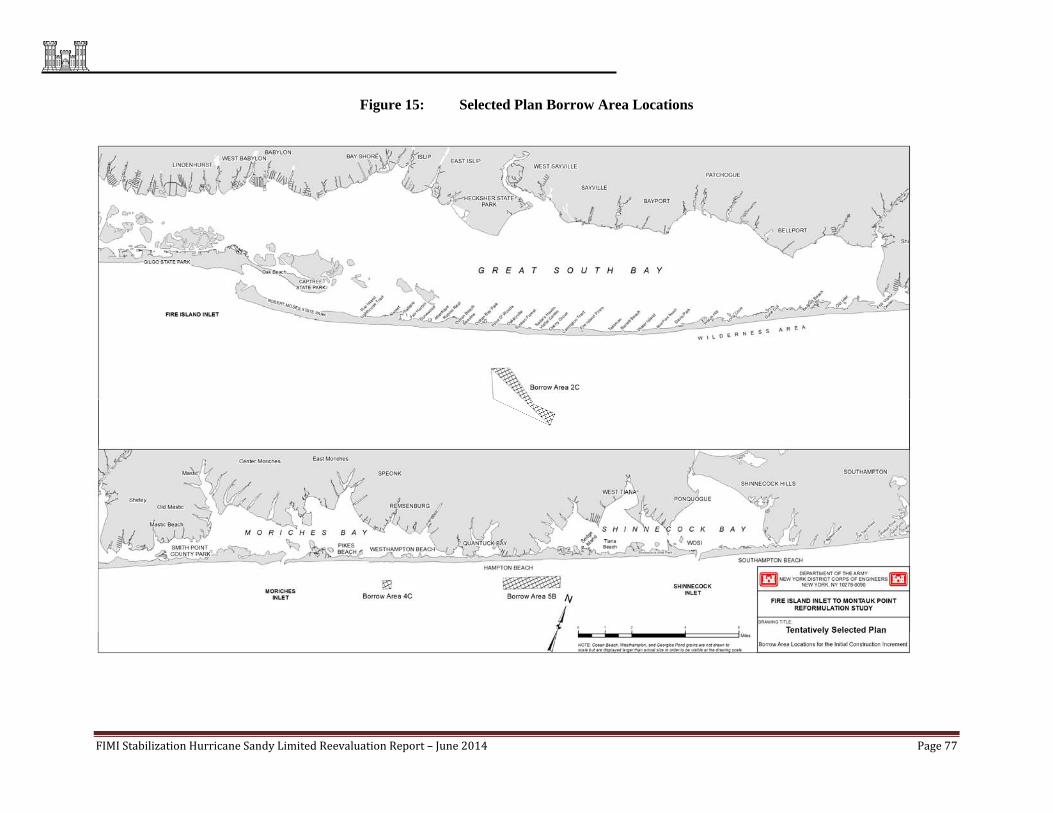
FIMIStabilizationHurricaneSandyLimitedReevaluationReport–June2014 Page77
Figure 15: Selected Plan Borrow Area Locations
FIMIStabilizationHurricaneSandyLimitedReevaluationReport–June2014 Page78
8.2.7 Real Estate
Real Estate requirements include the lands, easements, and rights of way, and relocations to implement the initial construction, and are described in complete detail in the Real Estate Appendix G. The lands, easements, rights of ways, and relocations necessary for implementing the project are described herein. The two types of easements required for the interim project include a perpetual easement, and a temporary work easement. A perpetual easement would be obtained along all areas where beachfill material is placed to allow continual access to construct, operate, maintain, patrol, repair, and replace the beach berm and dune. This easement precludes development, other than approved dune crossings and ensures that the design section would be held inviolate from future development. There are over 600 easements required of which 411 are on private properties. Since the Project alignment has been pulled landward, there are a number of buildings that could remain on the back-slope of the dune without interference with construction. A temporary work area easement would be obtained to allow right of way in, over, and across the land for a period of three years for construction operations. These easements are in addition to the acquisition of 41 houses and relocation of 6 homes, and a water supply that are necessary for constructing the project. The acquisition of the necessary lands and easements are a responsibility of the non-federal interests.
8.2.8 Public Access
Suitable public access is required for any areas where Federal expenditure of funds will be utilized for beach restoration. Analysis and acceptability of public access on Fire Island is complicated by the unique nature of the project area, including both the fact that the project area is largely within a national park, and that there is limited vehicular access to the majority of the area. Typically, public access analysis focuses on alongshore access relative to available parking areas. In the areas of Robert Moses State Park, and Smith Point County Park, the existing access clearly meets Federal and State Requirements. Within the boundary of FIIS, the existing public access has been established based upon the Fire Island National Seashore General Management Plan and EIS, which established a visitor usage pattern consistent with the park objectives (including low recreational usage areas). As the existing public access has been established by the NPS under its own EIS, the intent of the FIMI Stabilization project is not to change the existing access, but to ensure that existing access is acceptable, recognizing the park objectives. Analysis of the existing public access is detailed in the Public Access Plan (Appendix F). The analysis of public access, indicates that the areas where sand is being placed is fully accessible and in compliance with ER 1165-2-130.
8.3 Project Costs & Economics
Because of Hurricane Sandy’s impacts on the barrier island portion of the study area and the resulting degradation of the existing dune and berm features, the barrier island is exceptionally vulnerable to future severe storm impacts. The resultant degradation of the protection afforded the back-bay by the barrier island makes it imperative to immediately implement restorative measures and project betterments to the barrier island to prevent future damage to the study area. Therefore, a beachfill stabilization plan within the FIMI project area is being developed as a separate effort. The following paragraphs detail the costs and benefits of the FIMI project features.
8.3.1 Cost
An overview of the cost of the Stabilization plan features identified above are provided in this section and the following tables. The cost estimates form the basis for the economic analysis and benefit cost ratio. All cost estimates are based on October 2013 price levels.

FIMIStabilizationHurricaneSandyLimitedReevaluationReport–June2014 Page79
First Costs
First costs include charges arising from the acquisition or construction of each individual component, as well as the cost of easements, planning and environmental compliance, engineering and design, monitoring, engineering during construction, construction management (supervision & administration), and contingencies.
Real Estate
The Real Estate requirements, for this project, include the lands, easements, relocations and rights of way (LERR) to implement the initial construction increment. The project will require the following estates: Fee Acquisition, Perpetual Beach Storm Reduction Easement and Temporary Work Area Easement. Right of Entries, Special Use Permits and License Agreement may be used for parcels owned by Municipalities and local government. Approximately 733 properties will be impacted by the Fire Island Inlet to Moriches Inlet portion of the Project which includes 689 Easements: 411 Perpetual Beach Storm Damage Reduction Easements, 252 access agreements and 26 Temporary Work Area Easements (including the borrow areas). The 689 easements include the on-site relocation of 6 homes. 41 Fee Acquisitions of primarily summer residences are required and 2 Right-of-Entries for staging, storage of materials and equipment in the Robert Moses State Park and Smith Point County Park West, as well as for Bridge Access to project areas. The project also includes the Relocation of 1 Municipal Well in the Town of Ocean Beach. A Temporary Work Area Easement is required for the current and future location of the Municipal Well. A Temporary Work Area Easement for the well’s current location is included list of 26 required Temporary Easements. The new location of the well is currently undetermined, but will be located on property owned by the Town of Ocean Beach. The owners of the 41 fee acquisitions and 6 owners of the homes to be relocated may be eligible for relocation benefits under P.L. 91-646, as amended.
A Standard Perpetual Beach Storm Damage Reduction Easement (Standard Estate No. 26, EC 405-1-11) is required for private property along all areas where beachfill material is placed, or could potentially be placed, during construction, to allow continual access to construct, operate, maintain patrol, repair, renourish, and replace the beach berm and dune. This Easement precludes development, other than approved dune crossings and ensures that the design section, including 25 feet landward of the landward toe of the dune, would be held inviolate from future development. On government-owned properties, this easement would be achived with an access agreement. Temporary Work Area Easements are necessary to allow access in, over and across the land for a period of three years for construction operations. Lands in Fee will also be required for beachfill placement where the project footprint impacts an existing dwelling.
The market value of 41 oceanfront structures that would be acquired under the MIDU alignment was obtained from a market gross appraisal completed on June 10, 2013. The market gross appraisal reflects the value of the real estate post-Hurricane Sandy. The estimated market Gross Appraisal value is, as of June 10, 2013, $46,025,000 (including a 40% contingency). In addition to the costs associated with the acquisition of oceanfront structures, the cost of obtaining 689 construction easements is included.
The cost estimate for relocation of six (6) structures and relocation/reconstruction of the Ocean Beach well complex component required as part of the initial construction are estimated as $3,601,350, relied on the following:
Structure relocations will be performed in conjunction with the beach replenishment contract and therefore additional barging costs for mobilization /demobilization are not included.
Quantities are primarily based on the structure square foot areas obtained from Tax maps and aerial photographs.
FIMIStabilizationHurricaneSandyLimitedReevaluationReport–June2014 Page80
Unit pricing based on utilizing RSMeans® construction cost data with a 30% city cost index adjustment
Administration costs for real estate acquisitions, relocations, and easements were compiled from the Appraisal dated 10 June 2013 and total $1,687,400.
Since Federal funds will be applied in New York State, the Baseline Cost Estimate for Real Estate will be reviewed as the project progresses, and make adjustments to costs as necessary. The Baseline Cost for Real Estate includes Easement costs for the authorized project. The Total Baseline Cost for Real Estate for the project is $64,820,316 summarized as follows:
Administrative and Acquisition Costs:
Administrative Costs:
Perpetual Beach Storm Risk Management Easements (663) Temporary Construction Easements (26) And Staging Right-of-Entries (2): (Total 691 Properties)…………………………..……. $ 1,362,650 Administration of 6-home On-Site relocations ……………………………………….. $ 8,167 Administration of Fee Acquisitions: (41 homes)……………………………………….. $ 293,987
Subtotal $ 1,664,804
Fee Acquisition Costs:
Purchase of Privately-Owned Homes (41 Properties) …………………………….. $ 46,025,000 Perpetual Beach Easement Costs – 410 privately owned properties $ 16,610,512 Damage Costs (17 Pools and Decks)………………………………………………… $ 285,000
Damages to 7 Pools @ $25k = $175k Damages to 4 Small Decks @ $5 = 20k Damages to 6 Large Decks @ $15k = $90k
Relocation Benefits/Moving Expenses (47 Properties) @ R5k each…………. $ 235,000 Subtotal $63,155,512
TOTAL $64,820,316 Relocation Construction Costs:
Relocation Construction Cost for 6 homes………………………………………………. $ 1,001,347 Relocation and Reconstruction of Village of Ocean Beach Well System….. $ 2,600,000
Sub-Total……….(construction cost) $ 3,601,347 Beachfill
The Project consists of beachfill along Fire Island to reinforce the existing dune and berm system and the acquisition and relocation of ocean front structures.
The construction includes beachfill at Robert Moses State Park, Fire Island Lighthouse Tract, all of the communities outside of Federal Tracts, and Smith Point County Park. Beachfill is not included in any Major Federal Tracts, except Fire Island Lighthouse and in other Federal tracts when residential tapers are required. The beachfill sand will be obtained from three offshore borrow areas at the western and eastern ends of the project area.
FIMIStabilizationHurricaneSandyLimitedReevaluationReport–June2014 Page81
Beachfill construction costs include dredging, mobilization, and demobilization required for construction of the selected plan. Dredging costs per cubic yard by reach/borrow area and mobilization costs per dredging contract were provided by the USACE, using CEDEP (Corps of Engineers Dredge Estimating Program). The program assumes the use of 6,500 cy hopper dredges working 24 hours per day, 7 days per week with two daily 12-hours shifts. CEDEP incorporates influencing factors such as hopper capacity and safe load, area of borrow site, distance to borrow site, and current fuel, labor, and equipment costs. A $6,000,000 mobilization/demobilization cost is assumed per dredging contract. Engineering and design (E&D) and supervision and administration (S&A) costs are estimated to be 0.95% and 4.34% respectively of the total construction cost.
The Total Project Cost Summary is provided in Table 8: Annual Costs. The estimated first cost is $207,100,000 and the total project cost is $223,324,000. The estimate costs for each contract are escalated to the midpoint of construction (described above).
The Fire Island Stabilization Project has 100% Federal funding. The non-Federal partner is responsible for 0% of the total project cost.
The complete Cost Estimate details may be found in Appendix H of this report.
FIMIStabilizationHurricaneSandyLimitedReevaluationReport–June2014 Page82
Breach Response
Breach Response Costs have been calculated, and are shown below for purposes of the economic analysis, but are not included in the project costs. Breach closure is expected to occur in the without project condition and in the with-project condition, but with different probabilities of occurrence and different response protocols. These costs are developed to show the differences in expected breach closure costs, under the two scenarios and are factored into the benefits as a calculation of costs avoided. If FIMI is constructed under an approved PL 113-2 HSLRR, any necessary future breach response in the FIMI footprint would be implemented under PL 84-99.
The breach closure costs are a function of the breach growth rate, dredging production rates, washout losses, and the dredging costs. The cost of closing a breach increases non-linearly as the breach grows in size because not only is a greater volume of sediment required to fill the breach cross-section but washout losses increase. In general it is less expensive to close a breach with a 30” cutter head dredge because it has a faster dredging production rate than a smaller hopper dredge and consequently is capable of more immediate breach closure.
Breach Response Costs have been calculated, and are shown below for purposes of the economic analysis, but are not included in the project costs. Breach closure is expected to occur in the without project condition and in the with-project condition, but with different probability of occurrence. These costs are developed to show the differences in expected breach closure costs, under the two scenarios and are factored into a calculation of costs avoided. Historical breach observations in Great South and Moriches Bay were used to determine appropriate breach growth rates. The unit costs of dredge placement applied for breach closure cost estimates are similar to the unit prices determined with CEDEP for initial construction and a $4 million mobilization / demobilization cost is applied for each breach (assuming a 3,800 cy hopper dredge).
Annual Costs
Annual costs incorporate the first costs, beachfill, and berm and fill maintenance costs. Annual costs assume a project life of 20 years and an interest rate of 3.50%. Annual costs are presented in Table 9: FIMI Project Residual Storm Damages and presents an estimated breach closure cost for the with project condition, which is lower than the breach closure cost presented in Table 11, which is the avoided cost of breach closure activities in the absence of a federal project. It is assumed that the formal breach response protocol implemented as part of the project will trigger breach closure sooner, resulting in a smaller size of the breach, and less volume of sediment for repair.
Table 8: Annual Costs
Cost Category
Beach Fill $207,100,000
Nonstructural $0
Road Raising $0
Total First Cost $207,100,000
Total IDC* $3,553,000
Total Investment Cost $210,714,000
Interest and Amortization $14,826,000
FIMIStabilizationHurricaneSandyLimitedReevaluationReport–June2014 Page83
Operation & Maintenance** $6,000
BCP Maintenance*** $561,000
Inlet Bypassing $0
Renourishment $0
Subtotal (Annual) $15,392,000
Annual Breach Closure Cost *** $2,088,000
Major Rehabilitation $0
Total Annual Cost $17,480,000
* Calculated at 11 months (September 2014 to August 2015)
** OMRR&R costs are assumed to be nominal for this project, since it is a one-time action project. $10k cost in each of the first 10 years, converting that to a single present worth, then annualizing that over the 20 years of the project life
*** Breach Response Costs are shown in the table for purposes of economic analysis. These are not included in the Project Costs.
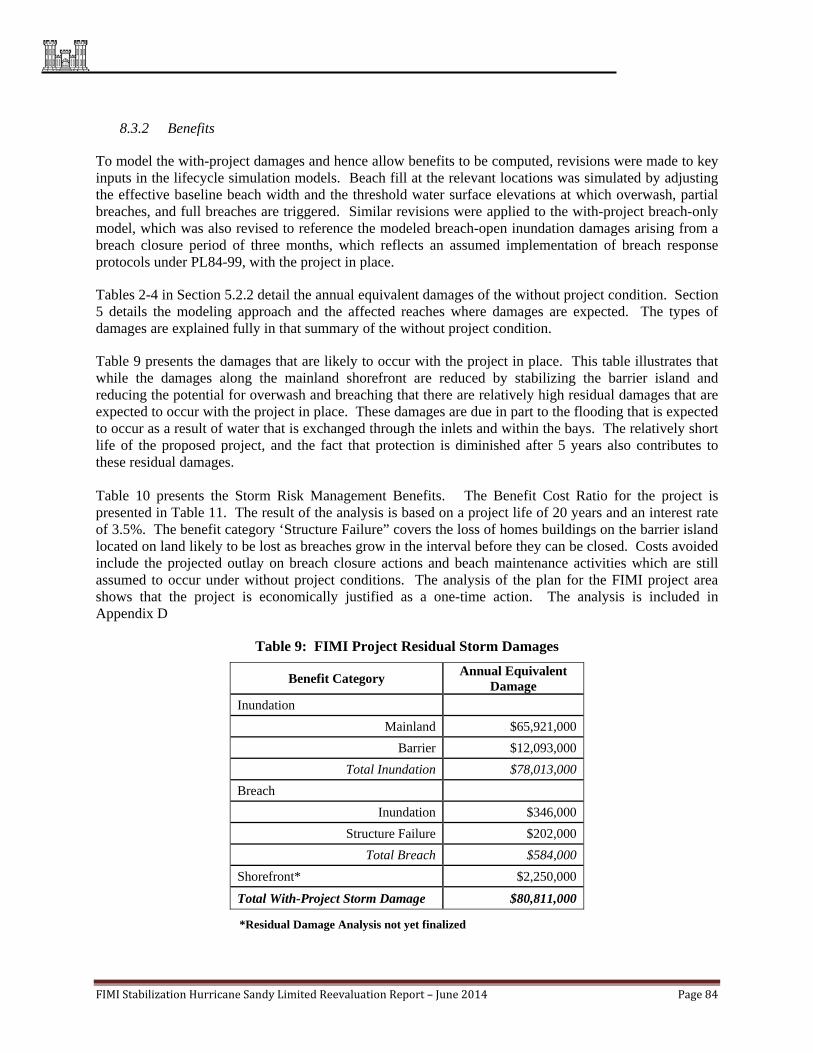
FIMIStabilizationHurricaneSandyLimitedReevaluationReport–June2014 Page84
8.3.2 Benefits
To model the with-project damages and hence allow benefits to be computed, revisions were made to key inputs in the lifecycle simulation models. Beach fill at the relevant locations was simulated by adjusting the effective baseline beach width and the threshold water surface elevations at which overwash, partial breaches, and full breaches are triggered. Similar revisions were applied to the with-project breach-only model, which was also revised to reference the modeled breach-open inundation damages arising from a breach closure period of three months, which reflects an assumed implementation of breach response protocols under PL84-99, with the project in place.
Tables 2-4 in Section 5.2.2 detail the annual equivalent damages of the without project condition. Section 5 details the modeling approach and the affected reaches where damages are expected. The types of damages are explained fully in that summary of the without project condition.
Table 9 presents the damages that are likely to occur with the project in place. This table illustrates that while the damages along the mainland shorefront are reduced by stabilizing the barrier island and reducing the potential for overwash and breaching that there are relatively high residual damages that are expected to occur with the project in place. These damages are due in part to the flooding that is expected to occur as a result of water that is exchanged through the inlets and within the bays. The relatively short life of the proposed project, and the fact that protection is diminished after 5 years also contributes to these residual damages. Table 10 presents the Storm Risk Management Benefits. The Benefit Cost Ratio for the project is presented in Table 11. The result of the analysis is based on a project life of 20 years and an interest rate of 3.5%. The benefit category ‘Structure Failure” covers the loss of homes buildings on the barrier island located on land likely to be lost as breaches grow in the interval before they can be closed. Costs avoided include the projected outlay on breach closure actions and beach maintenance activities which are still assumed to occur under without project conditions. The analysis of the plan for the FIMI project area shows that the project is economically justified as a one-time action. The analysis is included in Appendix D
Table 9: FIMI Project Residual Storm Damages
Benefit Category Annual Equivalent
Damage
Inundation
Mainland $65,921,000
Barrier $12,093,000
Total Inundation $78,013,000
Breach
Inundation $346,000
Structure Failure $202,000
Total Breach $584,000
Shorefront* $2,250,000
Total With-Project Storm Damage $80,811,000
*Residual Damage Analysis not yet finalized

FIMIStabilizationHurricaneSandyLimitedReevaluationReport–June2014 Page85
Table 10: FIMI Project Benefits
Benefit Category Annual Equivalent Damage Avoided
Inundation
Mainland $5,745,000
Barrier $2,571,000
Total Inundation $8,316,000
Breach
Inundation $7,254,000
Structure Failure $305,000
Total Breach $7,559,000
Shorefront* $0
Total Storm Damage Reduction
$15,875,000
Costs Avoided
Breach Closure $2,930,000
Beach Maintenance $0
Total Annual Benefits $18,805,000
Table 11: FIMI Benefit to Cost Ratio
Component
Total Annual Cost $17,480,000
Total Benefits $18,805,000
Net Benefits $1,325,000
Benefit-Cost Ratio 1.1
FIMIStabilizationHurricaneSandyLimitedReevaluationReport–June2014 Page86
9.0 PROJECT IMPACTS
9.1 Environmental Impacts
Implementation of the FIMI project features is not expected to have any significant adverse impact on the environment. The following is a summary of potential impacts; details of specific impacts are outlined in the accompanying EA.
9.1.1 Human Environment Impacts
Under the FIMI Stabilization Project, the risk of storm damage on Fire Island would be greatly reduced in the areas proposed for nourishment. The placement of beach fill in the designated areas would protect the residential, recreational, and commercial uses. Implementation of the beach nourishment alternative would enable residents and businesses to remain in the area during non- catastrophic events, while also affording increased protection to the communities along the bayshore. Due to the reduced likelihood of breaching and inundation of the bayshore, residential, recreational and commercial structures are much less likely to be damaged or destroyed, access to homes businesses is less likely to be interrupted, and utility service is less likely to be disrupted. Storms analogous to historic trends, consisting of frequent minor to moderate events, are likely to result in minor adverse impacts to land use and communities, with repeat damage to structures and followed by subsequent rebuilding. These impacts would be expected to be short term, depending on storm frequency and severity.
9.1.2 Cultural Resources
Submerged Archaeological Resources: As currently planned work within Robert Moses State Park will include areas that have historically been eroded and where the State of New York has placed sand previously. No wrecks have been identified as part of these operations and it is anticipated that the proposed project would not have an effect on historic properties in this area. The 1999 survey identified four anomalies along Fire Island that had both a magnetic and acoustic anomaly. USACE will relocate these anomalies and determine if they are within the current project boundaries for sand placement. If these anomalies are within the current sand placement areas, additional investigations may be necessary including (but not limited to) underwater investigations. This work has been identified and included in the Programmatic Agreement developed for this project and coordinated with the NYSHPO, the ACHP, the National Park Service, the Shinnecock Nation and other interested parties. Borrow Area 2C and 5B were included in the 2001 survey of borrow areas off the coast of Fire Island. No magnetic or acoustic anomalies were identified in this borrow area as part of this survey. Borrow Area 4C was not included in this survey. Completing a magnetometer and side scan sonar of this borrow areas has been included in the Programmatic Agreement (Attachment H of Environmental Assessment).
FIMIStabilizationHurricaneSandyLimitedReevaluationReport–June2014 Page87
If anomalies are identified that have the potential to represent wrecks or other significant features, additional investigations, including diving, will be conducted and/or the areas of the anomalies may be avoided during construction. Archaeological Resources Terrestrial Archaeological Sites The archaeological sites identified within the FIIS are either located on the bay side of the barrier island or in the Federal Tract areas that are being avoided by this project. Sand placement would not disturb the sites buried under the barrier island or in the near shore zone. The use of sand fill may help to protect these sites from being exposed and destroyed (JMA 1998). Therefore, the proposed project is not expected to have an adverse impact on these sites. Architectural Resources: Fire Island Light Station National Historic District.
As per the request of the National Park Service, sand will be placed along the shoreline south of Burma Road within the historic district. Placement of sand in this area will help protect the historic district and its contributing elements of Burma Road, the vegetated dune and pathways to the shoreline. As currently planned, the proposed project will not have an adverse effect on these resources, but rather serve to protect the historic district. Other Architectural Resources. Based on the currently planned acquisitions and relocations, USACE will verify that the properties recommended for additional consideration by the 2000 study would not be affected. Currently, this would require the review of houses in Ocean Bay Park and Fire Island Pines. USACE will monitor the development of construction plans and specifications to ensure that the sand placement will not disturb these sites or the required acquisitions and relocations will not affect these structures. If designs change, USACE will conduct additional investigations to determine if the project will cause an adverse effect on these sites.
The Programmatic Agreement Coordination is on-going. The New York District shall ensure that the following measures are carried out: I. NEAR SHORE/TIDAL ZONE – IDENTIFICATION OF TARGETS A. The District shall conduct a remote sensing survey of all areas with the APE that were not previously surveyed in which sand will be placed and for which the limit of fill will extend into the near shore area. B. The District shall evaluate the targets identified by this remote sensing survey as potential resources to determine if they are cultural resources. If determined to be cultural resources, an assessment of the integrity of the sites and their historic significance, in accordance with the eligibility criteria of the National Register of Historic Places, will be conducted. Following that evaluation a determination will be made regarding the effect the Undertaking will have on any items determine to be eligible for the National Register and the need for further work.

FIMIStabilizationHurricaneSandyLimitedReevaluationReport–June2014 Page88
C. The District shall also re-survey the areas including the four potentially significant anomalies identified in 2003 to determine if any of these anomalies represent a historic property and if a historic property, will be adversely affected by the Undertaking. Following that evaluation a determination will be made as to the need for further work. D. The District will coordinate these investigations of the near shore/tidal zone with the NYSHPO, the National Park Service, the Shinnecock Indian Nation, and other interested parties. II. BORROW AREA INVESTIGATIONS A. A remote sensing (magnetometer and side scan sonar survey) of Borrow Area 4C will be conducted to identify any potential cultural resources. B. If a cultural resource(s) is identified, the District will designate a buffer zone around each potential resource, as determined by the nature of the anomaly/return. Buffer zone(s) shall be clearly delineated on construction plans. No construction activities, including the removal of sand, anchoring, etc., that could potentially impact the wrecks will occur within the designated buffer zones. C. Should new borrow areas, in addition to the ones already identified (2C, 4C and 5B) be required the proposed locations shall be surveyed for historic resources employing the appropriate level of survey and shall be coordinated with the NYSHPO and other interested parties. III. REAL ESTATE ACQUISITIONS AND RELOCATIONS A. The District will identify the properties to be acquired and/or relocated and determine if these properties are eligible for the National Register. B. If a property is determined to be eligible for the National Register, the District will consult with the NYSHPO, the National Park Service and other interested parties to develop a treatment plan. C. If any additional properties are added to be acquired and/or relocated, the District will determine if these properties are eligible for the National Register and consult with the NYSHPO, the National Park Service and other interested parties to develop a treatment plan.
FIMIStabilizationHurricaneSandyLimitedReevaluationReport–June2014 Page89
9.1.3 Physical Environment
From a physical perspective, the project would alter the beach /dune profile substantially, reducing the potential for breaching and overwash during storm events and creating greater stability of the barrier island features. With the FIMI Stabilization Plan, sand would be removed from the borrow areas, altering the bottom profile of the ocean floor. Sand taken from the borrow areas will be extracted to a depth no greater than 20 feet below the existing bottom. The total initial fill volume for the proposed action is estimated at approximately 7,000,000 cy. Following completion of the project, substrate characteristics are expected to be similar to existing conditions.
Assuming the large volume of offshore sand that is moving shoreward, removal of minimal quantities in the borrow areas on sand ridges on the shoreface would not impact the morphodynamic system that occurs along Fire Island. In addition, given the immense size of the offshore sand ridges near our study area, relatively lesser sized borrow areas can provide ample sediments for nourishment projects with minimal or no impact to the onshore movement of sediments (NPS 2008). Impacts to the physical characteristics of the borrow areas would be expected to be adverse, minor to moderate and short term.
9.1.4 Natural Environment
Aquatic and Terrestrial Habitats. Construction of the FIMI Selected Plan would impact shoreline intertidal, subtidal, and upper beach and dune habitats. The upper beach zone and dunes represent terrestrial communities in the Project area. These areas are dominated by sand and beachgrass. Anticipated short-term impacts to the vegetated beach and dune communities are anticipated. Overall habitat within the intertidal zone would increase as the beach is widened as a result of proposed beach fill activities. The physical characteristics of the intertidal habitat will not be altered since the grain size of fill material will be the same as that of native sand in the Project area. Finfish and Shellfish. Impacts during construction of the FIMI Selected Plan may include the mortality of clams, benthic fish communities (e.g., toadfish), and other invertebrates present in the sandy habitat of the Project area during placement of fill material (Reilley et al. 1978, Courtenay et al. 1980, Naqvi and Pullen 1982). Benthic feeding fish species (e.g., windowpane, summer and winter flounder) would experience temporary displacement until appropriate food sources recolonize the Project area (Courtenay et al. 1980). However, these and other fish that are present at the time of construction are expected to feed in the surrounding area and therefore will be unaffected by the temporary localized reduction in available benthic food sources. The FIMI Selected Plan would impose minimal impacts during construction for the local shellfish species within the Project area. Most sessile species present directly underneath the Project footprint would be buried during construction. Motile shellfish species would be able to relocate temporarily outside of the immediate Project area. In addition to the temporary impact to the fish and shellfish species of the Project area, a slight temporary increase in turbidity is also expected near the Project area during construction (Reiley et al. 1978,
FIMIStabilizationHurricaneSandyLimitedReevaluationReport–June2014 Page90
Courtenay et al. 1980, Naqvi and Pullen 1982). Increases in turbidity could affect the settling rate of shellfish ova and larva, and can clog and damage the gills of fish species (Uncles et al. 1998). However, the churned sediment would settle quickly and any impacts to the benthic fish and shellfish community would be minimal. The Project would result in no long-term impacts to both fish and shellfish species of the Project area. Benthic Resources. The FIMI Selected Plan would cause short-term negative impacts to the benthic communities in the Project area. Negative impacts to the benthic community would be a result of increased turbidity during construction. The Project would result in no long-term impacts to the benthic community. Reptiles and Amphibians. No reptiles or amphibians are expected to occur within the Project are due to lack of suitable habitat. Therefore, there will be no long-term impacts to reptiles and amphibians as a result of the Project. Birds. The shoreline of Fire Island provides feeding and resting areas for birds that pass through the area along the Atlantic flyway during annual migration in early spring and late fall. Heavy machinery and the increased noise levels may temporarily affect birds in the Project area during construction activities However. In addition, in accordance with coordination with USFWS most of the Project activities in the area of active nesting plovers will occur from September through April, outside the key spring and fall migration periods (Piping plover) to avoid disruption of migration activities. Recreational use of the Fire Island shoreline is currently high. Birds have adapted to the human use of the area and birds have continued to use the upper beach/dune area for nesting and foraging. Impacts to birds from the additional access areas to the beach are expected to be minimal. Mammals. Although there is potential for FIMI Selected Plan construction activities to temporarily displace any mammals present in the area and limit access to feeding or nesting habitats, these species are mobile and are expected to avoid direct mortality. In addition, the sparsely vegetated terrestrial habitats impacted by the project (upper beach and dune) typically provide low quality habitat for mammals and are used only for foraging activities. Mammals are expected to utilize other suitable areas for foraging. Threatened and Endangered Species and Habitats. The USACE coordinated with USFWS, NYSDEC, and NMFS to assess impacts to threatened and endangered terrestrial and aquatic species and habitats as a result of the Project. Agencies evaluated the existing resources and anticipated Project impacts in conjunction with the public and agency review period for this Draft EA and USFWS review of a Biological Assessment (BA) prepared by the USACE for this Project. A non-jeopardy Biological Opinion was received May, 23 2014. The Fish and Wildlife Coordination Act 2(b) report for this Project was provided and is included in Attachment D of the EA. The Project would potentially result in direct and/or indirect disturbances to nesting shorebirds and their broods, if any are present in the Project vicinity for this purpose at the time of construction. USACE will restrict construction activities to September 1 through April 1 in areas with nesting plovers to avoid direct adverse impacts to the shorebirds. To facilitate the implementation of the USFWS’ piping plover recovery plans through appropriate habitat management within the project boundaries, USACE will perform pre-construction surveys to evaluate and document use of the Project Area by Federal or state-listed species. In accordance with the USFWS recommendations for protection of the seabeach amaranth, the USACE will survey the beach area prior to construction and avoid disturbing locations of the plant during the growing season (July 1 through November 1). Any seabeach amaranth plants identified in the

FIMIStabilizationHurricaneSandyLimitedReevaluationReport–June2014 Page91
construction area will be protected from incidental disturbance by construction equipment/materials by surrounding them with safety fence for avoidance. Construction activities will avoid all delineated locations of the plant and will undertake all practicable measures to avoid incidental taking of the plant. The Federally-listed threatened loggerhead, as well as the endangered Kemp’s ridley, leatherback, and green turtles may utilize coastal resources in the Project vicinity for foraging. However, no nesting is likely to occur in the Project area because these species of sea turtles nest south of the Project area. In addition, NMFS has indicated that the leatherback turtle feeds on pelagic prey and would not be affected by the Project. In accordance with NMFS recommendations (14 May 2014 letter from NMFS is included in Attachment D of the Environmental Assessment portion of this report), if hopper dredges are used in the inlets or offshore borrow area between mid-June and mid-November, NMFS-approved observers will be onboard the vessels to monitor construction activities. Dredging offshore areas has the potential to impact the Atlantic Sturgeon aquatic ecosystems by removal/burial of benthic organisms, increased turbidity, alterations to the hydrodynamic regime. Hydraulic dredges can directly impact sturgeon and other fish by entrainment in the dredge. Dredging may also impact important habitat features of Atlantic sturgeon if these actions disturb benthic fauna, or alter rock substrates (which do not occur in the project area). Indirect impacts to sturgeon from either mechanical or hydraulic dredging include the potential disturbance of benthic feeding areas, disruption of spawning migration, or detrimental physiological effects of resuspension of sediments in spawning areas. Although little is known about natural predators of Atlantic sturgeon, there are several documented fish and mammal predators, such as sea lampreys, striped bass, common carp, minnow, smallmouth bass, walleye, grey seal, and fallfish. There are some concerns that predation may adversely affect sturgeon recovery efforts in fish conservation and restoration programs, and by fishery management agencies. However, further research is needed on predation affects on Atlantic sturgeon. BMP will be taken to ensure the recovery of this species. State Species or Habitats of Concern. No State-listed threatened or endangered species of reptiles, amphibians, mammals, or vegetation were identified in the Project area, although several State-listed bird species are known to use habitats similar to those found in the Project area. Impacts and considerations that offset the impacts to the State-listed least tern, roseate tern, and common tern and special concern species black skimmer, would be similar as described for Federally-listed species. Other State-listed threatened species that occur in the general area include the northern harrier, osprey, and the transient peregrine falcon and bald eagle. Construction and operation of the Project is not expected to significantly impact these species because the Project would not affect their preferred nesting habitat, and other foraging habitat is readily available in the vicinity of the Project. Essential Fish Habitat. Temporary impacts on EFH are predicted during periods of active construction and would be the same as those described in EA. Benthic, finfish and sturgeon monitoring are planned in the borrow area for Spring 2014. Habitat would be temporarily degraded during beach fill placement, as elevated suspended sediment levels would temporarily lower dissolved oxygen and visual feeding efficiency, and irritate gill tissue. Sessile benthic invertebrates would likely be smothered during construction, and aquatic habitat would essentially be unavailable to motile species during construction.

FIMIStabilizationHurricaneSandyLimitedReevaluationReport–June2014 Page92
9.1.5 Cumulative Impacts
The cumulative impact assessment of federal nourishment projects on the south shore of Long Island indicate that federal project actions would occur in dynamic environment whose inhabitants have adapted to these conditions. Studies indicate that borrow area and sand placement areas re-colonize shortly after construction activities are completed. Several other Federal projects are located along the Atlantic and south shore coast of Long Island. The four civil projects within close proximity to the proposed FIMI Stabilization Project are: 1) Shinnecock Inlet Navigation Project, 2) the Westhampton Interim Project, 3) the Moriches Inlet Navigation Project, and 4) the West of Shinnecock Project. Farther to the west, three Federal projects are under way: 1) Coney Island Project, 2) East Rockaway, and 3) Long Beach to determine the potential cumulative impacts from these projects under the No Action Alternative. The used and proposed borrow areas in the No Action Alternative would disturb about 2.3 percent of the total nearshore and offshore areas that could be used. Additionally, the measures described above will lessen temporary impacts. Therefore, it is concluded that since this project is designed to minimize adverse environmental impacts, the cumulative impacts to occur on the south shore of Long Island are not significant to the human environment/communities present within this region. No non-Federal projects are anticipated to be implemented during the project life of this action.
Within both the no-action and recommended alternatives, cumulative impacts to the study area may result from the potential impacts of other projects, including the potential implementation the Fire Island Inlet to Montauk Point Project and the maintenance dredging of Moriches Inlet and the potential of Smith Point County Park as a placement site. It should be noted that with the various ongoing unrelated to the no-action alternative that are influencing the ecological resources of the study area, it is not likely that the recommended stabilization alternative would contribute to the cumulative impacts on these resources. Therefore it is concluded that because this project is designed to minimize adverse environmental impacts, the cumulative impacts to occur on the south shore of Long Island are not significant In addition to the Environmental Features (Project Modifications) discussed above, USACE will also follow recommendations provided by the NYSDEC and USFWS previously (USACE 1998, USFWS 1999, USFWS, 2014) and described below. These measures are expected to minimize potential adverse indirect impacts on other species that may use coastal habitats in the project area, including several state-listed shorebird species. As stated earlier, except within the boundaries of the Communities, construction activities will not occur during the piping plover breeding and nesting season. To minimize indirect impacts, USACE will conduct surveys during the spring/summer, and prior to construction activities, to identify nesting plover in the Project area and to document all known locations of piping plover. In addition, the USACE will document any other Federal or state-listed wildlife species observed in the Project area during survey and will initiate consultation with appropriate state and Federal agencies. The proposed project description includes a number of conservation measures that will be implemented for ten years. The intended purpose of these conservation measures is to avoid or minimize adverse effects of the beach nourishment project to Federally-listed species. Project Design Features
FIMIStabilizationHurricaneSandyLimitedReevaluationReport–June2014 Page93
Dune planting at low densities (18 in. on center) on the dune/upper beach interface, reducing the density of beachgrass plantings on the south face of the dune.
Contacting USFWS upon initiation and completion of construction activities. Pre-construction meetings with all project staff will be held to provide all information on resource protection and terms of the project.
Providing all project personnel, construction staff, etc. with information regarding the conditions of the project (including all conservation measures).
Time-of-Year Restrictions, which will provide for no activities between April 1 and September 1 to protect piping plovers and May 1 to October 15 to protect seabeach amaranth. If breeding piping plovers are not observed in a proposed project area, or are not within 1000 meters of the project area by July 15, then project activities may commence, following consultation with the USFWS, FIIS and NYSDEC.
Provisions for the project to only undertake low impact construction activities, such as beach surveying during the piping plover breeding season, utilizing a 300-ft protective buffer zone.
Surveying, Monitoring, and Adaptive Management
Surveying and monitoring for threatened and endangered species during the spring and summer nesting seasons will be implemented for 10 years as well as mammalian controls will be undertaken. The monitoring will be completed in coordination with the FIIS, Suffolk County and the USFWS. Monitoring will include identification of suitable habitat, nesting areas, symbolic fencing, and signage (see Section 11.5 – Monitoring and Adaptive Management).

FIMIStabilizationHurricaneSandyLimitedReevaluationReport–June2014 Page94
10.0 PUBLIC LAW 113-2 CONSIDERATIONS
The subject post-Sandy Fire Island Stabilization Project, which encompasses Fire Island to Moriches Inlet was developed based upon the Engineering, Economic, Environmental, and Planning efforts undertaken through the FIMP Reformulation Study that compared alternatives to identify the recommended scale and scope of a beachfill project, as an independent stabilization effort. This stabilization project will address damages caused by Hurricane Sandy.
In response to extensive storm damages and increased vulnerability to future events, consistent with the Disaster Relief Appropriations Act of 2013 (Public Law. 113-2; herein P.L. 113-2), and recognizing the urgency to repair and implement immediate storm protection measures, particularly in the FIMI area, an approach to expedite implementation of construction of necessary stabilization efforts independent of the FIMP Reformulation Study was developed and approved by Steven L. Stockton, P.E., Director of Civil Works, USACE in a memorandum dated 8 January 2014. This approach has gained widespread approval from New York State, Suffolk County, N.Y. and the local municipalities, who recognize the extreme vulnerability of the coast, and the need to move quickly to address this need Stabilization efforts were focused on FIMI as this reach is the most populated and subject to barrier island breach thereby exposing the back-bay to considerable damages. There is a more urgent need to advance the stabilization of this critical reach due to its vulnerability and potential for major damage and risk to life and property. This FIMI HSLRR has been prepared in response to and accounting for the Disaster Relief Appropriations Act of 2013 (P.L. 113-2). Specifically, this report addresses:
1. The costs and cost-sharing to support a Project Partnership Agreement (PPA).
2. The specific requirements necessary to demonstrate that the project is economically justified, technically feasible, and environmentally acceptable.
3. The specific requirements necessary to demonstrate resiliency, sustainability, and consistency with the Comprehensive Study.
10.1 Fully Funded and Costs Apportionment
The summary of Total Project Cost for the FIMI Stabilization project area is provided in Section 8.3.1 of this report. The initial construction element includes beachfill at Robert Moses State Park, Fire Island Lighthouse Tract, all of the communities outside of Federal Tracts, and Smith Point County Park. In addition, real estate costs associated with the acquisition and relocation of ocean front structures, as well as obtaining the required easements for construction. The estimated total first cost of construction is $207,100,000 and the total estimated investment project cost is $223,324,000. The estimated costs for each contract are escalated to the midpoint of construction. Midpoint of construction is 2014Q2 for Contracts 1 & 2, and 2015Q1 for Contract 3.
The cost-sharing of the initial construction cost in accordance with the provisions of P.L. 113-2 is shown in Table 12. PL 113-2 states that ‘the completion of ongoing construction projects receiving funds provided by this division shall be at full Federal expense with respect to such funds. The Fire Island Stabilization Project has 100% Federal funding (P.L. 113-2). Therefore, the Federal cost apportionment is $207,100,000. The non-Federal partner is responsible for 0% of this total project cost.
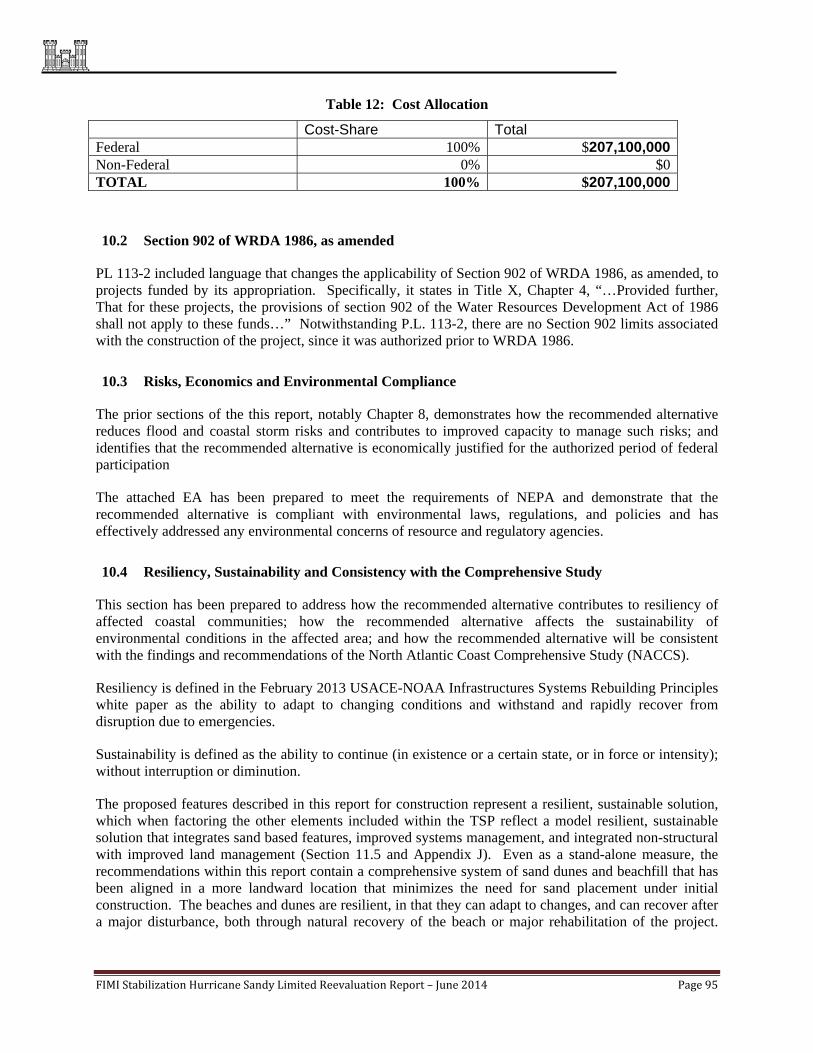
FIMIStabilizationHurricaneSandyLimitedReevaluationReport–June2014 Page95
Table 12: Cost Allocation
Cost-Share Total Federal 100% $207,100,000Non-Federal 0% $0TOTAL 100% $207,100,000
10.2 Section 902 of WRDA 1986, as amended
PL 113-2 included language that changes the applicability of Section 902 of WRDA 1986, as amended, to projects funded by its appropriation. Specifically, it states in Title X, Chapter 4, “…Provided further, That for these projects, the provisions of section 902 of the Water Resources Development Act of 1986 shall not apply to these funds…” Notwithstanding P.L. 113-2, there are no Section 902 limits associated with the construction of the project, since it was authorized prior to WRDA 1986.
10.3 Risks, Economics and Environmental Compliance
The prior sections of the this report, notably Chapter 8, demonstrates how the recommended alternative reduces flood and coastal storm risks and contributes to improved capacity to manage such risks; and identifies that the recommended alternative is economically justified for the authorized period of federal participation
The attached EA has been prepared to meet the requirements of NEPA and demonstrate that the recommended alternative is compliant with environmental laws, regulations, and policies and has effectively addressed any environmental concerns of resource and regulatory agencies.
10.4 Resiliency, Sustainability and Consistency with the Comprehensive Study
This section has been prepared to address how the recommended alternative contributes to resiliency of affected coastal communities; how the recommended alternative affects the sustainability of environmental conditions in the affected area; and how the recommended alternative will be consistent with the findings and recommendations of the North Atlantic Coast Comprehensive Study (NACCS).
Resiliency is defined in the February 2013 USACE-NOAA Infrastructures Systems Rebuilding Principles white paper as the ability to adapt to changing conditions and withstand and rapidly recover from disruption due to emergencies.
Sustainability is defined as the ability to continue (in existence or a certain state, or in force or intensity); without interruption or diminution.
The proposed features described in this report for construction represent a resilient, sustainable solution, which when factoring the other elements included within the TSP reflect a model resilient, sustainable solution that integrates sand based features, improved systems management, and integrated non-structural with improved land management (Section 11.5 and Appendix J). Even as a stand-alone measure, the recommendations within this report contain a comprehensive system of sand dunes and beachfill that has been aligned in a more landward location that minimizes the need for sand placement under initial construction. The beaches and dunes are resilient, in that they can adapt to changes, and can recover after a major disturbance, both through natural recovery of the beach or major rehabilitation of the project.
FIMIStabilizationHurricaneSandyLimitedReevaluationReport–June2014 Page96
The selected plan has also been identified as the most sustainable option, being the alternative alignment that minimizes the need for long-term placement of beachfill.
In assessing consistency with the North Atlantic Coast Comprehensive Study (NACCS), it is acknowledged that the results of the Comprehensive Study are not yet available, but that there are overriding principles which have been established for the NACCS that can be addressed for consistency. These principles recognize that preferred plans are those that provide protection with the use of sand features, which are readily adaptable, and could be modified or terminated based upon findings of the NACCS. The NACCS also emphasizes the need for integrated land-use planning, recognizing the need for local adoption of Flood Plain Management Regulations, based upon current understanding of risks.
The proposed features in this Technical Document for FIMI are consistent with these principles of the NACCS. The overall risk management is to be provided with a berm and dune system that could be readily adapted, based upon future findings. With respect to integrated land management, this report recognizes the importance of land management, and the need to integrate land management with the construction of project features, and could serve as a model for the NACCS in how this is accomplished. There are tremendous development pressures in the communities along Fire Island, and a history of difficulties in addressing the building and rebuilding of homes, and homes lost to storms within the primary dune. There are FEMA floodplain regulations and NPS regulations that are in effect for Fire Island, and also regulations pursuant to New York State’s Coastal Erosion Hazard Act (CEHA), to address development within the primary dune. Recognizing the Federal government’s commitment to ensure no inducement of development in the floodplain, pursuant to Executive Order 11988, this project will identify in the Project Partnership Agreement, the need for the local sponsor to develop a Floodplain Management Plan, and a requirement for the local sponsor to certify that measures are in place to ensure the project does not induce development within the floodplain.

FIMIStabilizationHurricaneSandyLimitedReevaluationReport–June2014 Page97
11. PROJECT IMPLEMENTATION
The completion of this Hurricane Sandy Limited Reevaluation Report and recommendation by the District Engineer is the first step toward implementing construction of the Stabilization project. Upon approval by USACE’s North Atlantic Division, the project will be considered for construction with funding made available through P.L. 113-2. Implementation of the project is subject to availability of funds.
11.1 Construction Schedule2
The pre-construction and construction sequence and time schedule of the Stabilization Project is dependent on the timeliness of this report’s approval, the foregoing construction procedures, and the ability of local interests to implement items of local cooperation. These items of local cooperation are principally the furnishing of the required shoreline real estate easements, structure acquisition and relocation by the State of New York.
Recognizing the effort necessary for obtaining the necessary real estate requirements for the project, the initial construction is expected to be split into three contracts, based upon the scope of the Real Estate needs and the timeframe for securing the real estate:
Contract 1: Smith Point County Park (MB-1A, MB-1B, MB-2A);
Contract 2: Lonelyville to Robert Moses State Park (GSB-1A, GSB-1B, GSB-2A);
Contract 3: Davis Park to Town Beach (GSB-2B, GSB-2C, GSB-2D, GSB-3A, GSB-3C, GSB-3E, GSB-3G).
Contract 1, Smith Point County Park is the most area of the entire project and requires the minimal timeframe to secure the required real estate. Smith Point County Park has the lowest existing elevation that leaves it highly vulnerable to overwash and especially breaching. This potential for breach (and therefore back-bay flooding) is highly susceptible in this location. Therefore, the construction of the beachfill and the dune and berm system must be implemented as expeditiously as possible. Implementation of the entire project will manage flood risk by also being eligible for Public Law 84-99. PL 84-99 authorizes the USACE to undertake preparedness, response, and recovery activities for natural disasters. The Water Resources Development Act of 1996 amended Public Law 84-99 to add the authority to include expansion of investigation ability for potential Advance Measures activities. The proposed construction schedule is as follows:
Contract 1: September 2014 through February 2015 Contract 2: October 2014 through March 2015 Contract 3: December 2014 through August 2015
2 It is USACE’s intent to proceed with contracts and implement reaches in areas where real estate is obtained to allow construction to start as soon as possible. Contract reaches may be modified, depending on real estate acquirement, accordingly.
FIMIStabilizationHurricaneSandyLimitedReevaluationReport–June2014 Page98
11.2 Local Cooperation3
The initial project cost of the Stabilization Project will be funded 100% by the Federal Government. A fully coordinated Project Partnership Agreement (PPA) package has been prepared which will be coordinated and executed subsequent to the approval of this document and serves as the agreement for the next phase of the project. The PPA reflects the recommendations of this Hurricane Sandy Limited Reevaluation Report. The non-Federal partner, NYSDEC, has indicated support for recommendations presented in this document and its desire to execute a PPA for the FIMI Stabilization Project Selected Plan by letter dated July 14, 2013.
As the non-Federal project partner, NYSDEC must comply with all applicable Federal laws and policies and other requirements, including but not limited to:
a. In coordination with the Federal Government, who shall provide 100% of the initial project cost,
(1) provide all lands, easements, rights of way and relocations (LERR), including suitable borrow areas, uncontaminated with hazardous and toxic wastes, and perform or ensure performance of any relocations determined by the Federal Government to be necessary for the initial construction, operation, and maintenance of this project.
(2) perform, or cause to be performed, any investigations for hazardous substances as are determined necessary to identify the existence and extent of any hazardous substances regulated under the Comprehensive Environmental Response, Compensation, and Liability Act (CERCLA), Public Law (PL) 96-510, as amended, 42 U.S.C. 9601-9675, that may exist in, on, or under lands, easements, or rights-of-way that the Federal Government determines to be required for the construction, operation, and maintenance of the Project. However, for lands that the Federal Government determines to be subject to the navigational servitude, only the Federal Government shall perform such investigations unless the Federal Government provides the non-Federal project partner with prior specific written direction, in which case the non-Federal project partner shall perform such investigations in accordance with such written direction.
(3) coordinate all necessary cleanup and response costs of any CERCLA-regulated materials located in, on, or under lands, easements, or rights-of-way that the Federal Government determines to be necessary for the construction, operation, or maintenance of the Project.
(4) cost-share of the cost of mitigation and data recovery activities associated with historic
preservation, that are in excess of 1 percent of the total amount authorized to be appropriated for the project.
b. For ten years, operate, maintain, repair, replace, and rehabilitate the completed project, or functional portion of the project, at no cost to the Government, in a manner compatible with the project’s authorized purposes and in accordance with applicable Federal and State laws and any specific directions prescribed by the Government in the Operations, Maintenance, Replacement, Repair and Rehabilitation (OMRR&R) manual and any subsequent
3 Subject to change based on the executed Project Partnership Agreement

FIMIStabilizationHurricaneSandyLimitedReevaluationReport–June2014 Page99
amendments thereto. These requirements are generally described in Section 11.4 of this report.
c. Provide the Federal Government a right to enter, at reasonable times and in a reasonable manner, upon property that the non-Federal project partner, now or hereafter, owns or controls for access to the Project for the purpose of inspection, and, if necessary after failure to perform by the non-Federal project partner, for the purpose of completing, operating, maintaining, repairing, replacing, or rehabilitating the Project. No completion, operation, maintenance, repair, replacement, or rehabilitation by the Federal Government shall operate to relieve the non-Federal project partner of responsibility to meet the non-Federal project partner's obligations, or to preclude the Federal Government from pursuing any other remedy at law or equity to ensure faithful performance.
d. Hold and save the United States free from all damages arising from the construction, operation, maintenance, repair, replacement, and rehabilitation of the Project and any Project-related betterments, except for damages due to the fault or negligence of the United States or its contractors.
e. Keep, and maintain books, records, documents, and other evidence pertaining to costs and expenses incurred pursuant to the Project in accordance with the standards for financial management systems set forth in the Uniform Administrative Requirements for Grants and Cooperative Agreements to State and Local Governments at 32 Codes of Federal regulations (CFR) Section 33.20.
f. As between the Federal Government and the non-Federal project partner, the non-Federal project partner shall be considered the operator of the project for the purpose of CERCLA liability. To the maximum extent practicable, operate, maintain, repair, replace and rehabilitate the Project in a manner that will not cause liability to arise under CERCLA.
g. Comply with the applicable provisions of the Uniform Relocation Assistance and Real Property Acquisition Policies Act of 1790, Public Law 91-646, as amended by Title IV of the Surface Transportation and Unifom1 Relocation Assistance Act of 1987 (Public Law 100-17),and the Unifom1 Regulations contained in 49 CFR Part 24, in acquiring lands, easements, and rights-of-way, required for the construction, operation, and maintenance of the Project, including those necessary for relocations, borrow materials, and dredged or excavated material disposal, and inform all affected persons of applicable benefits, policies, and procedures in connection with said Act.
h. Comply with all applicable Federal and State laws and regulations, including, but not limited to, Section 601 of the Civil Rights Act of 1964, Public Law 88-352 (42 U.S.C. 2000d), and Department of Defense directive 5500.11 issued pursuant thereto, as well as Army regulation 600- 7, entitled "Nondiscrimination on the Basis of Handicap in Programs and Activities Assisted or Conducted by the Department of the Army."
i. Participate in and comply with applicable Federal flood plain management and flood insurance programs and comply with the requirements in Section 402 of the Water Resources Development Act of 1986, as amended.
j. Not less than once each year inform affected interests of the extent of protection afforded by the Project.
FIMIStabilizationHurricaneSandyLimitedReevaluationReport–June2014 Page100
k. Publicize flood plain information in the area concerned and provide this information to zoning and other regulatory agencies for their use in preventing unwise future development in the flood plain and in adopting such regulations as may be necessary to prevent unwise future development and to ensure compatibility with the protection provided by the project.
l. Prevent obstructions of or encroachments on the project (including prescribing and enforcing regulations to prevent such obstructions or encroachments) which might hinder its operation and maintenance, or interfere with its proper function, such as any new development on project lands or the addition of facilities which would degrade the benefits of the project.
m. Provide and maintain necessary access roads, parking areas, and other public use facilities, open and available to all on equal terms.
n. Comply with Section 221 of Public Law 91-611, Flood Control Act of 1970, as amended, and Section 103 of the Water Resources Development Act of 1986, Public Law 99-662, as amended, which provides that the Secretary of the Army shall not commence the construction of any water resources project or separable element thereof, until the non- Federal project partner has entered into a written agreement to furnish its required cooperation for the project or separable element.
o. Semi-annually and after storm events, perform surveillance of the beach to determine losses or nourishment material from the project design section and provide the results of such surveillance to the Federal Government.

FIMIStabilizationHurricaneSandyLimitedReevaluationReport–June2014 Page101
11.3 Operations, Maintenance, Repair, Replacement and Rehabilitation Plan
The New York State Department of Environmental Conservation (NYSDEC) as the local sponsor will be responsible for the Operations and Maintenance (O&M) of the Fire Island Inlet to Moriches Inlet Stabilization Project. The O&M Responsibilities are generally described in this Hurricane Sandy Limited Reevaluation Report (HSLRR), but will be provided in greater specificity in the OMRR&R Plan (Operations, Maintenance, Repair, Replacement and Rehabilitation Plan), which will be provided to the sponsor after completion of initial construction and describes the specific requirements of the non-Federal sponsor. It should be noted that as the Stabilization Project is a one-time only placement the OMRR&R costs are assumed to be nominal (approximately $10,000 annually). Refinements to OMRR&R responsibilities and Monitoring & Adaptive Management responsibilities will be defined in the OMRR&R manual, the Monitoring & Adaptive Management Plan and the Project Partnership Agreement (PPA). The following is a general statement of responsibilities.
Administrative and Operational Responsibilities:
Maintain public ownership and public use of the project area which are the basis of the Federal participation in the project. This includes preventing trespass or encroachment by private interests by the placement, onto these shores or within the seaward portion of the project, of any temporary or permanent structures, except as specifically permitted by the District Engineer or authorized representative.
Prohibit any excavation of or construction on, over, under, or through the dune or beach berm, without prior written approval of the District Engineer or authorized representative
Prohibit alterations in any feature of the beach fill that may affect its functional performance unless prior written approval has been obtained from the District Engineer
Prohibit unauthorized vehicular traffic on the beach and restrict authorized vehicle access to authorized access ways.
Assure that no drains discharge onto the beach. Remove all trash and debris from beach (day to day operations of the facilities). Permit the District Engineer or authorized representative access to the project at all times. Maintain organized records of activities and costs covering maintenance, operation,
inspection, repair and replacement of protective works Participate in a yearly joint inspection of the project with personnel from the New York
District. Ensure that safe operation of recreational activities continues during construction and
maintenance operations.
Maintenance Responsibilities:
Undertake semi-annual Inspections of the beach and dunes, including Beach Width Measurements, as well as before and after each tropical and extratropical storm.
Reporting Responsibilities:
Provide Annual Inspection Reports Provide organized records of activities and costs covering maintenance, operation,
inspection, repair and replacement of protective works. Contact the District Engineer if at any time storm or other erosion reduces the berm to
below the minimum beach fill cross-section width and maintenance measures to move sand from accreted areas to eroded areas prove inadequate to restore the design section
FIMIStabilizationHurricaneSandyLimitedReevaluationReport–June2014 Page102
11.4 Land Use and Management
Land use differs throughout the project area. The FIMI barrier island study area is generally more developed to the west in the communities of Saltaire, Ocean Beach, Cherry Grove and Fire Island Pines with no development in the middle, wilderness area. Smith Point County Park is located on the easternmost side of the FIMI project area, while Robert Moses State Park is located on the westernmost end of Fire Island. State coastal policies support protecting natural protective features, siting buildings and development in places that minimize risk, and avoiding actions that impair natural sediment processes.
As described in the main text of this HSLRR, the Stabilization effort is being undertaken in response to the highly vulnerable condition following Hurricane Sandy’s erosive forces, where expedited action is needed to stabilize this area. The Stabilization project emphasizes land management efforts to discourage building in high risk areas. Although USACE authority in land management decisions is limited to recommendations and complementary actions such as non-structural and acquisition actions, the Stabilization effort implements several actions consistent with sound land management policy (Appendix J). The following summaries detail the consistency of the Stabilization effort.
Acquisition
The Stabilization effort proposes a more landward alignment of the dune post-Sandy. This alignment requires acquisition and relocation of structures, prior to construction, and reduces the number of structures in the high-risk area.
Limiting Development
The Stabilization project will reduce development significantly within the high risk project areas. Forty-one properties will be acquired in fee and removed from the erosion area. Six properties will be relocated to a lower risk area. Approximately 689 perpetual easements will be obtained on properties in the dune/beach footprint where development is severely restricted. Greater detail of the real estate actions is provided within the Real Estate Appendix (Appendix G).
11.5 Monitoring & Adaptive Management
The project includes monitoring and adaptive management of the project over 10 years, which is consistent with the period over which physical differences in the beach configuration are expected to persist. The monitoring includes 1) physical monitoring of beach processes, 2) physical monitoring of borrow area processes, 3) biological monitoring and stewardship of endangered species along the beach from inlet to inlet, 4) biological monitoring of the borrow area. The adaptive management measures include: 1) mammalian predator management for endangered species, 2) topographic management and devegetation of critical areas for endangered species, and effectiveness monitoring for endangered species. Each of these tasks identified in the monitoring and adaptive management are necessary to satisfy state and Federal permitting requirements, and / or to confirm the magnitude of impacts assumed in the environmental assessment. As such, these costs are identified as costs associated with the initial construction of the project, and cost-shared at full Federal expense. These activities are estimated as a total cost of $15.5 Million over 10 years, as described below. Annual physical coastal processes monitoring will be conducted at an expected annual cost of $250,000 per year ($2,500,000 total). Physical Coastal Processes Monitoring will consist of beach surveys, and

FIMIStabilizationHurricaneSandyLimitedReevaluationReport–June2014 Page103
beach sediment samples. All surveys and sampling will be taken once yearly (spring), with the exact method to be determined. Borrow Area bathymetric surveys, and assessment of borrow area recovery and adjacent area affects will be undertaken, with an estimated annual cost of $150,000 ($1,500,000 total). Borrow area ecological monitoring is included, as detailed in the EA. This effort is being undertaken to verify the impact assessment contained in the EA, and includes annual monitoring for benthic recovery and finfish usage. This monitoring is estimated as $100,000 annually ($1,000,000 total). The monitoring and adaptive management for endangered species includes annual monitoring for shorebirds at a cost of $450,000 annually. An annual estimate of $200,000 is included for mammalian predator management, and $250,000 annually is included for adaptive management of topography and vegetation, to maintain conditions that are optimal for endangered species usage. There is also 150,000 annually included for effectiveness monitoring. The total costs for Endangered Species Monitoring and Adaptive Management, which was included as a project feature and habitat offset is $10,500,000. Details of the endangered species monitoring and adaptive management are contained in the EA and BO. Environmental Program 1. Monitoring Program. The monitoring program will take place from Inlet to inlet to supplement (not replace) existing programs with the intent to add consistency to the monitoring and reporting. The program splits the plover reproductive activities into two phases: nest and incubation activities, from which breeding population size is estimated, and hatching and fledging activities from which reproductive success is estimated. A set of habitat maps will be provided annually to illustrate the location of nests and the outcome of each breeding attempt. The monitoring program will also note the ongoing influences by the project features. When nests are located, they are either inconspicuously marked or surveyed with GPS to facilitate relocation for monitoring and predator exclosure installation. The monitoring program will also complete a single annual census, standardized on the East Coast to occur during the first 10 days in June. The census numbers gathered during the designated window permits a count for the entire population on site, including non-breeding individuals. Results are compared to the nesting population to address any anomalies. 2. Predator management. All agencies agreed to mammalian predator management (10yrs) inlet to inlet which will be a federally-funded program, and that implementation will be coordinated between all agencies and the affected land owners/managers. On Federal properties, there is a commitment of exclosures and stewardship, within available authorities, recognizing there are limitation on trapping and killing predators in the absence of more detailed studies and assessments. The primary management effort to reduce wildlife impacts to nesting plovers is the use of nest site predator exclosures, an effective non-lethal method of protection. It necessitates that staffing is adequate to find plover nests in a timely manner. It also requires personnel time to construct exclosures at the nest sites. There are not effective management options to address wildlife impacts on plovers during the courtship or brood rearing phases of the breeding cycle under the current program. The secondary management tool to be used to reduce wildlife impacts is predator control. It was acknowledged that compliance and permitting for predator control needs to be established. 3. Stewardship/Visitor Management.
FIMIStabilizationHurricaneSandyLimitedReevaluationReport–June2014 Page104
Attempts will be made to eliminate or reduce human disturbance to plovers during all phases of breeding. Plover habitat utilization and human use patterns are well established, facilitating installation of appropriate area closures. A 200 meter disturbance buffer is used to protect most breeding habitats. In areas where plover breeding activity occurs in close proximity to human use areas, an assessment will be made of the sensitivity of the birds on site. When possible, an attempt is made to maintain some level of recreational opportunities. When in doubt, visitor use is curtailed to ensure that breeding activities are protected. Park staff, researchers, operation and maintenance and emergency vehicles with a legitimate need to work in or travel through plover breeding areas will receive training to reduce the potential risk to the plovers. Staff and cooperators with irregular needs to access sensitive areas are provided escorts. Law enforcement officers are offered training to accommodate the need to patrol the beach and inlet areas. 4. Off Road Vehicle (ORV) Use. All agencies recognized that there are federal ORV guidelines in place that are currently followed within Fire Island National Seashore and Smith Point County Park. Agencies agreed that the ORV guidelines will continue to be followed in the future. It was acknowledged that nesting distance from the beach, breeding bird behaviors and reaction to humans or vehicles vary from year to year. Dependent on foraging habitat condition at the time of brood rearing, chicks may or may not use the bay or ocean intertidal zone for foraging. Unpredictable behavior and habitat use has resulted in a stepped progression of visitor management actions in the past. Normally, observations are made of birds in courtship to identify management areas. As soon as nests are initiated, an assessment is made to determine the sensitivity of both breeding adults to human use. When birds react negatively to human disturbance, the normal travel corridor is reduced in width in an attempt to accommodate passage of vehicles and pedestrians. If traffic or pedestrian use cannot be accommodated, a full area closure is placed in effect. A similar assessment and closure progression is made for brood habitat needs if the nest successfully hatches. On the non-beach sides surrounding ORV area nests the standard 200 meter buffer distance is used to protect plover breeding activity. 5. Monitoring Effectiveness. It was discussed that the conservation/protection measures and habitat restoration for threatened and endangered species are often guided by anecdotal evidence and there is a need to better utilize time and resources on effective strategies. The project will monitor and evaluate the effectiveness of the above mentioned measures and then provide revised recommendations if need be relating to the restoration of breeding habitat and the optimization of reproductive success. An interagency team will be assembled to define a strategy and identify the key questions to be addressed. It was noted that resources will be leveraged from other initiatives to compliment the project funds. Physical Monitoring In general, the purpose of monitoring shore protection projects can be summarized below: Measure project performance; Improve the understanding of the physical processes at work and their interaction with project performance; and The Physical Monitoring Plan recommends inspection, measurement and analysis of the following physical phenomena and coastal processes within the project boundary and project life: a. General: Periodic site inspection of shoreline condition and structure functionality;
FIMIStabilizationHurricaneSandyLimitedReevaluationReport–June2014 Page105
Aerial photography; Shoreline changes and sediment budget update; Ocean wave height, period and direction; Water level measurement; Borrow area infilling; b. Beach Fill: Beachfill/dune profile evolution; Sediment sample collection and analysis; Post-placement fill characterization; d. Sediment Transport Modeling: Inner-shelf bathymetric changes; Sub aerial morphologic change; Wave, current, bed load and suspended sediment concentration measurements; Sediment transport modeling between the inner shelf and western Fire Island; The USGS is beginning a comprehensive hydrodynamic and morphodynamic evolution model of the Old Inlet breach. The results will provide a fully calibrated hydrodynamic model of the Fire Island and Great South Bay region that will examine the conditions that lead to the formation of the breach. Using the hydrodynamic results as boundary conditions, a longer-term morphodynamic model will be developed to hindcast the morphologic evolution of the breach. The objective of the modeling is to reproduce the documented evolution of the existing breach (using available field data) and determine the most feasible representation of waves that result in closure of the breach. One of the goals of this effort is to develop tools for application to breach processes that can help inform management decisions concerning future breaches at Fire Island and elsewhere. e. Borrow Area Sampling In accordance with NYSDEC Water Quality Certificate (WQC) requirements, a borrow area monitoring plan is under coordination with NYSDEC and will build upon previously collected biological data for the offshore borrow areas and include assessing benthic community, fisheries, water quality, physical parameters such as bathymetry, grain size, borrow area infill rates and statification. Details of this plan are being developed and will be submitted with or prior to the WQC permit application.
FIMIStabilizationHurricaneSandyLimitedReevaluationReport–June2014 Page106
12. FINDINGS AND CONCLUSIONS
The effects of Hurricane Sandy on the barrier island have made project implementation within the Fire Island Inlet to Moriches Inlet imperative to restore and augment the barrier island to provide storm risk management to both the barrier island and back-bay inhabitants and transients, including those using the roads, facilities, hospitals, beaches, etc.
In light of the changes provided in P.L. 113-2 with regard to the urgency, and cost-sharing of project implementation, the District recommends that the proposed project be implemented in accordance with this Hurricane Sandy Limited Reevaluation Report and the provisions of PL113-2 as a Stabilization project.
The Stabilization Project has been proposed to address the vulnerability of the barrier island to overwash, breaching and shorefront and backbay damages. The plan for the Stabilization Project has been developed based upon the Engineering, Economic, Environmental, and Planning efforts undertaken through the FIMP Reformulation Study that have compared alternatives to identify the recommended scale and scope of a beachfill project, as a separate, one-time, standalone stabilization effort.
The selected plan follows the Middle Update (MIDU) alignment along Fire Island. The selected alignment requires a total of approximately 41 real estate acquisitions and 6 real estate relocations and over 600 easements. In the developed areas the selected plan includes the construction of a beach berm with a width of 90 feet at elevation +9.5 feet NGVD and a dune with a crest width of 25 feet at elevation +15 feet NGVD. In eastern Smith Point County Park, the Fire Island Lighthouse Tract, and portions of Robert Moses State Park, the selected plan includes the construction of a beach berm with a width of 90 feet at elevation +9.5 feet NGVD and a dune with a crest width of 25 feet at elevation +13 feet NGVD. In western sections of Robert Moses State Park and portions of Smith Point County Park, the selected plan includes the construction of a beach berm with a width of 90 feet at elevation +9.5 feet NGVD. This stabilization effort has been developed as a one-time, initial construction project to repair damages caused by Hurricane Sandy and to stabilize the island. This Stabilization Project has its own independent utility, and as developed does not limit the options available in the Reformulation Study or pre-suppose the outcome of the Reformulation Study. After the initial placement of sand, the project is expected to erode, and diminish in its protective capacity, eventually returning to a pre-project condition.
The District has given consideration to all significant aspects in the overall public interest, including environmental, social and economic effects, engineering feasibility and compatibility of the project with the policies, desires and capabilities of the State of New York and other Federal and non-Federal interests. The project’s annual benefits and annual costs were updated to October 2013 price levels and are $18.8M and $17.5M, respectively. The updated Benefit to Cost Ratio is 1.1 (at 3.50% FY13 Discount Rate). The project is economically justified and the District recommends that the Stabilization project be constructed at a total cost of $207,100,000.
FIMIStabilizationHurricaneSandyLimitedReevaluationReport–June2014 Page107
13. RECOMMENDATIONS
Prefatory Statement
In making the following recommendations, I have given consideration to all significant aspects of this study as well as the overall public interest in storm risk management within the Fire Island to Montauk Point Study Area and the Fire Island Inlet to Moriches Inlet project area in particular. The aspects considered include engineering feasibility, economic effects, environmental impacts, social concerns, and compatibility of the project with the policies, desires, and capabilities of the local government, State, Federal government, and other interested parties.
Recommendations
In accordance with the current analysis and the guidance outlined in P.L. 113-2, the Fire Island Inlet to Moriches Inlet described in this report is acceptable to the non-Federal partner, agencies, and stakeholders as a one-time action, stand-alone stabilization project for immediate implementation.
The period of analysis for the Stabilization Project has been developed based upon the period of time over which there is a measurable difference between the without project future condition and with-project condition. The Project is designed with advance fill to maintain design conditions for a period of 5 years, and it is estimated that the residual effect of the fill placement would last another 5 years. After the residual effect of beachfill has diminished, there is further residual effect of 10 years that is provided by the acquisition and relocation of structures. The total period over which residual effects are expected is 20 years.
Due to the currently degraded condition of the barrier island from Fire Island inlet to Moriches Inlet as a result of Hurricane Sandy, it is recommended that this stabilization project be constructed as authorized by P.L. 113-2. I make this recommendation based on findings that the Stabilization Plan constitutes engineering feasibility, economic justification, and environmental acceptability. These recommendations are made with such further modifications thereof, as in the discretion of the MSC may be advisable, at total project first cost of $207,100,000 (at October 2013 price levels), provided that non-Federal interests comply with all the requirements substantially in accordance with the Project Partnership Agreement which will be executed upon approval of this report.

FIMIStabilizationHurricaneSandyLimitedReevaluationReport–June2014 Page109
14. REFERENCES
Aretxabaleta, A. L., B. Butman, and N. K. Ganju (2014), Water level response in back-barrier bays unchanged following Hurricane Sandy, Geophys. Res. Lett., 41.
Cañizares R., Alfageme S., Irish, J.L. (2003) “Modeling of morphological changes at Shinnecock Inlet, New York, USA,” Proceedings of the Fifth International Symposium on Coastal Engineering and Science of Coastal Sediment Processes (Coastal Sediments ’03), Clearwater Beach, Florida, 2003
Cañizares R., Alfageme S., “Process-based Modeling of a Restored Barrier Island: Whiskey Island,
Louisiana,” Proceedings of the Fifth International Conference on Coastal Dynamics (Coastal Dynamics ‘05), Barcelona, Spain, 2005
Cañizares R. and Irish, J.L. (2008) “Simulation of storm-induced barrier island morphodynamics and
flooding” Coastal Engineering 55 (2008). Pp 1089-1101 Cañizares R., Alfageme S., Gravens, M.B.. (2004) “Modeling of Storm Induced Barrier Island Overwash
and Breaching in the Atlantic Coast of Long Island, New York” in Proceedings of the 29th International Conference on Coastal Engineering (ICCE 2004), Lisbon, 2004
Coastal Planning & Engineering of NY, PC, 2013. “2009 Fire Island Beach Renourishment Project Post-
Sandy Storm Report”, prepared for Sponsoring Communities on Fire Island, New York.
Gravens, M. B., Rosati, J. D., and Wise, R. A., 1999. “Fire Island Inlet to Montauk Point reformulation study (FIMP): Historical and existing condition coastal processes assessment,” prepared for the U.S. Army Engineer District, New York.
Gray and Pape. 2005. Final Report Archeological Overview and Assessment of the Fire Island National Seashore, Suffolk County, New York. Prepared for the National Park Service.
Greeley-Polhemus Group., 1998. “Research on Shipwrecks in the Near Shore Area, Fire Island Inlet to Montauk Point, Long Island, Suffolk County, New York, Reach 1: Interim Project Fire Island to Moriches Inlet. Prepared for the US Army Corps of Engineers, New York District.
Hapke, C. J., Brenner, O., Hehre, R., Reyonlds, B. J., 2013. “Coastal Change from Hurricane Sandy and the 2012-13 Winter Storm Season: Fire Island, New York”, Open-File Report 2012-1231, U.S. Department of the Interior, U. S. Geological Survey.
Irish, J.L and Cañizares R. (2009) “Storm-Wave Flow through Tidal Inlets and Its Influence on Bay Flooding” ASCE Journal of Waterway, Port, Coastal and Ocean Engineering March/April 2009. Pp 52-60
Irish, J.L and Cañizares R.(2006) “ The Role of Wave Setup in Predicting Back-Bay Storm Water Levels:
Long Island, New York, USA” Proceedings of the 30th International Conference on Coastal Engineering (ICCE 2006), San Diego, 2006
Irish, J.L, Cañizares R., Grosskopf, W.G. and Williams, B.P., (2004) “Effect of Hindcasted Waves on
Coastal Storm Water Levels During the Blizzard of 2003” Proceedings of the Eigth International Workshop on Wave Hindcasting and Forecasting Oahu, Hawai, 2004
FIMIStabilizationHurricaneSandyLimitedReevaluationReport–June2014 Page110
Irish, J. L., Williams, B. P., Militello, A., and D. J. Mark, (2004). “Regional-scale storm-surge modeling of Long Island, New York, USA.” in Proceedings of the 29th International Conference on Coastal Engineering (ICCE 2004), Lisbon, 2004
John Milner Associates. 2000. Cultural Resources Baseline Study, Fire Island to Montauk Point, Suffolk
County, New York, Reformulation Study. Prepared for the US Army Corps of Engineers.
Larson and Kraus, 1989. SBEACH: Numerical Model for Simulating Storm-Induced Beach Change; Report 1, Empirical Foundation and Model Development. TR CERC-89-9, USACE.
Lentz, E.E, Hapke, C.J., Stockdon, H.F., and Hehre, R.E., 2013. “Improving understanding of near-term barrier island evolution through multi-decadal assessment of morpholig change”. Marine Geology, 337 (2013) 125-139.
National Park Service. 2004. Cultural Landscapes Inventory Fire Island Light Station, Fire Island National Seashore
Panamerican Consultants, Inc., 2003. Remote Sensing Survey, Tidal Zone and Near Shore Project Area, Atlantic Coast of Long Island, Fire Island Inlet to Moriches Inlet, Fire Island, Suffolk County, New York Interim Project.” Prepared for the US Army Corps of Engineers, New York District.
Rampino, M.R., and J.E. Sanders, 1981: “Episodic growth of Holocene tidal marshes in the northeastern United States: A possible indicator of eustatic sea-level fluctuations”. Geology, 9, 63067.
Roelvink, J.A., van Kessel, T., Alfageme, S., and Cañizares, R. (2003). “Modeling of barrier island response to storms,” Proceedings of the Fifth International Symposium on Coastal Engineering and Science of Coastal Sediment Processes (Coastal Sediments ’03), Clearwater Beach, Florida, 2003
Sanders and Kumar, 1975. “Evidence of Shoreface Retreat and in Place Drowning during Holocene
Submergence of Barriers, Shelf off Fire Island, New York,” Geological Society of America Bulletin, Volume 86.
Scheffner, N. W. and R. A. Wise, 2001. Fire Island to Montauk Point Reformulation Storm Surge Study.
Tidewater Atlantic Research, Inc., 2001 Remote Sensing Archaeological Survey of Borrow Areas, 2A, 2B, 2C, 3A, 4A, 4B, 5A, 5B, 6A, 7A, and 8A, Atlantic Coast of Long Island, Fire Island Inlet to Moriches Inlet, Suffolk County, New York, Reformulation Study. Dr. Gordon Watts. Submitted by URS Consultants/Moffatt Nichols Engineers JV. U.S. Army Corps of Engineers, 1963. Report on Operation Five-High, Disaster Recovery Operations
from 6-8 March 1962 Storm Under Public Law 875, 81st Congress. North Atlantic Division.
U.S. Army Corps of Engineers, New York District (USACE-NAN), DRAFT 1998. “Inlet Dynamics – Existing Conditions for Fire Island to Montauk Point Storm Risk management Reformulation Study,” U.S. Army Corps of Engineers, New York District.
U.S. Army Corps of Engineers, New York District (USACE-NAN), 1999. “Barrier Island Breach and Overwash Impacts, Position Paper for Fire Island to Montauk Point Storm Risk management Reformulation Study,” U.S. Army Corps of Engineers, New York District.

FIMIStabilizationHurricaneSandyLimitedReevaluationReport–June2014 Page111
U.S. Army Corps of Engineers, New York District (USACE-NAN), DRAFT 2000. “Fire Island Inlet to Montauk Point, Long Island, New York: Basis of Design Report)”, U.S. Army Corps of Engineers, New York District.
U.S. Army Corps of Engineers, New York District (USACE-NAN), 2009. “Draft Formulation Report”, U.S. Army Corps of Engineers, New York District.
U.S. Army Corps of Engineers, 2013. Incorporating Sea Level Change in Civil Works Programs, ER 1110-2-8162, dated 31 December 2013. United States Geological Survey (USGS), 2012.
http://coastal.er.usgs.gov/hurricanes/sandy/field-measurements/
WL | Delft Hydraulics, 2008. “Delft3D-FLOW: Simulation of Multi-Dimensional Hydrodynamic Flows and Transport Phenomena, Including Sediments.”
Yang,. Z., Myers, E.P., Wong, A.M., and White, S.A., 2010, NOAA Technical Memorandum NOS CS 21:Vdatum for Great South Bay, New York Bight, and New York Harbor: Tidal Datums, Marine Grids, and Sea Surface Topography, Silver Springs, MD

FIMIStabilizationHurricaneSandyLimitedReevaluationReport–June2014 Page112
APPENDIX A
STUDY AREA STORM HISTORY
FIMIStabilizationHurricaneSandyLimitedReevaluationReport–June2014 Page113
APPENDIX B
EXISTING PHYSICAL CONDITIONS
FIMIStabilizationHurricaneSandyLimitedReevaluationReport–June2014 Page114
APPENDIX C
TSP LAYOUTS AND VEGETATION MANAGEMENT AREAS

FIMIStabilizationHurricaneSandyLimitedReevaluationReport–June2014 Page115
APPENDIX D
BACK-UP CALCULATIONS
FIMIStabilizationHurricaneSandyLimitedReevaluationReport–June2014 Page116
APPENDIX E
BORROW AREA PLAN
FIMIStabilizationHurricaneSandyLimitedReevaluationReport–June2014 Page117
APPENDIX F
PUBLIC ACCESS PLAN

FIMIStabilizationHurricaneSandyLimitedReevaluationReport–June2014 Page118
APPENDIX G
REAL ESTATE PLAN
FIMIStabilizationHurricaneSandyLimitedReevaluationReport–June2014 Page119
APPENDIX H
COST APPENDIX
FIMIStabilizationHurricaneSandyLimitedReevaluationReport–June2014 Page120
APPENDIX I
PERTINENT CORRESPONDENCE
FIMIStabilizationHurricaneSandyLimitedReevaluationReport–June2014 Page121
APPENDIX J
LAND MANAGEMENT APPENDIX
FIMIStabilizationHurricaneSandyLimitedReevaluationReport–June2014 Page122
APPENDIX K
NEW YORK STATE DEPARTMENT OF ENVIRONMENTAL
CONSERVATION
LETTER OF SUPPORT