financial report - rockford public schools information/17...statement of fiduciary assets and...
TRANSCRIPT
ANNUALFINANCIALREPORTas of and for the year ended June 30, 2017
OFFICIALS ISSUING REPORTDr. Ehren Jarrett – SuperintendentNicole Thorn – Chief Financial Officer
DEPARTMENT ISSUING REPORTFinance
COMPREHENSIVE
District No. 205 | 501 7th Street, Rockford, IL 61104 | 815.966.3000 | rps205.com

ROCKFORD PUBLIC SCHOOLS,
DISTRICT #205
ROCKFORD, ILLINOIS
COMPREHENSIVE ANNUAL
FINANCIAL REPORT
For the Fiscal Year Ended
June 30, 2017
Prepared by:
Dr. Ehren Jarrett, Superintendent
Nicole Thorn, Chief Financial Officer

ROCKFORD PUBLIC SCHOOLS, DISTRICT #205
ROCKFORD, ILLINOIS
TABLE OF CONTENTS
Page(s)
INTRODUCTORY SECTION
Principal Officers ......................................................................................................... i-ii
Organizational Chart .................................................................................................... iii
Certificate of Excellence in Financial Reporting ......................................................... iv
Transmittal Letter......................................................................................................... v-xiv
FINANCIAL SECTION
INDEPENDENT AUDITOR’S REPORT ................................................................... 1-3
GENERAL PURPOSE EXTERNAL FINANCIAL STATEMENTS
Management’s Discussion and Analysis ................................................................. MD&A 1-12
Basic Financial Statements
Government-Wide Financial Statements
Statement of Net Position .............................................................................. 4-5
Statement of Activities .................................................................................. 6-7
Fund Financial Statements
Governmental Funds
Balance Sheet ............................................................................................ 8
Reconciliation of Fund Balances of Governmental Funds to the
Governmental Activities in the Statement of Net Position ..................... 9
Statement of Revenues, Expenditures and
Changes in Fund Balances ...................................................................... 10
Reconciliation of the Governmental Funds Statement of
Revenues, Expenditures and Changes in Fund Balances
to the Statement of Activities ................................................................. 11

ROCKFORD PUBLIC SCHOOLS, DISTRICT #205
ROCKFORD, ILLINOIS
TABLE OF CONTENTS (Continued)
Page(s)
FINANCIAL SECTION (Continued)
GENERAL PURPOSE EXTERNAL FINANCIAL STATEMENTS (Continued)
Basic Financial Statements (Continued)
Fund Financial Statements (Continued)
Proprietary Funds
Statement of Net Position ......................................................................... 12
Statement of Revenues, Expenses and
Changes in Net Position.......................................................................... 13
Statement of Cash Flows .......................................................................... 14
Fiduciary Funds
Statement of Fiduciary Assets and Liabilities - Agency Fund ................. 15
Notes to Financial Statements ............................................................................ 16-54
Required Supplementary Information
Schedule of Revenues, Expenditures and
Changes in Fund Balance - Budget and Actual
General Fund ................................................................................................. 55-67
Schedule of Funding Progress
Other Postemployment Benefit Plan ............................................................. 68
Schedule of Employer Contributions
Illinois Municipal Retirement Fund .............................................................. 69
Other Postemployment Benefit Plan ............................................................. 70
Teachers’ Retirement System of the State of Illinois .................................... 71
Schedule of Changes in the Employer’s Net Pension Liability
and Related Ratios
Illinois Municipal Retirement Fund .............................................................. 72
Schedule of the District’s Proportionate Share of the Net Pension Liability
Teachers’ Retirement System of the State of Illinois .................................... 73
Notes to Required Supplementary Information ................................................. 74-75

ROCKFORD PUBLIC SCHOOLS, DISTRICT #205
ROCKFORD, ILLINOIS
TABLE OF CONTENTS (Continued)
Page(s)
FINANCIAL SECTION (Continued)
SUPPLEMENTARY INFORMATION
Schedule of Revenues, Expenditures and
Changes in Fund Balances
Operating Funds ................................................................................................. 76-77
MAJOR DEBT SERVICE AND CAPITAL PROJECTS FUNDS
Schedule of Revenues, Expenditures and
Changes in Fund Balance - Budget and Actual
Bond and Interest Fund ................................................................................. 78
Capital Projects Fund .................................................................................... 79
MAJOR GENERAL FUND
General Fund
Combining Balance Sheet - by Account ....................................................... 80
Combining Schedule of Revenues, Expenditures and
Changes in Fund Balance - by Account ...................................................... 81
Schedule of Revenues, Expenditures and
Changes in Fund Balance - Budget and Actual
Educational Accounts ............................................................................... 82-94
Working Cash Accounts ........................................................................... 95
Educational Accounts
Combining Balance Sheet - by Subaccount .................................................. 96-97
Combining Schedule of Revenues, Expenditures and
Changes in Fund Balance - by Subaccount ................................................. 98-99
NONMAJOR GOVERNMENTAL FUNDS
Combining Balance Sheet .................................................................................. 100-101
Combining Statement of Revenues, Expenditures and
Changes in Fund Balance .............................................................................. 102-103
Schedule of Revenues, Expenditures and
Changes in Fund Balance - Budget and Actual
Operations and Maintenance Fund ................................................................ 104-105
Transportation Fund ...................................................................................... 106-107
Municipal Retirement/Social Security Fund ................................................. 108-109
Tort Immunity Fund ...................................................................................... 110-111
Fire Prevention and Life Safety Fund ........................................................... 112
FIDUCIARY FUND
Combining Statement of Changes in Assets and Liabilities - Agency Fund ...... 113

ROCKFORD PUBLIC SCHOOLS, DISTRICT #205
ROCKFORD, ILLINOIS
TABLE OF CONTENTS (Continued)
Page(s)
STATISTICAL SECTION
Financial Trends
Net Position by Component .................................................................................... 114-115
Expenses, Program Revenues and Net Revenue (Expense).................................... 116-119
General Revenues and Total Change in Net Position ............................................. 120-121
Fund Balances, Governmental Funds ..................................................................... 122-123
Governmental Funds Revenues .............................................................................. 124-125
Governmental Funds Expenditures and Debt Service Ratio ................................... 126-127
Other Financing Sources and Uses and Net Changes in Fund Balances ................ 128-129
Revenue Capacity
Assessed Value and Actual Value of Taxable Property .......................................... 130
Direct and Overlapping Property Tax Rates ........................................................... 131
Principal Property Taxpayers .................................................................................. 132
Property Tax Levies and Collections ...................................................................... 133
Debt Capacity
Outstanding Debt by Type ...................................................................................... 134
Computation of Direct and Overlapping Governmental Activities Debt................ 135
Legal Debt Margin Information .............................................................................. 136
Pledged Revenue Coverage - Alternate Revenue Source -
Qualified School Construction Bonds ................................................................... 137
Demographic and Economic Information
Demographic and Economic Information ............................................................... 138
Principal Employers ................................................................................................ 139
Operating Information
Full-Time Equivalent District Employees by Type ................................................ 140
Operating Statistics ................................................................................................. 141
Capital Asset Information ....................................................................................... 142
State of Illinois Standardized Test Summary .......................................................... 143-144

INTRODUCTORY
SECTIONas of and for the year ended June 30, 2017
District No. 205 | 501 7th Street, Rockford, IL 61104 | 815.966.3000 | rps205.com

List of Principal Officers ROCKFORD PUBLIC SCHOOLS
CABINET MEMBERS AND PRINCIPALS
Superintendent Dr. Ehren Jarrett Attorney Lori Hoadley Deputy Superintendent Dr. Matthew Vosberg Chief Academic Officer TBD Chief Human Resource Officer Matthew Zediker (Interim)/Lori Burke Chief Financial Officer Nicole Thorn Chief Communications and Community Engagement Earl Dotson, Jr. Officer Chief Quality and Process Improvement Officer Dr. Kelly Monson Chief Operating Officer Todd Schmidt Executive Director of Elementary and Special Programs Diana Alt Executive Director of Elementary Joyann Kirschbaum Executive Director of Student Services and Angela Hite-Carter Alternative Learning Executive Director of Academics Heidi Dettman Executive Director of Curriculum Kari Neri Executive Director of College & Career, ROTC Heidi Houy Executive Director of Technical Services Margaret Ryan Executive Director of Early Childhood Kim Nelson Executive Director of Bilingual Misael Nascimento Executive Director of Special Education Colleen Cyrus Executive Director of Improvement & Innovation Dr. Travis Woulfe Executive Director of Certified Talent Development Ann Baddoo Executive Director of Finance Michelle Jahr, CPA Executive Director of Budgeting Pat Chamberlin Executive Director of Transportation Gregg Wilson Executive Director of Nutrition Services Renee Slotten-Beauchamp Executive Director of Design and Construction Kevin Behling Executive Director of School Improvement Susan Fumo Director of Athletics Mat Parker Director of Special Programs Heather Psaltis Director of Student Support Alex Brewington Director of Fine Arts Bonnie Spurling Director of Career and Technical Education Nik Butenhoff Director of Early Childhood Cherice Fuller Director of Special Education Kathleen Kreller Director of Standardized Metrics Randall Jurasek Grants and Entitlement Director Monique McClurge Director of Human Resources Sarah Abate Director of Talent Acquisition Jason Grey Human Resources Project Director Charo Chaney Director of Certified Talent Development (Leadership) Ashleigh Van Thiel Director of Purchasing Rickey Sparks Director of Payroll Patricia Rohde Director of Security Services Fred Diehl Welcome Center Director Kristina Reuber
- i -

Principals
Auburn High School Janice Hawkins
Barbour Elementary School James Robinette
Beyer Elementary School Jacob Sayre
Bloom Elementary School Heather Novak
Brookview Elementary School Carol Jeschke
Carlson Elementary School Dave Nold
Cherry Valley Vicki Kested
Conklin Elementary School Jan Johnson
Dennis Early Childhood Jenny Keffer
East High School Peter Verona
Eisenhower Middle School Jeffrey Carlson
Ellis Arts Academy Taren Turner
Fairview Early Childhood Darcy Dunn
Flinn Middle School Randy Bay
Froberg Elementary School Christina Ulferts
Gregory Elementary School Kristine Leider
Guilford High School Jennifer Lawrence
Haskell Elementary School Loree Leathers
Hillman Elementary School Carolyn Kloss
Jefferson High School Don Rundall
Johnson Elementary School Amber Miller
Kennedy Middle School Renneth Richardson
King Elementary School Gregory Midgett
Kishwaukee Elementary School Aimee Kasper
Lathrop Elementary School Penny El-Azhari
Lewis Lemon Elementary School Steve Francisco
Lincoln Middle School Jim Parker
Marshall Elementary School Jessica Powell
Marshall Middle School Jill Faber
McIntosh Elementary School Al Gagliano
Montessori Elementary School Candice Collins
Nashold Elementary School Erin Salberg
Nelson Elementary School Rene Mandujano
RESA Middle School Ben Stover
Riverdahl Elementary School Teresa Schneider
Rolling Green Elementary School Holly Lyman
Roosevelt Alternative High School Morgan Gallagher
Spring Creek Elementary School Ray Owens
Summerdale Early Childhood School Kristin Martin-Fry
Thompson Elementary School Emma Gipson
Welsh Elementary School Matthew Lerner
West Middle School Maurice Davis
West View Elementary School Veronica Bazan
White Swan Elementary School Carolyn Timm
Whitehead Elementary School Pam Miner
Wilson ASPIRE Angela Rieke
- ii -

Board of Educa on
Superintendent
General Counsel
Manager, Superintendent’s
Office
Deputy Superintendent
Chief Human Resources Officer
Chief Financial Officer
Chief Communica ons/ Community Engagement
Officer
Chief Con nuous Improvement Officer
Board Coordinator
Chief Academic Officer
Rockford Public Schools District #205
6 1,2,4 7 5,9 3 8
Strategy Legend:
1. Curriculum Alignment 2. Differen ated Instruc on 3. Customer Service 4. Social Emo onal Health & Skills 5. Facili es & Technology 6. Internal Trust & Rela onships 7. Recruit & Develop 8. Monitor, Track & Report 9. Resource Alloca on
Revised 2/6/2017
- iii -

The Certificate of Excellence in Financial Reporting
is presented to
Rockford Public Schools, District 205
for its Comprehensive Annual Financial Report (CAFR) for the Fiscal Year Ended June 30, 2016.
The CAFR has been reviewed and met or exceeded
ASBO International’s Certificate of Excellence standards.
Anthony N. Dragona, Ed.D., RSBA John D. Musso, CAE, RSBA President Executive Director
- iv -

Financial Services Department
815.966.3063 Phone 815.489.2765 FAX
[email protected] Email December 8, 2017 President and Members of the Board of Education And Citizens of Rockford Public School District No. 205 Rockford, Illinois The Comprehensive Annual Financial Report (CAFR) of Rockford Public Schools District No. 205 (the District), Rockford, Illinois, as of and for the year ended June 30, 2017, is submitted herewith. Responsibility for the accuracy of the presented data and the completeness and fairness of the presentation, including all disclosures, rests with the District. We believe the data, as presented, is accurate in all material aspects; that it is presented in a manner designed to fairly set forth the financial position and results of operations of the District as shown by the disclosure of all financial activity of its various funds; and that all disclosures necessary for public understanding of the District’s financial status have been incorporated within this report. Management’s Discussion and Analysis (MD&A) immediately follows the independent auditor’s report and provides a narrative introduction, overview, and analysis of the basic financial statements. MD&A complements this letter of transmittal and should be read in conjunction with it. Financial Statements The CAFR includes all funds and account groups of the District and is presented in three sections: Introductory, Financial, and Statistical. The Introductory section includes this transmittal letter, the District’s organization chart, and a list of principal officers and elected officials. The Financial section includes the independent auditor’s report on financial statements and schedules, Management’s Discussion and Analysis (MD&A), basic financial statements and required supplemental information such as the combining and individual fund financial statements and schedules. The Statistical section includes selected financial and demographic information, generally presented on a multi-year basis. The District is required to undergo an annual single audit in conformity with the audit requirements of Title 2 U.S. Code of Federal Regulations Part 200, Uniform Administrative Requirements, Cost Principles, and Audit Requirements for Federal Awards (Uniform Guidance). Information related to this single audit, including a schedule of federal financial assistance and the independent auditor’s reports on the internal control structure and on compliance with applicable laws and regulations, is included under separate cover. The financial reporting entity of the District is to include the District, as the primary government organization for which the District is financially accountable, and other organizations for which the nature and significance of their relationship with the District are such that exclusions would cause the District’s financial statements to be misleading or incomplete. Based on these entities there are no other organizations or agencies whose financial statements should be combined with the general purpose financial statements of the District.
- v -

President and Members of the Board of Education and Citizens of Rockford Public School District No. 205 December 8, 2017 Page 2 of 10
Reporting Entity and Its Services
The Rockford Public School District covers about 170 square miles (440 km2) and serves over 28,500 students. It is the among the largest school districts in the state of Illinois, with 29 elementary schools, 7 middle schools, 4 high schools (Jefferson, Guilford, Rockford East High School, and Auburn), 2 alternative schools, Roosevelt and Wilson Aspire, 4 early childhood centers (Summerdale, Dennis, Fairview, and Nashold) and 3 charter schools. The District is primarily in Winnebago County with a small section in Boone County.
The District’s 3,259 full-time equivalent employees (1,532 teachers, 233 certified support, 1,330 non-certified staff, and 164 administrators) served 28,512 students for the 2017 school year, with expenditures totaling $508.6 million. Of the $508.6 million total expenditures, $53.8 million of expenses were capital projects and bond and interest payments and were paid from Construction and Life Safety Funds and Debt Service Funds. The governing body consists of a seven-member Board of Education elected from within seven sub District boundaries for four-year overlapping terms. The Superintendent and staff administer day-to-day operations. Board of Education OFFICIAL POSITION TERM EXPIRES Kenneth Scrivano President April 2021 Jude Makulec Vice President April 2019 Michael Connor Secretary April 2021 Jaime Escobedo Member April 2021 Tim Rollins Member April 2019 David Seigel Member April 2019 Anthony Dixon Member (seated April 2017) April 2021 Lisa Jackson Member Resigned April 2017 Based on the legislative authority codified in Illinois School Code, the Board of Education has the following power:
The corporate power to sue and be sued in all courts. The power to levy and collect taxes and to issue bonds. The power to contract for appointed administrators, teachers, and other personnel as well as for goods and
services. Mission and Strategic Goals Rockford Public School District’s mission is to “Collaboratively engage all students in a world class education.” The RPS205 Strategic Plan was a collaboration of approximately 50 stakeholders, including representation from the school board, the teachers’ association, the paraprofessional association, the administrative assistant association, community leaders, administrators, parents, and students. Implementation of this Strategic Plan began in the 2015-2016 school year. The plan identifies five major goal areas for the District and nine key strategies that define and prioritize work for District staff and partners over a five-year period.
- vi -

President and Members of the Board of Education and Citizens of Rockford Public School District No. 205 December 8, 2017 Page 3 of 10
Goal One – Growth and Achievement The focus of Goal 1 is to ensure students are college and career ready. This goal contains measures on student growth, student experiences and skill development, academic benchmarks and social and emotional learning—all related to the goal of college and career readiness.
Goal Two – Engaging Partnerships
The focus of Goal 2 is to engage families and the community as vital partners in the education process. This goal contains measures on family engagement and satisfaction, community contributions, and community satisfaction.
Goal Three – Optimal Climate The focus of Goal 3 is to ensure a productive and satisfying climate for learning and teaching. This goal contains measures on student behavior and satisfaction, staff engagement and satisfaction, collaborative environment and learning environment.
Goal Four – Quality Staff The focus of Goal 4 is to attract, develop, and retain a high quality, diverse, and accountable workforce. This goal contains measures on hiring diverse and high quality staff; the commitment, motivation and quality of staff; and continuous improvement throughout the organization.
Goal Five – Fiscal & Operational Stewardship The focus of Goal 5 is to demonstrate effective and efficient business operations and ensure excellent stewardship of public money. This goal contains measures on financial stewardship, sustainable operating practices, streamlining business practices and eliminating waste, and financial recognition from the state of Illinois.
Strategic Plan – Strategies To support the achievement of Goals One through Five of the RPS 205 Strategic Plan, the following nine Strategies were identified: Strategy one is to align curriculum, instruction, and interventions with unit and course assessments across grade levels and schools to guarantee a rigorous, consistent set of learning expectations for students. Financial resources have been allocated to bring in content experts that will facilitate the framework for this work. Central office FTEs have been adjusted to focus on curriculum and assessment alignment work. The major theme throughout the strategic plan is collaboration and shared work with teachers. Teachers will be involved with much of the work developing and aligning curriculum. As a result, the District has financially committed through the budget development process for significant dollars for guest teachers. This will ensure full time teachers the necessary release opportunities to be actively engaged and involved in the work of strategies one and two. Strategy two is to differentiate instruction and provide additional time and support for students who are struggling and students who need to be challenged. The key concepts are to use unit or course assessment data to drive instructional decision-making; use specialists in English Language Learning, reading, math, social work, psychology, nursing and counseling; use flexible grouping of students, co-teaching and research-based collaborations; employ problem-solving teams; and establish entrance and exit learning outcomes for all interventions.
- vii -

President and Members of the Board of Education and Citizens of Rockford Public School District No. 205 December 8, 2017 Page 4 of 10
Strategy three is improving customer service between the District, families and the community to foster confidence, respect, and continuous improvement for the system. Resources will continue to be allocated to the Communications and Community Engagement Department to ensure that parents and community members are partners in the education process. We are committed to the education of parents, increasing community involvement and connecting volunteers to our schools. Our goal is to ensure that parents and the Rockford community are a critical part of contributing to the success of each child. Strategy four is related to curriculum, but deals specifically with social emotional learning and 21st Century skills. While much of the work in strategy four will be aligned with that of one and two, it is important to note the voice of the community to support 21st Century skills through the District’s academy model. Resources will continue to be allocated for students in grades 8-12 to research career clusters, choose career academies, and have courses that align with specific career goals and aspirations. The financial commitment of the career academy model is significant, as it allocates continued District and school staff towards supporting the program, relies on the additional seventh period for high school students, and requires specialized professional learning and external coaching for staff. Strategy five is to maintain facilities and integrate technology into our academic and operating systems to create high-quality and innovative teaching, learning, and working environments. The 2016-2017 Budget allocates significant resources to continued support of the $250 million capital plan, which the School Board approved in August 2012. The Budget also shows an additional allocation for refreshing technology for students and staff. Strategy six is to build trust and improve relationships between the District office and its schools to foster a climate conducive to continuous improvement. Key concepts include a customer service focus from the district office to the schools and two-way decision-making structures and processes. Strategy seven is to recruit, onboard, mentor, develop, evaluate, and retain employees who comprise a high-quality and diverse workforce. Strategy eight uses key data indicators and measures with all employees that promote a culture of inquiry, reflection and action. That will help individuals, teams, departments, schools and the District set goals and monitor, track, and report performance. Strategy nine is to proactively forecast and allocate resources that balance the needs of taxpayers and the community with the critical needs of fulfilling our mission and vision. The District’s process improvement work to prioritize the exploration and improvement of efficiencies will save the District time and money in subsequent years. The District believes allocating resources to finding efficiencies now will provide for exponential savings in the future. Rockford Public Schools provides the following services: ● Core Curriculum – Instruction in core curricular areas, such as math, reading, sciences, social sciences and writing, starting in pre-kindergarten through grade 12. ● Alternative Education Programs – Alternative education is a perspective, not a procedure or a program. There are many ways to become educated, and it is our belief that all students can learn. To accomplish this goal, we will provide a variety of structures and environments so that each student can find a learning venue that is sufficiently comfortable to facilitate success.
- viii -
President and Members of the Board of Education and Citizens of Rockford Public School District No. 205 December 8, 2017 Page 5 of 10
● Guidance Counseling – We will work in concert with the community to ensure that all students receive the support of a comprehensive counseling program that inspires and empowers them to make decisions, set future goals and then actively pursue them. We will continue to create and build partnerships such as our College Readiness joint venture with Rock Valley College. ● Special Education – We will provide curriculum aligned to the national standards, make decisions based on performance data and focus on the unique needs of students with disabilities to ensure they leave school well prepared for continued learning and successful employment. ● English Language Learner Education – As a District, we will narrow the achievement gap between native English speakers and English language learners by aligning existing curriculum to ensure that what is written, what is taught and what is tested moves students toward proficiency and success. The Two-Way Language Immersion program at Barbour for grades K-8 is a two-way immersion program comprised of half native, or heritage, English speakers and half native, or heritage, Spanish speakers. Students receive 90% of their instruction in Spanish in K-1, with English instructional time increasing by 10% each year. In 5th through 8th grades, daily instruction is 50% Spanish and 50% English to ensure students are bilingual and biliterate. It is the only program that focuses on maintaining Spanish while learning English for native Spanish speakers, while maintaining English while learning Spanish for native English speakers. ● Choice Curriculum – The District offers specialized programs of study for students who are gifted or talented or who have interests and/or abilities in creative and performing arts, environmental science and various branches of career education. Rockford Public Schools will seek to become the schools of first choice in Rockford and do so through a thorough and consistent communication of this plan with staff, students, parents and the community. We will seek partnerships with all levels of community leaders, governmental officials, higher education and career program administrators and District planners to achieve a high level of excellence in educational services. Rockford Public Schools will serve all children and will create an atmosphere in which all children can reach their highest potential. Major Initiatives and Accomplishments The Strategic Plan, with its five goals and nine strategies, drives innovation and improvement in RPS 205. Before the School Board approved the plan in February 2015, a committee of teachers, administrators, community leaders, students and parents collected feedback from more than 3,500 stakeholders. The School Board reviews progress on the plan at 90-day intervals.
The district has received national attention for its fidelity to the high school academy concept, which has a goal of College and Career Readiness. The high school academies are now in their fifth year of full implementation. Students select one of four academy pathways: Business, Arts, Modern World Languages and Information Technology (BAMIT), Engineering, Manufacturing and Industrial Trades Technology (EMITT), Human and Public Services (HPS) and Health Sciences (HS). The coursework in the academy selected prepares students for a career in that field. Rockford is one of only three communities in the nation to have earned the title of Ford Next Generation Learning Model Community. The Rockford Public Schools, Alignment Rockford and a wealth of other community partners are committed to collaborate to prepare students for a modern, well-paying workforce.
- ix -

President and Members of the Board of Education and Citizens of Rockford Public School District No. 205 December 8, 2017 Page 6 of 10
The district supports diverse and high quality teaching--and growing our own future teachers--through the Education Pathway program. Every year, RPS 205 will award as many as 20 scholarships to assist high school graduates who pursue a teaching degree through Rockford University. These scholarship recipients will receive a four-year degree for as little as $20,000 (depending on financial need). They will do their student teaching in the district and have the promise of a job in the district when they get their degree. Once hired, they will be able to earn a master’s degree in urban education for free from Rockford University. Preschool for All continues to be a goal for RPS 205. Prekindergarten and comprehensive services are provided to nearly 2,600 students enrolled in Early Childhood education in the district. That represents a 16.9 percent increase from the number of students enrolled in early childhood in 2011. Students are enrolled at four early childhood centers and one child care collaboration site. As part of the year-round Prevention Initiative program, 251 children were enrolled in a home visiting program that completed 2,559 home visits in fiscal year 2017. The early education centers have been recognized with the Award of Excellence for Inclusion of Children with Special Needs from ExceleRate Illinois and the state’s Gold Circle of Quality for Early Childhood. All instruction is aligned with the Illinois Early Learning and Development Standards. The catalyst for all capital improvements in RPS 205 is the 10-Year Facilities Plan. It was developed in 2012 with input from business professionals, administrators, teachers, parents and students. In addition to renovations and upgrades, the plan includes building two schools and 13 additions. Eight schools have been or will be closed to reduce the footprint of the district and make it more efficient. The work is now 69 percent complete. Prior to the capital projects under the facilities plan, district buildings averaged 57 years old. Given the identified resources available to create 21st century learning environments for students, the capital budget is developed with student safety in mind and, where possible, use of the latest state-of-the-art equipment. With a comprehensive study in hand, the capital budget is developed around the priorities of:
Safety Instructional Environment Return on Investment Savings
In the fall of each year the Operations department and Design and Construction department submits to the Finance department the proposed list of projects, architect budget estimates for each project, and the proposed funding stream as a part of the capital budget development process. The proposed spending plan is submitted to the Operations Committee of the Board of Education and eventually to the full Board of Education. Upon approval by the Board of Education, the Finance department appropriates the proposed capital spending plan in the fund, function and object to accurately capture the expenditure during budget development. A summary of the investments by school, as well as a list of capital projects by school for the next 5 years is presented in the Financial Section of the budget document. The 10 Year Facilities Review is the cornerstone for capital budget planning for RPS205 for the next decade.
- x -

President and Members of the Board of Education and Citizens of Rockford Public School District No. 205 December 8, 2017 Page 7 of 10
District Organization and History
Rockford is a mid-sized city located on both banks of the Rock River in far northern Illinois. The District is located in Winnebago and Boone Counties with over 99% of its equalized assessed valuation being located within Winnebago County. The Rockford School District was formed in 1865 and is a legal body created by the statute of the state of Illinois.
The city is home to approximately 148,000 people making it the fourth largest city in Illinois after Chicago, Aurora and Joliet. Rockford is principally an advanced manufacturing, aerospace, and service community. The Rockford Public Schools is the second-largest employer in the Rockford region.
The racial makeup of the student population in FY17 was 31.2% White, 30.6% African American, 27.1% Hispanic, 4.1% Asian/Pacific Islander, 0.2% Native American, and 6.9% multi-racial. While a high percentage of our students qualify to receive free or reduced-price meals, every student in RPS 205 can receive breakfast and lunch at no cost. The District is enrolled in a federally funded alternative meal program to replace out-of-pocket costs for students and their families. RPS 205 is one of 154 Illinois districts to participate in the program, aimed at having students undistracted by an empty stomach and ready to learn. Enrollment in the District is projected to decrease, with 25,150 students enrolled K-12 in FY19, and 25,092 through 2021-22. Accounting Systems and Budgetary Control In developing and evaluating the District’s accounting system, consideration is given to the adequacy of internal accounting controls. Such controls are designed to provide reasonable, but not absolute, assurance for the safeguarding of assets against loss from unauthorized use or disposition and the reliability of financial records for preparing financial statements and maintaining accountability for assets. We believe that our internal accounting controls adequately safeguard District assets and provide reasonable assurance of the proper recording of financial data. Budgetary control is maintained at line-item levels and built up into location, department, and program totals before being combined to create fund totals. All actual activity compared to budget is reported to the District’s Administrative team and to the Board of Education monthly. The reports compare year-to-date activity versus budget and prior year actual. Full disclosures are made if extraordinary variances appear during the year. The Board of Education has a balanced budget policy and each year strives to reach this goal. As a recipient of federal and state financial assistance, the District also is responsible for ensuring that an adequate internal control structure is in place to ensure compliance with applicable laws and regulations related to those programs. This internal control structure is subject to periodic evaluation by management. General Governmental Activities The general governmental activities include all services provided by the District. Included are the general, special revenue, debt service and capital project funds. The activities include all instructional, maintenance, and administrative costs of the District.
- xi -

President and Members of the Board of Education and Citizens of Rockford Public School District No. 205 December 8, 2017 Page 8 of 10
The District separates the day-to-day activities into Operating funds or Capital funds. Operating funds include the Education, or the General Fund (which includes Food Service, Special Education Fund, Grant Fund and Working Cash Fund), Operations and Maintenance Fund, Transportation Fund, IMRF/Social Security Fund, and Tort Immunity Fund. Capital funds include Debt Service, Construction and Life Safety funds. During the 2016-2017 school year property taxes represented 30% of the revenue received by the District. State aid accounted for 55%, federal grants 9%, 5% from corporate taxes, and 1% from fees and other revenue. In regard to current fund balances, the District is in very good financial shape with a governmental fund balance of $195.2 million. However, note that $64.9 million of the fund balance is restricted in use for specific capital projects, $19 million of the fund balance is restricted for bond payments and life safety projects, leaving $111.3 million to be used for day-to-day operational expenses. Relevant Board of Education Policies Administration revised several Board of Education Policies that directly affect how the District conducts financial business. In the fall of 2015 a Board policy, Use of Purchasing Cards, was developed and adopted by the Board whereas previously no such Board policy existed. Additionally, Administration developed an Administrative Regulation, Use of Credit and Procurement Cards, further tightening control and oversight of employee use of District-issued purchase cards. The Accounting and Audits Board policy was further revised to address capital assets, methods of depreciation of capital assets and how to assign life to capital assets. Board policy, Board Fund Balance Policy, was revised designating the District’s Treasurer as the sole designee of how fund balance monies will be expended. Additionally, a clause was added to address the flow of funds: restricted fund balance, followed by committed fund balance, assigned fund balance, and lastly, unassigned fund balance. Finally, the Committees Board policy was revised to establish a Finance Committee of the Board of Education allowing for greater opportunities for Board of Education participation in key aspects of District finances and shifting emphasis from a reactive review of financial matters to proactive involvement in budget planning and reporting. Independent Audit The School Code of Illinois and the District require an annual audit of the financial statements of all funds of the District. The audit for the year ended June 30, 2017 was done by Sikich, LLP, independent certified public accountants, selected by the District’s Board of Education. The audit report has been included in the financial section of this report. Economic Condition and Outlook Due to its location in the Midwest, the Rockford Region enjoys four clearly defined seasons and has advantages to include a big city lifestyle with a small town feel. Rockford is home to award winning parks and recreational opportunities sponsored by the Rockford Park District. The city also is a leading hub for amateur sports tourism featuring Mercy Sportscore 1 and UW Health Sports factory, while boasting the BMO Harris Bank Center home of the Rockford Ice Hogs and a minor league baseball team, the Rockford Riverhawks. There are many opportunities for
- xii -

President and Members of the Board of Education and Citizens of Rockford Public School District No. 205 December 8, 2017 Page 9 of 10
arts and culture through community theatres including the Starlight Theatre on the Rock Valley College campus, the renovated Coronado Performing Arts Center downtown, museums, and multiple gardens including the Klehm Arboretum and Botanic Garden, Anderson Japanese Garden, and the Nicholas Conservatory. The City of Rockford’s economy is diversified with manufacturing, aerospace, and health care as its primary base, while call center/office operations, distribution centers and educational institutions have become more important to the economy in recent years. Rockford is home to the operation of several large companies such as: Mercy Health System, Swedish American Health System, UTC Aerospace Systems, United Parcel Service, OSF St. Anthony’s Healthcare, Fiat Chrysler, APAC Customer Services Inc., Woodward Inc., Invensys, Quebecor Printing, Lowe’s Distribution Center, Mondelez International, and Anderson Packaging. Rockford is proud of its quality of life, skilled workforce and low cost of living. The City and private interests are aggressively pursuing the expansion and diversification of the work force. The City has created tax increment districts, an enterprise zone, and small business loan program, administers the Community Development Block Grant Program and the Home Buyers Property Tax Rebate Program to foster economic development, encourage home ownership in the community and to build the tax base. One of Rockford’s assets is the quality of higher education in and around the community. Rockford is home to: Rock Valley College – a two-year community college with a state-of-the-art Technology Center that is used by area manufacturers and businesses; Rockford University – a fully accredited independent institution that awards bachelor degrees in thirty-one majors in arts and science as well as graduate programs in business and education; Northern Illinois University Rockford Campus – offers courses in business, education, engineering and engineering technology, health and human sciences, and liberal arts and sciences, as well as a cooperative effort with Rock Valley College to award bachelor degrees in Nursing, General Studies, Computer Science, Industrial Technology, Community Health and Elementary Education; University of Illinois College of Medicine at Rockford – provides education to second, third and fourth year medical students in the fields of primary care, family practice, internal medicine, pediatrics and other medical specialties; Rasmussen College Rockford – a two-year community college that works in harmony with Rockford’s business community and employer demands. The local economy has shown signs of improvement albeit slowly over the last few years as the local unemployment rate has improved significantly from its high of 16% during the Great Recession; however, by October 2017 the unemployment rate of 5.4% was still behind both the state average of 4.9% and the national average of 4.1%. Information from the Rockford Area Convention & Visitors Bureau continues to show signs of economic improvement as reported for Winnebago County Hotel Statistics related to hotel occupancy and average room rates as indicated by September 2017 of 74.3% occupancy compare to 62.1% a year ago and average room rate of $89.56 in 2017 up from $84.98 in 2016. Additionally, the median home sales price increased approximately $8,750 or 9% for August 2017 compared to September 2016 while the median household income increased from $38,716 in 2015 to $39,882 in 2016. Awards The District received the Government Finance Officers Association Certificate of Achievement for Excellence in Financial Reporting award last fiscal year. In addition, the District was the recipient of Association of School Business Officials (ASBO) International Certificate of Excellence in Financial Reporting Award last fiscal year, having been a recipient of this reward for six of the past seven years. These awards reflect the District’s commitment to the highest standards of school system financial reporting.
- xiii -

- xiv -

FINANCIALSECTIONas of and for the year ended June 30, 2017
District No. 205 | 501 7th Street, Rockford, IL 61104 | 815.966.3000 | rps205.com

401 W. State Street, Suite 509 Rockford, IL 61101
815.282.6565
INDEPENDENT AUDITOR’S REPORT
To the Board of Education Rockford Public Schools, District #205 Rockford, Illinois We have audited the accompanying financial statements of the governmental activities, each major fund and the aggregate remaining fund information of Rockford Public Schools, District #205 (the District) as of and for the year ended June 30, 2017, and the related notes to financial statements which collectively comprise the District’s basic financial statements as listed in the table of contents.
Management’s Responsibility for the Financial Statements Management is responsible for the preparation and fair presentation of these financial statements in accordance with accounting principles generally accepted in the United States of America; this includes the design, implementation and maintenance of internal control relevant to the preparation and fair presentation of these financial statements that are free from material misstatement, whether due to fraud or error. Auditor’s Responsibility
Our responsibility is to express opinions on these financial statements based on our audit. We conducted our audit in accordance with auditing standards generally accepted in the United States of America and the standards applicable to financial audits contained in Government Auditing
Standards, issued by the Comptroller General of the United States. Those standards require that we plan and perform the audit to obtain reasonable assurance about whether the financial statements are free of material misstatement. An audit involves performing procedures to obtain audit evidence about the amounts and disclosures in the financial statements. The procedures selected depend on the auditor’s judgment,
including the assessment of the risks of material misstatement of the financial statements, whether due to fraud or error. In making those risk assessments, the auditor considers internal control relevant to the District’s preparation and fair presentation of the financial statements in order to
design audit procedures that are appropriate in the circumstances, but not for the purpose of expressing an opinion on the effectiveness of the District’s internal control. Accordingly, we express no such opinion. An audit also includes evaluating the appropriateness of accounting policies used and the reasonableness of significant accounting estimates made by management, as well as evaluating the overall presentation of the financial statements.
- 1 -

- 2 -
We believe that the audit evidence we have obtained is sufficient and appropriate to provide a basis for our audit opinions. Opinions In our opinion, the financial statements referred to above present fairly, in all material respects, the respective financial position of the governmental activities, each major fund and the aggregate remaining fund information of Rockford Public Schools, District #205, as of June 30, 2017, and the respective changes in financial position and where applicable, cash flows thereof, for the year then ended in accordance with accounting principles generally accepted in the United States of America. Other Matters
Required Supplementary Information
Accounting principles generally accepted in the United States of America require that the management’s discussion and analysis and other required supplementary information identified in the accompanying table of contents be presented to supplement the basic financial statements. Such information, although not a part of the basic financial statements, is required by the Governmental Accounting Standards Board, who considers it to be an essential part of financial reporting for placing the basic financial statements in an appropriate operational, economic or historical context. We have applied certain limited procedures to the required supplementary information in accordance with auditing standards generally accepted in the United States of America, which consisted of inquiries of management about the methods of preparing the information and comparing the information for consistency with management’s responses to our
inquiries, the basic financial statements and other knowledge we obtained during our audit of the basic financial statements. We do not express an opinion or provide any assurance on the information because the limited procedures do not provide us with sufficient evidence to express an opinion or provide any assurance. Other Information
Our audit was conducted for the purpose of forming opinions on the financial statements that collectively comprise the District’s basic financial statements. The introductory and statistical sections and supplementary information, as listed in the table of contents, are presented for purposes of additional analysis and are not a required part of the basic financial statements. The supplementary information is the responsibility of management and was derived from and relates directly to the underlying accounting and other records used to prepare the basic financial statements. Such information has been subjected to the auditing procedures applied in the audit of the basic financial statements and certain additional procedures, including comparing and reconciling such information directly to the underlying accounting and other records used to prepare the basic financial statements or to the basic financial statements themselves, and other additional procedures in accordance with auditing standards generally accepted in the United States of America. In our opinion, the supplementary information is fairly stated in all material respects in relation to the basic financial statements as a whole. The introductory and statistical sections have not been subjected to the auditing procedures applied in the audit of the basic financial statements and, accordingly, we do not express an opinion or provide any assurance on them.
- 2 -
- 3 -
Other Reporting Required by Government Auditing Standards
In accordance with Government Auditing Standards, we also issued a report dated December 8, 2017, on our consideration of the District’s internal control over financial reporting and on our tests of its compliance with certain provisions of laws, regulations, contracts and grant agreements and other matters. The purpose of that report is to describe the scope of our testing of internal control over financial reporting and compliance and the results of that testing, and not to provide an opinion on the internal control over financial reporting or on compliance. That report is an integral part of an audit performed in accordance with Government Auditing Standards in considering the District’s internal control over financial reporting and compliance. Rockford, Illinois December 8, 2017
- 3 -

Rockford Public Schools, District 205 Management's Discussion and Analysis (Unaudited)
As of and For the Year Ended June 30, 2017
MD&A 1
The discussion and analysis of Rockford Public Schools, District 205’s (the "District") financial performance provides an overall review of the District’s financial activities for the year ended June 30, 2017. The management of the District encourages readers to consider the information presented herein in conjunction with the basic financial statements to enhance one’s understanding of the District’s financial performance. Certain comparative information between the current year and the prior year is required to be presented in the Management’s Discussion and Analysis (the “MD&A”).
Financial Highlights
Total net position of the District remained level in fiscal years 2016 to 2017 at $173.9 million.
Total revenues increased $59.3 million from $451.3 million in fiscal year 2016 to $510.6 million in fiscal year 2017. A higher Teachers’ Retirement System on behalf pension revenue and school
additions and improvements account for most of the increase.
Governmental activities, general revenues accounted for $300.5 million in revenue or 59% of all governmental revenues. Program-specific revenues in the form of charges for services and fees and grants accounted for $210.1 million or 41% of total governmental revenues of $510.6 million.
The District had $508.6 million in expenses related to government activities. Only $210.1 million of these expenses were offset by program-specific charges and grants.
Total expenses increased $57.3 million from $451.3 million in fiscal year 2016 to $508.6 million in fiscal year 2017, or 12.7%. A higher Teachers’ Retirement System on behalf pension revenue and school additions and improvements account for most of the increase.
Governmental funds ending fund balance decreased from $218.8 million in fiscal year 2016 (as restated) to $195.2 million in fiscal year 2017, a decrease of $23.6 million due to the spend-down
of bond proceeds.
In the General Fund, the fund balance increased from $89.4 million (as restated) in fiscal year 2016 to $93.6 million in fiscal year 2017, an increase of $4.2 million.
Total General Fund net change in fund balance (actual revenues, less expenditures) was greater than budgeted by $10.8 million, the majority of the increase due to a higher proration in General State Aid.
Overview of the Financial Statements
This discussion and analysis is intended to serve as an introduction to the District’s basic financial statements. The basic financial statements are comprised of three components:
Government-wide financial statements,
Fund financial statements, and
Notes to basic financial statements.
This report also contains other supplementary information in addition to the basic financial statements.
Rockford Public Schools, District 205 Management's Discussion and Analysis (Unaudited)
As of and For the Year Ended June 30, 2017
MD&A 2
Government-wide financial statements
The government-wide financial statements are designed to provide readers with a broad overview of the District’s finances in a manner similar to a private-sector business, and are reported using the accrual basis of accounting and economic resources measurement focus.
The statement of net position presents information on all of the District’s assets, deferred outflows of resources, liabilities, and deferred inflows of resources, with the difference reported as net position. Over time, increases or decreases in net position may serve as a useful indicator of whether the financial position of the District is improving or deteriorating.
The statement of activities presents information showing how the government’s net position changed during the fiscal year being reported. All changes in net position are reported as soon as the underlying
event giving rise to the change occurs, regardless of the timing of related cash flows. Thus, revenues and expenses are reported in this statement for some items that will only result in cash flows in future fiscal periods.
The government-wide financial statements can be divided into two types of activities: governmental and business-type. Governmental activities represent the functions of the District that are principally supported by taxes and intergovernmental revenues. The District’s governmental activities include functions such as instructional services (regular education, special education and other), supporting services, operation and maintenance of facilities and transportation services. The District no longer has business-type activities because of its participation in the Community Eligibility Provision (CEP) program for food service. Because of the District’s participation in this program, the majority of revenues come from Federal funds with only a small portion from business-type activities.
Fund financial statements
A fund is a grouping of related accounts that is used to maintain control over resources that have been segregated for specific activities or objectives. The District uses fund accounting to ensure and demonstrate compliance with finance-related legal requirements. All of the funds and fund types of the District can be divided into the following categories: governmental funds, proprietary funds and fiduciary funds.
Governmental funds
Governmental funds are used to account for essentially the same functions reported as governmental activities in the government-wide financial statements and are reported using the modified accrual basis of accounting and current financial resources measurement focus. The governmental fund statements provide a detailed short-term view of the District’s general government operations and the basic services it provides. However, unlike the government-wide financial statements, governmental fund financial statements focus on near-term inflows and outflows of spendable resources, as well as on balances of spendable resources available at the end of the fiscal year. Such information may be useful in evaluating a District’s near-term financing requirements.
Because the focus of governmental funds is narrower than that of the government-wide financial statements, it is useful to compare the information presented for governmental funds with similar information presented for governmental activities in the government-wide financial statements. By doing so, readers may better understand the long-term impact of the government’s near-term financing decisions. Both the governmental fund balance sheet and the governmental fund statement of revenues, expenditures and changes in fund balances provide a reconciliation to facilitate this comparison between governmental funds and governmental activities.

Rockford Public Schools, District 205 Management's Discussion and Analysis (Unaudited)
As of and For the Year Ended June 30, 2017
MD&A 3
The District maintains eight major individual governmental funds. Information is presented separately in the governmental fund balance sheet and in the governmental fund statement of revenues, expenditures and changes in fund balances for the General Fund, Operations and Maintenance Fund, Transportation Fund, Municipal Retirement/Social Security Fund, Bond and Interest Fund, Capital Projects Fund, Fire Prevention and Safety Fund and Tort Immunity Fund.
The District adopts an annual budget for each of the funds listed above. A budgetary comparison schedule has been provided for each fund to demonstrate compliance with this budget.
Proprietary funds
Proprietary funds are used to account for the District’s ongoing operations and activities, which are similar to those found in the private sector. The measurement focus is based upon the determination of net income. The District does not have enterprise funds. The District has one internal service fund which
accounts for the District’s self-insured health plan.
Fiduciary funds
Fiduciary funds are used to account for resources held for the benefit of parties outside the District. Fiduciary funds are not reflected in the government-wide financial statement because the resources of those funds are not available to support District programs. The accounting used for fiduciary funds is much like that for the government-wide financial statements. These activities are excluded from the government-wide financial statements because the District cannot use these funds to finance operations.
Notes to basic financial statements
The notes to the financial statements provide additional information that is essential to a full understanding of the data provided in the government-wide and fund financial statements.
Other information
In addition to the basic financial statements and accompanying notes, this report also presents certain required supplementary information concerning the District’s contributions and funding progress of the Illinois Municipal Retirement Fund and the Retiree Health Plan, as well as budget-to-actual comparisons of the funds.

Rockford Public Schools, District 205 Management's Discussion and Analysis (Unaudited)
As of and For the Year Ended June 30, 2017
MD&A 4
Government-Wide Financial Analysis
Net Position: The District’s total net position remained level in fiscal years 2016 to 2017 at $173.9 million.
The following provides a summary of the District’s net position (in millions of dollars) at June 30, 2017 and 2016.
2017 2016 Change
Assets:
Current and other assets $ 325.7 $ 361.6 -9.9%
Capital assets 259.4 232.8 11.4%
Total assets 585.1 594.4 -1.6%
Deferred charge on refunding 0.0 0.0
Pension items 24.6 24.1 2.1%
Total deferred outflows of resources: 24.6 24.1 2.1%
Liabilities:
Long‑term liabilities 311.5 278.8 11.7%
Other liabilities 39.7 68.3 -41.9%
Total liabilities 351.2 347.1 1.2%
Property taxes levied for subsequent years 83.0 83.6 -0.7%
Pension Items 1.6 15.6 -89.7%
Total deferred inflows of resources: 84.6 99.2 -14.7%
Net position:
Net investment in capital assets 91.0 81.9 11.1%
Restricted 46.4 71.5 -35.1%
Unrestricted 36.5 18.8 94.1%
Total net position $173.9 $172.2 1.0%
Deferred inflows of resources:
Governmental Activities
Table 1
Condensed Statement of Net Position
(in millions of dollars)
Deferred outflows of resources:
Rockford Public Schools, District 205 Management's Discussion and Analysis (Unaudited)
As of and For the Year Ended June 30, 2017
MD&A 5
Changes in Net Position: The District’s total revenues were approximately $510.6 million for governmental
activities; expenses matched the increase in revenue. Real estate and other taxes comprise approximately 35% of the District’s governmental activities revenue. Another 63% of the governmental activities revenue is received from state and federal aid for specific or general programs, and the remainder of governmental activities revenue is obtained from fees charged for services and miscellaneous sources.
The total cost of all governmental programs and services was approximately $508.6 million for the year ended June 30, 2017, an increase in costs from fiscal year 2016 of approximately $57.3 million or 12.7%. The District’s expenses are predominantly related to instruction and other pupil services such as transportation (aggregating approximately 69% in total). The District’s administrative and business activities account for approximately 15% of total expenses.

Rockford Public Schools, District 205 Management's Discussion and Analysis (Unaudited)
As of and For the Year Ended June 30, 2017
MD&A 6
The following provides a summary of the District’s changes in net position (in millions of dollars) for the years ended June 30, 2017 and June 30, 2016:
2017 2016 Change
Revenues:
Program revenues:
Charges for services 6.4$ 6.9$ -7.2%
Operating grants and contributions 203.6 157.9 28.9%
Capital grants and contributions 0.1 0.1 0.0%
General revenues:
Taxes 179.6 173.9 3.3%
General state aid 120.1 109.4 9.8%
Other general revenues 0.8 3.1 -74.2%
Total revenues 510.6 451.3 13.1%
Expenses:
Instruction 295.6 252.2 17.2%
Pupil and Instructional services 55.1 48.9 12.7%
Administration and Business 75.6 62.8 20.4%
Maintenance and Operations 29.7 27.1 9.6%
Transportation 23.1 22.1 4.5%
Other 29.5 38.2 -22.8%
Total expenses 508.6 451.3 12.7%
Change in net position before transfers 2.0 0.0
Transfers 0.0 0.0
Change in net position 2.0 0.0
Net position, beginning of year, as originally stated 172.2 172.2 0.0%
Prior period adjustment (0.3) 0.0
Net position, beginning of year, restated 171.9 172.2 -0.2%
Net position, end of year $173.9 $172.2 1.0%
Table 2
Condensed Statement of Activities
(in millions of dollars)
Governmental Activities

Rockford Public Schools, District 205 Management's Discussion and Analysis (Unaudited)
As of and For the Year Ended June 30, 2017
MD&A 7
Property taxes were approximately $1.2 million lower in 2017 than in 2016 due to the approach of the District not taking its entitled CPI and an inadvertent error on the 2016 tax levy calculation. Corporate personal property replacement taxes were $5.7 million higher, and General State Aid and other grants were $6.8 million higher than 2016. The State determined during the fiscal year that it had overpaid local governments corporate personal property replacement taxes during the past two years. The District reported a Due to other governments of $2.8 million to reflect the overpayment due to the State at June 30, 2016. The District was notified in September 2017 that the overpayment was forgiven and the District recognized $1.7 million in revenue in 2017 and will recognize the remaining $1.1 in 2018. The District experienced an increase in expenses due to the capital investments.
Operating grants and contributions accounted for the largest portion of the District’s revenues contributing 40%. Property taxes accounted for 35% of the revenue. The remainder of revenues came from state, federal grants and other sources. The total cost of all the District’s programs was $508.6 million, mainly related to instructing and caring for students, and student transportation.
Governmental Revenues by Source
Governmental Revenues by Source
(in millions of dollars)
Taxes $179.6
Operating grants and contributions 203.6
Capital grants and contributions 0.1
General state aid and other 120.9
Charges for services 6.4
$510.6
Taxes35%
Operating grants and contributions
40%
Capital grants and contributions
0%
General state aid and other
24%
Charges for services1%

Rockford Public Schools, District 205 Management's Discussion and Analysis (Unaudited)
As of and For the Year Ended June 30, 2017
MD&A 8
Governmental Activities
The table below presents the cost (in millions of dollars) of six major District activities: instruction, pupil and instructional services, administration and business, operations and maintenance, transportation, and other for the governmental activities. The table also shows each activity's net cost (total cost less fees generated by the activities and intergovernmental aid provided for specific programs). The net cost shows the financial burden placed on the District’s taxpayers by each of these functions.
Governmental Expenses by Function
Governmental Expenses by Function
(in millions of dollars)
Instruction $295.6
Pupil and Instructional Services 55.1
Administration and Business 75.6
Maintenance and Operations 29.7
Transportation 23.1
Other 29.5
$508.6
Instruction58%Pupil and
Instructional Services
11%
Administration and Business
15%
Maintenance and Operations
6%
Transportation4%
Other6%

Rockford Public Schools, District 205 Management's Discussion and Analysis (Unaudited)
As of and For the Year Ended June 30, 2017
MD&A 9
The cost of all governmental activities this year was $508.6 million. Individuals who directly participated or benefited from a program offering paid for $6.4 million of the costs. Federal and state governments subsidized certain programs with grants and contributions of $203.6 million. The net cost of services was primarily financed by District taxpayers through property taxes and Corporate Personal Property Replacement Taxes totaling approximately $179.6 million and other state contributions which are not restricted to specific programs of approximately $120.9 million.
Financial Analysis of the District’s Funds
The financial performance of the District is also reflected in its governmental funds throughout the fund financial statements. The District completed the year with a total governmental fund balance of $195.2 million, a decrease of $22 million from the prior year’s total governmental restated fund balance of $218.2 million. The decrease is due to the spend-down of capital funds.
The General Fund, which includes the Educational Fund, Special Education Fund, Grants Fund, Food Service Fund, and Working Cash Fund, is the fund that is unrestricted and available for instruction, transportation and meals for our students, had an increase in the fund balance of $4.2 million for the year ended June 30, 2017.
The Special Education Fund, a subset of the Educational Fund, continues to be under funded. Expenditures in this fund exceeded revenue by $29 million. The District breaks special education expenditures out to show that the State does not adequately fund these expenditures.
The Working Cash Fund balance increased from $31 million at June 30, 2016 to $32.6 million at June 30, 2017.
The Operations and Maintenance Fund had an increase of $2.2 million.
The Debt Service Fund balance increased by $1.8 million to $3.9 million due to the federal estimated
subsidy received from the 2016 QSCB bond issue.
The Transportation Fund balance increased $8.5 million.
Life Safety Fund balance decreased by $9.5 million due to the spend-down of bond proceeds.
Municipal Retirement/Social Security Funds decreased by $.6 million due to lower tax rates.
The Capital Projects Fund decreased by $25.9 million to $64.8 million due to the spend-down of bond proceeds.

Rockford Public Schools, District 205 Management's Discussion and Analysis (Unaudited)
As of and For the Year Ended June 30, 2017
MD&A 10
General Fund Budgetary Highlights
The District approved the 2017 budget in June 2016 with a general fund deficit of $7.5 million. The actual results show a $4.2 million increase for a favorable variance of $10.8 million. Revenues were more than budgeted by $66.3 million while expenditures were more than budget by $55 million. Many items contributed to the revenue and expenditure variances, including:
Teachers’ Retirement System State on behalf payments for revenues and expenditures were greater than budgeted by $58 million;
Corporate personal property replacement tax revenue is $1.7 million higher than budgeted due to recognition of debt forgiveness by the State;
General State Aid was funded by the State higher than budgeted resulting in a $8.9 million favorable variance; other State grant revenue was lower than budgeted by $2.3 million;
Federal grants increased by $1.2 million from budget due to the District’s participation in the Community Eligibility Provision (CEP) program; other Federal grant revenue was lower than budgeted by $2.6 million;
Instructional salaries and benefits were lower than budgeted by $4.2 million due to vacancies and hiring new staff at a reduced rate.
Capital Assets and Debt Administration
Capital assets
By the end of 2017, the District had compiled total investments of $421.9 million ($259.4 million net of
accumulated depreciation) in a broad range of capital assets including buildings, land and equipment. Total depreciation expense for the year was $15.9 million. More detailed information about capital assets can be found in Note 7 of the basic financial statements.

Rockford Public Schools, District 205 Management's Discussion and Analysis (Unaudited)
As of and For the Year Ended June 30, 2017
MD&A 11
Debt Administration
The pension liability increased by $21.7 million. At the end of fiscal 2017, the District had a debt margin of $77.7 million. More detailed information about long-term debt can be found in Note 8 of the basic financial statements.
2017 2016 Change
Land $8.6 $6.7 28.4%
Construction in progress 49.1 57.1 -14.0%
Land improvements 9.4 7.1 32.4%
Buildings and building improvements 175.3 142.5 23.0%
Transportation equipment 7.3 6.5 12.3%
Food service equipment 1 1 0.0%
Furniture, fixtures and other equipment 7.1 10.7 -33.6%
Software 1.6 1.2 33.3%
Total $259.4 $232.8 11.4%
Table 3
Capital Assets (net of depreciation)
(in millions of dollars)
Governmental Activities
2017 2016 Change
General obligation and capital appreciation bonds$214.5 $220.4 -2.7%
Net pension liability – IMRF and TRS 82.8 61.1 35.5%
Compensated absences and other 14.2 14.1 0.7%
Total $311.5 $295.6 5.4%
Table 4
Long-Term Debt
(in millions of dollars)
Governmental Activities

Rockford Public Schools, District 205 Management's Discussion and Analysis (Unaudited)
As of and For the Year Ended June 30, 2017
MD&A 12
Factors Bearing on the District’s Future
At the time these financial statements were prepared and audited, the District was unaware of any adverse existing circumstances that could significantly affect its financial health in the future.
Requests for Information
This financial report is designed to provide the District’s citizens, taxpayers, and creditors with a general overview of the District’s finances and to demonstrate the District’s accountability for the money it receives. If you have questions about this report or need additional financial information contact the Business Office:
Nicole Thorn Michelle R. Jahr, CPA Rockford Public Schools, District 205 Rockford Public Schools, District 205 501 7th Street 501 7th Street Rockford, IL 61104 Rockford, IL 61104

Governmental
Activities
ASSETS
Cash and investments 222,552,863$ Receivables (net of allowance for uncollectibles)
Property taxes 71,569,839 Other governmental units 28,956,430 Interest 174,601 Other 852,249
Prepaid items 1,577,775 Capital assets
Land 8,657,520 Construction in progress 49,114,959 Depreciable building, property and equipment, net 201,639,591
Total assets 585,095,827
DEFERRED OUTFLOWS OF RESOURCES
Pension items - IMRF 12,999,058 Pension items - TRS 11,557,353
Total deferred outflows of resources 24,556,411
Total assets and deferred outflows of resources 609,652,238
CURRENT LIABILITIES
Accounts payable 18,652,137 Salaries and wages payable 17,583,705 Other current liabilities 442,506 Due to other governments 1,116,776 Interest payable 1,869,066 Unearned revenue 77,849 Long term liabilities
Due within one year 16,658,820 Due after one year 294,809,043
Total liabilities 351,209,902
DEFERRED INFLOWS OF RESOURCES
Property taxes levied for subsequent years 83,038,107 Pension items - IMRF 1,021,563 Pension items - TRS 513,199
Total deferred inflows of resources 84,572,869
Total liabilities and deferred inflows of resources 435,782,771
ROCKFORD PUBLIC SCHOOLS, DISTRICT #205
ROCKFORD, ILLINOIS
STATEMENT OF NET POSITION
June 30, 2017
(This statement is continued on the following page.)- 4 -

Governmental
Activities
NET POSITION
Net investment in capital assets 91,046,622$ Restricted for
Transportation 18,659,449 Retirement 2,018,794 Debt service 3,969,117 Capital projects 10,697,696 Tort immunity 10,999,667
Unrestricted 36,478,122
TOTAL NET POSITION 173,869,467$
ROCKFORD, ILLINOIS
STATEMENT OF NET POSITION (Continued)
June 30, 2017
ROCKFORD PUBLIC SCHOOLS, DISTRICT #205
See accompanying notes to basic financial statements.- 5 -
Operating Capital
Charges for Grants and Grants and
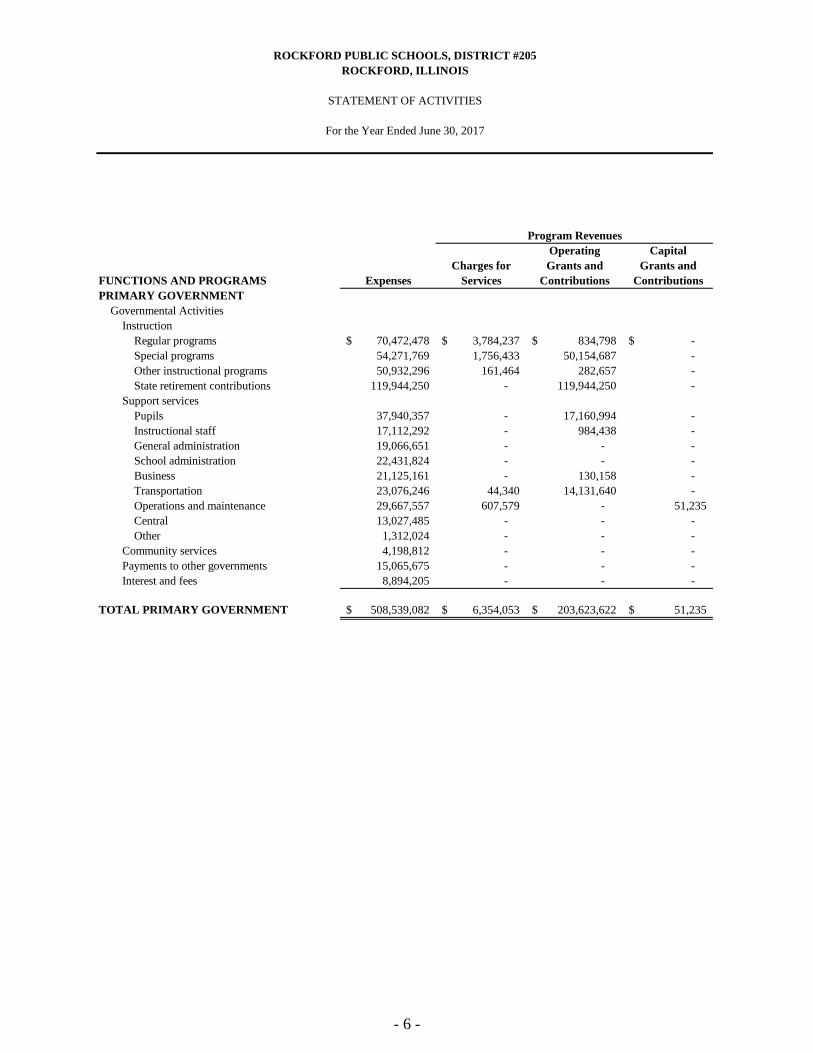
FUNCTIONS AND PROGRAMS Expenses Services Contributions Contributions
PRIMARY GOVERNMENT
Governmental ActivitiesInstruction
Regular programs 70,472,478$ 3,784,237$ 834,798$ -$ Special programs 54,271,769 1,756,433 50,154,687 - Other instructional programs 50,932,296 161,464 282,657 - State retirement contributions 119,944,250 - 119,944,250 -
Support servicesPupils 37,940,357 - 17,160,994 - Instructional staff 17,112,292 - 984,438 - General administration 19,066,651 - - - School administration 22,431,824 - - - Business 21,125,161 - 130,158 - Transportation 23,076,246 44,340 14,131,640 - Operations and maintenance 29,667,557 607,579 - 51,235 Central 13,027,485 - - - Other 1,312,024 - - -
Community services 4,198,812 - - - Payments to other governments 15,065,675 - - - Interest and fees 8,894,205 - - -
TOTAL PRIMARY GOVERNMENT 508,539,082$ 6,354,053$ 203,623,622$ 51,235$
Program Revenues
ROCKFORD PUBLIC SCHOOLS, DISTRICT #205
STATEMENT OF ACTIVITIES
For the Year Ended June 30, 2017
ROCKFORD, ILLINOIS
- 6 -
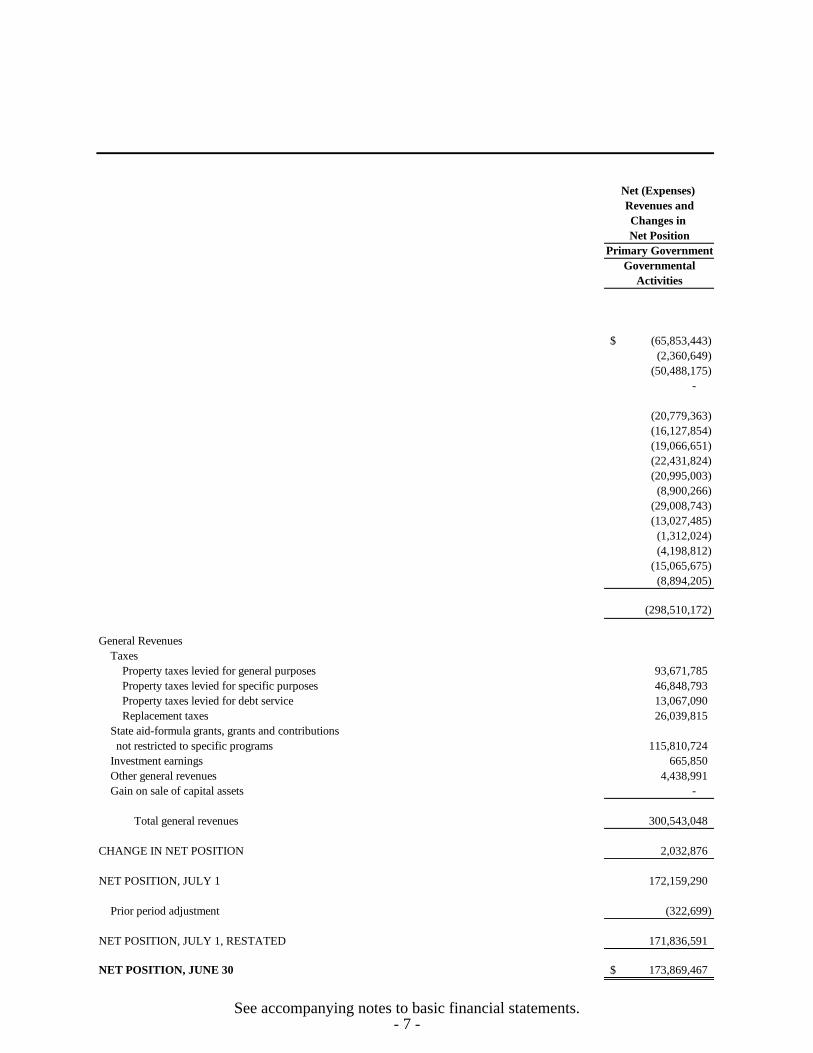
Net (Expenses)
Revenues and
Changes in
Net Position
Primary Government
Governmental
Activities
(65,853,443)$ (2,360,649)
(50,488,175) -
(20,779,363) (16,127,854) (19,066,651) (22,431,824) (20,995,003)
(8,900,266) (29,008,743) (13,027,485)
(1,312,024) (4,198,812)
(15,065,675) (8,894,205)
(298,510,172)
General RevenuesTaxes
Property taxes levied for general purposes 93,671,785 Property taxes levied for specific purposes 46,848,793 Property taxes levied for debt service 13,067,090 Replacement taxes 26,039,815
State aid-formula grants, grants and contributions not restricted to specific programs 115,810,724 Investment earnings 665,850 Other general revenues 4,438,991 Gain on sale of capital assets -
Total general revenues 300,543,048
CHANGE IN NET POSITION 2,032,876
NET POSITION, JULY 1 172,159,290
Prior period adjustment (322,699)
NET POSITION, JULY 1, RESTATED 171,836,591
NET POSITION, JUNE 30 173,869,467$
See accompanying notes to basic financial statements.- 7 -

Bond Nonmajor
Capital and Governmental
General Projects Interest Fund Total
Cash and investments 101,850,140$ 68,936,161$ 10,920,441$ 38,908,028$ 220,614,770$ Receivables
Property taxes, net 44,475,789 - 6,110,519 20,983,531 71,569,839 Other governmental units 22,692,223 - - 6,264,207 28,956,430 Interest 109,890 51,502 - 13,209 174,601 Other 693,665 - - 158,584 852,249
Prepaid items 1,251,072 5,021 - 178,135 1,434,228 Due from other funds 443,284 - - - 443,284
TOTAL ASSETS 171,516,063$ 68,992,684$ 17,030,960$ 66,505,694$ 324,045,401$
LIABILITIES
Accounts payable 7,783,862$ 4,125,381$ -$ 6,742,894$ 18,652,137$ Salaries and wages payable 16,631,426 9,886 - 942,393 17,583,705 Unearned revenue 77,849 - - - 77,849 Due to other governments 1,116,776 - - - 1,116,776 Other current liabilities 408,821 - - 33,685 442,506 Due to other funds - - - 443,284 443,284
Total liabilities 26,018,734 4,135,267 - 8,162,256 38,316,257
DEFERRED INFLOWS OF RESOURCES
Unavailable revenue - property taxes 47,547,973 - 13,061,843 22,428,291 83,038,107 Unavailable revenue - other 4,335,724 - - 3,141,347 7,477,071
Total deferred inflows of resources 51,883,697 - 13,061,843 25,569,638 90,515,178
FUND BALANCES
Nonspendable 1,251,072 5,021 - 178,135 1,434,228 Restricted for
Transportation - - - 18,659,449 18,659,449 Retirement - - - 2,018,794 2,018,794 Debt service - - 3,969,117 - 3,969,117 Capital projects - 64,852,396 - 5,442,202 70,294,598 Tort immunity - - - 10,999,667 10,999,667
Assigned - working cash 32,645,445 - - - 32,645,445 Unassigned 59,717,115 - - (4,524,447) 55,192,668
Total fund balances 93,613,632 64,857,417 3,969,117 32,773,800 195,213,966
TOTAL LIABILITIES, DEFERRED INFLOWS
OF RESOURCES AND FUND BALANCES 171,516,063$ 68,992,684$ 17,030,960$ 66,505,694$ 324,045,401$
ROCKFORD PUBLIC SCHOOLS, DISTRICT #205
ASSETS
LIABILITIES, DEFERRED INFLOWS
OF RESOURCES AND FUND BALANCES
June 30, 2017
GOVERNMENTAL FUNDSBALANCE SHEET
ROCKFORD, ILLINOIS
See accompanying notes to basic financial statements.- 8 -

FUND BALANCES OF GOVERNMENTAL FUNDS 195,213,966$
Amounts reported for governmental activities in the statement of net position are different because:
Net capital assets used in governmental activities and included in the statement of net position do not require the expenditure of financial resources and, therefore, are not reported in the governmental funds balance sheet 259,412,070
Certain revenues receivable by the District and recognized in the statement of net position do not require certain financial resources and are deferred in the governmental funds balance sheet 7,477,071
Net pension liabilities for IMRF and TRS are shown as liabilities on the statement of net position (82,838,335)
Differences between expected and actual experiences, assumptions changes, net differences between projected and actual earnings and contributions subsequent to the measurement date for IMRF and TRS are recognized as deferred outflows and inflows of resources on the statement of net position 23,021,649
Interest on long-term liabilities accrued in the statement of net position will not be paid with current financial resources and, therefore, is not recognized in the governmental funds balance sheet (1,869,066)
Internal service funds are used by management to account for healthcare-related activities. The assets and liabilities are included in the governmental activities on the statement of net position. (1,491,130)
Long-term liabilities applicable to the District's governmental activities are not due and payable in the current period and, accordingly, are not reported as fund liabilities. All liabilities, both current and long-term, are reported in the statement of net position
General obligation bonds (138,780,000) Capital appreciation bonds (74,000,246) Unamortized bond premium and discount (1,716,004) Net other postemployment benefit liability (1,222,373) Claims payable (3,498,895) Early retirement incentive payable (2,003,194) Compensated absences (3,836,046)
NET POSITION OF GOVERNMENTAL ACTIVITIES 173,869,467$
June 30, 2017
ROCKFORD PUBLIC SCHOOLS, DISTRICT #205
RECONCILIATION OF FUND BALANCES OF GOVERNMENTAL FUNDS TO THE GOVERNMENTAL ACTIVITIES IN THE STATEMENT OF NET POSITION
ROCKFORD, ILLINOIS
See accompanying notes to basic financial statements.- 9 -
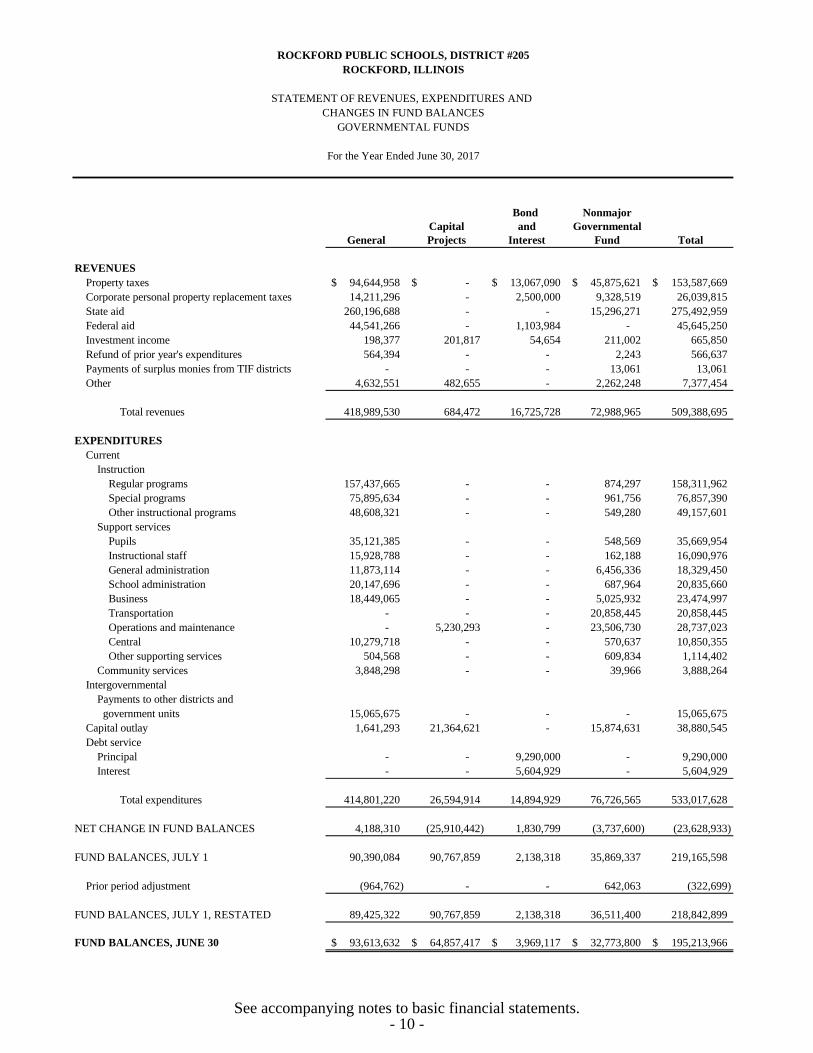
Bond Nonmajor
Capital and Governmental
General Projects Interest Fund Total
REVENUES
Property taxes 94,644,958$ -$ 13,067,090$ 45,875,621$ 153,587,669$ Corporate personal property replacement taxes 14,211,296 - 2,500,000 9,328,519 26,039,815 State aid 260,196,688 - - 15,296,271 275,492,959 Federal aid 44,541,266 - 1,103,984 - 45,645,250 Investment income 198,377 201,817 54,654 211,002 665,850 Refund of prior year's expenditures 564,394 - - 2,243 566,637 Payments of surplus monies from TIF districts - - - 13,061 13,061 Other 4,632,551 482,655 - 2,262,248 7,377,454
Total revenues 418,989,530 684,472 16,725,728 72,988,965 509,388,695
EXPENDITURES
CurrentInstruction
Regular programs 157,437,665 - - 874,297 158,311,962 Special programs 75,895,634 - - 961,756 76,857,390 Other instructional programs 48,608,321 - - 549,280 49,157,601
Support servicesPupils 35,121,385 - - 548,569 35,669,954 Instructional staff 15,928,788 - - 162,188 16,090,976 General administration 11,873,114 - - 6,456,336 18,329,450 School administration 20,147,696 - - 687,964 20,835,660 Business 18,449,065 - - 5,025,932 23,474,997 Transportation - - - 20,858,445 20,858,445 Operations and maintenance - 5,230,293 - 23,506,730 28,737,023 Central 10,279,718 - - 570,637 10,850,355 Other supporting services 504,568 - - 609,834 1,114,402
Community services 3,848,298 - - 39,966 3,888,264 Intergovernmental
Payments to other districts and government units 15,065,675 - - - 15,065,675
Capital outlay 1,641,293 21,364,621 - 15,874,631 38,880,545 Debt service
Principal - - 9,290,000 - 9,290,000 Interest - - 5,604,929 - 5,604,929
Total expenditures 414,801,220 26,594,914 14,894,929 76,726,565 533,017,628
NET CHANGE IN FUND BALANCES 4,188,310 (25,910,442) 1,830,799 (3,737,600) (23,628,933)
FUND BALANCES, JULY 1 90,390,084 90,767,859 2,138,318 35,869,337 219,165,598
Prior period adjustment (964,762) - - 642,063 (322,699)
FUND BALANCES, JULY 1, RESTATED 89,425,322 90,767,859 2,138,318 36,511,400 218,842,899
FUND BALANCES, JUNE 30 93,613,632$ 64,857,417$ 3,969,117$ 32,773,800$ 195,213,966$
ROCKFORD PUBLIC SCHOOLS, DISTRICT #205
For the Year Ended June 30, 2017
GOVERNMENTAL FUNDSCHANGES IN FUND BALANCES
STATEMENT OF REVENUES, EXPENDITURES AND
ROCKFORD, ILLINOIS
See accompanying notes to basic financial statements.- 10 -

NET CHANGE IN FUND BALANCES - TOTAL GOVERNMENTAL FUNDS (23,628,933)$
Amounts reported for governmental activities in the statement of activities are different because:
Governmental funds report capital outlay as expenditures; however, they are capitalized and depreciated in the statement of activities. 42,481,936
Depreciation expense does not require the use of current financial resources and, therefore, is not reported as an expenditure in governmental funds. (15,871,516)
The change in deferred inflows and outflows of resources for IMRF and TRS is reported only in the statement of activities. 14,601,520
Certain revenue included in the statement of activities does not provide current financial resources and, therefore, is deferred in the governmental fund statements. 1,183,263
The amortization of the accounting loss on refunding on long-term debt is reported as an increase in interest expense on the statement of activities. (33,503)
The accretion of long-term debt provides current financial resources to the governmental funds, while principal repayment consumes current financial resources of the governmental funds. Neither transaction, however, has any effect on net position. This is the amount by which current year principal payments exceeded accretion on bonds payable. 5,809,606 Governmental funds report the effects of premium, discounts and similar items when the debt is issued. However, these amounts are deferred and amortized in the statement of activities. This is the amount of the current year, net of these differences. 101,445
In the statement of activities, operating expenses are measured by the amounts incurred during the current year. However, certain of these items are included in the governmental funds only to the extent that they require the expenditure of current financial resources.
Interest payable 123,176 Net other postemployment benefit liability 122,950 Claims payable 200,172 Early retirement payable (61,829) Compensated absences 230,175 Net pension liability - IMRF 1,833,129 Net pension liability - TRS (23,567,585)
The addition (reduction) in net position of certain activities of internal service funds is included in governmental funds (1,491,130)
CHANGE IN NET POSITION OF GOVERNMENTAL ACTIVITIES 2,032,876$
ROCKFORD PUBLIC SCHOOLS, DISTRICT #205
RECONCILIATION OF THE GOVERNMENTAL FUNDS STATEMENT OF REVENUES, EXPENDITURES AND CHANGES IN FUND BALANCES
TO THE STATEMENT OF ACTIVITIES
For the Year Ended June 30, 2017
ROCKFORD, ILLINOIS
See accompanying notes to basic financial statements.- 11 -

Internal
Service
Fund
ASSETS
Cash and investments 1,938,093$ Prepaid items 143,547
Total assets 2,081,640
LIABILITIES
Claims payable 3,572,770
Total liabilities 3,572,770
NET POSITION
Unrestricted (1,491,130)
TOTAL NET POSITION (1,491,130)$
ROCKFORD PUBLIC SCHOOLS, DISTRICT #205
ROCKFORD, ILLINOIS
STATEMENT OF NET POSITIONPROPRIETARY FUNDS
June 30, 2017
See accompanying notes to basic financial statements.- 12 -
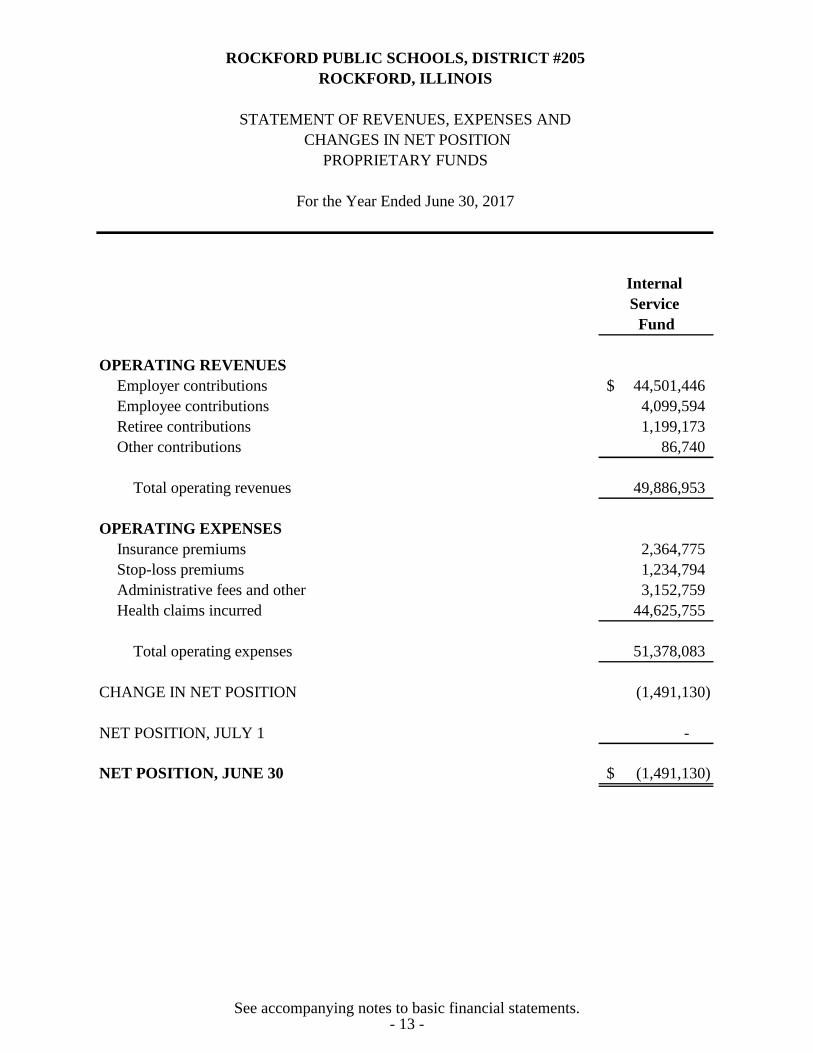
Internal
Service
Fund
OPERATING REVENUES
Employer contributions 44,501,446$ Employee contributions 4,099,594 Retiree contributions 1,199,173 Other contributions 86,740
Total operating revenues 49,886,953
OPERATING EXPENSES
Insurance premiums 2,364,775 Stop-loss premiums 1,234,794 Administrative fees and other 3,152,759 Health claims incurred 44,625,755
Total operating expenses 51,378,083
CHANGE IN NET POSITION (1,491,130)
NET POSITION, JULY 1 -
NET POSITION, JUNE 30 (1,491,130)$
For the Year Ended June 30, 2017
ROCKFORD PUBLIC SCHOOLS, DISTRICT #205
ROCKFORD, ILLINOIS
STATEMENT OF REVENUES, EXPENSES AND CHANGES IN NET POSITION
PROPRIETARY FUNDS
See accompanying notes to basic financial statements.- 13 -
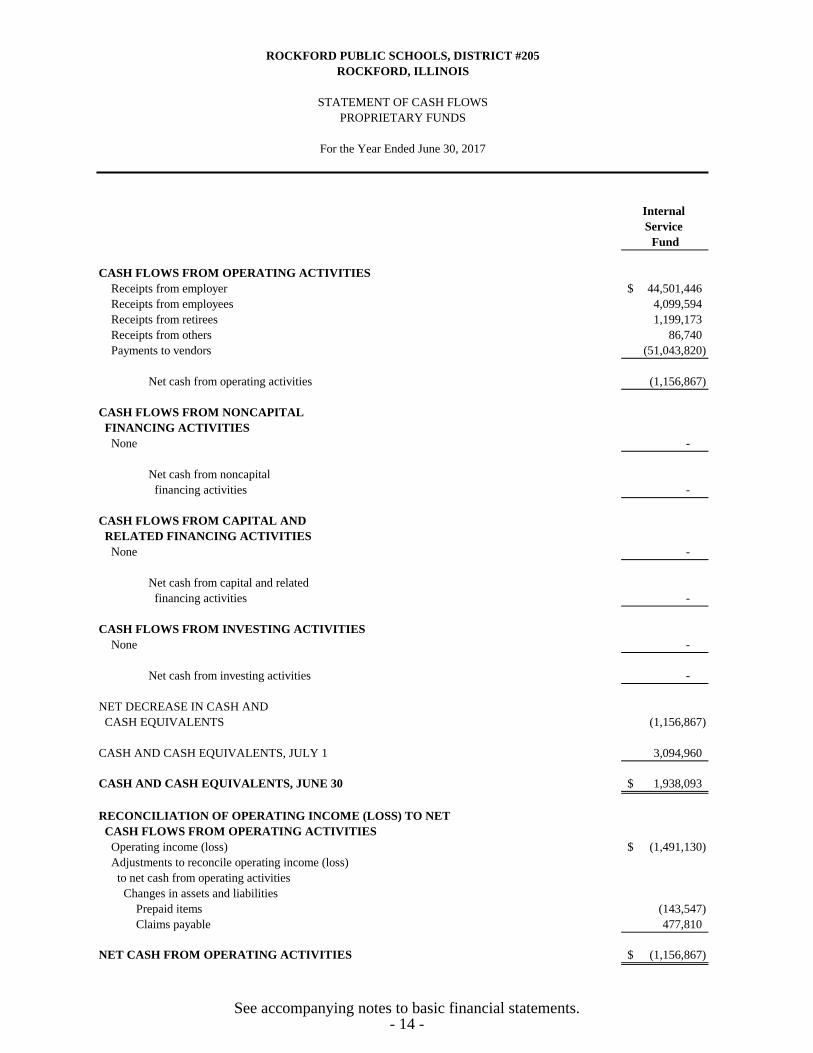
Internal
Service
Fund
CASH FLOWS FROM OPERATING ACTIVITIES
Receipts from employer 44,501,446$ Receipts from employees 4,099,594 Receipts from retirees 1,199,173 Receipts from others 86,740 Payments to vendors (51,043,820)
Net cash from operating activities (1,156,867)
CASH FLOWS FROM NONCAPITAL
FINANCING ACTIVITIES
None -
Net cash from noncapital financing activities -
CASH FLOWS FROM CAPITAL AND
RELATED FINANCING ACTIVITIES
None -
Net cash from capital and related financing activities -
CASH FLOWS FROM INVESTING ACTIVITIES
None -
Net cash from investing activities -
NET DECREASE IN CASH AND CASH EQUIVALENTS (1,156,867)
CASH AND CASH EQUIVALENTS, JULY 1 3,094,960
CASH AND CASH EQUIVALENTS, JUNE 30 1,938,093$
RECONCILIATION OF OPERATING INCOME (LOSS) TO NET
CASH FLOWS FROM OPERATING ACTIVITIES
Operating income (loss) (1,491,130)$ Adjustments to reconcile operating income (loss) to net cash from operating activities
Changes in assets and liabilitiesPrepaid items (143,547) Claims payable 477,810
NET CASH FROM OPERATING ACTIVITIES (1,156,867)$
ROCKFORD PUBLIC SCHOOLS, DISTRICT #205
ROCKFORD, ILLINOIS
STATEMENT OF CASH FLOWSPROPRIETARY FUNDS
For the Year Ended June 30, 2017
See accompanying notes to basic financial statements.- 14 -

Student
Activity Fund
ASSETS
Cash and investments 1,562,459$
TOTAL ASSETS 1,562,459$
LIABILITIES
Due to students groups 1,562,459$
TOTAL LIABILITIES 1,562,459$
ROCKFORD PUBLIC SCHOOLS, DISTRICT #205
ROCKFORD, ILLINOIS
AGENCY FUNDSTATEMENT OF FIDUCIARY ASSETS AND LIABILITIES
June 30, 2017
See accompanying notes to basic financial statements.- 15 -

- 30 -
ROCKFORD PUBLIC SCHOOLS, DISTRICT #205
ROCKFORD, ILLINOIS
NOTES TO FINANCIAL STATEMENTS
June 30, 2017
1. SUMMARY OF SIGNIFICANT ACCOUNTING POLICIES
Rockford Public Schools, District #205 (the District) operates a public school system
governed by a seven-member elected board. The District is organized under the School Code of the State of Illinois, as amended. The accounting policies of the District conform to the accounting principles generally accepted in the United States of America, as applicable to local governmental units of this type. The following is a summary of the more significant accounting policies of the District.
a. Reporting Entity
Accounting principles generally accepted in the United States of America require that the financial reporting entity include (1) the primary government, (2) organizations for which the primary district is financially accountable and (3) other organizations for which the nature and significance of their relationship with the primary government are such that exclusion would cause the reporting entity’s
financial statements to be misleading or incomplete. The criteria provided by governmental accounting standards have been considered and there are no agencies or entities which should be presented with the District.
b. Basis of Presentation Government-Wide Financial Statements The government-wide financial statements (i.e., the statement of net position and the
statement of activities) report information on all of the nonfiduciary activities of the District. The effect of interfund activity has been eliminated from these statements. The District’s operating activities related to education are considered “governmental activities,” that is, activities normally supported by taxes and intergovernmental revenues. Business-type activities are financed as a whole or in part by fees charged to external parties.
The statement of activities demonstrates the degree to which the direct expenses of a
given function are offset by program revenues. Direct expenses are those that are clearly identifiable with a specific function. Program revenues include (1) amounts paid by the recipient of goods or services by the program and (2) grants and contributions that are restricted to meeting the operational or capital requirements of a particular function. Taxes and other items not properly included among program revenues are reported instead as general revenues.
- 16 -

ROCKFORD PUBLIC SCHOOLS, DISTRICT #205
ROCKFORD, ILLINOIS
NOTES TO FINANCIAL STATEMENTS (Continued)
- 31 -
1. SUMMARY OF SIGNIFICANT ACCOUNTING POLICIES (Continued)
b. Basis of Presentation (Continued) Fund Financial Statements Governmental funds financial statements are organized and operated on the basis of
funds and are used to account for the District’s general governmental activities. Fund accounting segregates funds according to their intended purpose and is used to aid management in demonstrating compliance with finance related legal and contractual provisions. A fund is an independent fiscal and accounting entity with a self-balancing set of accounts that comprise its assets, liabilities, fund balance, revenues and expenditures. The minimum number of funds is maintained consistent with legal and managerial requirements.
Governmental funds are used to account for all or most of the District’s general
activities, including the collection and disbursement of restricted or committed monies (special revenue funds), the funds committed, restricted or assigned for the acquisition or construction of capital assets (capital projects funds), the funds committed, restricted or assigned for the servicing of long-term debt (debt service funds) and the management of funds held in trust where the interest earnings can be used for governmental services (permanent fund). The General Fund is used to account for all activities of the general government not accounted for in some other fund.
Proprietary funds are used to account for activities similar to those found in the
private sector, where the determination of net income is necessary or useful to sound financial administration.
Fiduciary funds are used to account for assets held on behalf of outside parties,
including other governments. The District’s fiduciary funds consist of agency funds which are used to account for assets that the District holds on behalf of others as their agent.
Separate financial statements are provided for governmental funds and fiduciary
funds. The fiduciary funds are excluded from the government-wide financial statements.
c. Measurement Focus, Basis of Accounting and Financial Statement Presentation
The government-wide financial statements are prepared using the economic resources measurement focus, while the fiduciary fund statements do not have a measurement focus. The government-wide financial statements and the fiduciary
- 17 -

ROCKFORD PUBLIC SCHOOLS, DISTRICT #205
ROCKFORD, ILLINOIS
NOTES TO FINANCIAL STATEMENTS (Continued)
- 32 -
1. SUMMARY OF SIGNIFICANT ACCOUNTING POLICIES (Continued)
c. Measurement Focus, Basis of Accounting and Financial Statement Presentation (Continued) fund financial statements are reported using the accrual basis of accounting.
Revenues are recorded when earned and expenses are recorded when a liability is incurred, regardless of the timing of related cash flows. Property taxes are recognized as revenues in the year for which they are levied (i.e., intended to finance). Grants and similar items are recognized as revenue as soon as all eligibility requirements imposed by the provider have been met.
Governmental fund financial statements are reported using the current financial
resources measurement focus and the modified accrual basis of accounting. Revenues are recognized when they are both measurable and available. “Measurable” means the
amount of the transaction can be determined and “available” means collectible within
the current period or soon enough thereafter to be used to pay liabilities of the current period. For this purpose, the District considers property taxes available if they are collected within 60 days after year end. Property taxes, allotments of state and federal aid, and interest on investments are susceptible to accrual. Other receipts become measurable and available when cash is received by the District and recognized as revenue at that time. Grant funds are considered to be earned to the extent of expenditures made under the provisions of the grant. Accordingly, when such funds are received, they are recorded as unearned revenue until earned. Expenditures are recorded when the related fund liability is incurred. However, expenditures for unmatured principal and interest on general long-term debt are recognized when due.
The District reports unearned and unavailable/deferred revenue on its financial
statements. Unavailable revenues arise when potential revenue does not meet the available criteria for recognition in the current period for governmental funds. Unearned revenues also arise when resources are received by the District before it has legal claim to them as when grant monies are received prior to the incurrence of qualifying expenditures. In subsequent periods, when revenue recognition criteria are met, or when the District has a legal claim to the resources by meeting all eligibility requirements, the liability for unearned revenue is removed from the financial statements and revenue is recognized. Unavailable/deferred revenue results from property taxes being levied and reported as a receivable before the period for which the taxes are levied.
The agency fund has no measurement focus but utilizes the accrual basis of
accounting for reporting its assets and liabilities.
- 18 -

ROCKFORD PUBLIC SCHOOLS, DISTRICT #205
ROCKFORD, ILLINOIS
NOTES TO FINANCIAL STATEMENTS (Continued)
- 33 -
1. SUMMARY OF SIGNIFICANT ACCOUNTING POLICIES (Continued) c. Measurement Focus, Basis of Accounting and Financial Statement Presentation (Continued) Major Governmental Funds The District reports the following major governmental funds: General Fund - is the general operating fund of the District. It accounts for all
financial resources of the general government except those accounted for in another fund. The fund is primarily used for most of the instructional and administrative aspects of the District’s operations. Revenues consist largely of local property taxes and state government aid.
Capital Projects Funds - accounts for financial resources that are restricted,
committed or assigned to be used for the acquisition or construction of, and/or additions to, major capital facilities.
Bond and Interest Fund - accounts for the resources, the use of which is
restricted by the Illinois School Code for the payment of principal and interest on long-term general obligation/capital appreciation debt of the governmental funds. The District elected to report this fund as a major fund.
Proprietary Fund Type The District reports the following internal service fund: The Insurance Fund accounts for the District’s self-insured health plan for
employees and other employee benefits, funded by charges to the various departments of the District and by employee and retiree contributions.
Fiduciary Fund - accounts for assets held by the District in a trustee capacity or as an
agent for individuals, private organizations, other governments or other funds. Agency Funds - include Student Activity, Convenience Accounts and Other
Agency Funds. These funds are custodial in nature and do not present results of operations or have a measurement focus. Although the Board of Education has the ultimate responsibility for Activity Funds, they are not local education agency funds. Student Activity Funds account for assets held by the District which are owned, operated and managed generally by the student body, under the guidance and direction of adults or a staff member, for educational, recreational or cultural purposes. Convenience Accounts account for assets that are normally maintained by a local education agency as a convenience for its faculty, staff, etc.
- 19 -

ROCKFORD PUBLIC SCHOOLS, DISTRICT #205
ROCKFORD, ILLINOIS
NOTES TO FINANCIAL STATEMENTS (Continued)
- 34 -
1. SUMMARY OF SIGNIFICANT ACCOUNTING POLICIES (Continued) c. Measurement Focus, Basis of Accounting and Financial Statement Presentation (Continued)
On-behalf payments (payments made by a third party for the benefit of the District, such as payments made by the Teacher Health Insurance Security) have been recognized in the financial statements.
d. Cash and Cash Equivalents The District considers all highly liquid investments with an initial maturity of three
months or less when acquired to be cash equivalents. e. Investments State statutes authorize the District to invest in obligations of the U.S. Treasury,
certain highly rated commercial paper, repurchase agreements and the State Treasurer’s Investment Pool. Investments are stated at fair value. Changes in fair value of investments are included as investment income.
f. Property Taxes The District must file its tax levy resolution by the last Tuesday in December of each
year. The District’s 2016 levy resolution was approved during the October 11, 2016 board meeting. The District’s property tax is levied each year on all taxable real property located in the District and it becomes a lien on the property on January 1 of that year. The owner of real property on January 1 in any year is liable for taxes of that year.
The tax rate ceilings are applied at certain levies. These ceilings are established by
state law subject to change only by the approval of the voters of the District. The PTELL limitation is applied in the aggregate to the total levy (excluding certain
levies for the repayment of debt). PTELL limits the increase in total taxes billed to the lessor of 5% of the percentage increase in the Consumer Price Index (CPI) for the preceding year. The amount can be exceeded to the extent there is “new growth” in the District’s tax base. The new growth consists of new construction, annexations and tax increment finance district property becoming eligible for taxation. The CPI rates applicable to the 2016 and 2015 tax levies were 2.1% and 0.7%, respectively.
- 20 -

ROCKFORD PUBLIC SCHOOLS, DISTRICT #205
ROCKFORD, ILLINOIS
NOTES TO FINANCIAL STATEMENTS (Continued)
- 35 -
1. SUMMARY OF SIGNIFICANT ACCOUNTING POLICIES (Continued)
f. Property Taxes (Continued) Property taxes are collected by the County Collector/Treasurer, who remits to the
District its share of collections. Taxes levied in one year became due and payable in two equal installments: the first due on June 1 and the second due on September 1. Property taxes are normally collected by the District within 60 days of the respective installment dates.
The 2016 property tax levy is recognized as a receivable in fiscal year 2017, net of
estimated uncollectible amounts approximating 1%. The District considers that the first installment of the 2016 levy is used to finance operations in fiscal year 2017. The District has determined that the second installment of the 2016 levy is used to finance operations in fiscal year 2018 and has deferred the corresponding receivable.
The 2017 tax levy, which attached as an enforceable lien on property as of January 1,
2017, has not been recorded as a receivable as of June 30, 2017 as the tax has not yet been levied by the District and will not be levied until December 2017 and, therefore, the levy is not measurable at June 30, 2017.
g. Personal Property Replacement Taxes
Personal property replacement taxes are first allocated to the Municipal Retirement/Social Security Fund and the balance is allocated to the remaining funds at the discretion of the District.
h. Prepaid Items/Expenses Payments made to vendors for services that will benefit periods beyond the date of
this report are recorded as prepaid items/expenses and are accounted for using the consumption method.
i. Capital Assets Capital assets are defined as assets with an initial cost of $500 for electronic
equipment and $1,000 for all other assets with an estimated useful life greater than one year. Capital assets are recorded at cost or estimated historical cost and depreciated over their estimated useful lives (excluding salvage value). Donated capital assets are recorded at acquisition value at the date of donation. Land and construction in progress are not depreciated by the District.
- 21 -

ROCKFORD PUBLIC SCHOOLS, DISTRICT #205
ROCKFORD, ILLINOIS
NOTES TO FINANCIAL STATEMENTS (Continued)
- 36 -
1. SUMMARY OF SIGNIFICANT ACCOUNTING POLICIES (Continued) i. Capital Assets (Continued) Depreciation of capital assets is provided using the straight-line method over the
following estimated useful lives:
Assets Years Buildings and building improvements 20-50 Transportation equipment 5-20 Food service equipment 3-10 Furniture, fixtures and other equipment 3-10 Software 10-15
In the fund financial statements, capital assets used in governmental fund operations
are accounted for as capital outlay expenditures of the governmental fund upon acquisition.
j. Compensated Absences Under terms of employment, employees are granted sick leave and vacations in
varying amounts. Only benefits considered to be vested are disclosed in these statements.
All vested vacation and sick leave pay is accrued when incurred in the
government-wide and proprietary fund financial statements. A liability for these amounts is reported in the governmental funds only if they have matured, for example, as a result of employee resignations and retirements, or are payable with expendable available resources.
Payments for vacation and sick leave will be made at rates in effect when the
benefits are used. Accumulated vacation and sick leave liabilities at June 30 are determined on the basis of current salary rates and include salary related payments.
Certified employees working less than 12 months a year do not earn vacation days;
however, noncertified full-time employees earn vacation days which vest as they accrue.
All full-time employees receive various numbers of sick and personal days per year
based on the collective bargaining agreements or policies in place. These days may accumulate to an unlimited number of days. These accumulated sick days may be paid in cash or may be applied to earn additional years of service under the retirement plans. The District has not recognized a fund liability in the governmental funds for the vested amount. However, this liability is recorded in the government-wide financial statements. Sick and personal days are reported as an expense and liability as it accrues in the government-wide financial statements.
- 22 -

ROCKFORD PUBLIC SCHOOLS, DISTRICT #205
ROCKFORD, ILLINOIS
NOTES TO FINANCIAL STATEMENTS (Continued)
- 37 -
1. SUMMARY OF SIGNIFICANT ACCOUNTING POLICIES (Continued) k. Long-Term Liabilities In the government-wide financial statements long-term debt and other long-term
obligations are reported as liabilities. Bond premiums and discounts, as well as deferred amounts on refunding, are deferred and amortized over the life of the bond. Bonds payable are reported net of the applicable bond premium or discount. Issuance costs are recognized during the current period.
In the fund financial statements, governmental funds recognize bond premiums and
discounts during the current period. The face amount of debt is reported as other financing sources. Premiums received on debt issuances are reported as other financing sources while discounts on debt issuances are reported as other financing uses. Issuance costs, whether or not withheld from the actual debt proceeds received, are reported as debt service expenditures.
l. Equity Classifications Equity is classified as net position in the government-wide financial statements and
displayed in three components: Net investment in capital assets - Consists of capital assets including restricted
capital assets, net of accumulated depreciation and reduced by the outstanding balances of any bonds, mortgages, notes or other borrowings that are attributable to the acquisition, construction or improvement of those assets less any unspent bond proceeds.
Restricted net position - Consists of net position with constraints placed on it use
either (1) external groups such as creditors, grantors, contributors or laws or regulations of other governments or (2) law through constitutional provisions or enabling legislation.
Unrestricted net position - All other net position that does not meet the definition
of “restricted” or “net investment in capital assets.” None of the restricted net position or restricted fund balance results from enabling
legislation. When both restricted and unrestricted resources are available for use, it is the District’s
policy to use restricted resources first and then unrestricted resources. Equity is classified as fund balance in the fund financial statements and displayed in
five components.
- 23 -
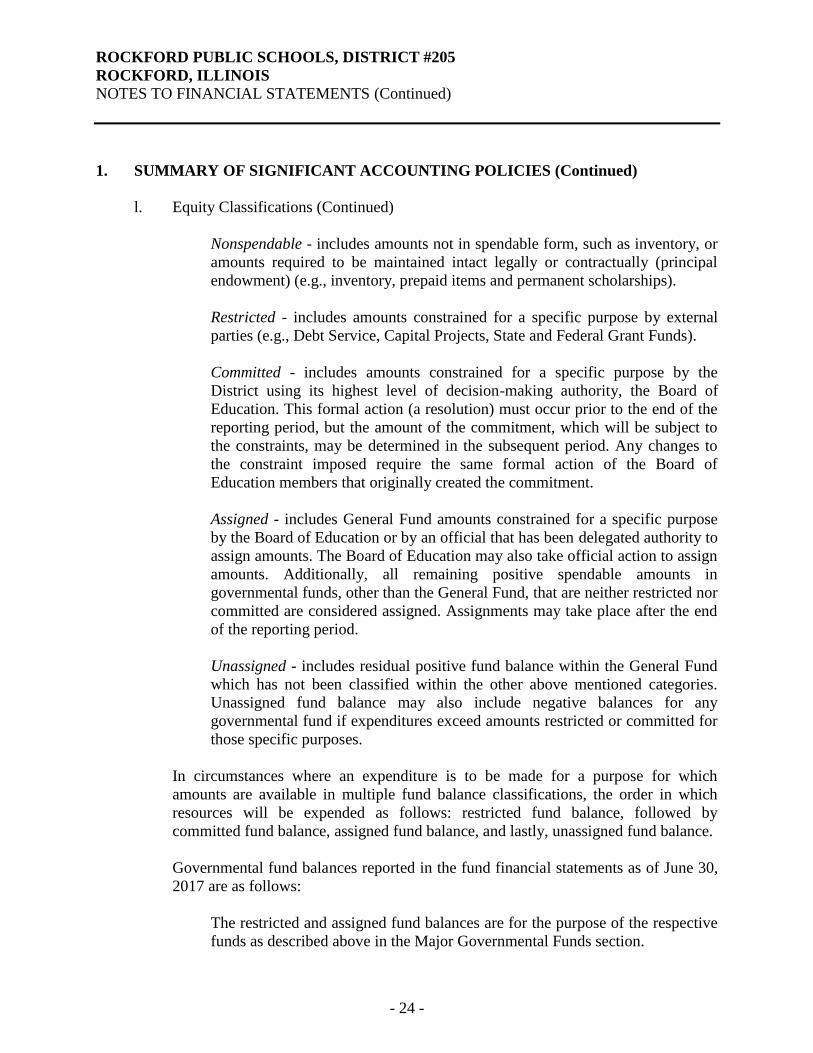
ROCKFORD PUBLIC SCHOOLS, DISTRICT #205
ROCKFORD, ILLINOIS
NOTES TO FINANCIAL STATEMENTS (Continued)
- 38 -
1. SUMMARY OF SIGNIFICANT ACCOUNTING POLICIES (Continued)
l. Equity Classifications (Continued) Nonspendable - includes amounts not in spendable form, such as inventory, or
amounts required to be maintained intact legally or contractually (principal endowment) (e.g., inventory, prepaid items and permanent scholarships).
Restricted - includes amounts constrained for a specific purpose by external
parties (e.g., Debt Service, Capital Projects, State and Federal Grant Funds). Committed - includes amounts constrained for a specific purpose by the
District using its highest level of decision-making authority, the Board of Education. This formal action (a resolution) must occur prior to the end of the reporting period, but the amount of the commitment, which will be subject to the constraints, may be determined in the subsequent period. Any changes to the constraint imposed require the same formal action of the Board of Education members that originally created the commitment.
Assigned - includes General Fund amounts constrained for a specific purpose
by the Board of Education or by an official that has been delegated authority to assign amounts. The Board of Education may also take official action to assign amounts. Additionally, all remaining positive spendable amounts in governmental funds, other than the General Fund, that are neither restricted nor committed are considered assigned. Assignments may take place after the end of the reporting period.
Unassigned - includes residual positive fund balance within the General Fund which has not been classified within the other above mentioned categories. Unassigned fund balance may also include negative balances for any governmental fund if expenditures exceed amounts restricted or committed for those specific purposes.
In circumstances where an expenditure is to be made for a purpose for which
amounts are available in multiple fund balance classifications, the order in which resources will be expended as follows: restricted fund balance, followed by committed fund balance, assigned fund balance, and lastly, unassigned fund balance.
Governmental fund balances reported in the fund financial statements as of June 30,
2017 are as follows: The restricted and assigned fund balances are for the purpose of the respective
funds as described above in the Major Governmental Funds section.
- 24 -

ROCKFORD PUBLIC SCHOOLS, DISTRICT #205
ROCKFORD, ILLINOIS
NOTES TO FINANCIAL STATEMENTS (Continued)
- 39 -
1. SUMMARY OF SIGNIFICANT ACCOUNTING POLICIES (Continued) l. Equity Classifications (Continued) The District has adopted a minimum fund balance policy. For purposes of this
policy, fund balance has been defined as the total fund balances of the General, Operations and Maintenance and Transportation Funds. The District targets a fund balance percentage of not less than 25% of operating expenses (in those funds) measured on June 30th each year.
m. Interfund Receivables/Payables Activity between funds that are representative of lending/borrowing arrangements
outstanding at the end of the fiscal year are referred to as either “due to/from other fund” and are expected to be repaid within one year. These amounts are eliminated in the statement of net position.
n. Deferred Outflows/Inflows of Resources In addition to assets, the statement of net position/balance sheet will sometimes
report a separate section for deferred outflows of resources. This separate financial statement element, deferred outflows of resources, represents a consumption of net assets that applies to a future period(s) and so will not be recognized as an outflow of resources (expense/expenditure) until then. In addition to liabilities, the statement of net position/balance sheet will sometimes report a separate section for deferred inflows of resources. This separate financial statement element, deferred inflows of resources, represents an acquisition of net assets that applies to a future period(s) and so will not be recognized as an inflow of resources (revenue) until that time.
o. Use of Estimates The preparation of financial statements in conformity with the generally accepted
accounting principles requires management to make estimates and assumptions that affect the reported amounts of assets, deferred outflows, liabilities, deferred inflows and disclosure of contingent assets and liabilities at the date of the financial statements and the reported amounts of revenues and expenditures/expenses during the reporting period. Actual results may differ from those estimates.
2. DEPOSITS AND INVESTMENTS At year end, the District’s cash and investments was comprised of the following:
Governmental Agency Total Cash and investments $ 222,552,863 $ 1,562,459 $ 224,115,322 TOTAL $ 225,552,863 $ 1,562,459 $ 224,115,322
- 25 -
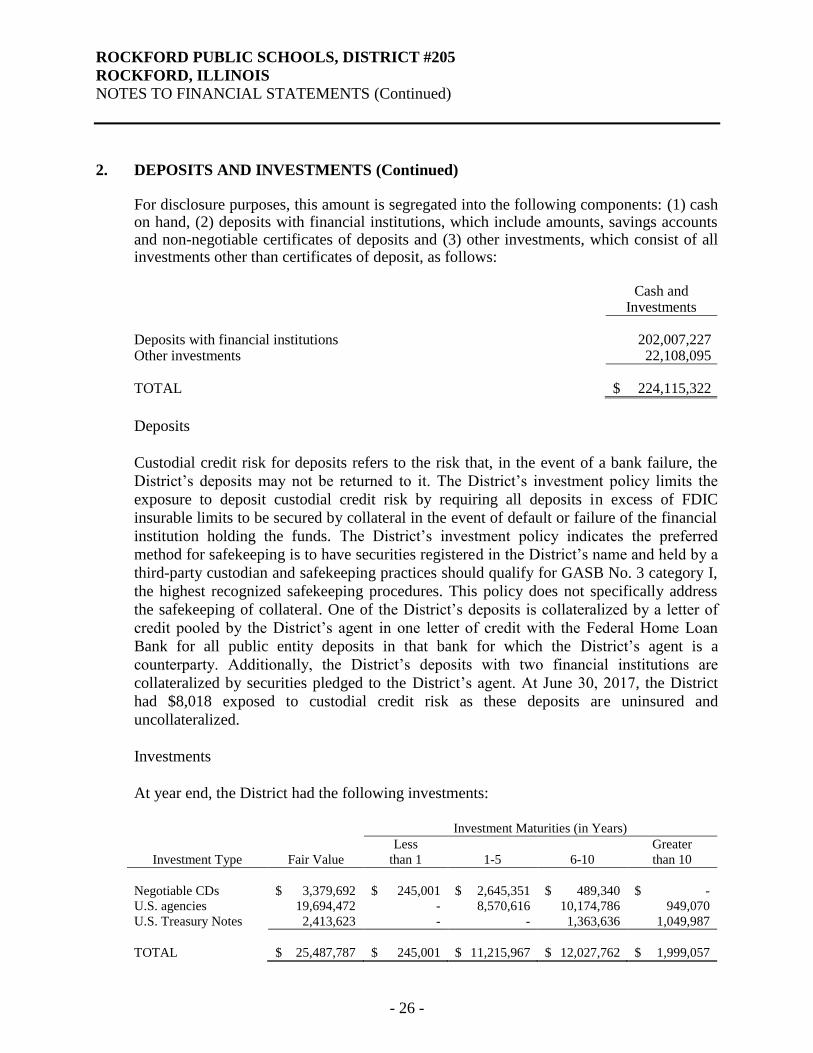
ROCKFORD PUBLIC SCHOOLS, DISTRICT #205
ROCKFORD, ILLINOIS
NOTES TO FINANCIAL STATEMENTS (Continued)
- 40 -
2. DEPOSITS AND INVESTMENTS (Continued) For disclosure purposes, this amount is segregated into the following components: (1) cash
on hand, (2) deposits with financial institutions, which include amounts, savings accounts and non-negotiable certificates of deposits and (3) other investments, which consist of all investments other than certificates of deposit, as follows:
Cash and
Investments Deposits with financial institutions 202,007,227 Other investments 22,108,095 TOTAL $ 224,115,322
Deposits Custodial credit risk for deposits refers to the risk that, in the event of a bank failure, the
District’s deposits may not be returned to it. The District’s investment policy limits the
exposure to deposit custodial credit risk by requiring all deposits in excess of FDIC insurable limits to be secured by collateral in the event of default or failure of the financial institution holding the funds. The District’s investment policy indicates the preferred
method for safekeeping is to have securities registered in the District’s name and held by a
third-party custodian and safekeeping practices should qualify for GASB No. 3 category I, the highest recognized safekeeping procedures. This policy does not specifically address the safekeeping of collateral. One of the District’s deposits is collateralized by a letter of
credit pooled by the District’s agent in one letter of credit with the Federal Home Loan
Bank for all public entity deposits in that bank for which the District’s agent is a counterparty. Additionally, the District’s deposits with two financial institutions are
collateralized by securities pledged to the District’s agent. At June 30, 2017, the District had $8,018 exposed to custodial credit risk as these deposits are uninsured and uncollateralized.
Investments At year end, the District had the following investments:
Investment Maturities (in Years)
Investment Type Fair Value Less
than 1 1-5 6-10 Greater than 10
Negotiable CDs $ 3,379,692 $ 245,001 $ 2,645,351 $ 489,340 $ - U.S. agencies 19,694,472 - 8,570,616 10,174,786 949,070 U.S. Treasury Notes 2,413,623 - - 1,363,636 1,049,987 TOTAL $ 25,487,787 $ 245,001 $ 11,215,967 $ 12,027,762 $ 1,999,057
- 26 -

ROCKFORD PUBLIC SCHOOLS, DISTRICT #205
ROCKFORD, ILLINOIS
NOTES TO FINANCIAL STATEMENTS (Continued)
- 41 -
2. DEPOSITS AND INVESTMENTS (Continued) Investments (Continued) The District categorizes its fair value measurements within the fair value hierarchy
established by generally accepted accounting principles. The hierarchy is based on the valuation inputs used to measure the fair value of the asset. Level 1 inputs are quoted prices in active markets for identical assets; Level 2 inputs are significant other observable input; and Level 3 inputs are significant unobservable inputs.
The District has the following recurring fair value measurements as of June 30, 2017: U.S. agency securities, U.S. Treasury notes, and Negotiable certificates of deposit of are valued using significant other observable outputs and are part of a limited secondary market (Level 2 inputs).
Interest rate risk is the risk that changes in interest rates will adversely affect the value of an investment. The District’s investment policy limits the maturities on its investment portfolio as follows:
a. Repurchase agreements must mature in less than 330 days, and b. Short-term obligations of corporations must mature not later than 270 days
from the date of purchase. The District’s investment policy does not further limit the District’s investment portfolio to
specific maturities. Custodial credit risk for investments is the risk that, in the event of the failure of the
counterparty, the government will not be able to recover the value of its investments or collateral securities that are in the possession of an outside party. The District’s investment policy does not address custodial credit risk for investments. The District is exposed to custodial credit risk as its investments in U.S. agency securities and U.S. Treasury notes are held by the counterparties, not in the District’s name.
Credit risk is the risk that an issuer or other counterparty to an investment will not fulfill its
obligations. State statutes limits the investments in commercial paper to the top three ratings of two nationally recognized statistical rating organizations (NRSRO’s). As of June 30, 2017, the District’s investments in money market accounts and negotiable CDs are not rated. The United States Government agency securities are rated AA+ by Standard & Poor’s at June 30, 2017.
The District is authorized to invest in the Illinois School District Liquid Asset Fund Plus
and Illinois Funds, which invest member deposits, on a pooled basis, primarily in short-term certificates of deposit and in high rated short-term obligations of the U.S. Treasury and major United States corporations and banks. Illinois Funds were created and are regulated by the Illinois General Assembly and the fair value of the positions in the
- 27 -

ROCKFORD PUBLIC SCHOOLS, DISTRICT #205
ROCKFORD, ILLINOIS
NOTES TO FINANCIAL STATEMENTS (Continued)
- 42 -
2. DEPOSITS AND INVESTMENTS (Continued) Investments (Continued) pools is the same as the value of the pool shares. The credit rating provided by Standard &
Poor’s of the Illinois School District Liquid Asset Fund Plus and Illinois Funds was AAAm at June 30, 2017.
Cash held in the Illinois Funds Money Market Fund and the Illinois School District Liquid
Asset Fund Plus is not subject to custodial credit risk categorization. Concentration of credit risk is the risk of loss attributed to the magnitude of a
government’s investment in a single issuer. The District’s investment policy limits the amount that the District may invest in short-term obligations of corporations to no more than one-third of the District’s funds. There are no further limits on the amounts that may be invested in one issuer.
Separate cash and investment accounts are not maintained for all district funds; instead, the
individual fund maintain their invested and uninvested balances in the common checking and investment accounts, with accounting records being maintained to show the portion of the common account balance attributable to each participating fund.
Investment income earned is assigned to each of the governmental funds. Occasionally certain funds participating in the common bank accounts will incur overdrafts
(deficits) in the account. The overdrafts result from expenditures that have been approved by the Board of Education.
3. STEWARDSHIP, COMPLIANCE AND ACCOUNTABILITY Deficit Fund Equity
The Operations and Maintenance Fund had a deficit fund balance of $4,498,585 as of June 30, 2017. District management expects to fund this deficit through future tax levies.
4. INTERFUND RECEIVABLES AND PAYABLES
The composition of interfund loan balances as of June 30, 2017 for the District’s individual major funds is as follows: Receivable Payable Amount General Fund Operations and Maintenance Fund $ 443,284 The interfund loan balances exist because of temporary cash deficits will be repaid within one year.
- 28 -

ROCKFORD PUBLIC SCHOOLS, DISTRICT #205
ROCKFORD, ILLINOIS
NOTES TO FINANCIAL STATEMENTS (Continued)
- 43 -
5. GOVERNMENTAL CLAIMS RECEIVABLE AND UNEARNED REVENUE
A summary of governmental grants claims receivable and unavailable revenue by fund as of June 30, 2017 is as follows. All significant balances are expected to be collected within one year of the end of the fiscal period. Unearned and Receivables - Other Governmental Funds Unavailable
General
Nonmajor
Total Revenues -
Other General Special education grants $ 8,962,882 $ - $ 8,962,882 $ 4,071,166 Medicaid fee for service 9,130 - 9,130 - Title I grants 5,270,502 - 5,270,502 - Title II grants 330,123 - 330,123 - Title III grants 123,392 - 123,392 - Bilingual education grants 836,814 - 836,814 - Early childhood block grants 4,416,300 - 4,416,300 - IDEA grant 448,272 - 448,272 - Other 2,294,808 - 2,557,345 264,558 Total General Fund 22,692,223 - 22,692,223 4,335,724 Transportation Fund - 6,264,207 6,264,207 3,141,347
TOTAL $ 22,692,223 $ 6,264,207 $ 28,956,430 $ 7,477,071
6. OPERATING LEASES
The District leases part of the administrative building to a third party under noncancelable operating leases. Assets included in the District’s capital assets as of June 30, 2017 applicable to this lease were carried at a cost and accumulated depreciation of $579,696 and $75,360, respectively. For the year ended June 30, 2017, the District received $417,320 in rentals under these leases which is included in rentals revenue in the Operations and Maintenance Fund. Minimum future rentals to be received under this lease, excluding unknown escalation amounts and un-negotiated renewals are as follows at June 30, 2017: Year Ending
June 30, Amount
2018 $ 460,867 2019 195,517
TOTAL $ 656,384
- 29 -
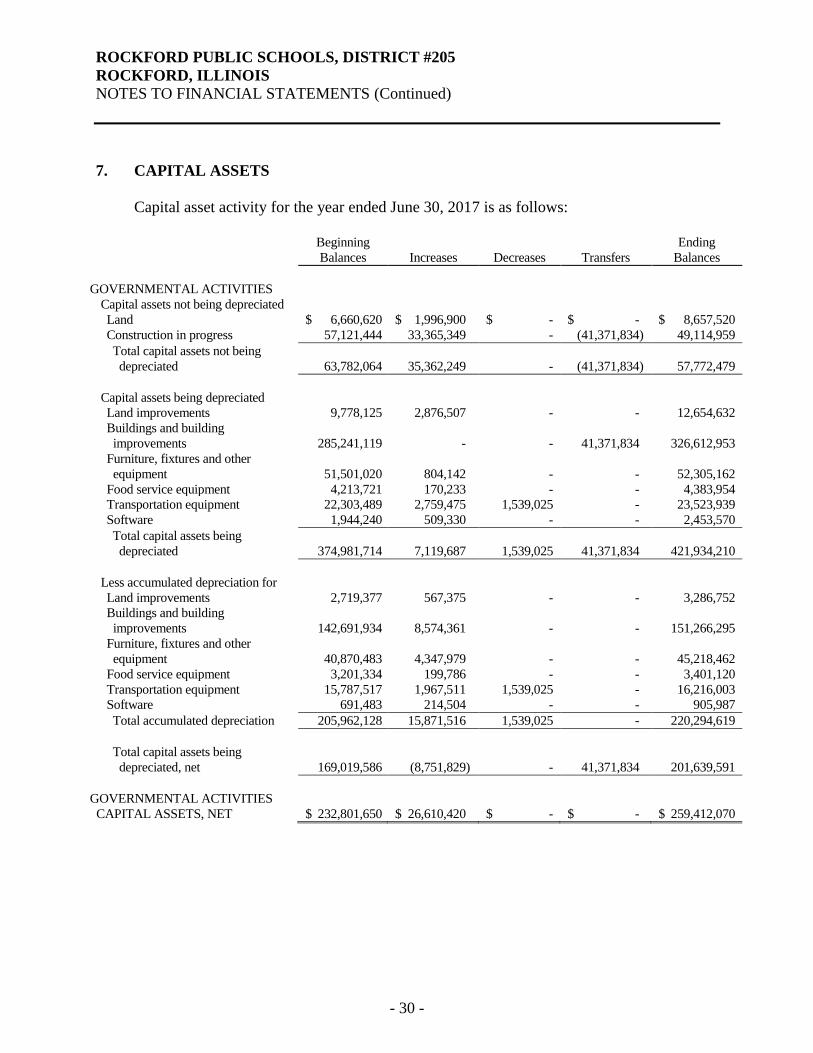
ROCKFORD PUBLIC SCHOOLS, DISTRICT #205
ROCKFORD, ILLINOIS
NOTES TO FINANCIAL STATEMENTS (Continued)
- 44 -
7. CAPITAL ASSETS
Capital asset activity for the year ended June 30, 2017 is as follows:
Beginning
Balances
Increases
Decreases
Transfers Ending
Balances GOVERNMENTAL ACTIVITIES Capital assets not being depreciated Land $ 6,660,620 $ 1,996,900 $ - $ - $ 8,657,520 Construction in progress 57,121,444 33,365,349 - (41,371,834) 49,114,959 Total capital assets not being depreciated
63,782,064
35,362,249
-
(41,371,834)
57,772,479
Capital assets being depreciated Land improvements 9,778,125 2,876,507 - - 12,654,632 Buildings and building improvements
285,241,119
-
-
41,371,834
326,612,953
Furniture, fixtures and other equipment
51,501,020
804,142
-
-
52,305,162
Food service equipment 4,213,721 170,233 - - 4,383,954 Transportation equipment 22,303,489 2,759,475 1,539,025 - 23,523,939 Software 1,944,240 509,330 - - 2,453,570 Total capital assets being depreciated
374,981,714
7,119,687
1,539,025
41,371,834
421,934,210
Less accumulated depreciation for Land improvements 2,719,377 567,375 - - 3,286,752 Buildings and building improvements
142,691,934
8,574,361
-
-
151,266,295
Furniture, fixtures and other equipment
40,870,483
4,347,979
-
-
45,218,462
Food service equipment 3,201,334 199,786 - - 3,401,120 Transportation equipment 15,787,517 1,967,511 1,539,025 - 16,216,003 Software 691,483 214,504 - - 905,987 Total accumulated depreciation 205,962,128 15,871,516 1,539,025 - 220,294,619 Total capital assets being depreciated, net
169,019,586
(8,751,829)
-
41,371,834
201,639,591
GOVERNMENTAL ACTIVITIES CAPITAL ASSETS, NET $ 232,801,650 $ 26,610,420 $ - $ - $ 259,412,070
- 30 -
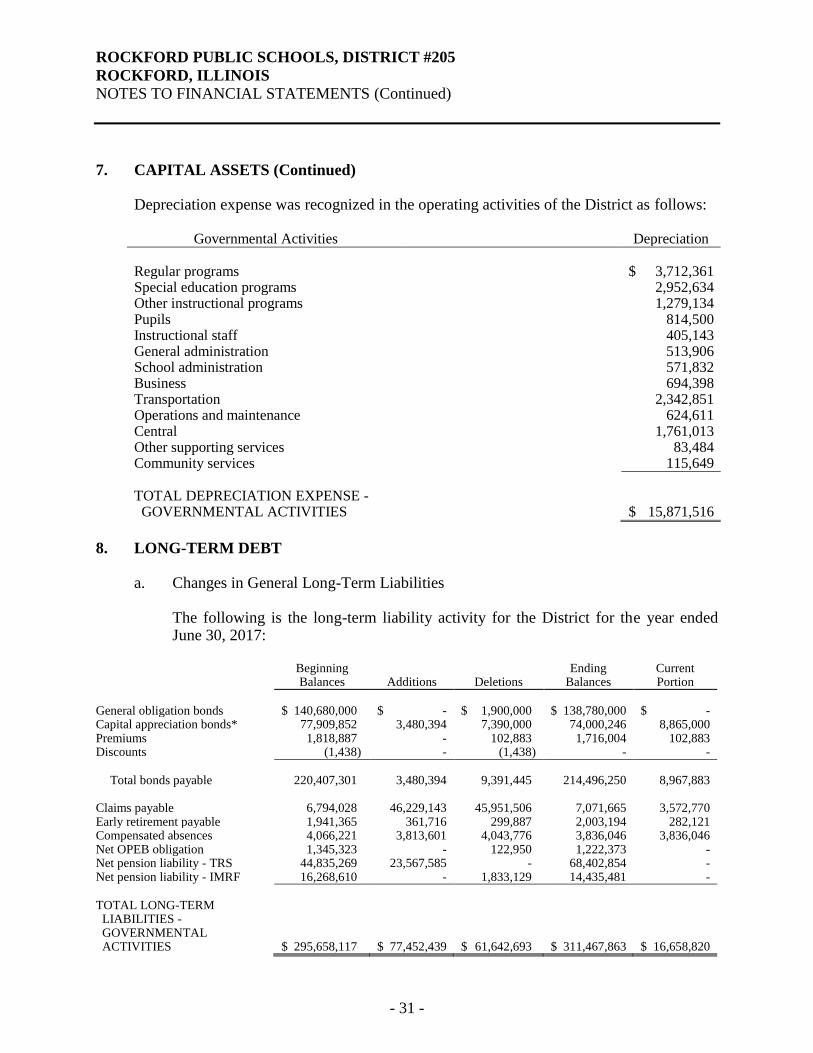
ROCKFORD PUBLIC SCHOOLS, DISTRICT #205
ROCKFORD, ILLINOIS
NOTES TO FINANCIAL STATEMENTS (Continued)
- 45 -
7. CAPITAL ASSETS (Continued) Depreciation expense was recognized in the operating activities of the District as follows:
Governmental Activities Depreciation Regular programs $ 3,712,361 Special education programs 2,952,634 Other instructional programs 1,279,134 Pupils 814,500 Instructional staff 405,143 General administration 513,906 School administration 571,832 Business 694,398 Transportation 2,342,851 Operations and maintenance 624,611 Central 1,761,013 Other supporting services 83,484 Community services 115,649 TOTAL DEPRECIATION EXPENSE - GOVERNMENTAL ACTIVITIES $ 15,871,516
8. LONG-TERM DEBT a. Changes in General Long-Term Liabilities The following is the long-term liability activity for the District for the year ended
June 30, 2017:
Beginning Balances
Additions
Deletions
Ending Balances
Current Portion
General obligation bonds $ 140,680,000 $ - $ 1,900,000 $ 138,780,000 $ - Capital appreciation bonds* 77,909,852 3,480,394 7,390,000 74,000,246 8,865,000 Premiums 1,818,887 - 102,883 1,716,004 102,883 Discounts (1,438) - (1,438) - - Total bonds payable 220,407,301 3,480,394 9,391,445 214,496,250 8,967,883 Claims payable 6,794,028 46,229,143 45,951,506 7,071,665 3,572,770 Early retirement payable 1,941,365 361,716 299,887 2,003,194 282,121 Compensated absences 4,066,221 3,813,601 4,043,776 3,836,046 3,836,046 Net OPEB obligation 1,345,323 - 122,950 1,222,373 - Net pension liability - TRS 44,835,269 23,567,585 - 68,402,854 - Net pension liability - IMRF 16,268,610 - 1,833,129 14,435,481 - TOTAL LONG-TERM LIABILITIES - GOVERNMENTAL ACTIVITIES
$ 295,658,117
$ 77,452,439
$ 61,642,693
$ 311,467,863
$ 16,658,820
- 31 -

ROCKFORD PUBLIC SCHOOLS, DISTRICT #205
ROCKFORD, ILLINOIS
NOTES TO FINANCIAL STATEMENTS (Continued)
- 46 -
8. LONG-TERM DEBT (Continued) a. Changes in General Long-Term Liabilities (Continued)
*Includes annual accretion of interest in the amount of $3,480,394 on capital
appreciation bonds.
The obligation for claims payable will be repaid from the Internal Service Fund and Tort Immunity Fund.
The obligations for the compensated absences and early retirement benefits will be
repaid from the General, Operations and Maintenance and Transportation Funds. b. General Obligation/Capital Appreciation Bonds The District issues general obligation/capital appreciation bonds to finance various
capital improvements. General obligation bonds are direct obligations and pledge the full faith and credit of the District. As of June 30, 2017, the District’s general
obligation/capital appreciation bonds consist of the following:
Interest Rates
Original Indebtedness
Face Amount
Carrying Amount
Series 2000, capital appreciation life safety bonds dated February 1, 2000 are due in annual installments through February 1, 2020.
6.12% to
6.33%
$ 9,999,934
$ 29,960,000
$ 11,990,968
Series 2010, capital appreciation limited school bonds dated September 1, 2010 are due in annual installments through February 1, 2020.
4.25%
9,992,698
13,640,000
7,757,400
Series 2013, capital appreciation limited school bonds dated April 2, 2013 are due in annual installments through February 1, 2027.
3.03% to
4.29%
30,999,876
46,355,000
36,252,141
Series 2013, general obligation bonds dated April 2, 2013 are due in annual installments through February 1, 2033.
3.5% to
4.0%
69,000,000
69,000,000
66,790,000
Series 2015A, capital appreciation limited school bonds dated March 5, 2015 are due in annual installments through February 1, 2027.
5.25%
6,204,788
9,725,000
6,998,598
Series 2015A, general obligation bonds dated March 5, 2015 are due in annual installments through February 1, 2035.
3.5% to
4.0%
13,795,000
12,855,000
13,795,000
- 32 -

ROCKFORD PUBLIC SCHOOLS, DISTRICT #205
ROCKFORD, ILLINOIS
NOTES TO FINANCIAL STATEMENTS (Continued)
- 47 -
8. LONG-TERM DEBT (Continued) b. General Obligation/Capital Appreciation Bonds (Continued)
Interest Rates
Original Indebtedness
Face Amount
Carrying Amount
Series 2015B, capital appreciation limited school bonds dated March 5, 2015 are due in annual installments through February 1, 2027.
3.05% to
4.99%
$ 9,886,576
$ 25,710,000
$ 11,001,139
Series 2015B, general obligation serial bonds dated March 5, 2015 are due in annual installments through February 1, 2027.
3.25%
935,000
935,000
935,000
Series 2015B, general obligation term bonds dated March 5, 2015 are due in annual installments on through February 1, 2035.
3.75% to
4.00%
28,175,000
28,175,000
28,175,000
Series 2016, Taxable Obligation School Bonds (Alternate Revenue Source - Qualified School Construction Bonds) dated May 12, 2016 are due in annual installments through December 2027.
3.80% to 3.95%
29,085,000
29,085,000
29,085,000
TOTAL $ 208,073,872 $ 265,440,000 $ 212,780,246
Above balances include $17,161,278 of accreted interest on capital appreciation
bonds. Capital appreciation bonds are treated like zero-coupon bonds in that no regular interest payments are associated with these bonds until the bonds mature. Accordingly, the accreted value is added to these bonds. The difference between the carrying amount and the face amount is the total accreted value to date.
A summary of the future debt service requirements to amortize the remaining
outstanding general obligation bonds as of June 30, 2017 is as follows:
Year Ending June 30, Principal Interest Total
2018 $ - $ 5,450,483 $ 5,450,483 2019 - 5,450,483 5,450,483 2020 - 5,450,483 5,450,483 2021 - 5,450,483 5,450,483 2022 - 5,450,483 5,450,483
2023-2027 22,310,000 26,967,414 49,277,414 2028-2032 74,265,000 15,995,591 90,260,591 2033-2035 42,205,000 3,418,338 45,623,388
TOTAL $ 138,780,000 $ 73,633,808 $ 212,413,808
- 33 -
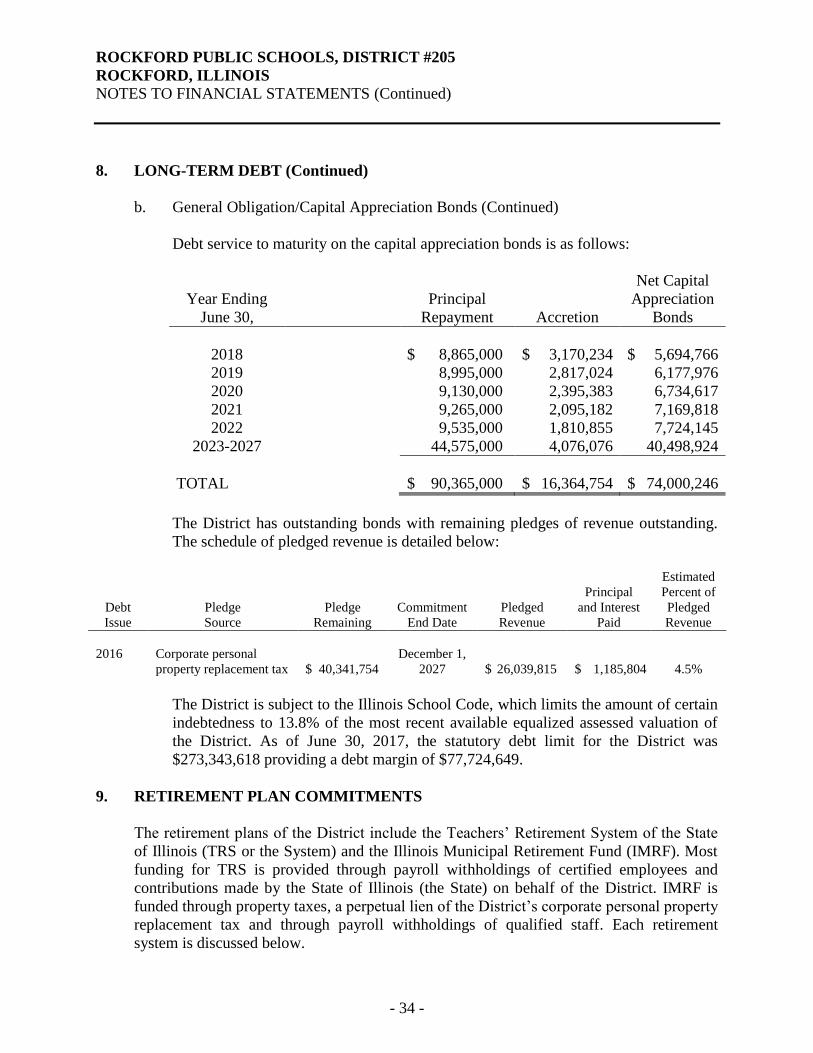
ROCKFORD PUBLIC SCHOOLS, DISTRICT #205
ROCKFORD, ILLINOIS
NOTES TO FINANCIAL STATEMENTS (Continued)
- 48 -
8. LONG-TERM DEBT (Continued)
b. General Obligation/Capital Appreciation Bonds (Continued)
Debt service to maturity on the capital appreciation bonds is as follows:
Net Capital Year Ending
Principal
Appreciation
June 30,
Repayment Accretion Bonds
2018
$ 8,865,000 $ 3,170,234 $ 5,694,766 2019
8,995,000 2,817,024 6,177,976
2020 9,130,000 2,395,383 6,734,617 2021 9,265,000 2,095,182 7,169,818 2022 9,535,000 1,810,855 7,724,145
2023-2027 44,575,000 4,076,076 40,498,924
TOTAL
$ 90,365,000 $ 16,364,754 $ 74,000,246
The District has outstanding bonds with remaining pledges of revenue outstanding. The schedule of pledged revenue is detailed below:
Debt Issue
Pledge Source
Pledge Remaining
Commitment End Date
Pledged Revenue
Principal
and Interest Paid
Estimated Percent of Pledged Revenue
2016 Corporate personal
property replacement tax $ 40,341,754
December 1, 2027
$ 26,039,815
$ 1,185,804
4.5%
The District is subject to the Illinois School Code, which limits the amount of certain
indebtedness to 13.8% of the most recent available equalized assessed valuation of the District. As of June 30, 2017, the statutory debt limit for the District was $273,343,618 providing a debt margin of $77,724,649.
9. RETIREMENT PLAN COMMITMENTS
The retirement plans of the District include the Teachers’ Retirement System of the State
of Illinois (TRS or the System) and the Illinois Municipal Retirement Fund (IMRF). Most funding for TRS is provided through payroll withholdings of certified employees and contributions made by the State of Illinois (the State) on behalf of the District. IMRF is funded through property taxes, a perpetual lien of the District’s corporate personal property
replacement tax and through payroll withholdings of qualified staff. Each retirement system is discussed below.
- 34 -

ROCKFORD PUBLIC SCHOOLS, DISTRICT #205
ROCKFORD, ILLINOIS
NOTES TO FINANCIAL STATEMENTS (Continued)
- 49 -
9. RETIREMENT PLAN COMMITMENTS (Continued)
a. Teachers’ Retirement System of the State of Illinois
Plan Description
The District participates in TRS. TRS is a cost-sharing multiple-employer defined
benefit pension plan that was created by the Illinois legislature for the benefit of Illinois public school teachers employed outside the City of Chicago. TRS members include all active non-annuitants who are employed by a TRS-covered employer to provide services for which teacher licensure is required. The Illinois Pension Code outlines the benefit provisions of TRS, and amendments to the plan can be made only by legislative action with the Governor’s approval. The TRS Board of Trustees is responsible for the System’s administration. TRS issues a publicly available financial report that can be obtained at http://trs.illinois.gov/pubs/cafr; by writing to TRS at 2815 W. Washington, P.O. Box 19253, Springfield, IL 62794; or by calling (888) 877-0890, option 2.
Benefits Provided
TRS provides retirement, disability and death benefits. Tier 1 members have TRS or
reciprocal system service prior to January 1, 2011. Tier 1 members qualify for retirement benefits at age 62 with five years of service, at age 60 with ten years, or age 55 with 20 years. The benefit is determined by the average of the four highest years of creditable earnings within the last ten years of creditable service and the percentage of average salary to which the member is entitled. Most members retire under a formula that provides 2.2% of final average salary up to a maximum of 75% with 34 years of service. Disability and death benefits are also provided.
Tier 2 members qualify for retirement benefits at age 67 with ten years of service or
a discounted annuity can be paid at age 62 with ten years of service. Creditable earnings for retirement purposes are capped and the final average salary is based on the highest consecutive eight years of creditable service rather than the last four. Disability provisions for Tier 2 are identical to those of Tier 1. Death benefits are payable under a formula that is different from Tier 1.
Essentially all Tier 1 retirees receive an annual 3% increase in the current retirement
benefit beginning January 1 following the attainment of age 61 or on January 1 following the member’s first anniversary in retirement, whichever is later. Tier 2 annual increases will be the lesser of 3% of the original benefit or one-half percent of the rate of inflation beginning January 1 following attainment of age 67 or on January 1 following the member’s first anniversary in retirement, whichever is later.
- 35 -

ROCKFORD PUBLIC SCHOOLS, DISTRICT #205
ROCKFORD, ILLINOIS
NOTES TO FINANCIAL STATEMENTS (Continued)
- 50 -
9. RETIREMENT PLAN COMMITMENTS (Continued)
a. Teachers’ Retirement System of the State of Illinois (Continued) Contributions
The State maintains the primary responsibility for funding TRS. The Illinois Pension Code, as amended by Public Act 88-0593 and subsequent acts, provides that for years 2010 through 2045, the minimum contribution to the System for each fiscal year shall be an amount determined to be sufficient to bring the total assets of the System up to 90% of the total actuarial liabilities of the System by the end of fiscal year 2045.
Contributions from active members and TRS contributing employers are also required by the Illinois Pension Code. The contribution rates are specified in the pension code. The active member contribution rate for the year ended June 30, 2017, was 9% of creditable earnings. The member contribution, which may be paid on behalf of employees by the employer, is submitted to TRS by the employer.
On Behalf Contributions to TRS
The State makes employer pension contributions on behalf of the District. For the
year ended June 30, 2017, the State’s contributions recognized by the District were based on the State’s proportionate share of the collective net pension liability and
pension expense associated with the District, and the District recognized revenue and expenses of $118,223,686 in pension contributions from the State.
2.2 Formula Contributions
Employers contribute 0.58% of total creditable earnings for the 2.2 formula change. The contribution rate is specified by statute. Contributions for the year ended June 30, 2017 were $891,006 and are reported as a deferred outflow of resources because they were paid after the June 30, 2016 measurement date.
Federal and Special Trust Fund Contributions
When TRS members are paid from federal and special trust funds administered by
the employer, there is a statutory requirement for the employer to pay an employer pension contribution from those funds. Under a policy adopted by the TRS Board of Trustees that has been in effect since the fiscal year ended June 30, 2006, employer contributions for employees paid from federal and special trust funds will be the same as the State contribution rate to TRS. Public Act 98-0674 now requires the two rates to be the same.
- 36 -

ROCKFORD PUBLIC SCHOOLS, DISTRICT #205
ROCKFORD, ILLINOIS
NOTES TO FINANCIAL STATEMENTS (Continued)
- 51 -
9. RETIREMENT PLAN COMMITMENTS (Continued)
a. Teachers’ Retirement System of the State of Illinois (Continued) Federal and Special Trust Fund Contributions (Continued) For the year ended June 30, 2017, the District pension contribution was 38.54% of
salaries paid from federal and Special Trust Funds. For the year ended June 30, 2017, salaries totaling $6,226,450 were paid from federal and Special Trust Funds that required District contributions of $2,399,674. These contributions are deferred because they were paid after the June 30, 2016 measurement date.
Employer Retirement Cost Contributions Under GASB Statement No. 68, contributions that an employer is required to pay
because of a TRS member retiring are categorized as specific liability payments. The District is required to make a one-time contribution to TRS for members retiring under the early retirement option (ERO). The payments vary depending on the member’s age and salary. The maximum employer ERO contribution under the current program is 146.5% and applies when the member is age 55 at retirement. For the year ended June 30, 2017, the District paid $609,201 to TRS for employer ERO contributions.
The employer is also required to make a one-time contribution to TRS for members
granted salary increases over 6% if those salaries are used to calculate a retiree’s final average salary. A one-time contribution is also required for members granted sick leave days in excess of the normal annual allotment if those days are used as TRS service credit. For the year ended June 30, 2017, the District paid $337,576 to TRS for employer contributions due on salary increases in excess of 6% and $22,338 for sick leave days granted in excess of the normal annual allotment.
Pension Liabilities, Pension Expense and Deferred Outflows of Resources and
Deferred Inflows of Resources Related to Pensions At June 30, 2017, the District reported a liability for its proportionate share of the net
pension liability (first amount shown below) that reflected a reduction for state pension support provided to the District. The State’s support and total are for disclosure purposes only. The amount recognized by the District as its proportionate share of the net pension liability, the related state support and the total portion of the net pension liability that was associated with the District were as follow:
District’s proportionate share of the net pension liability $ 68,402,854 State’s proportionate share of the net pension liability associated with the District
1,203,832,477
TOTAL $ 1,272,235,331
- 37 -

ROCKFORD PUBLIC SCHOOLS, DISTRICT #205
ROCKFORD, ILLINOIS
NOTES TO FINANCIAL STATEMENTS (Continued)
- 52 -
9. RETIREMENT PLAN COMMITMENTS (Continued)
a. Teachers’ Retirement System of the State of Illinois (Continued) Pension Liabilities, Pension Expense and Deferred Outflows of Resources and
Deferred Inflows of Resources Related to Pensions (Continued) The net pension liability was measured as of June 30, 2016 and the total pension
liability used to calculate the net pension liability was determined by an actuarial valuation as of June 30, 2014 and rolled forward to June 30, 2016. The District’s
proportion of the net pension liability was based on the District’s share of contributions to TRS for the measurement year ended June 30, 2016, relative to the projected contributions of all participating TRS employers and the State during that period. At June 30, 2016, the District’s proportion was 0.0866560420%, which was an increase of 0.0182157763% from its proportion measured as of June 30, 2015 (0.0684402657%).
For the year ended June 30, 2017, the District recognized pension expense of
$118,223,686 and revenue of $118,223,686 for support provided by the State. At June 30, 2017, the District reported deferred outflows of resources and deferred inflows of resources related to pensions from the following sources:
Deferred Outflows of Resources
Deferred
Inflows of Resources
Net Deferred
Outflows of Resources
Differences between expected and actual experience
$ 505,778
$ 46,392
$ 459,386
Net difference between projected and actual earnings on pension plan investments
1,932,502
-
1,932,502
Changes of assumptions 5,874,785 - 5,874,785 Changes in proportion and differences between employee contributions and proportionate share of contributions
9,663,059
10,176,258
(513,199)
District contributions subsequent to the measurement date
3,290,680
-
3,290,680
TOTAL $ 21,266,804 $ 10,222,650 $ 11,044,154
$3,290,680 reported as deferred outflows of resources related to pensions resulting
from district contributions subsequent to the measurement date will be recognized as a reduction of the net pension liability in the reporting year ending June 30, 2018. Other amounts reported as deferred outflows of resources and deferred inflows of resources related to pensions will be recognized in pension expense as follows:
- 38 -

ROCKFORD PUBLIC SCHOOLS, DISTRICT #205
ROCKFORD, ILLINOIS
NOTES TO FINANCIAL STATEMENTS (Continued)
- 53 -
9. RETIREMENT PLAN COMMITMENTS (Continued)
a. Teachers’ Retirement System of the State of Illinois (Continued) Pension Liabilities, Pension Expense and Deferred Outflows of Resources and
Deferred Inflows of Resources Related to Pensions (Continued)
Year Ending June 30,
Amount
2018 $ 267,102 2019 267,102 2020 2,176,861 2021 4,272,041 2022 770,368
TOTAL $ 7,753,474
Actuarial Assumptions
The total pension liability in the June 30, 2016 actuarial valuation was determined
using the following actuarial assumptions, applied to all periods included in the measurement:
Inflation 2.50% Salary increases Varies by amount of service credit Investment rate of return 7.00%, net of pension plan investment expenses,
including inflation Mortality rates were based on the RP-2014 White Collar Table with adjustments as
appropriate for TRS experience. The rates are used on a fully-generational basis using projection table MP-2014.
For the June 30, 2016 valuation, the assumed investment rate of return was of 7.0%,
including an inflation rate of 2.5% and a real return of 4.5%. Salary increases were assumed to vary by service credit. For the June 30, 2015 valuation, the assumed investment rate of return was 7.5%, including an inflation rate of 3.0% and a real return of 4.5%. Salary increases were assumed to vary by service credit. Various other changes in assumptions were adopted based on the experience analysis for the three-year period ending June 30, 2014.
- 39 -

ROCKFORD PUBLIC SCHOOLS, DISTRICT #205
ROCKFORD, ILLINOIS
NOTES TO FINANCIAL STATEMENTS (Continued)
- 54 -
9. RETIREMENT PLAN COMMITMENTS (Continued)
a. Teachers’ Retirement System of the State of Illinois (Continued) Actuarial Assumptions (Continued) The long-term expected rate of return on pension plan investments was determined
using a building-block method in which best-estimate ranges of expected future real rates of return (expected returns, net of pension plan investment expense and inflation) are developed for each major asset class. These ranges are combined to produce the long-term expected rate of return by weighting the expected future real rates of return by the target asset allocation percentage and by adding expected inflation. The target allocation and best estimates of arithmetic real rates of return for each major asset class that were used by the actuary are summarized in the following table:
Asset Class
Target
Allocation
Long-Term Expected Real Rate of Return
U.S. large cap 14.40% 6.94% U.S. equities small/mid cap 3.60% 8.09% International equities developed 14.40% 7.46% Emerging market equities 3.60% 10.15% U.S. bonds core 10.70% 2.44% International debt developed 5.30% 1.70% Real estate 15.00% 5.44% Commodities (real return) 11.00% 4.28% Hedge funds (absolute return) 8.00% 4.16% Private equity 14.00% 10.63% TOTAL 100.00%
Discount Rate
At June 30, 2016, the discount rate used to measure the total pension liability was a blended rate of 6.83%, which was a change from the June 30, 2015 rate of 7.47%. The projection of cash flows used to determine the discount rate assumed that employee contributions, employer contributions and state contributions will be made at the current statutorily required rates.
- 40 -

ROCKFORD PUBLIC SCHOOLS, DISTRICT #205
ROCKFORD, ILLINOIS
NOTES TO FINANCIAL STATEMENTS (Continued)
- 55 -
9. RETIREMENT PLAN COMMITMENTS (Continued)
a. Teachers’ Retirement System of the State of Illinois (Continued) Discount Rate (Continued)
Based on those assumptions, TRS’s fiduciary net position at June 30, 2016 was not
projected to be available to make all projected future benefit payments of current active and inactive members and all benefit recipients. Tier I’s liability is partially
funded by Tier II members, as the Tier II member contribution is higher than the cost of Tier II benefits. Due to this subsidy, contributions from future members in excess of the service cost are also included in the determination of the discount rate. Despite the subsidy, all projected future payments were not covered, so a slightly lower long-term expected rate of return on TRS investments was applied to all periods of projected benefit payments to determine the total pension liability.
At June 30, 2015, the discount rate used to measure the total pension liability was
7.47%. The discount rate was the same as the actuarially-assumed rate of return on investments that year because TRS’s fiduciary net position and the subsidy provided
by Tier II were sufficient to cover all projected benefit payments. Sensitivity of the Employer’s Proportionate Share of the Net Pension Liability
to Changes in the Discount Rate.
The following presents the District’s proportionate share of the net pension liability
calculated using the discount rate of 6.83%, as well as what the District’s
proportionate share of the net pension liability would be if it were calculated using a discount rate that is 1 percentage point lower (5.83%) or 1 percentage point higher (7.83%) than the current rate.
1% Decrease (5.83%)
Current Discount Rate
(6.83%)
1% Increase
(7.83%) Employer’s proportionate share of the net pension liability
$ 83,659,467
$ 68,402,854
$ 55,942,247
TRS Fiduciary Net Position
Detailed information about the TRS’ fiduciary net position as of June 30, 2016 is available in the separately issued TRS comprehensive annual financial report.
- 41 -

ROCKFORD PUBLIC SCHOOLS, DISTRICT #205
ROCKFORD, ILLINOIS
NOTES TO FINANCIAL STATEMENTS (Continued)
- 56 -
9. RETIREMENT PLAN COMMITMENTS (Continued)
b. Illinois Municipal Retirement Fund
The District’s defined benefit pension plan (the Plan), Illinois Municipal Retirement
Fund (IMRF), provides retirement, disability, annual cost of living adjustments and death benefits to plan members and beneficiaries. IMRF is an agent multiple-employer pension plan that acts as a common investment and administrative agent for local governments and school districts in Illinois. The Illinois Pension Code establishes the benefit provisions of the Plan that can only be amended by the Illinois General Assembly. IMRF issues a publicly available financial report that includes financial statements and supplementary information for the Plan as a whole but not by individual employer. That report may be obtained at www.imrf.org. The net pension liability for the governmental activities will be liquidated by the Illinois Municipal Retirement/Social Security Fund.
Plan Administration
All employees (other than those covered by TRS) hired in positions that meet or
exceed the prescribed annual hourly standard must be enrolled in IMRF as participating members.
The Plan is accounted for on the economic resources measurement focus and the
accrual basis of accounting. Employer and employee contributions are recognized when earned in the year that the contributions are required, benefits and refunds are recognized as an expense and liability when due and payable.
Plan Membership
At December 31, 2016, IMRF membership consisted of:
Inactive employees or their beneficiaries currently receiving benefits 1,294 Inactive employees entitled to but not yet receiving benefits
1,190
Active employees 1,392 TOTAL 3,876
- 42 -

ROCKFORD PUBLIC SCHOOLS, DISTRICT #205
ROCKFORD, ILLINOIS
NOTES TO FINANCIAL STATEMENTS (Continued)
- 57 -
9. RETIREMENT PLAN COMMITMENTS (Continued)
b. Illinois Municipal Retirement Fund (Continued)
Benefits Provided
IMRF provides two tiers of pension benefits. Employees hired prior to January 1, 2011 are eligible for Tier 1 benefits. For Tier 1 employees, pension benefits vest after eight years of service. Participating members who retire at age 55 (reduced benefits) or after age 60 (full benefits) with eight years of credited service are entitled to an annual retirement benefit, payable monthly for life, in an amount equal to 1 2/3% of their final rate of earnings, for each year of credited service up to 15 years, and 2% for each year thereafter. Employees hired on or after January 1, 2011 are eligible for Tier 2 benefits. For Tier 2 employees, pension benefits vest after ten years of service. Participating members who retire at age 62 (reduced benefits) or after age 67 (full benefits) with ten years of credited service are entitled to an annual retirement benefit, payable monthly for life, in an amount equal to 1 2/3% of their final rate of earnings, for each year of credited service up to 15 years, and 2% for each year thereafter. IMRF also provides death and disability benefits. These benefit provisions and all other requirements are established by state statute. Contributions
Participating members are required to contribute 4.50% of their annual salary to IMRF. The District is required to contribute the remaining amounts necessary to fund IMRF as specified by statute. The employer contribution rate for the calendar year 2017 and 2016 was 9.39% and 9.83%, respectively of annual covered payroll.
Actuarial Assumptions
The District’s net pension liability was measured as of December 31, 2016 and the
total pension liability used to calculate the net pension liability was determined by an actuarial valuation performed as of the same date using the following actuarial methods and assumptions.
- 43 -

ROCKFORD PUBLIC SCHOOLS, DISTRICT #205
ROCKFORD, ILLINOIS
NOTES TO FINANCIAL STATEMENTS (Continued)
- 58 -
9. RETIREMENT PLAN COMMITMENTS (Continued) b. Illinois Municipal Retirement Fund (Continued)
Actuarial Assumptions (Continued)
Actuarial valuation date December 31, 2016 Actuarial cost method Entry-age normal Assumptions Inflation 2.75% Salary increases 3.75% to 14.50% Interest rate 7.50% Asset valuation method Market value
For nondisabled retirees, an IMRF specific mortality table was used with fully generational projection scale MP-2014 (base year 2012). IMRF specific rates were developed from the RP-2014 Blue Collar Health Annuitant Mortality Table with adjustments to match current IMRF experience. For disabled retirees, an IMRF specific mortality table was used with fully generational projection scale MP-2014 (base year 2012). IMRF specific rates were developed from the RP-2014 Disabled Retirees Mortality Table applying the same adjustment that were applied for nondisabled lives. For active members, an IMRF specific mortality table was used with fully generational projection scale MP-2014 (base year 2012). IMRF specific rates were developed from the RP-2014 Employee Mortality Table with adjustments to match current IMRF experience.
Discount Rate
The discount rate used to measure the IMRF total pension liability was 7.50%. The projection of cash flows used to determine the discount rate assumed that member contributions will be made at the current contribution rate and that the employer contributions will be made at rates equal to the difference between actuarially determined contribution rates and the member rate. Based on those assumptions, the employer’s fiduciary net position was projected to be available to make all projected future benefit payments of current plan members.
- 44 -

ROCKFORD PUBLIC SCHOOLS, DISTRICT #205
ROCKFORD, ILLINOIS
NOTES TO FINANCIAL STATEMENTS (Continued)
- 59 -
9. RETIREMENT PLAN COMMITMENTS (Continued)
b. Illinois Municipal Retirement Fund (Continued)
Changes in the Net Pension Liability
(a)
Total Pension (b)
Plan Fiduciary (a) - (b)
Net Pension Liability Net Position Liability BALANCES AT JANUARY 1, 2016
$ 214,580,170
$ 198,311,560
$ 16,268,610
Changes for the period Service cost 4,112,437 - 4,112,437 Interest 15,761,381 - 15,761,381 Difference between expected and actual experience (2,417,979) - (2,417,979) Changes in assumptions (238,612) - (238,612) Employer contributions - 3,728,265 (3,728,265) Employee contributions - 1,744,700 (1,744,700) Net investment income - 13,532,519 (13,532,519) Benefit payments and refunds (12,408,136) (12,408,136) - Other (net transfer) - 44,872 (44,872) Net change for the period 4,809,091 6,642,220 (1,833,129) BALANCES AT DECEMBER 31, 2016
$ 219,389,261
$ 204,953,780
$ 14,435,481
Changes in assumptions related to investment rate of return were made since the
prior measurement date.
- 45 -

ROCKFORD PUBLIC SCHOOLS, DISTRICT #205
ROCKFORD, ILLINOIS
NOTES TO FINANCIAL STATEMENTS (Continued)
- 60 -
9. RETIREMENT PLAN COMMITMENTS (Continued)
b. Illinois Municipal Retirement Fund (Continued)
Pension Expense and Deferred Outflows of Resources and Deferred Inflows of
Resources
For the year ended June 30, 2017, the District recognized pension expense of $9,344,612. At June 30, 2017, the District reported deferred outflows of resources and deferred inflows of resources related to IMRF from the following sources:
Deferred Outflows of
Deferred Inflows of
Net Deferred Outflow of
Resources Resources Resources Difference between expected and actual experience
$ 671,211
$ 1,692,774
$ (1,021,563)
Changes in assumption 981,050 167,047 814,003 Net difference between projected and actual earnings on pension plan investments 10,367,887 - 10,367,887 Contributions after measurement date 1,817,168 - 1,817,168 TOTAL $ 13,837,316 $ 1,859,821 $ 11,977,495
$1,817,168 reported as deferred outflows of resources related to District contributions subsequent to the measurement date and will be recognized as a reduction to net pension liability in the reporting year ending June 30, 2018. Other amounts reported as deferred outflows of resources and deferred inflows of resources related to IMRF will be recognized in pension expense as follows: Year Ending
December 31, 2018 $ 4,249,004 2019 2,939,457 2020 2,755,372 2021 216,494 2022 - Thereafter - TOTAL $ 10,160,327
- 46 -

ROCKFORD PUBLIC SCHOOLS, DISTRICT #205
ROCKFORD, ILLINOIS
NOTES TO FINANCIAL STATEMENTS (Continued)
- 61 -
9. RETIREMENT PLAN COMMITMENTS (Continued)
b. Illinois Municipal Retirement Fund (Continued) Discount Rate Sensitivity
The following is a sensitive analysis of the net pension liability (asset) to changes in
the discount rate. The table below presents the net pension liability of the District calculated using the discount rate of 7.5% as well as what the District’s net pension
liability (assets) would be if it were calculated using a discount rate that is 1 percentage point lower (6.5%) or 1 percentage point higher (8.5%) than the current rate:
1% Decrease Current
Discount Rate
1% Increase (6.5%) (7.5%) (8.5%) Net pension liability (asset) $ 40,131,916 $ 14,435,481 $ (6,820,258)
10. EARLY RETIREMENT BENEFITS
The District offered two early retirement incentive plans. The first plan began in June 1989 and the District offered an early retirement plan to all employees covered by the collective bargaining agreement with the Rockford Education Association. The plan offered a $3,000 early retirement bonus and a lifetime retirement supplement, with no right of survivorship, of $150 per month. The District also offered postretirement health care benefits who elected the above described early retirement plan. In July 1991, the second retirement plan was offered by the District to all employees covered by the collective bargaining agreement with the Rockford Education Association. The plan offered a lifetime benefit, payable monthly, in the amount of $60 times credible years of TRS service divided by 12 with the maximum of 30 years of services.
Actuarial Methods and Assumptions Projections of benefits for financial reporting purposes are based on the substantive plan
(the plan as understood by the employer and plan members) and include the types of benefits provided at the time of each valuation and the historical pattern of sharing of benefit costs between the employer and plan members to that point. The actuarial methods and assumptions used include techniques that are designed to reduce short-term volatility in actuarial accrued liabilities and the actuarial value of assets, consistent with the long-term perspective of the calculations.
- 47 -

ROCKFORD PUBLIC SCHOOLS, DISTRICT #205
ROCKFORD, ILLINOIS
NOTES TO FINANCIAL STATEMENTS (Continued)
- 62 -
10. EARLY RETIREMENT BENEFITS (Continued)
Actuarial Methods and Assumptions (Continued) In the June 30, 2017 actuarial valuation, the projected unit credit actuarial cost method was
used. The actuarial assumptions used a rate to discount liabilities of 2.85%, which was determined by a cash flow matching analysis using plan specific expected benefit payments and spot rates from the Citigroup Pension Discount Curve as of June 30, 2017. The mortality rates used are from the RP-2014 Health Mortality Tables with White Collar Adjustments, projected generationally with Scale MP-2014. The benefits apply to a closed group of retired participants.
11. OTHER POSTEMPLOYMENT BENEFITS
a. Retiree’s Health Plan The District administers a single-employer defined benefit healthcare plan the
Retiree’s Health Plan. The plan provides medical, dental, vision and life insurance benefits for eligible retirees and their spouses through the District’s group insurance
plan which covers both active and retired members. Benefit provisions are established through collective bargaining agreements and state that eligible retirees and their spouses at established contribution rates. The Retiree’s Health Plan does
not issue a publicly available financial report. Contribution requirements are established through collective bargaining agreements
and may be amended only through negotiations between the Board and the union. The District makes the same monthly health insurance contribution on behalf of the retiree as it makes on-behalf of all other active employees during that year. The District has a pay as you go funding policy which means that contributions are made to the plan only to fund the amount of benefits paid each year. For fiscal year 2017, the District contributed $3,893,606 to the plan.
The District’s annual other postemployment benefit (OPEB) cost (expense) is
calculated based on the annual required contribution (ARC) of the employer. The ARC represents a level of funding that, if paid on the ongoing basis, is projected to cover normal cost each year and amortize any unfunded actuarial liabilities (or funding excess) over a period not to exceed 30 years. The following table show the components of the District’s annual OPEB cost for the year, the amount actually
contributed to the Retiree’s Health Plan and changes in the District’s net OPEB
obligation to the Retiree’s Health Plan:
- 48 -
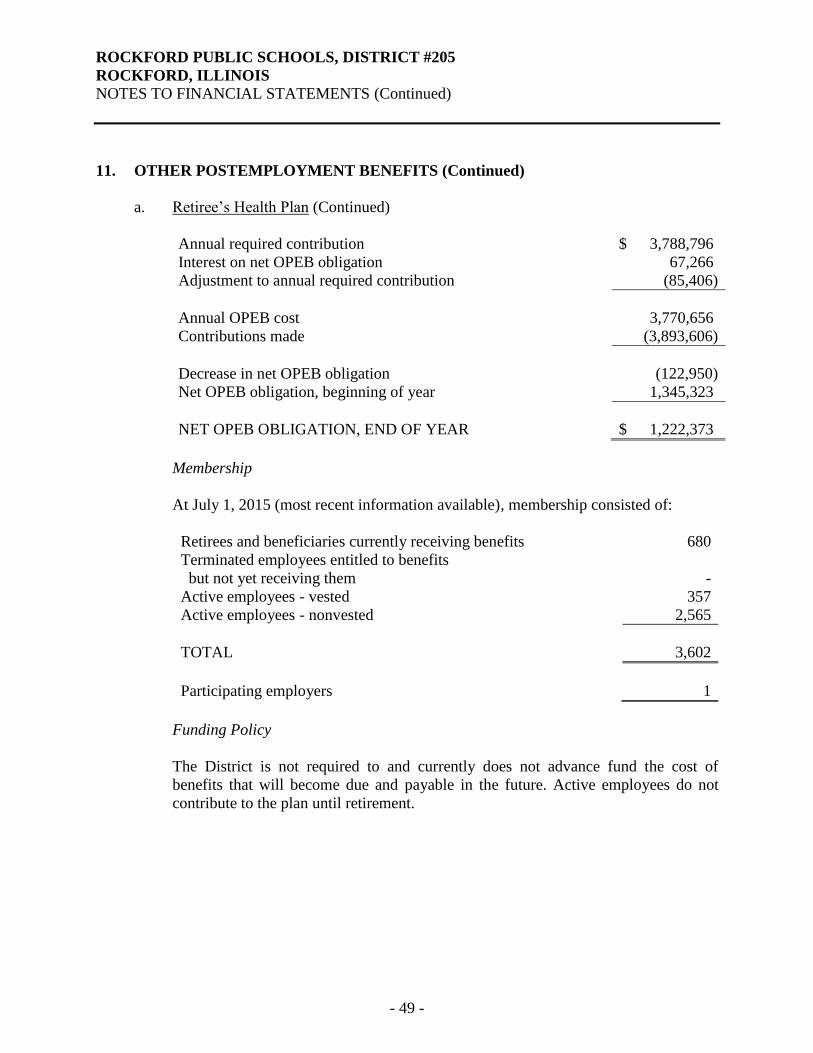
ROCKFORD PUBLIC SCHOOLS, DISTRICT #205
ROCKFORD, ILLINOIS
NOTES TO FINANCIAL STATEMENTS (Continued)
- 63 -
11. OTHER POSTEMPLOYMENT BENEFITS (Continued)
a. Retiree’s Health Plan (Continued)
Annual required contribution $ 3,788,796 Interest on net OPEB obligation 67,266 Adjustment to annual required contribution (85,406) Annual OPEB cost 3,770,656 Contributions made (3,893,606) Decrease in net OPEB obligation (122,950) Net OPEB obligation, beginning of year 1,345,323 NET OPEB OBLIGATION, END OF YEAR $ 1,222,373
Membership
At July 1, 2015 (most recent information available), membership consisted of:
Retirees and beneficiaries currently receiving benefits 680 Terminated employees entitled to benefits but not yet receiving them - Active employees - vested 357 Active employees - nonvested 2,565 TOTAL 3,602 Participating employers 1
Funding Policy
The District is not required to and currently does not advance fund the cost of
benefits that will become due and payable in the future. Active employees do not contribute to the plan until retirement.
- 49 -

ROCKFORD PUBLIC SCHOOLS, DISTRICT #205
ROCKFORD, ILLINOIS
NOTES TO FINANCIAL STATEMENTS (Continued)
- 64 -
11. OTHER POSTEMPLOYMENT BENEFITS (Continued) a. Retiree’s Health Plan (Continued) Funding Policy (Continued) The District’s annual OPEB cost, the percentage of annual OPEB cost contributed to
the Retiree’s Health Plan and the net OPEB obligation (asset) for 2017 was as follows:
Fiscal Year
Ended
Annual OPEB Cost
Percentage of Annual OPEB
Cost Contributed
Net OPEB Obligation
(Asset)
2017 $ 3,770,656 103.26% $ 1,222,373 2016 3,782,803 102.89% 1,345,323 2015 4,006,841 59.87% 1,454,472
The funded status of the Retiree’s Health Plan as of July 1, 2015 (most recent
information available) was as follows:
Actuarial accrued liability (AAL) $ 40,302,987 Actuarial value of plan assets - Unfunded actuarial accrued liability (UAAL) 40,302,987 Funded ratio (actuarial value of plan assets/AAL) 0.00% Covered payroll (active plan members) $ 147,504,042 UAAL as a percentage of covered payroll 27.32%
The schedule of funding progress, presented as required supplementary information
following the notes to the financial statements, presents multi-year trend information about whether the actuarial value of plan assets in increasing or decreasing over time relative to the actuarial accrued liability for benefits.
Actuarial valuations of an ongoing plan involve estimates of the value of reported
amounts and assumptions about the probability of occurrence of events far into the future. Examples include assumptions about future employment, mortality and the healthcare cost trend. Amounts determined regarding the funded status of the plan and the annual required contributions of the employer are subject to continual revision as actual results are compared with past expectations and new estimates are made about the future. The schedule of funding progress, presented as required supplementary information following the notes to financial statements, presents multi-year trend information that shows whether the actuarial value of plan assets is increasing or decreasing over time relative to the actuarial accrued liabilities for benefits.
- 50 -

ROCKFORD PUBLIC SCHOOLS, DISTRICT #205
ROCKFORD, ILLINOIS
NOTES TO FINANCIAL STATEMENTS (Continued)
- 65 -
11. OTHER POSTEMPLOYMENT BENEFITS (Continued) a. Retiree’s Health Plan (Continued) Funding Policy (Continued) Actuarial Methods and Assumptions - Projections of benefits for financial reporting
purposes are based on the substantive plan (the plan as understood by the employer and plan members) and include the types of benefits provided at the time of each valuation and the historical pattern of sharing of benefit costs between the employer and plan members to that point. The actuarial methods and assumptions used include techniques that are designed to reduce short-term volatility in actuarial accrued liabilities and the actuarial value of assets, consistent with the long-term perspective of the calculations.
In the July 1, 2015 actuarial valuation, the projected unit credit actuarial cost method
was used. The actuarial assumptions included a 5% investment rate of return and an annual healthcare cost trend rate of 6% initially, reduced by decrements to an ultimate rate of 5% after 2017. The Retiree’s Health Plan’s unfunded actuarial accrued liability is being amortized as a level percentage of projected payroll on a closed basis. The remaining amortization period at July 1, 2015 was 30 years.
b. Teacher Health Insurance Security of the State of Illinois The District participates in the Teacher Health Insurance Security (THIS) Fund, a
cost-sharing, multiple-employer defined benefit postemployment plan that was established by the Illinois legislature for the benefit of retired Illinois public school teachers employed outside the City of Chicago. THIS Fund provides medical, prescription and behavioral health benefits, but it does not provide vision, dental or life insurance benefits to annuitants of TRS. Annuitants not enrolled in Medicare may participate in the state administered participating provider option plan or choose from several managed care options. Annuitants who are enrolled in Medicare Parts A and B may be eligible to enroll in a Medicare Advantage plan.
The State Employees Group Insurance Act of 1971 (5 ILCS 375) outlines the benefit
provisions of THIS Fund and amendments to the plan can be made only by legislative action with the Governor’s approval. Effective July 1, 2012, in
accordance with Executive Order 12-01, the plan is administered by the Illinois Department of Central Management Services (CMS) with the cooperation of TRS. Section 6.6 of the State Employees Group Insurance Act of 1971 requires all active contributors to TRS who are not employees of the state to make a contribution to THIS Fund.
- 51 -
ROCKFORD PUBLIC SCHOOLS, DISTRICT #205
ROCKFORD, ILLINOIS
NOTES TO FINANCIAL STATEMENTS (Continued)
- 66 -
11. OTHER POSTEMPLOYMENT BENEFITS (Continued) b. Teacher Health Insurance Security of the State of Illinois (Continued) The percentage of employer required contributions in the future will not exceed
105% of the percentage of salary actually required to be paid in the previous fiscal year.
On-behalf contributions to THIS Fund - The State makes employer retiree
health insurance contributions on behalf of the District. State contributions are intended to match contributions to THIS Fund from active members which were 1.12% of pay during the year ended June 30, 2017. State contributions were $1,720,564 and the District recognized revenue and expenditures of this amount during the year. State contributions intended to match active member contributions during the years ended June 30, 2016 and 2015 were 1.07% and 1.02% of pay, respectively. State contributions on behalf of district employees were $1,612,335 and $1,514,894 for the years ended June 30, 2016 and 2015, respectively.
Employer contributions to THIS Fund - The District also makes contributions
to THIS Fund. The employer THIS Fund contribution was 0.84% during the year ended June 30, 2017 and 0.80% and 0.76% during the years ended June 30, 2016 and 2015, respectively. For the year ended June 30, 2017, the District paid $1,290,423 to THIS Fund, which was 100% of the required contribution. For the years ended June 30, 2016 and 2015, the District paid $1,205,484 and $1,128,745 to THIS Fund, respectively, which was 100% of the required contribution.
The publicly available financial report of THIS Fund may be found on the website of
the Illinois Auditor General: http://www.auditor.illinois.gov/audit-reports/ABC-list.asp. The current reports are listed under “Central Management Services.” Prior reports are available under “Healthcare and Family Services.”
12. RISK MANAGEMENT The District is exposed to various risks of loss related to torts; theft of, damage to and
destruction of assets; errors and omission; injuries to employees; and natural disasters. The District is self-insured for medical and dental coverage and workers’ compensation.
The District is self-insuring its employee medical and dental benefits up to $325,000 per
plan year for each employee or dependent covered and maintains coverage with an insurance carrier for excess amounts. This plan is administered by outside administrators who process the claims. The District pays the cost of employee coverage, and shares in the cost of their dependents. As of June 30, 2017, a liability has been provided for all known claims plus an estimate for those claims incurred but not reported. The cost related to this plan for the year ended June 30, 2017 were accounted for in the Internal Service Fund.
- 52 -

ROCKFORD PUBLIC SCHOOLS, DISTRICT #205
ROCKFORD, ILLINOIS
NOTES TO FINANCIAL STATEMENTS (Continued)
- 67 -
12. RISK MANAGEMENT (Continued)
The District is also self-insured for workers’ compensation claims on the first $625,000 of each occurrence. The District carries excess workers’ compensation insurance for statutory
amounts not otherwise self-insured.
The District also purchases commercial insurance through a cooperative to provide risks of loss for property, general liability, automotive liability, excess liability, school board legal liability and excess property coverage to which the District is exposed. The cooperative has purchased aggregate excess coverage except for property and casualty losses. The property and casualty loss fund is fully funded by members based on required contributions determined by the cooperative’s actuary. The District has not reduced its coverage this past year. The District has not significantly reduced insurance coverage nor had any settlement claims exceeding its insurance coverage the past three years.
An analysis of claims activity consisted of the following:
2016 to 2017
2015 to 2016
Self-insurance liability, July 1 $ 6,794,028 $ 7,004,369 Current year claims and changes in estimate 46,229,143 47,692,043 Claims paid (45,951,506) (47,902,384) SELF-INSURANCE LIABILITY, JUNE 30 $ 7,071,665 $ 6,794,028
13. CONTINGENT
The District is a defendant in various lawsuits. Although the outcome of these lawsuits is
not presently determinable, in the opinion of the District’s attorneys, the resolution of these matters will not have a material adverse effect on the financial condition of the District.
14. STATE AND FEDERAL AID CONTINGENCIES
The District has received federal and state grants for specific purposes that are subject to
review and audit by the grantor agencies. Such audits could lead to requests for reimbursements to the grantor agency for expenditures disallowed under terms of the grants. Management believes such disallowance, if any, would be immaterial.
- 53 -

ROCKFORD PUBLIC SCHOOLS, DISTRICT #205
ROCKFORD, ILLINOIS
NOTES TO FINANCIAL STATEMENTS (Continued)
- 68 -
15. COMMITMENTS
Construction Projects The District had active outstanding construction project contracts open at year end. Future
completion in the next fiscal year with estimated amount of approximately $27,104,462 is to be paid to contractors.
16. CORPORATE PERSONAL PROPERTY REPLACEMENT TAX OVERPAYMENT
During the fiscal year ended June 30, 2016, the Illinois Department of Revenue discovered
it had made incorrect distributions or overpayments of corporate personal property replacement tax to local taxing districts. In September 2017, the Illinois Department of Revenue issued a statement that they would no longer be seeking repayment of these overpayments. The District recognized 60% of this forgiveness during the fiscal year ended June 30, 2017. The remaining 40% of the overpayment totaling $1,116,776, will be recognized in fiscal year ending June 30, 2018, is reported as Due to Other Governments in the General Fund.
17. PRIOR PERIOD ADJUSTMENT
The District has restated fund balances/net position as of July 1, 2016 as follows:
General
Fund
Nonmajor Governmental
Funds
Governmental
Activities FUND BALANCES/NET POSITION, JULY 1, AS PREVIOUSLY REPORTED
$ 90,390,084
$ 35,869,337
$ 172,159,290
CORRECTION OF AN ERROR To correct overstated revenues in the prior year
(578,246)
-
(578,246)
To correct overstated expenditures in the prior year - 382,826 382,826 To correct overstated expenditures in the prior year - 259,237 259,237 To correct understated revenues in the prior year 163,985 - 163,985 To correct understated expenditures in the prior year (550,501) - (550,501) TOTAL CORRECTION OF AN ERROR (964,762) 642,063 (322,699) FUND BALANCES/NET POSITION, JULY 1, AS RESTATED
$ 89,425,322
$ 36,511,400
$ 171,836,591
- 54 -

REQUIRED SUPPLEMENTARY INFORMATION

Variance with
Original and Final Budget
Final Budget Actual Over (Under)
REVENUES
replacement taxesLocal sourcesEducational and working cash property taxes 79,546,285$ 79,032,993$ (513,292)$ Special education property taxes 15,712,846 15,611,965 (100,881) Replacement taxes 12,483,818 14,211,296 1,727,478 Regular tuition from pupils or parents (in state) 426,495 730,347 303,852 Regular tuition from other LEA's (in state) 331,032 - (331,032) Regular tuition from other sources (in state) - 10,127 10,127 Summer school - tuition from pupils and parents (in state) 58,155 134,317 76,162 Special education - tuition from other LEA's (in state) 1,837,427 1,701,163 (136,264) Adult - tuition from pupils or parents (in state) 27,875 55,270 27,395 Investment income 320,000 198,377 (121,623) Sales to pupils - lunch - 847 847 Sales to pupils - breakfast 49,626 5,735 (43,891) Sales to pupils - Ala Carte 430,619 568,632 138,013 Sales to pupils - other 100,000 77,353 (22,647) Sales to adults 17,000 3,959 (13,041) Other food service 16,500 11,508 (4,992) Admissions - athletic 41,435 55,187 13,752 Other activity revenue - 298,455 298,455 Rentals - 17,513 17,513 Fees 73,370 111,766 38,396 Contributions and donations from private sources 30,000 449,683 419,683 Drivers education fees 30,305 48,948 18,643 Refund of prior year expenditures - 564,394 564,394 Other 409,389 351,741 (57,648)
Total local sources 111,942,177 114,251,576 2,309,399
Flow-through revenue from one LEA to another LEAFlow-through revenue from state sources 15,974 15,496 (478)
Total flow-through 15,974 15,496 (478)
State sourcesGeneral state aid 106,891,716 115,810,724 8,919,008 Special education - private facility tuition 2,894,130 2,761,968 (132,162) Special education - extraordinary 3,977,060 3,988,817 11,757 Special education - personnel 5,517,676 5,286,944 (230,732) Special education - orphanage - individual 1,800,000 1,121,499 (678,501) Special education - orphanage - summer 200,000 - (200,000) Special education - summer school 168,443 - (168,443) Bilingual education - downstate - TPI 1,644,472 869,578 (774,894) State free lunch 92,213 66,231 (25,982) Driver education 223,555 282,657 59,102 Adult education from Illinois Community College Board 738,849 834,840 95,991 Truant alternative/optional education 209,106 208,177 (929)
CHANGES IN FUND BALANCE - BUDGET AND ACTUALSCHEDULE OF REVENUES, EXPENDITURES AND
ROCKFORD PUBLIC SCHOOLS, DISTRICT #205
For the Year Ended June 30, 2017
ROCKFORD, ILLINOIS
GENERAL FUND
(This schedule is continued on the following pages.)- 55 -

Variance with
Original and Final Budget
Final Budget Actual Over (Under)
REVENUES (Continued)
State sources (Continued)Early childhood - block grant 9,294,273$ 9,842,895$ 548,622$ Advanced placement classes - 37,481 37,481 Other restricted revenue from state sources 400,000 301,781 (98,219) On-behalf payments to TRS from the State 60,719,687 118,767,600 58,047,913
Total state sources 194,771,180 260,181,192 65,410,012
Federal sourcesFederal impact aid 15,000 - (15,000) Title IV - other 409,766 80,377 (329,389) National school lunch program 9,338,651 10,587,017 1,248,366 Special breakfast program 2,011,779 2,603,366 591,587 Summer food service program 235,000 202,465 (32,535) Child care commodity/SFS 13-adult day care - 4,237 4,237 Fresh fruits and veggies - 125,921 125,921 Commodity credit 830,000 1,036,443 206,443 Title I - low income 14,846,330 13,761,570 (1,084,760) Title I - other 70,000 1,254,018 1,184,018 Title IV - 21st century 1,620,000 1,306,666 (313,334) Federal - special education - preschool flow-through 283,560 244,959 (38,601) Federal - special education - IDEA - flow-through/low incident 8,203,397 6,661,512 (1,541,885) Federal - special education - IDEA - room and board 600,000 785,586 185,586 Federal - adult education 108,416 237,440 129,024 Race to the Top - Preschool flow-through 1,348,723 1,355,294 6,571 Title II - Immigrant education program 64,125 38,005 (26,120) Title III - English language acquisition 636,535 428,612 (207,923) McKinney education for homeless children 38,706 55,463 16,757 Title II - teacher quality 2,405,638 984,438 (1,421,200) Medicaid matching funds - administrative outreach 775,000 526,905 (248,095) Medicaid matching funds - fee-for-service program 2,100,000 2,070,723 (29,277) Other restricted revenue from federal sources 25,000 190,249 165,249
Total federal sources 45,965,626 44,541,266 (1,424,360)
Total revenues 352,694,957 418,989,530 66,294,573
EXPENDITURES
Instruction Regular programs
Salaries 66,918,098 64,053,984 (2,864,114) Employee benefits 24,186,209 23,312,802 (873,407) Purchased services 1,104,763 1,137,483 32,720 Supplies and materials 5,401,750 5,071,240 (330,510) Capital outlay 239,739 63,827 (175,912) Other objects 166,720 128,564 (38,156) Noncapitalized equipment - 453,553 453,553
For the Year Ended June 30, 2017
ROCKFORD PUBLIC SCHOOLS, DISTRICT #205
ROCKFORD, ILLINOIS
SCHEDULE OF REVENUES, EXPENDITURES AND CHANGES IN FUND BALANCE - BUDGET AND ACTUAL (Continued)
GENERAL FUND
(This schedule is continued on the following pages.)- 56 -

Variance with
Original and Final Budget
Final Budget Actual Over (Under)
For the Year Ended June 30, 2017
ROCKFORD PUBLIC SCHOOLS, DISTRICT #205
ROCKFORD, ILLINOIS
SCHEDULE OF REVENUES, EXPENDITURES AND CHANGES IN FUND BALANCE - BUDGET AND ACTUAL (Continued)
GENERAL FUND
EXPENDITURES (Continued)
Instruction (Continued)Regular programs (Continued)
Termination benefits 450,000$ -$ (450,000)$ On-behalf payments to TRS from the State 27,187,535 63,280,039 36,092,504
Total regular programs 125,654,814 157,501,492 31,846,678
Pre-K programsSalaries 5,220,609 5,133,417 (87,192) Employee benefits 2,737,593 2,732,710 (4,883) Purchased services 136,608 133,849 (2,759) Supplies and materials 132,796 523,701 390,905 Capital outlay 6,443 822 (5,621) Noncapitalized equipment - 3,884 3,884 On-behalf payments to TRS from the State 1,769,380 522,501 (1,246,879)
Total Pre-K programs 10,003,429 9,050,884 (952,545)
Special education programsSalaries 23,687,327 22,779,966 (907,361) Employee benefits 11,716,538 9,878,666 (1,837,872) Purchased services 143,534 658,272 514,738 Supplies and materials 285,451 247,488 (37,963) Capital outlay 55,500 - (55,500) Other objects 6,805,000 7,320,311 515,311 Noncapitalized equipment - 7,330 7,330 On-behalf payments to TRS from the State 8,122,943 14,854,329 6,731,386
Total special education programs 50,816,293 55,746,362 4,930,069
Special education programs Pre-KSalaries 1,489,632 1,451,921 (37,711) Employee benefits 774,491 647,768 (126,723) Purchased services 4,506 3,253 (1,253) Supplies and materials 5,767 4,865 (902) On-behalf payments to TRS from the State 496,403 605,929 109,526
Total special education programs Pre-K 2,770,799 2,713,736 (57,063)
Remedial and supplemental programs K-12Salaries 3,386,677 3,068,260 (318,417) Employee benefits 1,484,381 1,818,958 334,577 Purchased services 380,906 1,088,342 707,436 Supplies and materials 2,066,037 2,156,703 90,666 Capital outlay 121,027 - (121,027) Noncapitalized equipment - 253,211 253,211 On-behalf payments to TRS from the State 2,121,885 - (2,121,885)
Total remedial and supplemental programs K-12 9,560,913 8,385,474 (1,175,439)
(This schedule is continued on the following pages.)- 57 -

Variance with
Original and Final Budget
Final Budget Actual Over (Under)
For the Year Ended June 30, 2017
ROCKFORD PUBLIC SCHOOLS, DISTRICT #205
ROCKFORD, ILLINOIS
SCHEDULE OF REVENUES, EXPENDITURES AND CHANGES IN FUND BALANCE - BUDGET AND ACTUAL (Continued)
GENERAL FUND
EXPENDITURES (Continued)
Instruction (Continued)Adult/continuing education programs
Salaries 221,496$ 342,953$ 121,457$ Employee benefits 76,756 103,736 26,980 Purchased services 1,451 1,153 (298) On-behalf payments to TRS from the State 78,191 147,530 69,339
Total adult/continuing education programs 377,894 595,372 217,478
CTE programsSalaries 2,911,594 3,328,178 416,584 Employee benefits 1,141,230 1,095,592 (45,638) Purchased services 102,995 78,424 (24,571) Supplies and materials 247,000 214,219 (32,781) Capital outlay 500,000 314,770 (185,230) Other objects 235,000 60,090 (174,910) Noncapitalized equipment - 85,803 85,803 On-behalf payments to TRS from the State 1,143,515 2,551,123 1,407,608
Total CTE programs 6,281,334 7,728,199 1,446,865
Interscholastic programsSalaries 1,258,766 1,533,699 274,933 Employee benefits 205,379 280,048 74,669 Purchased services 69,123 277,178 208,055 Supplies and materials 167,384 305,431 138,047 Capital outlay 30,000 - (30,000) Other objects 7,000 75,434 68,434 Noncapitalized equipment - 7,001 7,001 On-behalf payments to TRS from the State 663,922 632,753 (31,169)
Total interscholastic programs 2,401,574 3,111,544 709,970
Summer school programsSalaries 439,900 876,210 436,310 Employee benefits 191,579 135,786 (55,793) Purchased services 500 176,390 175,890 Supplies and materials 106,710 80,913 (25,797) On-behalf payments to TRS from the State - 369,691 369,691
Total summer school programs 738,689 1,638,990 900,301
(This schedule is continued on the following pages.)- 58 -

Variance with
Original and Final Budget
Final Budget Actual Over (Under)
For the Year Ended June 30, 2017
ROCKFORD PUBLIC SCHOOLS, DISTRICT #205
ROCKFORD, ILLINOIS
SCHEDULE OF REVENUES, EXPENDITURES AND CHANGES IN FUND BALANCE - BUDGET AND ACTUAL (Continued)
GENERAL FUND
EXPENDITURES (Continued)
Instruction (Continued)Gifted programs
Salaries 4,203,110$ 4,193,580$ (9,530)$ Employee benefits 1,503,254 1,370,504 (132,750) Purchased services 66,800 30,302 (36,498) Supplies and materials 57,000 101,385 44,385 Noncapitalized equipment - 2,098 2,098 On-behalf payments to TRS from the State 1,923,717 3,472,609 1,548,892
Total gifted programs 7,753,881 9,170,478 1,416,597
Driver's education programsSalaries 147,448 491,067 343,619 Employee benefits 54,805 149,440 94,635 Purchased services - 16,727 16,727 Supplies and materials 4,000 12,869 8,869 On-behalf payments to TRS from the State 58,985 392,220 333,235
Total driver's education programs 265,238 1,062,323 797,085
Bilingual programsSalaries 9,085,011 9,320,717 235,706 Employee benefits 3,423,459 3,071,418 (352,041) Purchased services 66,864 12,105 (54,759) Supplies and materials 486,921 177,211 (309,710) Capital outlay 56,777 - (56,777) Other objects 100 - (100) On-behalf payments to TRS from the State 3,407,339 6,721,789 3,314,450
Total bilingual programs 16,526,471 19,303,240 2,776,769
Truant's alternative and optional programsSalaries 2,242,724 2,656,666 413,942 Employee benefits 885,480 868,496 (16,984) Purchased services 705,580 191,976 (513,604) Supplies and materials - 10,330 10,330 Other objects - 1,303,010 1,303,010 On-behalf payments to TRS from the State 809,754 1,282,467 472,713
Total truant's alternative and optional programs 4,643,538 6,312,945 1,669,407
Pre-K programs- private tuitionOther objects 1,342,000 - (1,342,000)
Total pre-K programs - private tuition 1,342,000 - (1,342,000)
Total instruction 239,136,867 282,321,039 43,184,172
(This schedule is continued on the following pages.)- 59 -

Variance with
Original and Final Budget
Final Budget Actual Over (Under)
For the Year Ended June 30, 2017
ROCKFORD PUBLIC SCHOOLS, DISTRICT #205
ROCKFORD, ILLINOIS
SCHEDULE OF REVENUES, EXPENDITURES AND CHANGES IN FUND BALANCE - BUDGET AND ACTUAL (Continued)
GENERAL FUND
EXPENDITURES (Continued)
Support servicesPupils
Attendance and social work services Salaries 2,412,336$ 2,529,520$ 117,184$ Employee benefits 853,041 851,399 (1,642) Purchased services 653,207 1,220,353 567,146 Supplies and materials 29,347 20,474 (8,873) On-behalf payments to TRS from the State 952,877 1,937,325 984,448
Total attendance and social work services 4,900,808 6,559,071 1,658,263
Guidance servicesSalaries 4,720,145 4,839,740 119,595 Employee benefits 1,664,781 1,549,925 (114,856) Purchased services 28,900 14,975 (13,925) Supplies and materials 64,195 11,825 (52,370) Capital outlay 4,000 - (4,000) On-behalf payments to TRS from the State 1,865,036 3,628,679 1,763,643
Total guidance services 8,347,057 10,045,144 1,698,087
Health servicesSalaries 3,338,522 3,306,856 (31,666) Employee benefits 1,263,739 1,049,448 (214,291) Purchased services 4,600 346,249 341,649 Supplies and materials 97,287 53,757 (43,530) Capital outlay 9,800 - (9,800) Other objects 3,000 2,833 (167) Noncapitalized equipment - 1,189 1,189 On-behalf payments to TRS from the State 962,761 1,910,621 947,860
Total health services 5,679,709 6,670,953 991,244
Psychological servicesSalaries 2,006,800 1,930,407 (76,393) Employee benefits 656,796 532,258 (124,538) Purchased services 65,440 150,346 84,906 Supplies and materials 47,000 30,786 (16,214) On-behalf payments to TRS from the State 900,478 1,493,390 592,912
Total psychological services 3,676,514 4,137,187 460,673
(This schedule is continued on the following pages.)- 60 -
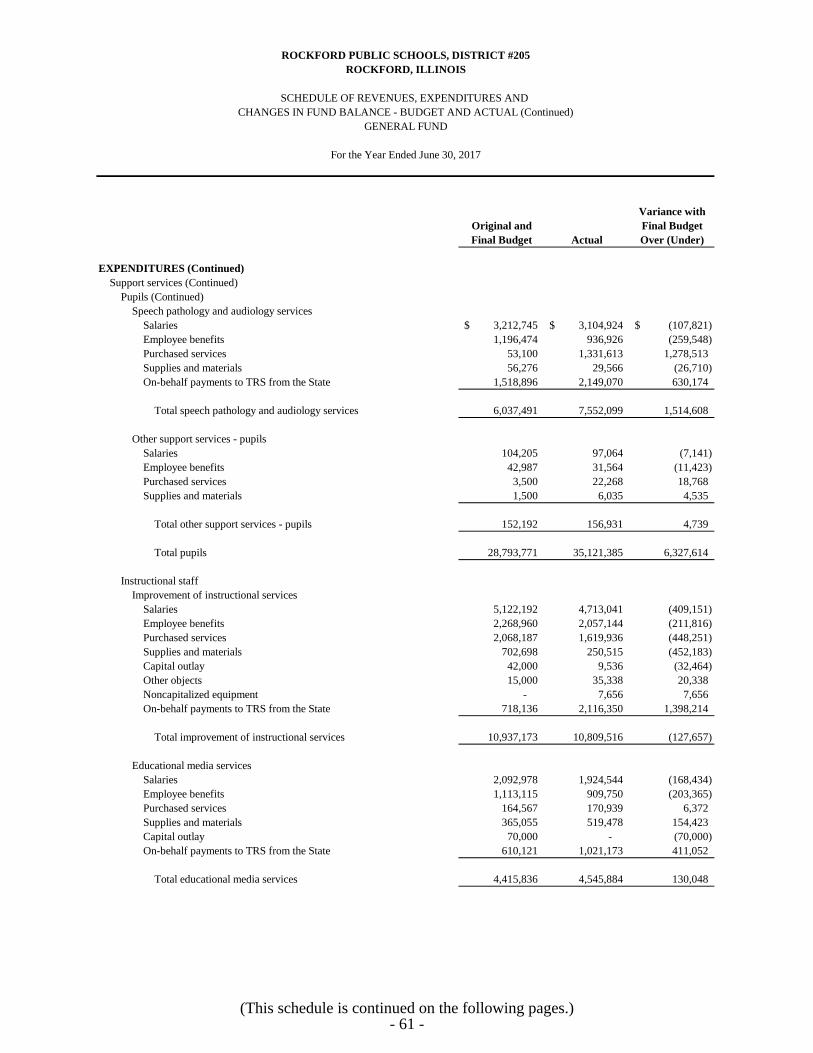
Variance with
Original and Final Budget
Final Budget Actual Over (Under)
For the Year Ended June 30, 2017
ROCKFORD PUBLIC SCHOOLS, DISTRICT #205
ROCKFORD, ILLINOIS
SCHEDULE OF REVENUES, EXPENDITURES AND CHANGES IN FUND BALANCE - BUDGET AND ACTUAL (Continued)
GENERAL FUND
EXPENDITURES (Continued)
Support services (Continued)Pupils (Continued)
Speech pathology and audiology servicesSalaries 3,212,745$ 3,104,924$ (107,821)$ Employee benefits 1,196,474 936,926 (259,548) Purchased services 53,100 1,331,613 1,278,513 Supplies and materials 56,276 29,566 (26,710) On-behalf payments to TRS from the State 1,518,896 2,149,070 630,174
Total speech pathology and audiology services 6,037,491 7,552,099 1,514,608
Other support services - pupilsSalaries 104,205 97,064 (7,141) Employee benefits 42,987 31,564 (11,423) Purchased services 3,500 22,268 18,768 Supplies and materials 1,500 6,035 4,535
Total other support services - pupils 152,192 156,931 4,739
Total pupils 28,793,771 35,121,385 6,327,614
Instructional staffImprovement of instructional services
Salaries 5,122,192 4,713,041 (409,151) Employee benefits 2,268,960 2,057,144 (211,816) Purchased services 2,068,187 1,619,936 (448,251) Supplies and materials 702,698 250,515 (452,183) Capital outlay 42,000 9,536 (32,464) Other objects 15,000 35,338 20,338 Noncapitalized equipment - 7,656 7,656 On-behalf payments to TRS from the State 718,136 2,116,350 1,398,214
Total improvement of instructional services 10,937,173 10,809,516 (127,657)
Educational media servicesSalaries 2,092,978 1,924,544 (168,434) Employee benefits 1,113,115 909,750 (203,365) Purchased services 164,567 170,939 6,372 Supplies and materials 365,055 519,478 154,423 Capital outlay 70,000 - (70,000) On-behalf payments to TRS from the State 610,121 1,021,173 411,052
Total educational media services 4,415,836 4,545,884 130,048
(This schedule is continued on the following pages.)- 61 -

Variance with
Original and Final Budget
Final Budget Actual Over (Under)
For the Year Ended June 30, 2017
ROCKFORD PUBLIC SCHOOLS, DISTRICT #205
ROCKFORD, ILLINOIS
SCHEDULE OF REVENUES, EXPENDITURES AND CHANGES IN FUND BALANCE - BUDGET AND ACTUAL (Continued)
GENERAL FUND
EXPENDITURES (Continued)
Support services (Continued) Instructional staff (Continued)
Assessment and testingSalaries 228,349$ 140,552$ (87,797)$ Employee benefits 52,290 32,938 (19,352) Purchased services 95,540 38,610 (56,930) Supplies and materials 428,786 300,994 (127,792) Other objects - 900 900 On-behalf payments to TRS from the State - 68,930 68,930
Total assessment and testing 804,965 582,924 (222,041)
Total instructional staff 16,157,974 15,938,324 (219,650)
General administrationBoard of Education services
Salaries - 199,070 199,070 Employee benefits - 23,215 23,215 Purchased services 118,050 1,358,860 1,240,810 Supplies and materials 5,050 25,602 20,552 Other objects 211,000 3,951 (207,049)
Total Board of Education services 334,100 1,610,698 1,276,598
Executive administration servicesSalaries 1,470,075 1,828,570 358,495 Employee benefits 404,608 427,880 23,272 Purchased services 392,653 76,394 (316,259) Supplies and materials 105,550 55,979 (49,571) Other objects 16,500 13,592 (2,908) Noncapitalized equipment - 2,839 2,839 On-behalf payments to TRS from the State 962,693 1,244,686 281,993
Total executive administration services 3,352,079 3,649,940 297,861
Special area administration servicesSalaries 3,872,079 3,608,433 (263,646) Employee benefits 1,367,676 1,272,838 (94,838) Purchased services 452,408 95,967 (356,441) Supplies and materials 145,550 42,813 (102,737) Capital outlay 11,200 - (11,200) Other objects 9,000 5,355 (3,645) Noncapitalized equipment - 949 949 On-behalf payments to TRS from the State 271,552 1,525,241 1,253,689
Total special area administration services 6,129,465 6,551,596 422,131
(This schedule is continued on the following pages.)- 62 -

Variance with
Original and Final Budget
Final Budget Actual Over (Under)
For the Year Ended June 30, 2017
ROCKFORD PUBLIC SCHOOLS, DISTRICT #205
ROCKFORD, ILLINOIS
SCHEDULE OF REVENUES, EXPENDITURES AND CHANGES IN FUND BALANCE - BUDGET AND ACTUAL (Continued)
GENERAL FUND
EXPENDITURES (Continued)
Support services (Continued) General administration (Continued)
Tort immunity servicesSalaries 212,440$ 53,941$ (158,499)$ Employee benefits 42,987 6,939 (36,048) Purchased services 884,750 - (884,750) Supplies and materials 14,826 - (14,826) Capital outlay 7,000 - (7,000)
Total tort immunity services 1,162,003 60,880 (1,101,123)
Total general administration 10,977,647 11,873,114 895,467
School administrationOffice of the principal services
Salaries 10,694,818 10,827,702 132,884 Employee benefits 3,553,407 2,613,904 (939,503) Purchased services 17,426 28,825 11,399 Supplies and materials 190,961 82,364 (108,597) Capital outlay - 23 23 Other objects - 825 825 Noncapitalized equipment - 9,891 9,891 On-behalf payments to TRS from the State 3,571,539 5,820,048 2,248,509
Total office of the principal services 18,028,151 19,383,582 1,355,431
Other support services - school administrationSalaries 161,492 354,232 192,740 Employee benefits 49,444 117,670 68,226 On-behalf payments to TRS from the State 69,708 292,235 222,527
Total other support services - school administration 280,644 764,137 483,493
Total school administration 18,308,795 20,147,719 1,838,924
BusinessDirection of business support services
Salaries 150,000 - (150,000) Employee benefits 20,000 - (20,000) Purchased services - 19,485 19,485 Supplies and materials - 304 304
Total direction of business support services 170,000 19,789 (150,211)
(This schedule is continued on the following pages.)- 63 -

Variance with
Original and Final Budget
Final Budget Actual Over (Under)
For the Year Ended June 30, 2017
ROCKFORD PUBLIC SCHOOLS, DISTRICT #205
ROCKFORD, ILLINOIS
SCHEDULE OF REVENUES, EXPENDITURES AND CHANGES IN FUND BALANCE - BUDGET AND ACTUAL (Continued)
GENERAL FUND
EXPENDITURES (Continued)
Support services (Continued) Business (Continued)
Fiscal servicesSalaries 853,228$ 1,037,710$ 184,482$ Employee benefits 255,082 296,076 40,994 Purchased services 1,491,665 274,395 (1,217,270) Supplies and materials 70,000 34,712 (35,288) Capital outlay - 487,187 487,187 Other objects 73,000 781,661 708,661 Noncapitalized equipment - 19,794 19,794 On-behalf payments to TRS from the State 56,082 78,636 22,554
Total fiscal services 2,799,057 3,010,171 211,114
Operation and maintenance of plant servicesSalaries 75,090 51,463 (23,627) Employee benefits 11,464 40,764 29,300 Purchased services - 85,883 85,883 Supplies and materials - 269,616 269,616 Capital outlay - 89,882 89,882
Total operation and maintenance of plant services 86,554 537,608 451,054
Pupil transportation servicesPurchased services 1,829,899 1,535,099 (294,800) Noncapitalized equipment - 1,107 1,107
Total pupil transportation services 1,829,899 1,536,206 (293,693)
Food serviceSalaries 2,931,931 3,205,638 273,707 Employee benefits 1,358,310 1,148,723 (209,587) Purchased services 340,382 151,072 (189,310) Supplies and materials 7,746,793 8,153,305 406,512 Capital outlay 206,000 267,818 61,818 Other objects 23,700 24,307 607 Noncapitalized equipment - 137,080 137,080
Total food service 12,607,116 13,087,943 480,827
Internal servicesSalaries 675,293 664,005 (11,288) Employee benefits 128,961 112,595 (16,366) Purchased services 214,842 265,313 50,471 Supplies and materials 144,600 57,027 (87,573) Capital outlay 152,500 227,152 74,652 Other objects 1,000 590 (410) Noncapitalized equipment - 2,705 2,705
Total internal service 1,317,196 1,329,387 12,191
Total business 18,809,822 19,521,104 711,282
(This schedule is continued on the following pages.)- 64 -
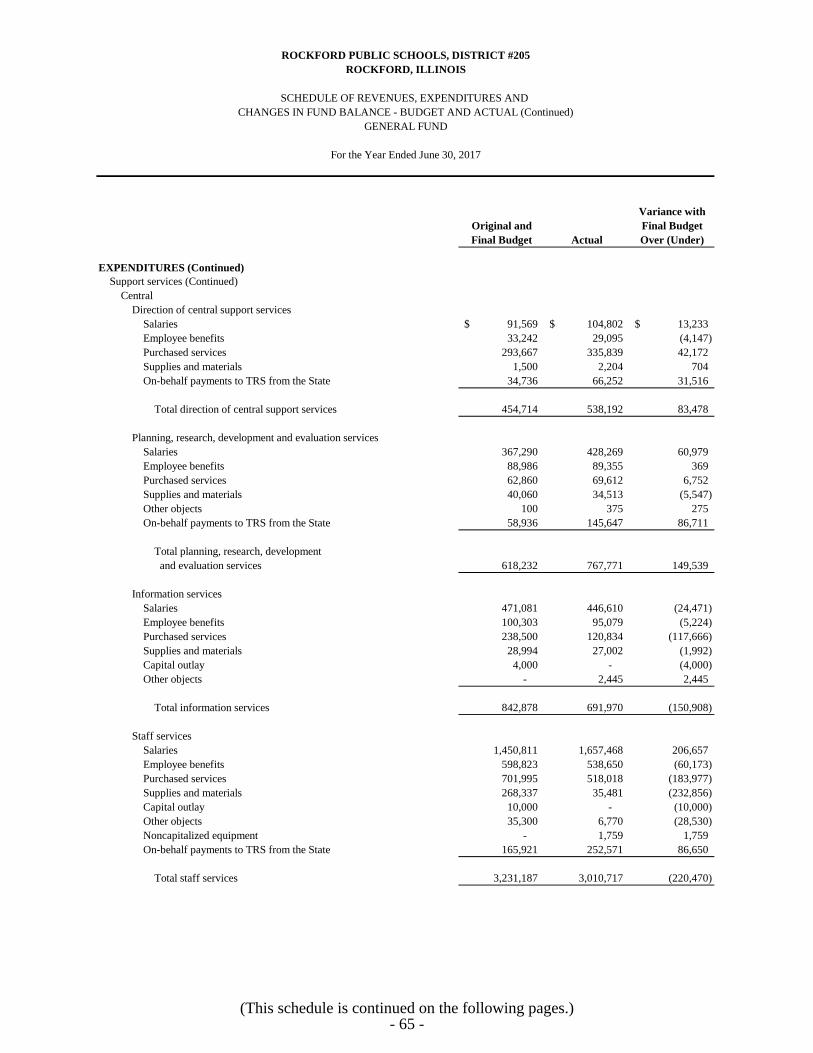
Variance with
Original and Final Budget
Final Budget Actual Over (Under)
For the Year Ended June 30, 2017
ROCKFORD PUBLIC SCHOOLS, DISTRICT #205
ROCKFORD, ILLINOIS
SCHEDULE OF REVENUES, EXPENDITURES AND CHANGES IN FUND BALANCE - BUDGET AND ACTUAL (Continued)
GENERAL FUND
EXPENDITURES (Continued)
Support services (Continued) Central
Direction of central support servicesSalaries 91,569$ 104,802$ 13,233$ Employee benefits 33,242 29,095 (4,147) Purchased services 293,667 335,839 42,172 Supplies and materials 1,500 2,204 704 On-behalf payments to TRS from the State 34,736 66,252 31,516
Total direction of central support services 454,714 538,192 83,478
Planning, research, development and evaluation servicesSalaries 367,290 428,269 60,979 Employee benefits 88,986 89,355 369 Purchased services 62,860 69,612 6,752 Supplies and materials 40,060 34,513 (5,547) Other objects 100 375 275 On-behalf payments to TRS from the State 58,936 145,647 86,711
Total planning, research, development and evaluation services 618,232 767,771 149,539
Information servicesSalaries 471,081 446,610 (24,471) Employee benefits 100,303 95,079 (5,224) Purchased services 238,500 120,834 (117,666) Supplies and materials 28,994 27,002 (1,992) Capital outlay 4,000 - (4,000) Other objects - 2,445 2,445
Total information services 842,878 691,970 (150,908)
Staff servicesSalaries 1,450,811 1,657,468 206,657 Employee benefits 598,823 538,650 (60,173) Purchased services 701,995 518,018 (183,977) Supplies and materials 268,337 35,481 (232,856) Capital outlay 10,000 - (10,000) Other objects 35,300 6,770 (28,530) Noncapitalized equipment - 1,759 1,759 On-behalf payments to TRS from the State 165,921 252,571 86,650
Total staff services 3,231,187 3,010,717 (220,470)
(This schedule is continued on the following pages.)- 65 -
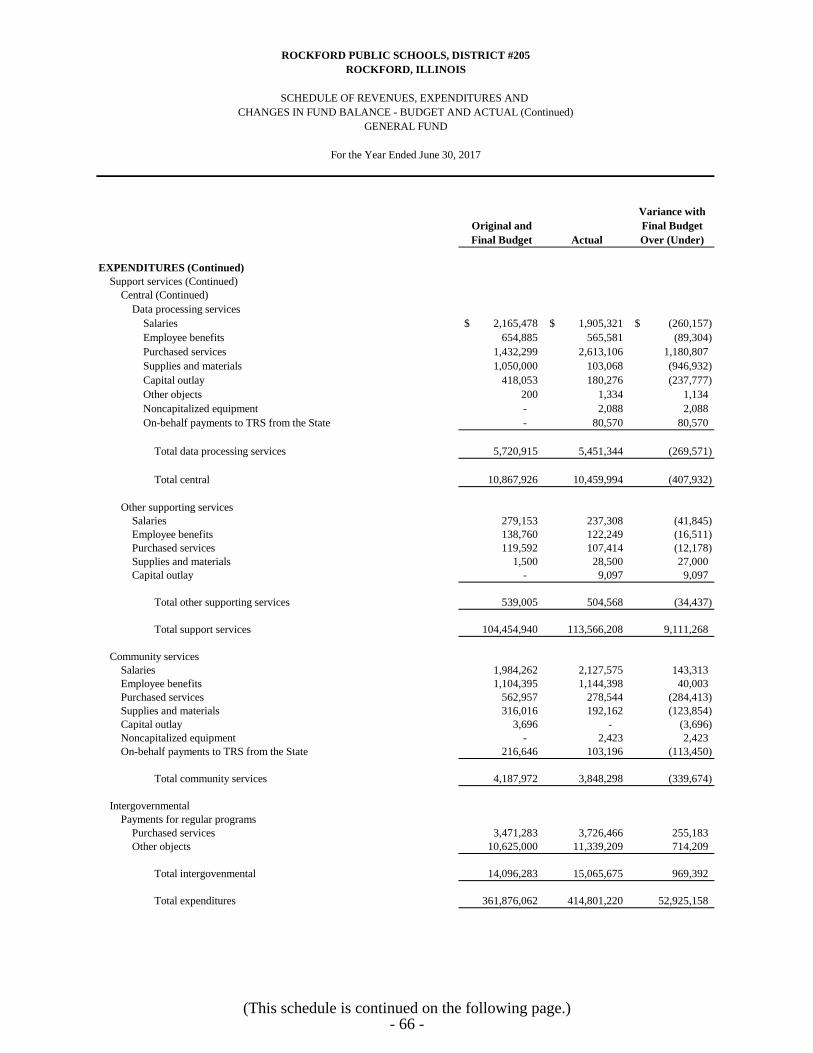
Variance with
Original and Final Budget
Final Budget Actual Over (Under)
For the Year Ended June 30, 2017
ROCKFORD PUBLIC SCHOOLS, DISTRICT #205
ROCKFORD, ILLINOIS
SCHEDULE OF REVENUES, EXPENDITURES AND CHANGES IN FUND BALANCE - BUDGET AND ACTUAL (Continued)
GENERAL FUND
EXPENDITURES (Continued)
Support services (Continued) Central (Continued)
Data processing servicesSalaries 2,165,478$ 1,905,321$ (260,157)$ Employee benefits 654,885 565,581 (89,304) Purchased services 1,432,299 2,613,106 1,180,807 Supplies and materials 1,050,000 103,068 (946,932) Capital outlay 418,053 180,276 (237,777) Other objects 200 1,334 1,134 Noncapitalized equipment - 2,088 2,088 On-behalf payments to TRS from the State - 80,570 80,570
Total data processing services 5,720,915 5,451,344 (269,571)
Total central 10,867,926 10,459,994 (407,932)
Other supporting servicesSalaries 279,153 237,308 (41,845) Employee benefits 138,760 122,249 (16,511) Purchased services 119,592 107,414 (12,178) Supplies and materials 1,500 28,500 27,000 Capital outlay - 9,097 9,097
Total other supporting services 539,005 504,568 (34,437)
Total support services 104,454,940 113,566,208 9,111,268
Community servicesSalaries 1,984,262 2,127,575 143,313 Employee benefits 1,104,395 1,144,398 40,003 Purchased services 562,957 278,544 (284,413) Supplies and materials 316,016 192,162 (123,854) Capital outlay 3,696 - (3,696) Noncapitalized equipment - 2,423 2,423 On-behalf payments to TRS from the State 216,646 103,196 (113,450)
Total community services 4,187,972 3,848,298 (339,674)
IntergovernmentalPayments for regular programs
Purchased services 3,471,283 3,726,466 255,183 Other objects 10,625,000 11,339,209 714,209
Total intergovenmental 14,096,283 15,065,675 969,392
Total expenditures 361,876,062 414,801,220 52,925,158
(This schedule is continued on the following page.)- 66 -

Variance with
Original and Final Budget
Final Budget Actual Over (Under)
For the Year Ended June 30, 2017
ROCKFORD PUBLIC SCHOOLS, DISTRICT #205
ROCKFORD, ILLINOIS
SCHEDULE OF REVENUES, EXPENDITURES AND CHANGES IN FUND BALANCE - BUDGET AND ACTUAL (Continued)
GENERAL FUND
EXCESS (DEFICIENCY) OF REVENUES OVER EXPENDITURES (9,181,105)$ 4,188,310$ 13,369,415$
OTHER FINANCING SOURCES (USES)
Transfers in (out) (400,000) - 400,000
Total other financing sources (uses) (400,000) - 400,000
NET CHANGE IN FUND BALANCE (9,581,105)$ 4,188,310 13,769,415$
FUND BALANCE, JULY 1 90,390,084
Prior period adjustment (964,762)
FUND BALANCE, JULY 1, RESTATED 89,425,322
FUND BALANCE, JUNE 30 93,613,632$
(See independent auditor's report.)- 67 -

Actuarial
Accrued UAAL as
Actuarial Actuarial Liability Unfunded a Percentage
Valuation Value of (AAL) AAL Funded Covered of Covered
Date Assets Entry-Age (UAAL) Ratio Payroll Payroll
July 1, (a) (b) (b) - (a) (a)/(b) (c) [(b-a)/c]
2016 N/A N/A N/A N/A N/A N/A
2015 -$ 40,302,987$ 40,302,987$ N/A 147,504,042$ 27.32%
2014 N/A N/A N/A N/A N/A N/A
2013 - 39,497,668 39,497,668 N/A 161,631,430 24.44%
2012 N/A N/A N/A N/A N/A N/A
2011 - 43,624,749 43,624,749 N/A 134,806,293 32.36%
N/A - not available
Note: The District did not have actuarial valuations as of July 1, 2012, 2014 and 2016.
ROCKFORD PUBLIC SCHOOLS, DISTRICT #205
OTHER POSTEMPLOYMENT BENEFIT PLAN
ROCKFORD, ILLINOIS
SCHEDULE OF FUNDING PROGRESS
June 30, 2017
(See independent auditor's report.)- 68 -

FISCAL YEAR END JUNE 30, 2015 2016 2017
Actuarially determined contribution 3,882,559$ 3,774,142$ 3,522,534$
Contributions in relation to the actuarially 3,882,559 3,774,142 3,522,534
CONTRIBUTION DEFICIENCY (Excess) -$ -$ -$
Covered-employee payroll 37,308,435$ 38,167,852$ 38,695,219$
Contributions as a percentage of covered-employee payroll 10.41% 9.89% 9.10%
Notes to Required Supplementary Information
Ultimately, this schedule should present information for the last ten years. However, until ten years ofinformation can be compiled, information will be presented for as many years as is available.
ROCKFORD PUBLIC SCHOOLS, DISTRICT #205
ROCKFORD, ILLINOIS
determined contribution
SCHEDULE OF EMPLOYER CONTRIBUTIONSILLINOIS MUNICIPAL RETIREMENT FUND
Last Three Fiscal Years
The information presented was determined as part of the actuarial valuation as of January 1 of the prioryear. Additional information as of the latest actuarial valuation presented is as follows: the actuarial costmethod was aggregate entry-age normal; the amortization method was level percentage of payroll, closed;and the amortization period was a 27-year closed period until the remaining period reaches 15 years (thena 15-year rolling period will be applied); the asset valuation method was five-year smoothed market witha 20% corridor; and the significant actuarial assumptions were price inflation of 2.75% annually, salaryincreases of 3.75% to 14.50% annually and an investment rate of return of 7.50% annually.
(See independent auditor's report.)- 69 -

Annual
Required Percentage
Fiscal Contribution Employer of ARC
Year (ARC) Contributions Contributed
2017 3,788,796$ 3,893,606$ 102.77%
2016 3,802,414 3,891,952 102.35%
2015 4,004,774 2,359,563 58.92%
2014 4,002,341 3,952,260 98.75%
2013 4,110,775 4,488,306 109.18%
2012 4,122,882 4,182,296 101.44%
ROCKFORD PUBLIC SCHOOLS, DISTRICT #205
OTHER POSTEMPLOYMENT BENEFIT PLAN
June 30, 2017
ROCKFORD, ILLINOIS
SCHEDULE OF EMPLOYER CONTRIBUTIONS
(See independent auditor's report.)- 70 -

FISCAL YEAR ENDED JUNE 30, 2015 2016 2017
Statutorily-required contribution 2,852,360$ 3,066,048$ 3,290,680$
Contributions in relation to the statutorily-required contribution 2,852,360 3,066,048 3,290,680
CONTRIBUTION DEFICIENCY (Excess) -$ -$ -$
District's covered-employee payroll 148,519,026$ 150,685,486$ 153,621,756$
Contributions as a percentage of covered-employee payroll 1.92% 2.03% 2.14%
Notes to Required Supplementary Information
Ultimately, this schedule should present information for the last ten years. However, until ten years ofinformation can be compiled, information will be presented for as many years as is available.
Changes of assumptions: Amounts reported in 2016 reflect an investment rate of return of 7.00%, an inflationrate of 2.50% and salary increases that vary by amount of service credit. Amounts reported in 2015 reflect aninvestment rate of return of 7.50%, an inflation rate of 3.00% and real return of 4.50%, and salary increasesthat vary by service credit. In 2014, assumptions used were an investment rate of return of 7.50%, an inflationrate of 3.00% and real return of 4.50%, and salary increases of 5.75%.
ROCKFORD PUBLIC SCHOOLS, DISTRICT #205
SCHEDULE OF EMPLOYER CONTRIBUTIONSTEACHERS' RETIREMENT SYSTEM OF THE STATE OF ILLINOIS
Last Three Fiscal Years
ROCKFORD, ILLINOIS
(See independent auditor's report.)- 71 -
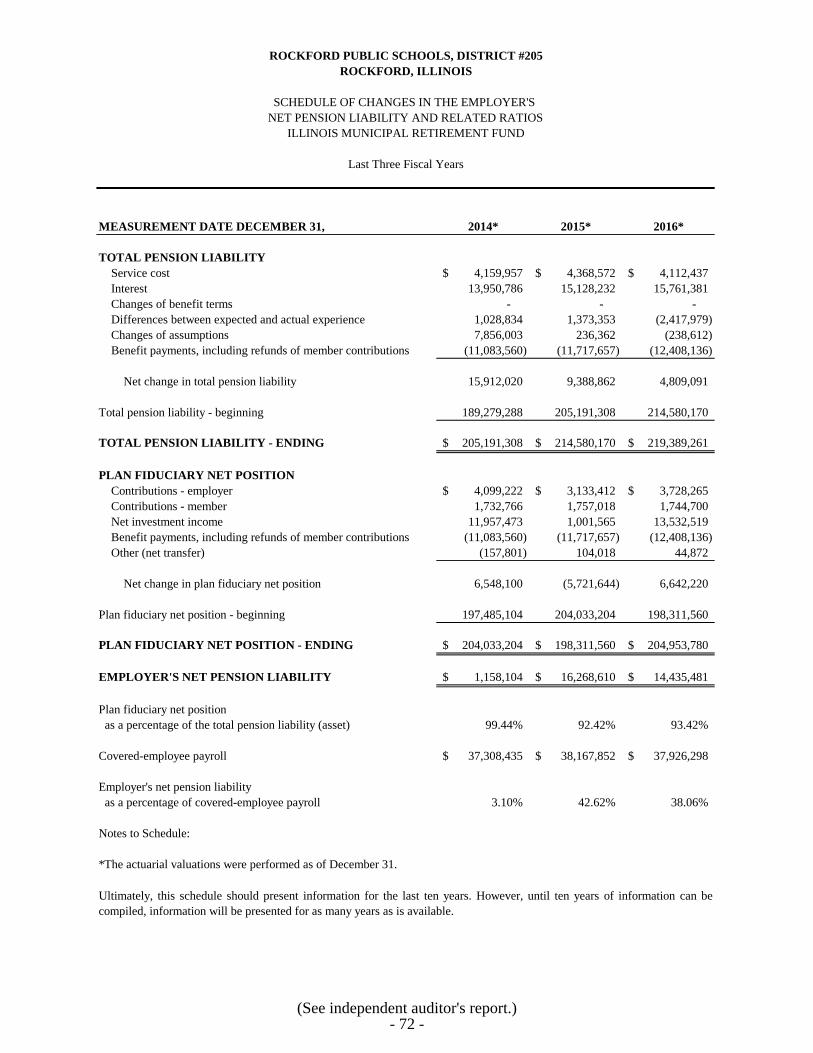
MEASUREMENT DATE DECEMBER 31, 2014* 2015* 2016*
TOTAL PENSION LIABILITY
Service cost 4,159,957$ 4,368,572$ 4,112,437$ Interest 13,950,786 15,128,232 15,761,381 Changes of benefit terms - - - Differences between expected and actual experience 1,028,834 1,373,353 (2,417,979) Changes of assumptions 7,856,003 236,362 (238,612) Benefit payments, including refunds of member contributions (11,083,560) (11,717,657) (12,408,136)
Net change in total pension liability 15,912,020 9,388,862 4,809,091
Total pension liability - beginning 189,279,288 205,191,308 214,580,170
TOTAL PENSION LIABILITY - ENDING 205,191,308$ 214,580,170$ 219,389,261$
PLAN FIDUCIARY NET POSITION
Contributions - employer 4,099,222$ 3,133,412$ 3,728,265$ Contributions - member 1,732,766 1,757,018 1,744,700 Net investment income 11,957,473 1,001,565 13,532,519 Benefit payments, including refunds of member contributions (11,083,560) (11,717,657) (12,408,136) Other (net transfer) (157,801) 104,018 44,872
Net change in plan fiduciary net position 6,548,100 (5,721,644) 6,642,220
Plan fiduciary net position - beginning 197,485,104 204,033,204 198,311,560
PLAN FIDUCIARY NET POSITION - ENDING 204,033,204$ 198,311,560$ 204,953,780$
EMPLOYER'S NET PENSION LIABILITY 1,158,104$ 16,268,610$ 14,435,481$
Plan fiduciary net position as a percentage of the total pension liability (asset) 99.44% 92.42% 93.42%
Covered-employee payroll 37,308,435$ 38,167,852$ 37,926,298$
Employer's net pension liability as a percentage of covered-employee payroll 3.10% 42.62% 38.06%
Notes to Schedule:
*The actuarial valuations were performed as of December 31.
ROCKFORD PUBLIC SCHOOLS, DISTRICT #205
ROCKFORD, ILLINOIS
Ultimately, this schedule should present information for the last ten years. However, until ten years of information can becompiled, information will be presented for as many years as is available.
SCHEDULE OF CHANGES IN THE EMPLOYER'S NET PENSION LIABILITY AND RELATED RATIOS
ILLINOIS MUNICIPAL RETIREMENT FUND
Last Three Fiscal Years
(See independent auditor's report.)- 72 -

MEASUREMENT DATE JUNE 30, 2014 2015 2016
District's proportion of the net pension liability 0.0883560716% 0.0684402657% 0.0866560420%
District's proportionate share of the net pension liability 53,771,979$ 44,835,269$ 68,402,854$
State's proportionate share of the net pension liability associated with the District 937,532,477 932,876,821 1,203,832,477
TOTAL 991,304,456$ 977,712,090$ 1,272,235,331$
District's covered-employee payroll 148,908,671$ 148,519,026$ 150,685,486$
District's proportionate share of the net pension liability as a percentage of its covered employee payroll 36.21% 30.19% 45.39%
Plan fiduciary net position as a percentage of the total pension liability 43.00% 43.00% 43.00%
Last Three Fiscal Years
Ultimately, this schedule should present information for the last ten years. However, until ten years of informationcan be compiled, information will be presented for as many years as is available.
ROCKFORD PUBLIC SCHOOLS, DISTRICT #205
ROCKFORD, ILLINOIS
SCHEDULE OF THE DISTRICT'S PROPORTIONATESHARE OF THE NET PENSION LIABILITY
TEACHER'S RETIREMENT SYSTEM OF THE STATE OF ILLINOIS
(See independent auditor's report.)- 73 -
ROCKFORD PUBLIC SCHOOLS, DISTRICT #205
ROCKFORD, ILLINOIS
NOTES TO REQUIRED SUPPLEMENTARY INFORMATION
June 30, 2017
1. BUDGETS AND BUDGETARY ACCOUNTING
The budgeted amounts for the governmental funds are adopted on the modified accrual basis, which is consistent with accounting principles generally accepted in the United States of America.
The Board of Education follows these procedures in establishing the budgetary data
reflected in the general purpose financial statements: a. The Administration submits to the Board of Education a proposed operating budget
for the fiscal year commencing July 1. The operating budget includes proposed expenditures and the means of financing them.
b. Public hearings are conducted and the proposed budget is available for inspection to
obtain taxpayer comments. c. Prior to September 30, the budget is legally adopted through passage of resolution.
By the last Tuesday in December, a tax levy resolution is filed with the county clerk to obtain tax revenues.
d. Management is authorized to transfer budget amounts, provided funds are transferred
between the same function and object codes. The Board of Education is authorized to transfer up to 10% of the total budget between functions within any fund; however, any revisions that alter the total expenditures of any fund must be approved by the Board of Education, after following the public hearing process mandated by law.
e. Formal budgetary integration is employed as a management control device during
the year for all governmental funds. f. All budget appropriations lapse at the end of the fiscal year. The budget amounts shown in the financial statements are as originally adopted because
there were no amendments during the past fiscal year.
- 74 -
ROCKFORD PUBLIC SCHOOLS, DISTRICT #205
ROCKFORD, ILLINOIS
NOTES TO REQUIRED SUPPLEMENTARY INFORMATION (Continued)
2. EXCESS EXPENDITURES OVER APPROPRIATIONS
For the year ended June 30, 2017, expenditures exceeded budget in the following funds: General Fund $ 52,925,158 Operations and Maintenance 615,697 Transportation 3,599,542 Municipal Retirement/Social Security Fund 544,301 Fire Prevention and Life Safety Fund 636,049
General Fund expenditure exceed budget due to on-behalf payments recorded in the amount of $118,767,600. The amounts are provided by TRS after June 30, 2017 and cannot be accurately estimated by the District and was budgeted at $60,719,687.
- 75 -

SUPPLEMENTARY INFORMATION

Operations
and
General Maintenance Transportation
REVENUES
Property taxes 94,644,958$ 14,636,624$ 17,131,374$ Corporate personal property replacement taxes 14,211,296 8,357,421 - State aid 260,196,688 - 14,918,309 Federal aid 44,541,266 - - Investment income 198,377 299 49,157 Refund of prior year's expenditures 564,394 1,268 - Payments of surplus monies from TIF districts - 13,061 - Other 4,632,551 1,742,786 54,869
Total revenues 418,989,530 24,751,459 32,153,709
EXPENDITURES
CurrentInstruction
Regular programs 157,437,665 - - Special programs 75,895,634 - - Other instructional programs 48,608,321 - -
Support servicesPupils 35,121,385 - 84,618 Instructional staff 15,928,788 - - General administration 11,873,114 - - School administration 20,147,696 - - Business 18,449,065 - - Transportation - 17,081 20,841,364 Operations and maintenance - 23,506,730 - Central 10,279,718 - - Other supporting services 504,568 523,804 -
Community services 3,848,298 - - Intergovernmental
Payments to other districts and government units 15,065,675 - - Capital outlay 1,641,293 2,945,713 2,759,475
Total expenditures 414,801,220 26,993,328 23,685,457
NET CHANGES IN FUND BALANCE 4,188,310 (2,241,869) 8,468,252
FUND BALANCES (DEFICIT), JULY 1 90,390,084 (2,256,716) 10,252,166
Prior period adjustment (964,762) - -
FUND BALANCE (DEFICIT), JULY 1, RESTATED 89,425,322 (2,256,716) 10,252,166
FUND BALANCES (DEFICIT), JUNE 30 93,613,632$ (4,498,585)$ 18,720,418$
For the Year Ended June 30, 2017
ROCKFORD PUBLIC SCHOOLS, DISTRICT #205
ROCKFORD, ILLINOIS
SCHEDULE OF REVENUES, EXPENDITURES AND CHANGES IN FUND BALANCES
OPERATING FUNDS
- 76 -

Municipal
Retirement/
Social Tort
Security Immunity Total
6,258,898$ 5,907,035$ 138,578,889$ 971,098 - 23,539,815
- 377,962 275,492,959 - - 44,541,266
25,413 46,873 320,119 - - 565,662 - - 13,061 - 288,333 6,718,539
7,255,409 6,620,203 489,770,310
874,297 - 158,311,962 961,756 - 76,857,390 549,280 - 49,157,601
463,951 - 35,669,954 162,188 - 16,090,976 245,668 6,210,668 18,329,450 687,964 - 20,835,660
3,197,903 - 21,646,968 - - 20,858,445 - - 23,506,730
570,637 - 10,850,355 86,030 1,114,402 39,966 - 3,888,264
- - 15,065,675 - 243,997 7,590,478
7,839,640 6,454,665 479,774,310
(584,231) 165,538 9,996,000
2,251,911 10,630,217 111,267,662
382,826 259,237 (322,699)
2,634,737 10,889,454 110,944,963
2,050,506$ 11,054,992$ 120,940,963$
(See independent auditor's report.)- 77 -
MAJOR DEBT SERVICE AND CAPITAL PROJECTS FUNDS

Variance with
Original and Final Budget
Final Budget Actual Over (Under)
REVENUES
Local sourcesDebt service property taxes 13,406,220$ 13,067,090$ (339,130)$ Corporate personal property replacement taxes 2,500,000 2,500,000 - Investment income 48,000 54,654 6,654
Federal sourcesBuild America Bond interest reimbursement - 1,103,984 1,103,984
Total revenues 15,954,220 16,725,728 771,508
EXPENDITURES
Debt servicePayments on long-term debt
Principal payments on long-term debt 7,627,774 9,290,000 1,662,226 Interest on long-term debt 8,581,351 5,604,929 (2,976,422)
Total expenditures 16,209,125 14,894,929 (1,314,196)
NET CHANGE IN FUND BALANCE (254,905)$ 1,830,799 2,085,704$
FUND BALANCE, JULY 1 2,138,318
FUND BALANCE, JUNE 30 3,969,117$
ROCKFORD PUBLIC SCHOOLS, DISTRICT #205
ROCKFORD, ILLINOIS
For the Year Ended June 30, 2017
BOND AND INTEREST FUNDCHANGES IN FUND BALANCE - BUDGET AND ACTUAL
SCHEDULE OF REVENUES, EXPENDITURES AND
(See independent auditor's report.)- 78 -
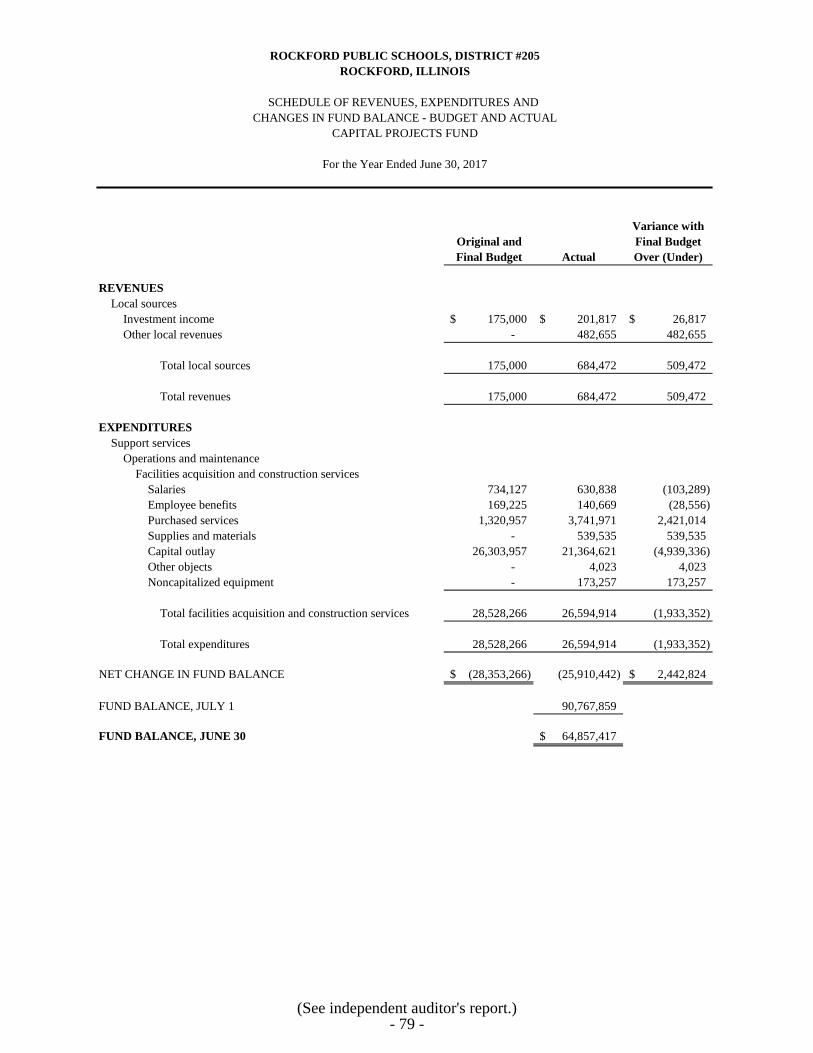
Variance with
Original and Final Budget
Final Budget Actual Over (Under)
REVENUES
Local sourcesInvestment income 175,000$ 201,817$ 26,817$ Other local revenues - 482,655 482,655
Total local sources 175,000 684,472 509,472
Total revenues 175,000 684,472 509,472
EXPENDITURES
Support servicesOperations and maintenance
Facilities acquisition and construction services Salaries 734,127 630,838 (103,289) Employee benefits 169,225 140,669 (28,556) Purchased services 1,320,957 3,741,971 2,421,014 Supplies and materials - 539,535 539,535 Capital outlay 26,303,957 21,364,621 (4,939,336) Other objects - 4,023 4,023 Noncapitalized equipment - 173,257 173,257
Total facilities acquisition and construction services 28,528,266 26,594,914 (1,933,352)
Total expenditures 28,528,266 26,594,914 (1,933,352)
NET CHANGE IN FUND BALANCE (28,353,266)$ (25,910,442) 2,442,824$
FUND BALANCE, JULY 1 90,767,859
FUND BALANCE, JUNE 30 64,857,417$
ROCKFORD PUBLIC SCHOOLS, DISTRICT #205
For the Year Ended June 30, 2017
SCHEDULE OF REVENUES, EXPENDITURES AND
CAPITAL PROJECTS FUND
ROCKFORD, ILLINOIS
CHANGES IN FUND BALANCE - BUDGET AND ACTUAL
(See independent auditor's report.)- 79 -

MAJOR GENERAL FUND

Working
Educational Cash
Accounts Accounts Total
Cash and investments 69,191,707$ 32,658,433$ 101,850,140$ Receivables
Interest - 109,890 109,890 Property taxes, net 44,021,847 453,942 44,475,789 Intergovernmental 22,692,223 - 22,692,223 Other 693,665 - 693,665
Prepaid items 1,251,072 - 1,251,072 Due from other funds 443,284 - 443,284
TOTAL ASSETS 138,293,798$ 33,222,265$ 171,516,063$
LIABILITIES
Accounts payable 7,692,375$ 91,487$ 7,783,862$ Salaries and wages payable 16,631,426 - 16,631,426 Unearned revenue 77,849 - 77,849 Due to other governments 1,116,776 - 1,116,776 Other current liabilities 408,821 - 408,821
Total liabilities 25,927,247 91,487 26,018,734
DEFERRED INFLOWS OF RESOURCES
Unavailable revenue - property taxes 47,062,640 485,333 47,547,973 Unavailable revenue 4,335,724 - 4,335,724
Total deferred inflows of resources 51,398,364 485,333 51,883,697
FUND BALANCES
Nonspendable 1,251,072 - 1,251,072 Assigned for
Working cash - 32,645,445 32,645,445 Unassigned 59,717,115 - 59,717,115
Total fund balances 60,968,187 32,645,445 93,613,632
TOTAL LIABILITIES, DEFERRED INFLOWS
OF RESOURCES AND FUND BALANCES 138,293,798$ 33,222,265$ 171,516,063$
OF RESOURCES AND FUND BALANCES
ROCKFORD PUBLIC SCHOOLS, DISTRICT #205
GENERAL FUND - BY ACCOUNT
ROCKFORD, ILLINOIS
ASSETS
LIABILITIES, DEFERRED INFLOWS
COMBINING BALANCE SHEET
June 30, 2017
(See independent auditor's report.)- 80 -

Working
Educational Cash
Accounts Accounts Total
REVENUES
replacement taxesProperty taxes 93,674,113$ 970,845$ 94,644,958$ Corporate personal property replacement taxes 14,211,296 - 14,211,296 State aid 260,196,688 - 260,196,688 Federal aid 44,541,266 - 44,541,266 Investment income 239,625 (41,248) 198,377 Refund of prior year expenditures 564,394 - 564,394 Other 4,632,551 - 4,632,551
Total revenues 418,059,933 929,597 418,989,530
EXPENDITURES
CurrentInstruction
Regular programs 157,437,665 - 157,437,665 Special programs 75,895,634 - 75,895,634 Other instructional programs 48,608,321 - 48,608,321
Support servicesPupils 35,121,385 - 35,121,385 Instructional staff 15,928,788 - 15,928,788 General administration 11,873,114 - 11,873,114 School administration 20,147,696 - 20,147,696 Business 18,449,065 - 18,449,065 Central 10,279,718 - 10,279,718 Other supporting services 504,568 - 504,568
Community services 3,848,298 - 3,848,298 Intergovernmental 15,065,675 - 15,065,675 Capital outlay 1,641,293 - 1,641,293
Total expenditures 414,801,220 - 414,801,220
NET CHANGE IN FUND BALANCE 3,258,713 929,597 4,188,310
FUND BALANCE, JULY 1 58,674,236 31,715,848 90,390,084
Prior period adjustment (964,762) - (964,762)
FUND BALANCE, JULY 1, RESTATED 57,709,474 31,715,848 89,425,322
FUND BALANCE, JUNE 30 60,968,187$ 32,645,445$ 93,613,632$
ROCKFORD PUBLIC SCHOOLS, DISTRICT #205
For the Year Ended June 30, 2017
GENERAL FUND - BY ACCOUNT
COMBINING SCHEDULE OF REVENUES, EXPENDITURES ANDCHANGES IN FUND BALANCE
ROCKFORD, ILLINOIS
(See independent auditor's report.)- 81 -

Variance with
Original and Final Budget
Final Budget Actual Over (Under)
REVENUES
replacement taxesLocal sourcesEducational property taxes 78,564,232$ 78,062,148$ (502,084)$ Special education property taxes 15,712,846 15,611,965 (100,881) Corporate personal property replacement taxes 12,483,818 14,211,296 1,727,478 Regular tuition from pupils or parents (in state) 426,495 730,347 303,852 Regular tuition from other districts (in state) 331,032 - (331,032) Regular tuition from other sources (out of state) - 10,127 10,127 Summer school - tuition from pupils and parents (in state) 58,155 134,317 76,162 Special education - tuition from other LEA's (in state) 1,837,427 1,701,163 (136,264) Adult - tuition from pupils or parents (in state) 27,875 55,270 27,395 Investment income 200,000 239,625 39,625 Sales to pupils - lunch - 847 847 Sales to pupils - breakfast 49,626 5,735 (43,891) Sales to pupils - Ala Carte 430,619 568,632 138,013 Sales to pupils - other 100,000 77,353 (22,647) Sales to adults 17,000 3,959 (13,041) Other food service 16,500 11,508 (4,992) Admissions - athletic 41,435 55,187 13,752 Other activity revenue - 298,455 298,455 Rentals - 17,513 17,513 Fees 73,370 111,766 38,396 Contributions and donations from private sources 30,000 449,683 419,683 Drivers education fees 30,305 48,948 18,643 Refund of prior year expenditures - 564,394 564,394 Other 409,389 351,741 (57,648)
Total local sources 110,840,124 113,321,979 2,481,855
Flow-through revenue from one LEA to another LEAFlow-through revenue from state sources 15,974 15,496 (478)
Total flow-through revenue from one LEA to another LEA 15,974 15,496 (478)
State sourcesGeneral state aid 106,891,716 115,810,724 8,919,008 Special education - private facility tuition 2,894,130 2,761,968 (132,162) Special education - extraordinary 3,977,060 3,988,817 11,757 Special education - personnel 5,517,676 5,286,944 (230,732) Special education - orphanage - individual 1,800,000 1,121,499 (678,501) Special education - orphanage - summer 200,000 - (200,000) Special education - summer school 168,443 - (168,443) Bilingual education - downstate - TPI 1,644,472 869,578 (774,894) State free lunch 92,213 66,231 (25,982) Driver education 223,555 282,657 59,102 Adult education from Illinois Community College Board 738,849 834,840 95,991 Truant alternative/optional education 209,106 208,177 (929)
ROCKFORD PUBLIC SCHOOLS, DISTRICT #205
EDUCATIONAL ACCOUNTS
For the Year Ended June 30, 2017
ROCKFORD, ILLINOIS
CHANGES IN FUND BALANCE - BUDGET AND ACTUAL SCHEDULE OF REVENUES, EXPENDITURES AND
(This schedule is continued on the following pages.)- 82 -
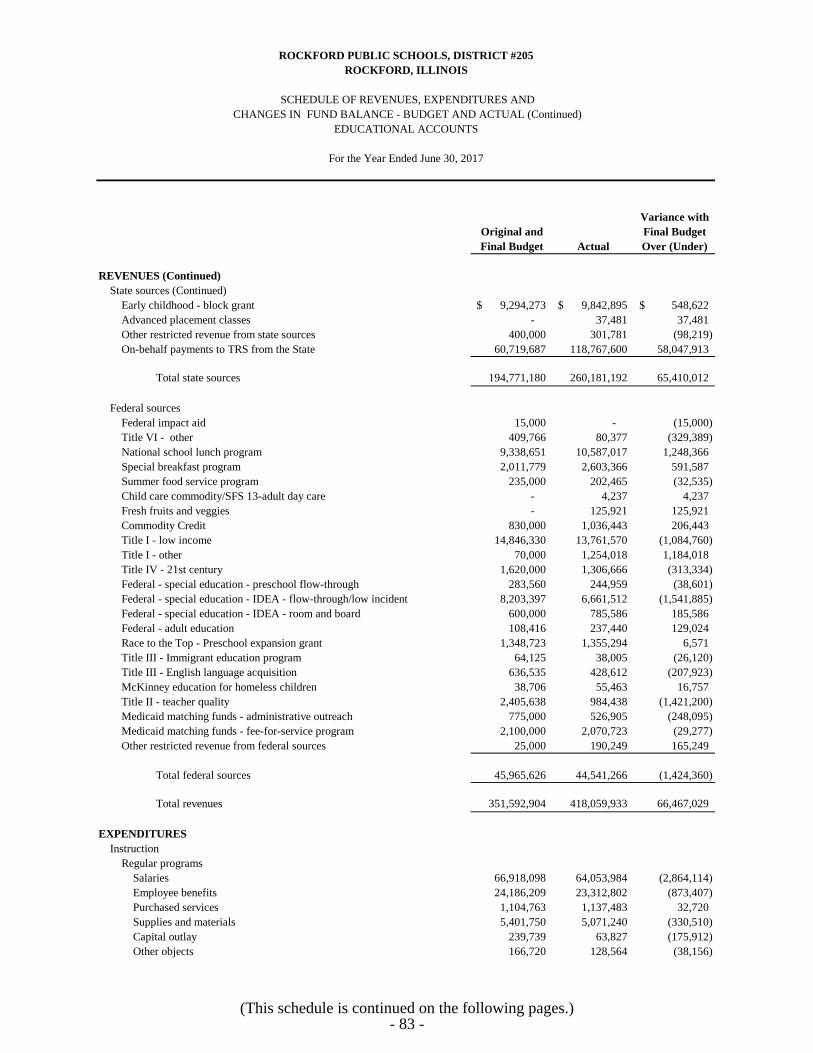
Variance with
Original and Final Budget
Final Budget Actual Over (Under)
REVENUES (Continued)
State sources (Continued)Early childhood - block grant 9,294,273$ 9,842,895$ 548,622$ Advanced placement classes - 37,481 37,481 Other restricted revenue from state sources 400,000 301,781 (98,219) On-behalf payments to TRS from the State 60,719,687 118,767,600 58,047,913
Total state sources 194,771,180 260,181,192 65,410,012
Federal sourcesFederal impact aid 15,000 - (15,000) Title VI - other 409,766 80,377 (329,389) National school lunch program 9,338,651 10,587,017 1,248,366 Special breakfast program 2,011,779 2,603,366 591,587 Summer food service program 235,000 202,465 (32,535) Child care commodity/SFS 13-adult day care - 4,237 4,237 Fresh fruits and veggies - 125,921 125,921 Commodity Credit 830,000 1,036,443 206,443 Title I - low income 14,846,330 13,761,570 (1,084,760) Title I - other 70,000 1,254,018 1,184,018 Title IV - 21st century 1,620,000 1,306,666 (313,334) Federal - special education - preschool flow-through 283,560 244,959 (38,601) Federal - special education - IDEA - flow-through/low incident 8,203,397 6,661,512 (1,541,885) Federal - special education - IDEA - room and board 600,000 785,586 185,586 Federal - adult education 108,416 237,440 129,024 Race to the Top - Preschool expansion grant 1,348,723 1,355,294 6,571 Title III - Immigrant education program 64,125 38,005 (26,120) Title III - English language acquisition 636,535 428,612 (207,923) McKinney education for homeless children 38,706 55,463 16,757 Title II - teacher quality 2,405,638 984,438 (1,421,200) Medicaid matching funds - administrative outreach 775,000 526,905 (248,095) Medicaid matching funds - fee-for-service program 2,100,000 2,070,723 (29,277) Other restricted revenue from federal sources 25,000 190,249 165,249
Total federal sources 45,965,626 44,541,266 (1,424,360)
Total revenues 351,592,904 418,059,933 66,467,029
EXPENDITURES
Instruction Regular programs
Salaries 66,918,098 64,053,984 (2,864,114) Employee benefits 24,186,209 23,312,802 (873,407) Purchased services 1,104,763 1,137,483 32,720 Supplies and materials 5,401,750 5,071,240 (330,510) Capital outlay 239,739 63,827 (175,912) Other objects 166,720 128,564 (38,156)
EDUCATIONAL ACCOUNTS
For the Year Ended June 30, 2017
ROCKFORD PUBLIC SCHOOLS, DISTRICT #205
ROCKFORD, ILLINOIS
SCHEDULE OF REVENUES, EXPENDITURES AND CHANGES IN FUND BALANCE - BUDGET AND ACTUAL (Continued)
(This schedule is continued on the following pages.)- 83 -

Variance with
Original and Final Budget
Final Budget Actual Over (Under)
EDUCATIONAL ACCOUNTS
For the Year Ended June 30, 2017
ROCKFORD PUBLIC SCHOOLS, DISTRICT #205
ROCKFORD, ILLINOIS
SCHEDULE OF REVENUES, EXPENDITURES AND CHANGES IN FUND BALANCE - BUDGET AND ACTUAL (Continued)
EXPENDITURES (Continued)
Instruction (Continued)Regular programs (Continued)
Noncapitalized equipment -$ 453,553$ 453,553$ Termination benefits 450,000 - (450,000) On-behalf payments to TRS from the State 27,187,535 63,280,039 36,092,504
Total regular programs 125,654,814 157,501,492 31,846,678
Pre-K programsSalaries 5,220,609 5,133,417 (87,192) Employee benefits 2,737,593 2,732,710 (4,883) Purchased services 136,608 133,849 (2,759) Supplies and materials 132,796 523,701 390,905 Capital outlay 6,443 822 (5,621) Noncapitalized equipment - 3,884 3,884 On-behalf payments to TRS from the State 1,769,380 522,501 (1,246,879)
Total Pre-K programs 10,003,429 9,050,884 (952,545)
Special education programsSalaries 23,687,327 22,779,966 (907,361) Employee benefits 11,716,538 9,878,666 (1,837,872) Purchased services 143,534 658,272 514,738 Supplies and materials 285,451 247,488 (37,963) Capital outlay 55,500 - (55,500) Other objects 6,805,000 7,320,311 515,311 Noncapitalized equipment - 7,330 7,330 On-behalf payments to TRS from the State 8,122,943 14,854,329 6,731,386
Total special education programs 50,816,293 55,746,362 4,930,069
Special education programs Pre-KSalaries 1,489,632 1,451,921 (37,711) Employee benefits 774,491 647,768 (126,723) Purchased services 4,506 3,253 (1,253) Supplies and materials 5,767 4,865 (902) On-behalf payments to TRS from the State 496,403 605,929 109,526
Total special education programs Pre-K 2,770,799 2,713,736 (57,063)
Remedial and supplemental programs K-12Salaries 3,386,677 3,068,260 (318,417) Employee benefits 1,484,381 1,818,958 334,577 Purchased services 380,906 1,088,342 707,436 Supplies and materials 2,066,037 2,156,703 90,666 Capital outlay 121,027 - (121,027)
(This schedule is continued on the following pages.)- 84 -

Variance with
Original and Final Budget
Final Budget Actual Over (Under)
EDUCATIONAL ACCOUNTS
For the Year Ended June 30, 2017
ROCKFORD PUBLIC SCHOOLS, DISTRICT #205
ROCKFORD, ILLINOIS
SCHEDULE OF REVENUES, EXPENDITURES AND CHANGES IN FUND BALANCE - BUDGET AND ACTUAL (Continued)
EXPENDITURES (Continued)
Instruction (Continued) Remedial and supplemental programs K-12 (Continued)
Noncapitalized equipment -$ 253,211$ 253,211$ On-behalf payments to TRS from the State 2,121,885 - (2,121,885)
Total remedial and supplemental programs K-12 9,560,913 8,385,474 (1,175,439)
Adult/continuing education programsSalaries 221,496 342,953 121,457 Employee benefits 76,756 103,736 26,980 Purchased services 1,451 1,153 (298) On-behalf payments to TRS from the State 78,191 147,530 69,339
Total adult/continuing education programs 377,894 595,372 217,478
CTE programsSalaries 2,911,594 3,328,178 416,584 Employee benefits 1,141,230 1,095,592 (45,638) Purchased services 102,995 78,424 (24,571) Supplies and materials 247,000 214,219 (32,781) Capital outlay 500,000 314,770 (185,230) Other objects 235,000 60,090 (174,910) Noncapitalized equipment - 85,803 85,803 On-behalf payments to TRS from the State 1,143,515 2,551,123 1,407,608
Total CTE programs 6,281,334 7,728,199 1,446,865
Interscholastic programsSalaries 1,258,766 1,533,699 274,933 Employee benefits 205,379 280,048 74,669 Purchased services 69,123 277,178 208,055 Supplies and materials 167,384 305,431 138,047 Capital outlay 30,000 - (30,000) Other objects 7,000 75,434 68,434 Noncapitalized equipment - 7,001 7,001 On-behalf payments to TRS from the State 663,922 632,753 (31,169)
Total interscholastic programs 2,401,574 3,111,544 709,970
Summer school programsSalaries 439,900 876,210 436,310 Employee benefits 191,579 135,786 (55,793) Purchased services 500 176,390 175,890 Supplies and materials 106,710 80,913 (25,797) On-behalf payments to TRS from the State - 369,691 369,691
Total summer school programs 738,689 1,638,990 900,301
(This schedule is continued on the following pages.)- 85 -

Variance with
Original and Final Budget
Final Budget Actual Over (Under)
EDUCATIONAL ACCOUNTS
For the Year Ended June 30, 2017
ROCKFORD PUBLIC SCHOOLS, DISTRICT #205
ROCKFORD, ILLINOIS
SCHEDULE OF REVENUES, EXPENDITURES AND CHANGES IN FUND BALANCE - BUDGET AND ACTUAL (Continued)
EXPENDITURES (Continued)
Instruction (Continued)Gifted programs
Salaries 4,203,110$ 4,193,580$ (9,530)$ Employee benefits 1,503,254 1,370,504 (132,750) Purchased services 66,800 30,302 (36,498) Supplies and materials 57,000 101,385 44,385 Noncapitalized equipment - 2,098 2,098 On-behalf payments to TRS from the State 1,923,717 3,472,609 1,548,892
Total gifted programs 7,753,881 9,170,478 1,416,597
Driver's education programsSalaries 147,448 491,067 343,619 Employee benefits 54,805 149,440 94,635 Purchased services - 16,727 16,727 Supplies and materials 4,000 12,869 8,869 On-behalf payments to TRS from the State 58,985 392,220 333,235
Total driver's education program 265,238 1,062,323 797,085
Bilingual programsSalaries 9,085,011 9,320,717 235,706 Employee benefits 3,423,459 3,071,418 (352,041) Purchased services 66,864 12,105 (54,759) Supplies and materials 486,921 177,211 (309,710) Capital outlay 56,777 - (56,777) Other objects 100 - (100) On-behalf payments to TRS from the State 3,407,339 6,721,789 3,314,450
Total bilingual programs 16,526,471 19,303,240 2,776,769
Truant's alternative and optional programsSalaries 2,242,724 2,656,666 413,942 Employee benefits 885,480 868,496 (16,984) Purchased services 705,580 191,976 (513,604) Supplies and materials - 10,330 10,330 Other objects - 1,303,010 1,303,010 On-behalf payments to TRS from the State 809,754 1,282,467 472,713
Total truant's alternative and optional programs 4,643,538 6,312,945 1,669,407
Pre-K programs- private tuitionOther objects 1,342,000 - (1,342,000)
Total pre-K programs - private tuition 1,342,000 - (1,342,000)
Total instruction 239,136,867 282,321,039 43,184,172
(This schedule is continued on the following pages.)- 86 -

Variance with
Original and Final Budget
Final Budget Actual Over (Under)
EDUCATIONAL ACCOUNTS
For the Year Ended June 30, 2017
ROCKFORD PUBLIC SCHOOLS, DISTRICT #205
ROCKFORD, ILLINOIS
SCHEDULE OF REVENUES, EXPENDITURES AND CHANGES IN FUND BALANCE - BUDGET AND ACTUAL (Continued)
EXPENDITURES (Continued)
Support servicesPupils
Attendance and social work services Salaries 2,412,336$ 2,529,520$ 117,184$ Employee benefits 853,041 851,399 (1,642) Purchased services 653,207 1,220,353 567,146 Supplies and materials 29,347 20,474 (8,873) On-behalf payments to TRS from the State 952,877 1,937,325 984,448
Total attendance and social work services 4,900,808 6,559,071 1,658,263
Guidance servicesSalaries 4,720,145 4,839,740 119,595 Employee benefits 1,664,781 1,549,925 (114,856) Purchased services 28,900 14,975 (13,925) Supplies and materials 64,195 11,825 (52,370) Capital outlay 4,000 - (4,000) On-behalf payments to TRS from the State 1,865,036 3,628,679 1,763,643
Total guidance services 8,347,057 10,045,144 1,698,087
Health servicesSalaries 3,338,522 3,306,856 (31,666) Employee benefits 1,263,739 1,049,448 (214,291) Purchased services 4,600 346,249 341,649 Supplies and materials 97,287 53,757 (43,530) Capital outlay 9,800 - (9,800) Other objects 3,000 2,833 (167) Noncapitalized equipment - 1,189 1,189 On-behalf payments to TRS from the State 962,761 1,910,621 947,860
Total health services 5,679,709 6,670,953 991,244
Psychological servicesSalaries 2,006,800 1,930,407 (76,393) Employee benefits 656,796 532,258 (124,538) Purchased services 65,440 150,346 84,906 Supplies and materials 47,000 30,786 (16,214) On-behalf payments to TRS from the State 900,478 1,493,390 592,912
Total psychological services 3,676,514 4,137,187 460,673
(This schedule is continued on the following pages.)- 87 -

Variance with
Original and Final Budget
Final Budget Actual Over (Under)
EDUCATIONAL ACCOUNTS
For the Year Ended June 30, 2017
ROCKFORD PUBLIC SCHOOLS, DISTRICT #205
ROCKFORD, ILLINOIS
SCHEDULE OF REVENUES, EXPENDITURES AND CHANGES IN FUND BALANCE - BUDGET AND ACTUAL (Continued)
EXPENDITURES (Continued)
Support services (Continued)Pupils (Continued)
Speech pathology and audiology servicesSalaries 3,212,745$ 3,104,924$ (107,821)$ Employee benefits 1,196,474 936,926 (259,548) Purchased services 53,100 1,331,613 1,278,513 Supplies and materials 56,276 29,566 (26,710) On-behalf payments to TRS from the State 1,518,896 2,149,070 630,174
Total speech pathology and audiology services 6,037,491 7,552,099 1,514,608
Other support services - pupilsSalaries 104,205 97,064 (7,141) Employee benefits 42,987 31,564 (11,423) Purchased services 3,500 22,268 18,768 Supplies and materials 1,500 6,035 4,535
Total other support services - pupils 152,192 156,931 4,739
Total pupils 28,793,771 35,121,385 6,327,614
Instructional staffImprovement of instructional services
Salaries 5,122,192 4,713,041 (409,151) Employee benefits 2,268,960 2,057,144 (211,816) Purchased services 2,068,187 1,619,936 (448,251) Supplies and materials 702,698 250,515 (452,183) Capital outlay 42,000 9,536 (32,464) Other objects 15,000 35,338 20,338 Noncapitalized equipment - 7,656 7,656 On-behalf payments to TRS from the State 718,136 2,116,350 1,398,214
Total improvement of instructional services 10,937,173 10,809,516 (127,657)
Educational media servicesSalaries 2,092,978 1,924,544 (168,434) Employee benefits 1,113,115 909,750 (203,365) Purchased services 164,567 170,939 6,372 Supplies and materials 365,055 519,478 154,423 Capital outlay 70,000 - (70,000) On-behalf payments to TRS from the State 610,121 1,021,173 411,052
Total educational media services 4,415,836 4,545,884 130,048
(This schedule is continued on the following pages.)- 88 -

Variance with
Original and Final Budget
Final Budget Actual Over (Under)
EDUCATIONAL ACCOUNTS
For the Year Ended June 30, 2017
ROCKFORD PUBLIC SCHOOLS, DISTRICT #205
ROCKFORD, ILLINOIS
SCHEDULE OF REVENUES, EXPENDITURES AND CHANGES IN FUND BALANCE - BUDGET AND ACTUAL (Continued)
EXPENDITURES (Continued)
Support services (Continued) Instructional staff (Continued)
Assessment and testingSalaries 228,349$ 140,552$ (87,797)$ Employee benefits 52,290 32,938 (19,352) Purchased services 95,540 38,610 (56,930) Supplies and materials 428,786 300,994 (127,792) Other objects - 900 900 On-behalf payments to TRS from the State - 68,930 68,930
Total assessment and testing 804,965 582,924 (222,041)
Total instructional staff 16,157,974 15,938,324 (219,650)
General administrationBoard of Education services
Salaries - 199,070 199,070 Employee benefits - 23,215 23,215 Purchased services 118,050 1,358,860 1,240,810 Supplies and materials 5,050 25,602 20,552 Other objects 211,000 3,951 (207,049)
Total Board of Education services 334,100 1,610,698 1,276,598
Executive administration servicesSalaries 1,470,075 1,828,570 358,495 Employee benefits 404,608 427,880 23,272 Purchased services 392,653 76,394 (316,259) Supplies and materials 105,550 55,979 (49,571) Other objects 16,500 13,592 (2,908) Noncapitalized equipment - 2,839 2,839 On-behalf payments to TRS from the State 962,693 1,244,686 281,993
Total executive administration services 3,352,079 3,649,940 297,861
Special area administration servicesSalaries 3,872,079 3,608,433 (263,646) Employee benefits 1,367,676 1,272,838 (94,838) Purchased services 452,408 95,967 (356,441) Supplies and materials 145,550 42,813 (102,737) Capital outlay 11,200 - (11,200) Other objects 9,000 5,355 (3,645) Noncapitalized equipment - 949 949 On-behalf payments to TRS from the State 271,552 1,525,241 1,253,689
Total special area administration services 6,129,465 6,551,596 422,131
(This schedule is continued on the following pages.)- 89 -
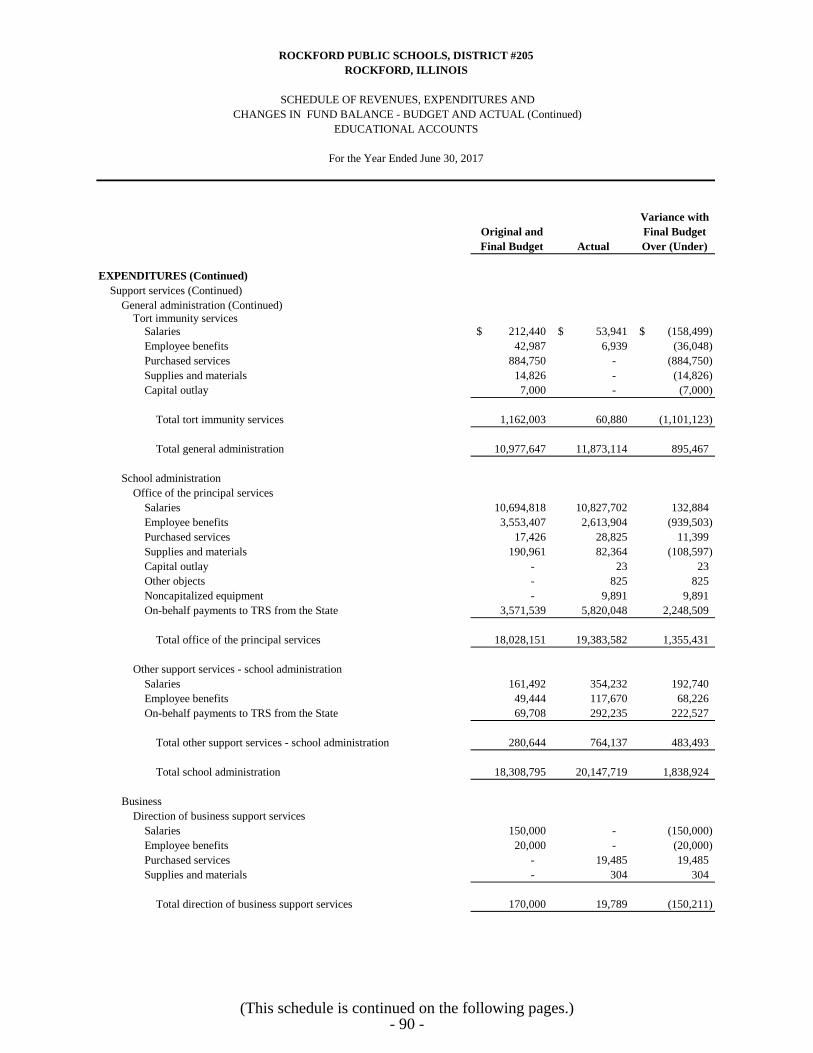
Variance with
Original and Final Budget
Final Budget Actual Over (Under)
EDUCATIONAL ACCOUNTS
For the Year Ended June 30, 2017
ROCKFORD PUBLIC SCHOOLS, DISTRICT #205
ROCKFORD, ILLINOIS
SCHEDULE OF REVENUES, EXPENDITURES AND CHANGES IN FUND BALANCE - BUDGET AND ACTUAL (Continued)
EXPENDITURES (Continued)
Support services (Continued) General administration (Continued)
Tort immunity servicesSalaries 212,440$ 53,941$ (158,499)$ Employee benefits 42,987 6,939 (36,048) Purchased services 884,750 - (884,750) Supplies and materials 14,826 - (14,826) Capital outlay 7,000 - (7,000)
Total tort immunity services 1,162,003 60,880 (1,101,123)
Total general administration 10,977,647 11,873,114 895,467
School administration Office of the principal services
Salaries 10,694,818 10,827,702 132,884 Employee benefits 3,553,407 2,613,904 (939,503) Purchased services 17,426 28,825 11,399 Supplies and materials 190,961 82,364 (108,597) Capital outlay - 23 23 Other objects - 825 825 Noncapitalized equipment - 9,891 9,891 On-behalf payments to TRS from the State 3,571,539 5,820,048 2,248,509
Total office of the principal services 18,028,151 19,383,582 1,355,431
Other support services - school administrationSalaries 161,492 354,232 192,740 Employee benefits 49,444 117,670 68,226 On-behalf payments to TRS from the State 69,708 292,235 222,527
Total other support services - school administration 280,644 764,137 483,493
Total school administration 18,308,795 20,147,719 1,838,924
BusinessDirection of business support services
Salaries 150,000 - (150,000) Employee benefits 20,000 - (20,000) Purchased services - 19,485 19,485 Supplies and materials - 304 304
Total direction of business support services 170,000 19,789 (150,211)
(This schedule is continued on the following pages.)- 90 -
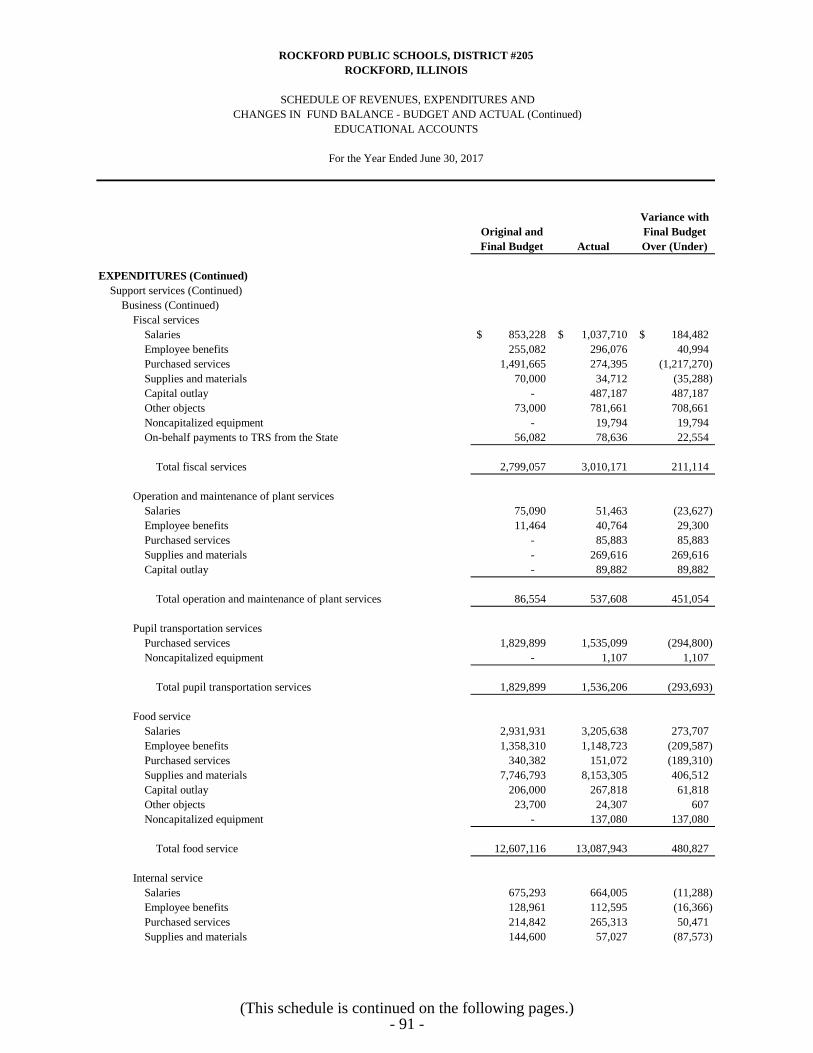
Variance with
Original and Final Budget
Final Budget Actual Over (Under)
EDUCATIONAL ACCOUNTS
For the Year Ended June 30, 2017
ROCKFORD PUBLIC SCHOOLS, DISTRICT #205
ROCKFORD, ILLINOIS
SCHEDULE OF REVENUES, EXPENDITURES AND CHANGES IN FUND BALANCE - BUDGET AND ACTUAL (Continued)
EXPENDITURES (Continued)
Support services (Continued)Business (Continued)
Fiscal servicesSalaries 853,228$ 1,037,710$ 184,482$ Employee benefits 255,082 296,076 40,994 Purchased services 1,491,665 274,395 (1,217,270) Supplies and materials 70,000 34,712 (35,288) Capital outlay - 487,187 487,187 Other objects 73,000 781,661 708,661 Noncapitalized equipment - 19,794 19,794 On-behalf payments to TRS from the State 56,082 78,636 22,554
Total fiscal services 2,799,057 3,010,171 211,114
Operation and maintenance of plant servicesSalaries 75,090 51,463 (23,627) Employee benefits 11,464 40,764 29,300 Purchased services - 85,883 85,883 Supplies and materials - 269,616 269,616 Capital outlay - 89,882 89,882
Total operation and maintenance of plant services 86,554 537,608 451,054
Pupil transportation servicesPurchased services 1,829,899 1,535,099 (294,800) Noncapitalized equipment - 1,107 1,107
Total pupil transportation services 1,829,899 1,536,206 (293,693)
Food serviceSalaries 2,931,931 3,205,638 273,707 Employee benefits 1,358,310 1,148,723 (209,587) Purchased services 340,382 151,072 (189,310) Supplies and materials 7,746,793 8,153,305 406,512 Capital outlay 206,000 267,818 61,818 Other objects 23,700 24,307 607 Noncapitalized equipment - 137,080 137,080
Total food service 12,607,116 13,087,943 480,827
Internal serviceSalaries 675,293 664,005 (11,288) Employee benefits 128,961 112,595 (16,366) Purchased services 214,842 265,313 50,471 Supplies and materials 144,600 57,027 (87,573)
(This schedule is continued on the following pages.)- 91 -

Variance with
Original and Final Budget
Final Budget Actual Over (Under)
EDUCATIONAL ACCOUNTS
For the Year Ended June 30, 2017
ROCKFORD PUBLIC SCHOOLS, DISTRICT #205
ROCKFORD, ILLINOIS
SCHEDULE OF REVENUES, EXPENDITURES AND CHANGES IN FUND BALANCE - BUDGET AND ACTUAL (Continued)
EXPENDITURES (Continued)
Support services (Continued)Business (Continued)
Internal service (Continued)Capital outlay 152,500$ 227,152$ 74,652$ Other objects 1,000 590 (410) Noncapitalized equipment - 2,705 2,705
Total internal service 1,317,196 1,329,387 12,191
Total business 18,809,822 19,521,104 711,282
CentralDirection of central support services
Salaries 91,569 104,802 13,233 Employee benefits 33,242 29,095 (4,147) Purchased services 293,667 335,839 42,172 Supplies and materials 1,500 2,204 704 On-behalf payments to TRS from the State 34,736 66,252 31,516
Total direction of central support services 454,714 538,192 83,478
Planning, research, development and evaluation servicesSalaries 367,290 428,269 60,979 Employee benefits 88,986 89,355 369 Purchased services 62,860 69,612 6,752 Supplies and materials 40,060 34,513 (5,547) Other objects 100 375 275 On-behalf payments to TRS from the State 58,936 145,647 86,711
Total planning, research, development and evaluation services 618,232 767,771 149,539
Information servicesSalaries 471,081 446,610 (24,471) Employee benefits 100,303 95,079 (5,224) Purchased services 238,500 120,834 (117,666) Supplies and materials 28,994 27,002 (1,992) Capital outlay 4,000 - (4,000) Other objects - 2,445 2,445
Total information services 842,878 691,970 (150,908)
Staff servicesSalaries 1,450,811 1,657,468 206,657 Employee benefits 598,823 538,650 (60,173) Purchased services 701,995 518,018 (183,977)
(This schedule is continued on the following pages.)- 92 -
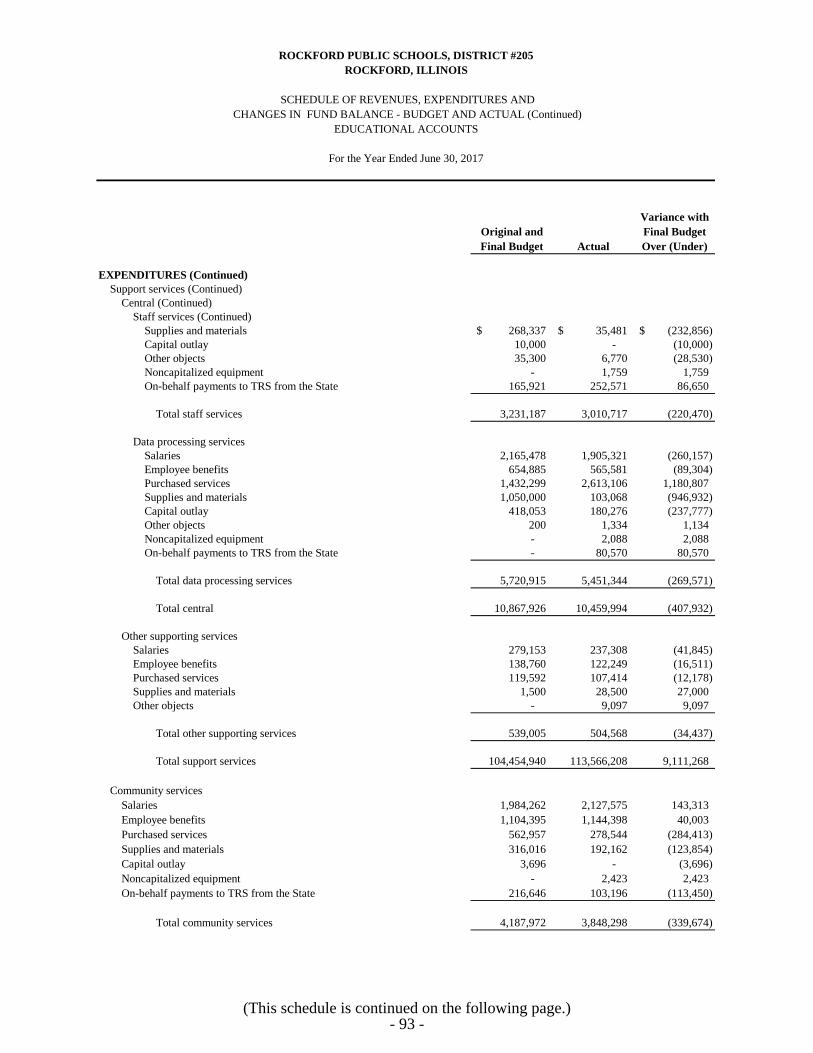
Variance with
Original and Final Budget
Final Budget Actual Over (Under)
EDUCATIONAL ACCOUNTS
For the Year Ended June 30, 2017
ROCKFORD PUBLIC SCHOOLS, DISTRICT #205
ROCKFORD, ILLINOIS
SCHEDULE OF REVENUES, EXPENDITURES AND CHANGES IN FUND BALANCE - BUDGET AND ACTUAL (Continued)
EXPENDITURES (Continued)
Support services (Continued)Central (Continued)
Staff services (Continued)Supplies and materials 268,337$ 35,481$ (232,856)$ Capital outlay 10,000 - (10,000) Other objects 35,300 6,770 (28,530) Noncapitalized equipment - 1,759 1,759 On-behalf payments to TRS from the State 165,921 252,571 86,650
Total staff services 3,231,187 3,010,717 (220,470)
Data processing servicesSalaries 2,165,478 1,905,321 (260,157) Employee benefits 654,885 565,581 (89,304) Purchased services 1,432,299 2,613,106 1,180,807 Supplies and materials 1,050,000 103,068 (946,932) Capital outlay 418,053 180,276 (237,777) Other objects 200 1,334 1,134 Noncapitalized equipment - 2,088 2,088 On-behalf payments to TRS from the State - 80,570 80,570
Total data processing services 5,720,915 5,451,344 (269,571)
Total central 10,867,926 10,459,994 (407,932)
Other supporting servicesSalaries 279,153 237,308 (41,845) Employee benefits 138,760 122,249 (16,511) Purchased services 119,592 107,414 (12,178) Supplies and materials 1,500 28,500 27,000 Other objects - 9,097 9,097
Total other supporting services 539,005 504,568 (34,437)
Total support services 104,454,940 113,566,208 9,111,268
Community servicesSalaries 1,984,262 2,127,575 143,313 Employee benefits 1,104,395 1,144,398 40,003 Purchased services 562,957 278,544 (284,413) Supplies and materials 316,016 192,162 (123,854) Capital outlay 3,696 - (3,696) Noncapitalized equipment - 2,423 2,423 On-behalf payments to TRS from the State 216,646 103,196 (113,450)
Total community services 4,187,972 3,848,298 (339,674)
(This schedule is continued on the following page.)- 93 -

Variance with
Original and Final Budget
Final Budget Actual Over (Under)
EDUCATIONAL ACCOUNTS
For the Year Ended June 30, 2017
ROCKFORD PUBLIC SCHOOLS, DISTRICT #205
ROCKFORD, ILLINOIS
SCHEDULE OF REVENUES, EXPENDITURES AND CHANGES IN FUND BALANCE - BUDGET AND ACTUAL (Continued)
EXPENDITURES (Continued)
IntergovernmentalPayments for regular programs
Purchased services 3,471,283$ 3,726,466$ 255,183$ Other objects 10,625,000 11,339,209 714,209
Total intergovernmental 14,096,283 15,065,675 969,392
Total expenditures 361,876,062 414,801,220 52,925,158
EXCESS (DEFICIENCY) OF REVENUES OVER EXPENDITURES (10,283,158) 3,258,713 13,541,871
OTHER FINANCING SOURCES (USES)
Transfers in (out) 100,000 - (100,000)
Total other financing sources (uses) 100,000 - (100,000)
NET CHANGE IN FUND BALANCE (10,183,158)$ 3,258,713 13,441,871$
FUND BALANCE, JULY 1 58,674,236
Prior period adjustment (964,762)
FUND BALANCE, JULY 1, RESTATED 57,709,474
FUND BALANCE, JUNE 30 60,968,187$
(See independent auditor's report.)- 94 -

Variance with
Original and Final Budget
Final Budget Actual Over (Under)
REVENUES
Local sourcesWorking cash property taxes 982,053$ 970,845$ (11,208)$ Investment income 120,000 (41,248) (161,248)
Total revenues 1,102,053 929,597 (172,456)
EXPENDITURES
None - - -
Total expenditures - - -
EXCESS (DEFICIENCY) OF REVENUES OVER EXPENDITURES 1,102,053 929,597 (172,456)
OTHER FINANCING SOURCES (USES)
Permanent transfer from working cash fund - interest (500,000) - 500,000
NET CHANGE IN FUND BALANCE 602,053$ 929,597 327,544$
FUND BALANCE, JULY 1 31,715,848
FUND BALANCE, JUNE 30 32,645,445$
WORKING CASH ACCOUNTS
For the Year Ended June 30, 2017
ROCKFORD PUBLIC SCHOOLS, DISTRICT #205
SCHEDULE OF REVENUES, EXPENDITURES AND CHANGES IN FUND BALANCE - BUDGET AND ACTUAL
ROCKFORD, ILLINOIS
(See independent auditor's report.)- 95 -

Special
General Education Grants
Account Account Account
Cash and investments 66,001,083$ -$ -$ Receivables
Property taxes, net 36,684,794 7,337,053 - Intergovernmental 70,664 7,286,788 15,044,747 Other 30,499 663,166 -
Prepaid items 931,168 206,730 88,794 Due from other funds 62,235,325 - -
TOTAL ASSETS 165,953,533$ 15,493,737$ 15,133,541$
LIABILITIES
Accounts payable 4,361,249$ 1,112,387$ 1,675,356$ Salaries and wages payable 11,641,199 3,201,477 1,760,144 Unearned revenue 64,784 - 12,051 Due to other governments 1,116,776 - - Other current liabilities 14,582 - 363,680 Due to other funds - 57,537,990 4,254,051
Total liabilities 17,198,590 61,851,854 8,065,282
DEFERRED INFLOWS OF RESOURCES
Unavailable revenue - property taxes 39,218,867 7,843,773 - Unavailable revenue - 4,071,166 150,949
Total deferred inflows of resources 39,218,867 11,914,939 150,949
FUND BALANCES
Nonspendable 931,168 206,730 88,794 Unassigned (deficit) 108,604,908 (58,479,786) 6,828,516
Total fund balances (deficit) 109,536,076 (58,273,056) 6,917,310
TOTAL LIABILITIES, DEFERRED INFLOWS
OF RESOURCES AND FUND BALANCES 165,953,533$ 15,493,737$ 15,133,541$
LIABILITIES, DEFERRED INFLOWS
OF RESOURCES AND FUND BALANCES
ASSETS
ROCKFORD PUBLIC SCHOOLS, DISTRICT #205
ROCKFORD, ILLINOIS
COMBINING BALANCE SHEET EDUCATIONAL ACCOUNTS - BY SUBACCOUNT
June 30, 2017
- 96 -

Food Service
Account Eliminations Total
3,190,624$ -$ 69,191,707$
- - 44,021,847 290,024 - 22,692,223
- - 693,665 24,380 - 1,251,072
- (61,792,041) 443,284
3,505,028$ (61,792,041)$ 138,293,798$
543,383$ -$ 7,692,375$ 28,606 - 16,631,426
1,014 - 77,849 - - 1,116,776
30,559 - 408,821 - (61,792,041) -
603,562 (61,792,041) 25,927,247
- - 47,062,640 113,609 - 4,335,724
113,609 - 51,398,364
24,380 - 1,251,072 2,763,477 - 59,717,115
2,787,857 - 60,968,187
3,505,028$ (61,792,041)$ 138,293,798$
(See independnet auditor's report.)- 97 -

Special
General Education Grant
Accounts Accounts Accounts
REVENUES
replacement taxesProperty taxes 78,062,148$ 15,611,965$ -$ Corporate personal property replacement taxes 14,211,296 - - State aid 208,842,014 39,369,031 11,868,350 Federal aid 86,481 3,383,214 26,642,280 Investment income 239,625 - - Refund of prior year expenditures 543,584 17,484 - Other local sources 2,226,151 1,701,163 34,234
Total revenues 304,211,299 60,082,857 38,544,864
EXPENDITURES
CurrentInstruction
Regular programs 156,348,968 - 1,088,697 Special programs 823,473 57,304,157 17,768,004 Other instructional programs 43,131,024 2,917,999 2,559,298
Support servicesPupils 11,224,884 23,443,685 452,816 Instructional staff 10,458,865 26,493 5,443,430 General administration 5,163,274 4,475,152 2,234,688 School administration 19,655,022 54,285 42,938 Business 2,372,316 663,166 2,300,328 Central 9,077,087 - 1,202,631 Other supporting services 9,097 - 495,471
Community services 359,369 245,442 3,243,487 Intergovernmental 11,339,209 185,068 3,541,398 Capital outlay 1,273,235 - 100,240
Total expenditures 271,235,823 89,315,447 40,473,426
NET CHANGE IN FUND BALANCE 32,975,476 (29,232,590) (1,928,562)
FUND BALANCE (DEFICIT), JULY 1 77,182,586 (29,040,466) 9,188,648
Prior period adjustment (621,986) - (342,776)
FUND BALANCE (DEFICIT), JULY 1, RESTATED 76,560,600 (29,040,466) 8,845,872
FUND BALANCE (DEFICIT), JUNE 30 109,536,076$ (58,273,056)$ 6,917,310$
EDUCATIONAL ACCOUNTS - BY SUBACCOUNT
For the Year Ended June 30, 2017
ROCKFORD PUBLIC SCHOOLS, DISTRICT #205
ROCKFORD, ILLINOIS
COMBINING SCHEDULE OF REVENUES, EXPENDITURES ANDCHANGES IN FUND BALANCE
- 98 -

Food Service
Accounts Total
-$ 93,674,113$ - 14,211,296
117,293 260,196,688 14,429,291 44,541,266
- 239,625 3,326 564,394
671,003 4,632,551
15,220,913 418,059,933
- 157,437,665 - 75,895,634 - 48,608,321
- 35,121,385 - 15,928,788 - 11,873,114
395,451 20,147,696 13,113,255 18,449,065
- 10,279,718 - 504,568 - 3,848,298 - 15,065,675
267,818 1,641,293
13,776,524 414,801,220
1,444,389 3,258,713
1,343,468 58,674,236
- (964,762)
1,343,468 57,709,474
2,787,857$ 60,968,187$
(See independent auditor's report.)- 99 -

NONMAJOR GOVERNMENTAL FUNDS

Municipal
Operations Retirement/
and Social
Maintenance Transportation Security
Cash and investments -$ 16,317,967$ 3,583,092$ Receivables
Property taxes, net 6,878,450 7,505,194 2,928,466 Other governmental units - 6,264,207 - Interest - - - Other 4,533 154,051 -
Prepaid items 25,862 60,969 31,712
TOTAL ASSETS 6,908,845$ 30,302,388$ 6,543,270$
LIABILITIES
Accounts payable 3,513,708$ 295,591$ 672,447$ Salaries and wages payable 87,638 134,036 689,670 Other current liabilities - - - Due to other funds 443,284 - -
Total liabilities 4,044,630 429,627 1,362,117
DEFERRED INFLOWS OF RESOURCES
Unavailable revenue - property taxes 7,353,538 8,020,258 3,130,647 Unavailable revenue - other 9,262 3,132,085 -
Total deferred inflows of resources 7,362,800 11,152,343 3,130,647
FUND BALANCES
Nonspendable 25,862 60,969 31,712 Restricted for
Transportation - 18,659,449 - Retirement - - 2,018,794 Capital projects - - - Tort immunity - - -
Assigned - working cash - - - Unassigned (deficit) (4,524,447) - -
Total fund balances (deficit) (4,498,585) 18,720,418 2,050,506
TOTAL LIABILITIES, DEFERRED INFLOWS
OF RESOURCES AND FUND BALANCES 6,908,845$ 30,302,388$ 6,543,270$
COMBINING BALANCE SHEET
ROCKFORD, ILLINOIS
ROCKFORD PUBLIC SCHOOLS, DISTRICT #205
LIABILITIES, DEFERRED INFLOWS
OF RESOURCES AND FUND BALANCES
ASSETS
June 30, 2017
NONMAJOR GOVERNMENTAL FUNDS
- 100 -

Fire
Prevention
and Life Tort
Safety Immunity Total
7,488,513$ 11,518,456$ 38,908,028$
907,966 2,763,455 20,983,531 - - 6,264,207
13,209 - 13,209 - - 158,584
4,267 55,325 178,135
8,413,955$ 14,337,236$ 66,505,694$
1,988,797$ 272,351$ 6,742,894$ 8,022 23,027 942,393
- 33,685 33,685 - - 443,284
1,996,819 329,063 8,162,256
970,667 2,953,181 22,428,291 - - 3,141,347
970,667 2,953,181 25,569,638
4,267 55,325 178,135
- - 18,659,449 - - 2,018,794
5,442,202 - 5,442,202 - 10,999,667 10,999,667 - - - - - (4,524,447)
5,446,469 11,054,992 32,773,800
8,413,955$ 14,337,236$ 66,505,694$
(See independent auditor's report.)- 101 -

Municipal
Operations Retirement/
and Social
Maintenance Transportation Security
REVENUES
Property taxes 14,636,624$ 17,131,374$ 6,258,898$ Corporate personal property replacement taxes 8,357,421 - 971,098 State aid - 14,918,309 - Investment income 299 49,157 25,413 Refund of prior year's expenditures 1,268 975 - Payments of surplus monies from TIF districts 13,061 - - Other 1,742,786 53,894 -
Total revenues 24,751,459 32,153,709 7,255,409
EXPENDITURES
CurrentInstruction
Regular programs - - 874,297 Special programs - - 961,756 Other instructional programs - - 549,280
Support servicesPupils - 84,618 463,951 Instructional staff - - 162,188 General administration - - 245,668 School administration - - 687,964 Business - - 3,197,903 Transportation 17,081 20,841,364 - Operations and maintenance 23,506,730 - - Central - - 570,637 Other supporting services 523,804 - 86,030
Community services - - 39,966 Capital outlay 2,945,713 2,759,475 -
Total expenditures 26,993,328 23,685,457 7,839,640
NET CHANGE IN FUND BALANCES (2,241,869) 8,468,252 (584,231)
FUND BALANCES (DEFICIT), JULY 1 (2,256,716) 10,252,166 2,251,911
Prior period adjustment - - 382,826
FUND BALANCE, JULY 1, RESTATED (2,256,716) 10,252,166 2,634,737
FUND BALANCES (DEFICIT), JUNE 30 (4,498,585)$ 18,720,418$ 2,050,506$
ROCKFORD PUBLIC SCHOOLS, DISTRICT #205
For the Year Ended June 30, 2017
NONMAJOR GOVERNMENTAL FUNDSCHANGES IN FUND BALANCES
COMBINING STATEMENT OF REVENUES, EXPENDITURES AND
ROCKFORD, ILLINOIS
- 102 -

Fire
Prevention
and Life Tort
Safety Immunity Total
1,941,690$ 5,907,035$ 45,875,621$ - - 9,328,519 - 377,962 15,296,271
89,260 46,873 211,002 - - 2,243 - - 13,061
177,235 288,333 2,262,248
2,208,185 6,620,203 72,988,965
- - 874,297 - - 961,756 - - 549,280
- - 548,569 - - 162,188 - 6,210,668 6,456,336 - - 687,964
1,828,029 - 5,025,932 - - 20,858,445 - - 23,506,730 - - 570,637 - - 609,834 - - 39,966
9,925,446 243,997 15,874,631
11,753,475 6,454,665 76,726,565
(9,545,290) 165,538 (3,737,600)
14,991,759 10,630,217 35,869,337
- 259,237 642,063
14,991,759 10,889,454 36,511,400
5,446,469$ 11,054,992$ 32,773,800$
(See independent auditor's report.)- 103 -

Variance with
Original and Final Budget
Final Budget Actual Over (Under)
REVENUES
Local sourcesOperations and maintenance property taxes 14,730,793$ 14,636,624$ (94,169)$ Corporate personal property replacement taxes 8,322,545 8,357,421 34,876 Investment income - 299 299 Fees - 19,445 19,445 Rentals 380,225 590,066 209,841 Other school activity revenue - 9,915 9,915 Contributions and donations from private sources - 5,000 5,000 Refund of prior years' expenditures - 1,268 1,268 Payments of surplus monies from TIF districts - 13,061 13,061 Other 1,100,000 1,118,360 18,360
Total revenues 24,533,563 24,751,459 217,896
EXPENDITURES
Support servicesDirection of business support services
Supplies and materials - 15 15 Other objects - 41,515 41,515
Total direction of business support services - 41,530 41,530
Operations and maintenanceFacilities acquisition and construction services
Salaries 10,791 - (10,791) Employee benefits 1,290 - (1,290)
Total facilities acquisition and construction services 12,081 - (12,081)
Operation and maintenance of plant servicesSalaries 2,824,403 2,869,164 44,761 Employee benefits 623,169 622,509 (660) Purchased services 12,438,343 12,865,769 427,426 Supplies and materials 7,958,644 6,676,624 (1,282,020) Capital outlay 2,061,000 2,945,713 884,713 Other objects 37,329 61,449 24,120 Noncapitalized equipment - 369,685 369,685
Total operation and maintenance of plant services 25,942,888 26,410,913 468,025
Total operations and maintenance 25,954,969 26,452,443 497,474
OPERATIONS AND MAINTENANCE FUND
ROCKFORD PUBLIC SCHOOLS, DISTRICT #205
SCHEDULE OF REVENUES, EXPENDITURES AND
For the Year Ended June 30, 2017
ROCKFORD, ILLINOIS
CHANGES IN FUND BALANCE - BUDGET AND ACTUAL
(This schedule is continued on the following page.)- 104 -
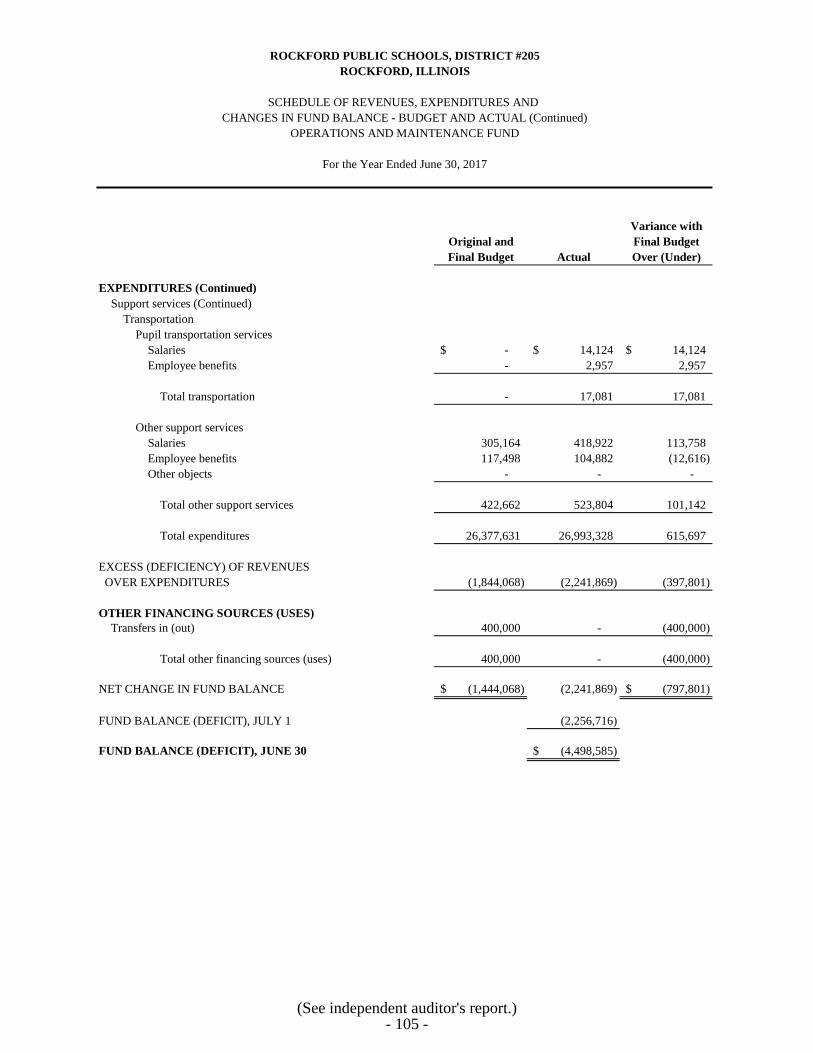
Variance with
Original and Final Budget
Final Budget Actual Over (Under)
EXPENDITURES (Continued)
Support services (Continued)Transportation
Pupil transportation servicesSalaries -$ 14,124$ 14,124$ Employee benefits - 2,957 2,957
Total transportation - 17,081 17,081
Other support servicesSalaries 305,164 418,922 113,758 Employee benefits 117,498 104,882 (12,616) Other objects - - -
Total other support services 422,662 523,804 101,142
Total expenditures 26,377,631 26,993,328 615,697
EXCESS (DEFICIENCY) OF REVENUES OVER EXPENDITURES (1,844,068) (2,241,869) (397,801)
OTHER FINANCING SOURCES (USES)
Transfers in (out) 400,000 - (400,000)
Total other financing sources (uses) 400,000 - (400,000)
NET CHANGE IN FUND BALANCE (1,444,068)$ (2,241,869) (797,801)$
FUND BALANCE (DEFICIT), JULY 1 (2,256,716)
FUND BALANCE (DEFICIT), JUNE 30 (4,498,585)$
For the Year Ended June 30, 2017
ROCKFORD PUBLIC SCHOOLS, DISTRICT #205
ROCKFORD, ILLINOIS
SCHEDULE OF REVENUES, EXPENDITURES AND CHANGES IN FUND BALANCE - BUDGET AND ACTUAL (Continued)
OPERATIONS AND MAINTENANCE FUND
(See independent auditor's report.)- 105 -

Variance with
Original and Final Budget
Final Budget Actual Over (Under)
REVENUES
replacement taxesLocal sourcesTransportation property taxes 17,853,660$ 17,131,374$ (722,286)$ Regular transportation fees from other sources (in state) 30,000 44,340 14,340 Investment income 50,000 49,157 (843) Refunds of prior years' expenditures - 975 975 Payments of surplus monies from TIF districts - - - Other 10,000 9,554 (446)
Total local sources 17,943,660 17,235,400 (708,260)
State sourcesTransportation - regular/vocational 10,100,000 10,079,746 (20,254) Transportation - special education 3,400,000 4,039,875 639,875 On-behalf payments to TRS from the State 384,264 798,688 414,424
Total state sources 13,884,264 14,918,309 1,034,045
Total revenues 31,827,924 32,153,709 325,785
EXPENDITURES
Support servicesPupils
Other support services - pupilsSalaries 131,322 84,618 (46,704) Employee benefits 7,779 - (7,779)
Total other support services - pupils 139,101 84,618 (54,483)
Total pupils 139,101 84,618 (54,483)
BusinessPupil transportation services
Salaries 6,655,692 7,339,524 683,832 Employee benefits 4,302,856 3,373,465 (929,391) Purchased services 4,252,200 5,161,008 908,808 Supplies and materials 3,114,000 2,888,590 (225,410) Capital outlay 38,000 2,271,547 2,233,547 Other objects - 533 533 Noncapitalized equipment - 4,081 4,081 On-behalf payments to TRS from the State - 9,069 9,069
Total pupil transportation services 18,362,748 21,047,817 2,685,069
SCHEDULE OF REVENUES, EXPENDITURES AND
ROCKFORD PUBLIC SCHOOLS, DISTRICT #205
CHANGES IN FUND BALANCE - BUDGET AND ACTUAL
For the Year Ended June 30, 2017
TRANSPORTATION FUND
ROCKFORD, ILLINOIS
(This schedule is continued on the following page.)- 106 -
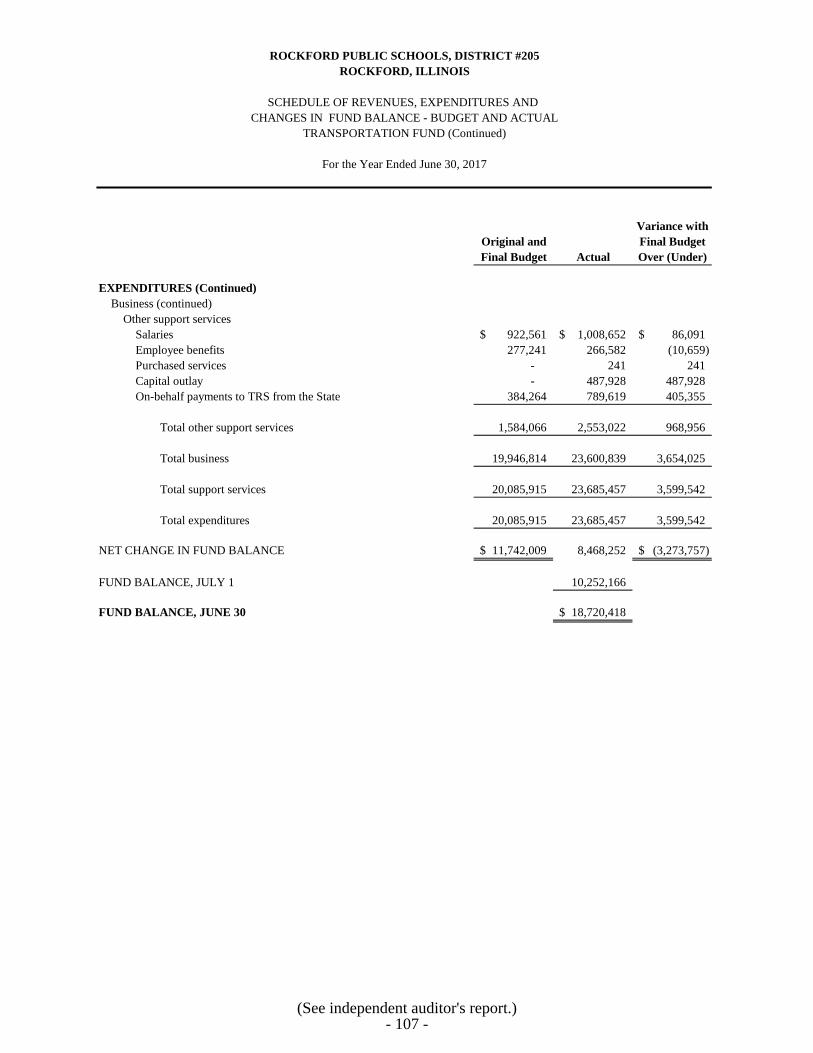
Variance with
Original and Final Budget
Final Budget Actual Over (Under)
EXPENDITURES (Continued)
Business (continued)Other support services
Salaries 922,561$ 1,008,652$ 86,091$ Employee benefits 277,241 266,582 (10,659) Purchased services - 241 241 Capital outlay - 487,928 487,928 On-behalf payments to TRS from the State 384,264 789,619 405,355
Total other support services 1,584,066 2,553,022 968,956
Total business 19,946,814 23,600,839 3,654,025
Total support services 20,085,915 23,685,457 3,599,542
Total expenditures 20,085,915 23,685,457 3,599,542
NET CHANGE IN FUND BALANCE 11,742,009$ 8,468,252 (3,273,757)$
FUND BALANCE, JULY 1 10,252,166
FUND BALANCE, JUNE 30 18,720,418$
For the Year Ended June 30, 2017
ROCKFORD PUBLIC SCHOOLS, DISTRICT #205
ROCKFORD, ILLINOIS
SCHEDULE OF REVENUES, EXPENDITURES AND CHANGES IN FUND BALANCE - BUDGET AND ACTUAL
TRANSPORTATION FUND (Continued)
(See independent auditor's report.)- 107 -

Variance with
Original and Final Budget
Final Budget Actual Over (Under)
REVENUES
replacement taxesLocal sourcesIMRF property taxes 3,001,797$ 2,837,407$ (164,390)$ Social Security/Medicare only property taxes 3,662,468 3,421,491 (240,977) Corporate personal property replacement taxes 971,098 971,098 - Investment income 21,000 25,413 4,413
Total revenues 7,656,363 7,255,409 (400,954)
EXPENDITURES
Instruction Regular programs 1,283,600 874,297 (409,303) Pre-K programs 33,505 33,002 (503) Special education programs 774,080 928,754 154,674 Special education programs Pre-K 67,989 71,863 3,874 Adult/continuing education programs 1,464 2,581 1,117 Vocational programs 63,348 66,477 3,129 Interscholastic programs 27,192 84,679 57,487 Summer school programs 1,680 39,062 37,382 Gifted programs 60,945 59,526 (1,419) Driver's education programs 2,138 7,839 5,701 Bilingual programs 143,254 134,685 (8,569) Truant alternative and optional programs 73,491 82,568 9,077
Total instruction 2,532,686 2,385,333 (147,353)
Support servicesPupils
Attendance and social work services 37,278 38,575 1,297 Guidance services 126,944 123,448 (3,496) Health services 212,008 190,083 (21,925) Psychological services 30,490 27,651 (2,839) Speech pathology and audiology services 66,852 60,372 (6,480) Other support services - pupils 25,786 23,822 (1,964)
Total pupils 499,358 463,951 (35,407)
Instructional staffImprovement of instructional services 42,758 37,379 (5,379) Educational media services 137,049 122,956 (14,093) Assessment and testing 7,769 1,853 (5,916)
Total instructional staff 187,576 162,188 (25,388)
General administrationBoard of education services - 67,470 67,470 Executive administration services 60,462 69,761 9,299 Special area administration services 71,232 62,858 (8,374) Tort immunity services - 9,460 9,460
ROCKFORD PUBLIC SCHOOLS, DISTRICT #205
CHANGES IN FUND BALANCE - BUDGET AND ACTUAL
For the Year Ended June 30, 2017
ROCKFORD, ILLINOIS
SCHEDULE OF REVENUES, EXPENDITURES AND
MUNICIPAL RETIREMENT/SOCIAL SECURITY FUND
(This schedule is continued on the following page.)- 108 -
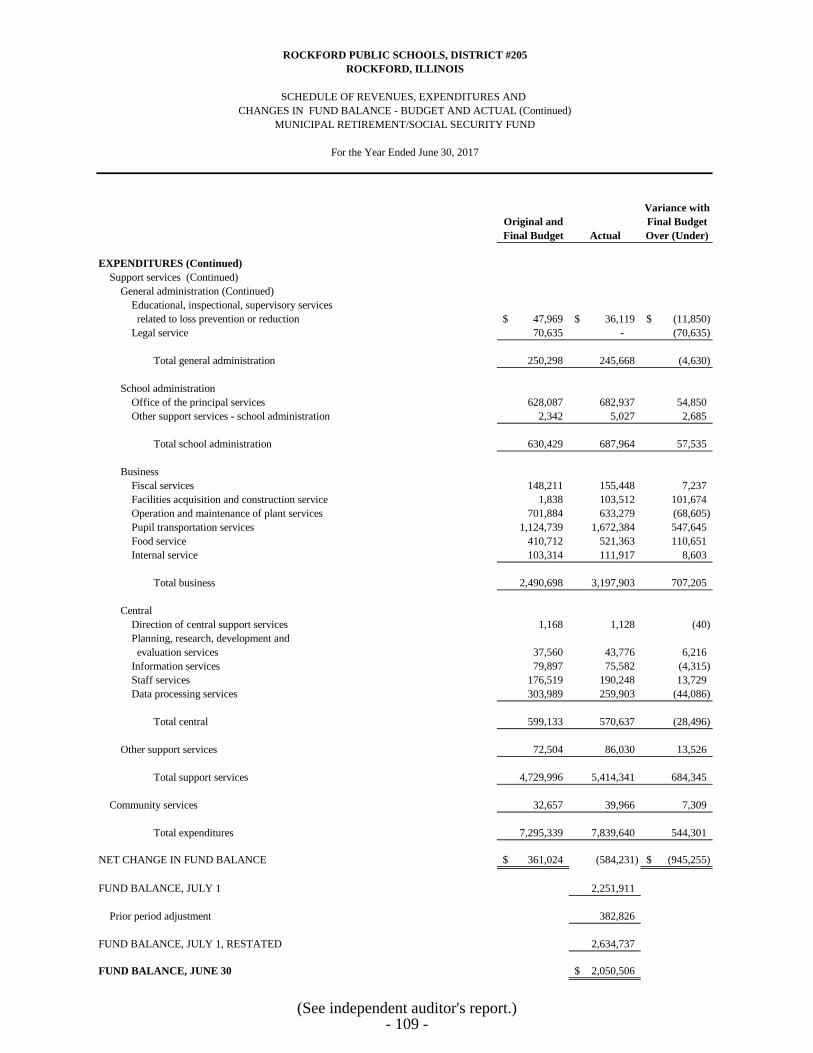
Variance with
Original and Final Budget
Final Budget Actual Over (Under)
EXPENDITURES (Continued)
Support services (Continued)General administration (Continued)
Educational, inspectional, supervisory services related to loss prevention or reduction 47,969$ 36,119$ (11,850)$ Legal service 70,635 - (70,635)
Total general administration 250,298 245,668 (4,630)
School administrationOffice of the principal services 628,087 682,937 54,850 Other support services - school administration 2,342 5,027 2,685
Total school administration 630,429 687,964 57,535
BusinessFiscal services 148,211 155,448 7,237 Facilities acquisition and construction service 1,838 103,512 101,674 Operation and maintenance of plant services 701,884 633,279 (68,605) Pupil transportation services 1,124,739 1,672,384 547,645 Food service 410,712 521,363 110,651 Internal service 103,314 111,917 8,603
Total business 2,490,698 3,197,903 707,205
CentralDirection of central support services 1,168 1,128 (40) Planning, research, development and evaluation services 37,560 43,776 6,216 Information services 79,897 75,582 (4,315) Staff services 176,519 190,248 13,729 Data processing services 303,989 259,903 (44,086)
Total central 599,133 570,637 (28,496)
Other support services 72,504 86,030 13,526
Total support services 4,729,996 5,414,341 684,345
Community services 32,657 39,966 7,309
Total expenditures 7,295,339 7,839,640 544,301
NET CHANGE IN FUND BALANCE 361,024$ (584,231) (945,255)$
FUND BALANCE, JULY 1 2,251,911
Prior period adjustment 382,826
FUND BALANCE, JULY 1, RESTATED 2,634,737
FUND BALANCE, JUNE 30 2,050,506$
For the Year Ended June 30, 2017
MUNICIPAL RETIREMENT/SOCIAL SECURITY FUNDCHANGES IN FUND BALANCE - BUDGET AND ACTUAL (Continued)
ROCKFORD PUBLIC SCHOOLS, DISTRICT #205
ROCKFORD, ILLINOIS
SCHEDULE OF REVENUES, EXPENDITURES AND
(See independent auditor's report.)- 109 -
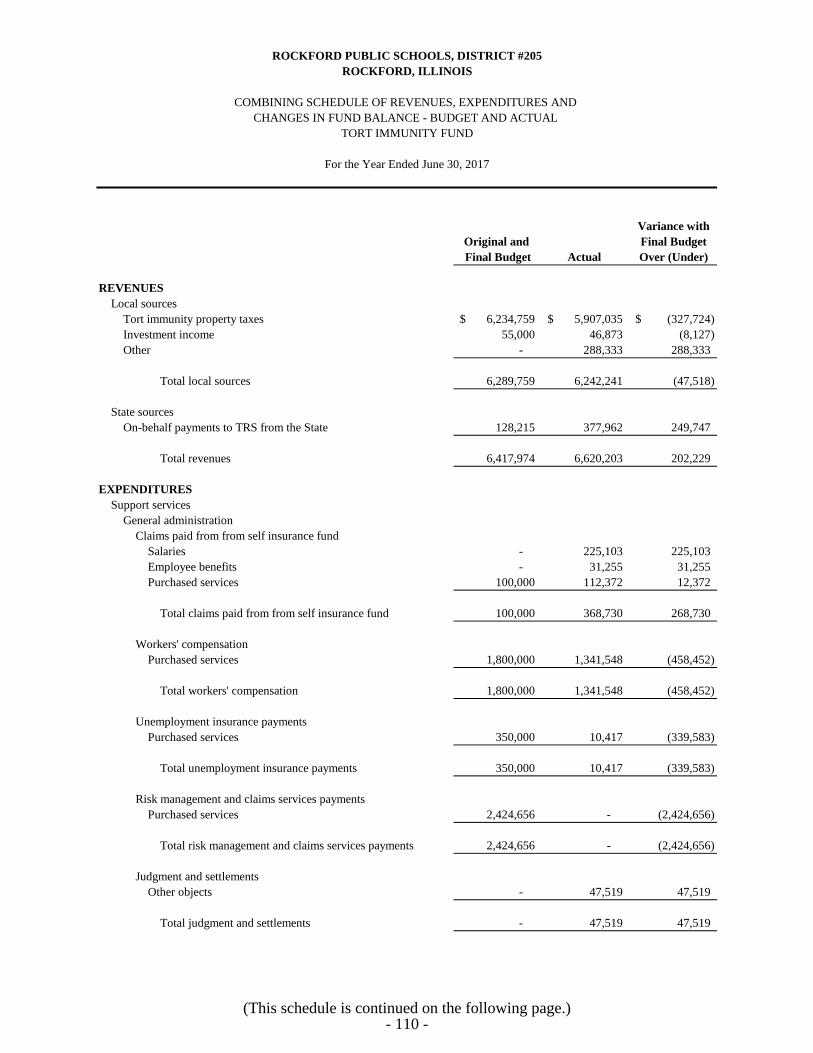
Variance with
Original and Final Budget
Final Budget Actual Over (Under)
REVENUES
Local sourcesTort immunity property taxes 6,234,759$ 5,907,035$ (327,724)$ Investment income 55,000 46,873 (8,127) Other - 288,333 288,333
Total local sources 6,289,759 6,242,241 (47,518)
State sourcesOn-behalf payments to TRS from the State 128,215 377,962 249,747
Total revenues 6,417,974 6,620,203 202,229
EXPENDITURES
Support servicesGeneral administration
Claims paid from from self insurance fund Salaries - 225,103 225,103 Employee benefits - 31,255 31,255 Purchased services 100,000 112,372 12,372
Total claims paid from from self insurance fund 100,000 368,730 268,730
Workers' compensation Purchased services 1,800,000 1,341,548 (458,452)
Total workers' compensation 1,800,000 1,341,548 (458,452)
Unemployment insurance payments Purchased services 350,000 10,417 (339,583)
Total unemployment insurance payments 350,000 10,417 (339,583)
Risk management and claims services payments Purchased services 2,424,656 - (2,424,656)
Total risk management and claims services payments 2,424,656 - (2,424,656)
Judgment and settlements Other objects - 47,519 47,519
Total judgment and settlements - 47,519 47,519
ROCKFORD PUBLIC SCHOOLS, DISTRICT #205
COMBINING SCHEDULE OF REVENUES, EXPENDITURES AND
TORT IMMUNITY FUND
For the Year Ended June 30, 2017
CHANGES IN FUND BALANCE - BUDGET AND ACTUAL
ROCKFORD, ILLINOIS
(This schedule is continued on the following page.)- 110 -

Variance with
Original and Final Budget
Final Budget Actual Over (Under)
EXPENDITURES (Continued)
Support services (Continued)General administration (Continued)
Educational, inspectional and supervisory services related to loss prevention or reduction
Salaries 536,237$ 648,407$ 112,170$ Employee benefits 155,852 149,363 (6,489) Purchased services - 3,266,722 3,266,722 Capital outlay - 243,997 243,997 On-behalf payments to TRS from the State 128,215 377,962 249,747
Total educational, inspectional and supervisory services related to loss prevention or reduction 820,304 4,686,451 3,866,147
Legal serviceSalaries 223,633 - (223,633) Employee benefits 32,241 - (32,241) Purchased services 45,000 - (45,000)
Total legal sevice 300,874 - (300,874)
Property insurancePurchased services 1,700,000 - (1,700,000)
Total property insurance 1,700,000 - (1,700,000)
Total support services - general administration 7,495,834 6,454,665 (1,041,169)
Total expenditures 7,495,834 6,454,665 (1,041,169)
NET CHANGE IN FUND BALANCE (1,077,860)$ 165,538 1,243,398$
FUND BALANCE, JULY 1 10,630,217
Prior period adjustment 259,237
FUND BALANCE, JULY 1, RESTATED 10,889,454
FUND BALANCE, JUNE 30 11,054,992$
For the Year Ended June 30, 2017
ROCKFORD PUBLIC SCHOOLS, DISTRICT #205
ROCKFORD, ILLINOIS
COMBINING SCHEDULE OF REVENUES, EXPENDITURES AND CHANGES IN FUND BALANCE - BUDGET AND ACTUAL (Continued)
TORT IMMUNITY FUND
(See independent auditor's report.)- 111 -

Variance with
Original and Final Budget
Final Budget Actual Over (Under)
REVENUES
Local sourcesFire prevention and life safety property taxes 1,964,106$ 1,941,690$ (22,416)$ Investment income 75,000 89,260 14,260
State sourcesOther restricted revenue from state sources - 51,235 51,235
Other - 126,000 126,000
Total revenues 2,039,106 2,208,185 169,079
EXPENDITURES
Support servicesBusiness
Facilities acquisition and construction servicesSalaries - 5,054 5,054 Purchased services - 5,523 5,523 Capital outlay 1,800,000 - (1,800,000)
Total facilities acquisition and construction services 1,800,000 10,577 (1,789,423)
Operation and maintenance of plant servicesSalaries 553,201 538,865 (14,336) Employee benefits 131,970 116,948 (15,022) Purchased services 200,000 911,397 711,397 Supplies and materials - 187,571 187,571 Capital outlay 8,432,255 9,925,446 1,493,191 Noncapitalized equipment - 62,671 62,671
Total operation and maintenance of plant services 9,317,426 11,742,898 2,425,472
Total support services 11,117,426 11,753,475 636,049
Total expenditures 11,117,426 11,753,475 636,049
NET CHANGE IN FUND BALANCE (9,078,320)$ (9,545,290) (466,970)$
FUND BALANCE, JULY 1 14,991,759
FUND BALANCE, JUNE 30 5,446,469$
ROCKFORD PUBLIC SCHOOLS, DISTRICT #205
SCHEDULE OF REVENUES, EXPENDITURES AND
For the Year Ended June 30, 2017
FIRE PREVENTION AND LIFE SAFETY FUNDCHANGES IN FUND BALANCE - BUDGET AND ACTUAL
ROCKFORD, ILLINOIS
(See independent auditor's report.)- 112 -

FIDUCIARY FUND

Balance Balance
July 1, 2016 Additions Deductions June 30, 2017
Cash and cash equivalents 1,443,085$ 2,742,191$ 2,622,817$ 1,562,459$
TOTAL ASSETS 1,443,085$ 2,742,191$ 2,622,817$ 1,562,459$
Due to student organizationsAuburn 211,029$ 403,753$ 427,597$ 187,185$ Barbour 12,041 62,926 57,177 17,790 Beyer Elementary 1,633 7,585 5,084 4,134 Bloom Elementary 1,079 2,098 1,770 1,407 Brookview Elementary 5,887 11,342 7,209 10,020 Carlson 13,408 13,492 10,941 15,959 Cherry Valley 13,036 6,076 7,907 11,205 Conklin 14,199 8,592 7,566 15,225 Dennis Early Childhood 3,407 5,013 3,758 4,662 East High 161,169 389,557 381,646 169,080 Eisenhower Middle 91,932 102,849 111,609 83,172 Ellis Elementary 1,987 14,638 5,323 11,302 Fairview Early Childhood 462 2,536 2,076 922 Flinn Middle 52,118 105,173 95,316 61,975 Froberg Elementary 11,889 14,895 8,704 18,080 Gregory Elementary 11,501 16,772 18,707 9,566 Guilford High 205,687 454,760 489,001 171,446 Haskell Elementary 7,260 13,730 8,800 12,190 Hillman Elementary 15,018 21,746 11,372 25,392 Jefferson High 154,599 267,112 242,965 178,746 Johnson Elementary 13,619 18,805 14,592 17,832 Kennedy Middle 39,826 79,308 72,072 47,062 King Elementary 7,413 15,176 7,727 14,862 Kishwaukee Elementary 4,943 15,628 10,779 9,792 Lathrop Elementary 12,400 14,828 7,502 19,726 Lewis Lemon Elementary 2,449 18,044 13,313 7,180 Marsh - 17 17 - Lincoln Middle 51,755 77,204 92,315 36,644 Marshall Middle 69,616 122,918 111,129 81,405 McIntosh Elementary 10,750 12,325 15,431 7,644 Montessori Elementary 8,240 33,986 27,598 14,628 Nashold Elementary 9,815 22,407 20,604 11,618 Nelson Elementary 5,219 16,345 9,604 11,960 RESA Middle 32,707 67,483 60,485 39,705 Riverdahl Elementary 13,393 17,969 17,400 13,962 Rolling Green 18,132 27,959 25,732 20,359 Roosevelt Alternative HS 6,491 17,733 20,549 3,675 Spring Creek Elementary 3,706 12,054 11,310 4,450 Summerdale Early Childhood 8,336 7,933 7,459 8,810 Thompson Elementary 10,093 12,338 10,256 12,175 Thurgood Marshall 29,436 41,492 32,005 38,923 Walker - 67 67 - Welsh Elementary 24,716 13,906 7,815 30,807 West Middle 39,499 94,833 78,685 55,647 West View Elementary 21,306 11,173 11,099 21,380 White Swan Elementary 2,405 10,436 4,936 7,905 Whitehead Elementary 4,888 26,868 27,069 4,687 Wilson Middle 2,591 8,311 739 10,163
TOTAL LIABILITIES 1,443,085$ 2,742,191$ 2,622,817$ 1,562,459$
ASSETS
LIABILITIES
ROCKFORD PUBLIC SCHOOLS, DISTRICT #205
ROCKFORD, ILLINOIS
COMBINING STATEMENT OF CHANGES IN ASSETS AND LIABILITIESAGENCY FUND
For the Year Ended June 30, 2017
(See independent auditor's report.)- 113 -

STATI STICA LSECTIONas of and for the year ended June 30, 2017
District No. 205 | 501 7th Street, Rockford, IL 61104 | 815.966.3000 | rps205.com

STATISTICAL SECTION
This part of the Rockford Public Schools, District #205’s comprehensive annual financial report
presents detailed information as a context for understanding what the information in the financial
statements, note disclosures and required supplementary information displays about the District’s
overall financial health.
Contents Page(s)
Financial Trends
These schedules contain trend information to help the reader understand
how the District’s financial performance and well-being have been
changed over time.
114-129
Revenue Capacity
These schedules contain information to help the reader assess the
District’s most significant local revenue source, the property tax.
130-133
Debt Capacity
The schedules present information to help the reader assess the
affordability of the District’s current levels of outstanding debt and the
District’s ability to issue additional debt in the future.
134-137
Demographic and Economic Information
These schedules offer demographic and economic indicators to help the
reader understand the environment within which the District’s financial
activities take place.
138-139
Operating Information
These schedules contain service and infrastructure data to help the reader
understand how the information in the District’s financial report relates to
the services the District provides and the activities it performs.
140-144
Sources: Unless otherwise noted, the information in these schedules is derived from the
comprehensive annual financial report for the relevant year.
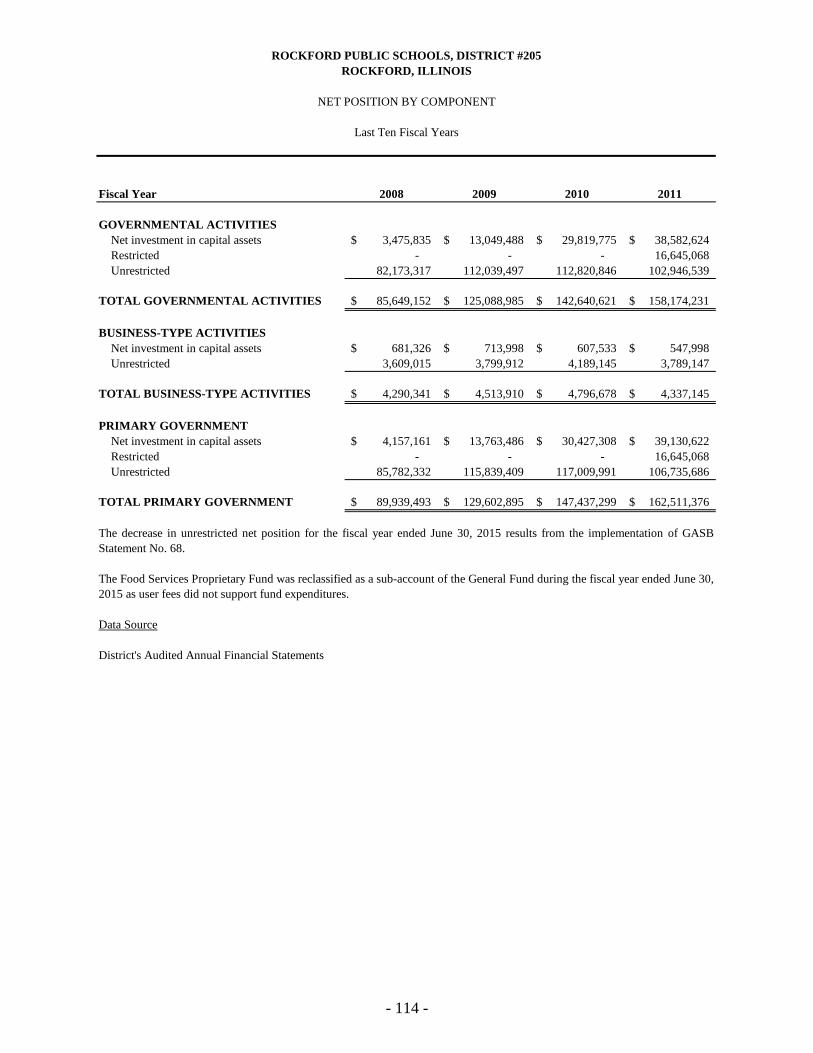
Fiscal Year 2008 2009 2010 2011
GOVERNMENTAL ACTIVITIES
Net investment in capital assets 3,475,835$ 13,049,488$ 29,819,775$ 38,582,624$ Restricted - - - 16,645,068 Unrestricted 82,173,317 112,039,497 112,820,846 102,946,539
TOTAL GOVERNMENTAL ACTIVITIES 85,649,152$ 125,088,985$ 142,640,621$ 158,174,231$
BUSINESS-TYPE ACTIVITIES
Net investment in capital assets 681,326$ 713,998$ 607,533$ 547,998$ Unrestricted 3,609,015 3,799,912 4,189,145 3,789,147
TOTAL BUSINESS-TYPE ACTIVITIES 4,290,341$ 4,513,910$ 4,796,678$ 4,337,145$
PRIMARY GOVERNMENT
Net investment in capital assets 4,157,161$ 13,763,486$ 30,427,308$ 39,130,622$ Restricted - - - 16,645,068 Unrestricted 85,782,332 115,839,409 117,009,991 106,735,686
TOTAL PRIMARY GOVERNMENT 89,939,493$ 129,602,895$ 147,437,299$ 162,511,376$
Data Source
District's Audited Annual Financial Statements
The Food Services Proprietary Fund was reclassified as a sub-account of the General Fund during the fiscal year ended June 30,2015 as user fees did not support fund expenditures.
ROCKFORD PUBLIC SCHOOLS, DISTRICT #205
ROCKFORD, ILLINOIS
NET POSITION BY COMPONENT
Last Ten Fiscal Years
The decrease in unrestricted net position for the fiscal year ended June 30, 2015 results from the implementation of GASBStatement No. 68.
- 114 -
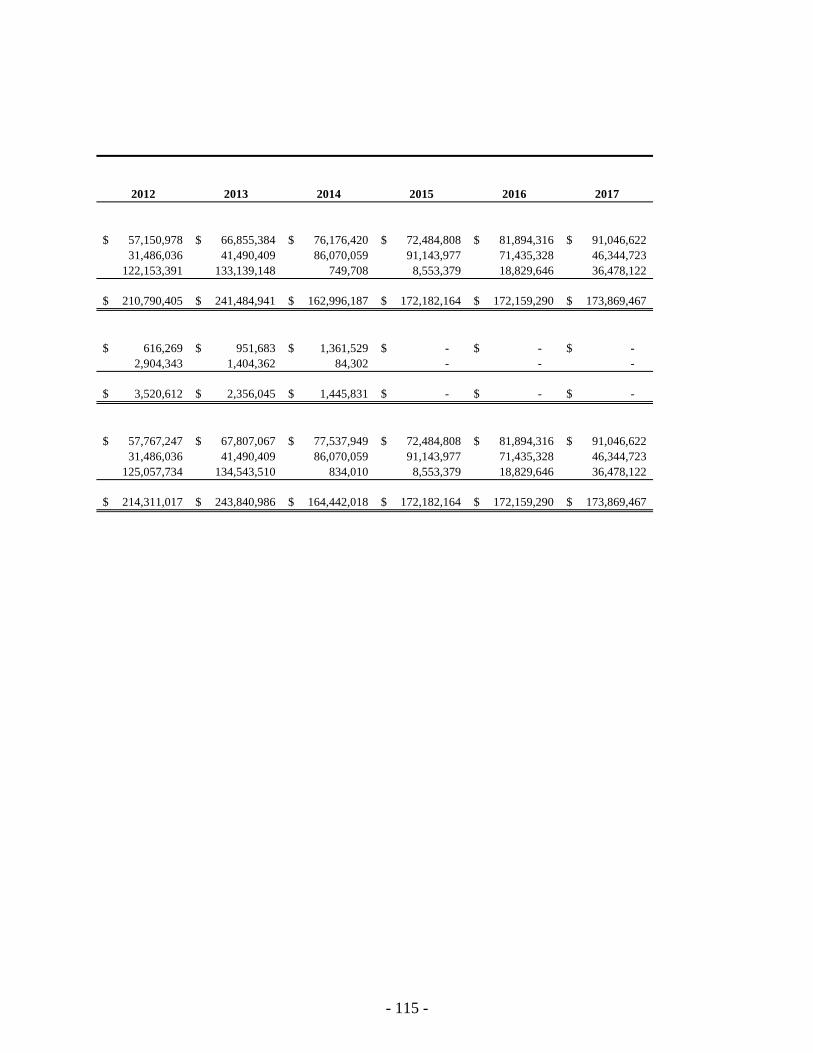
2012 2013 2014 2015 2016 2017
57,150,978$ 66,855,384$ 76,176,420$ 72,484,808$ 81,894,316$ 91,046,622$ 31,486,036 41,490,409 86,070,059 91,143,977 71,435,328 46,344,723
122,153,391 133,139,148 749,708 8,553,379 18,829,646 36,478,122
210,790,405$ 241,484,941$ 162,996,187$ 172,182,164$ 172,159,290$ 173,869,467$
616,269$ 951,683$ 1,361,529$ -$ -$ -$ 2,904,343 1,404,362 84,302 - - -
3,520,612$ 2,356,045$ 1,445,831$ -$ -$ -$
57,767,247$ 67,807,067$ 77,537,949$ 72,484,808$ 81,894,316$ 91,046,622$ 31,486,036 41,490,409 86,070,059 91,143,977 71,435,328 46,344,723
125,057,734 134,543,510 834,010 8,553,379 18,829,646 36,478,122
214,311,017$ 243,840,986$ 164,442,018$ 172,182,164$ 172,159,290$ 173,869,467$
- 115 -

Fiscal Year 2008 2009 2010 2011*
EXPENSES
Governmental activitiesInstructionRegular programs 104,517,637$ 110,732,663$ 123,879,534$ 104,845,366$ Special programs 46,570,100 39,802,948 50,018,452 48,670,404 Other instructional programs 25,695,373 38,310,803 35,898,263 32,248,049 State retirement contributions - - - 34,872,891 Support services
Pupils 18,801,197 18,822,512 20,493,289 20,846,389 Instructional staff 11,750,491 12,340,593 17,776,247 12,893,720 General administration 5,950,607 5,576,007 6,190,201 14,753,488 School administration 13,098,138 14,579,947 14,901,527 15,496,294 Business 8,336,745 8,798,484 10,377,350 3,244,152 Transportation 21,330,329 20,173,127 21,333,383 23,542,254 Operations and maintenance 21,456,137 22,708,773 21,883,184 21,946,092 Central 4,391,450 5,022,963 5,879,721 6,918,440 Other support services 1,122,774 1,399,670 1,632,578 2,163,469 Community services 5,359,939 5,108,681 4,499,013 3,116,036 Payments to other governments 122,087 2,135,100 4,903,939 8,320,199 Interest and charges 6,353,793 5,806,709 5,172,942 4,549,296
Total governmental activities expenses 294,856,797 311,318,980 344,839,623 358,426,539
Business-type activitiesFood service 11,748,702 11,990,248 12,411,759 12,805,897
TOTAL PRIMARY GOVERNMENT EXPENSES 306,605,499$ 323,309,228$ 357,251,382$ 371,232,436$
PROGRAM REVENUES
Governmental activitiesCharges for services
Regular programs 424,545$ 432,934$ 920,467$ 2,492,045$ Special programs 1,399,881 1,566,071 1,582,562 1,902,919 Other instructional programs - - - 109,006 Transportation - - - - Operations and maintenance - - - - Support services - - - 34,956 Operating grants and contributions 73,098,137 73,940,807 70,180,697 105,981,337 Capital grants and contributions 695,720 613,108 2,190,343 -
Total governmental activities program revenues 75,618,283 76,552,920 74,874,069 110,520,263
Business-type activitiesCharges for services 2,553,992 2,396,425 2,061,658 1,741,248 Operating grants and contributions 9,118,685 9,767,893 10,580,777 10,594,605
Total business-type activities program revenues 11,672,677 12,164,318 12,642,435 12,335,853
TOTAL PRIMARY GOVERNMENT PROGRAM REVENUE 87,290,960$ 88,717,238$ 87,516,504$ 122,856,116$
ROCKFORD PUBLIC SCHOOLS, DISTRICT #205
ROCKFORD, ILLINOIS
EXPENSES, PROGRAM REVENUES AND NET REVENUE (EXPENSE)
Last Ten Fiscal Years
- 116 -

2012 2013 2014 2015 2016 2017
88,612,117$ 95,605,168$ 99,521,788$ 133,481,017$ 99,862,730$ 70,472,478$ 45,444,362 49,330,724 48,024,930 56,877,251 60,081,524 54,271,769 30,235,538 32,390,781 34,010,329 51,820,849 31,389,861 50,932,296 34,028,625 39,421,383 51,588,181 - 78,041,471 119,944,250
19,072,219 20,779,935 21,945,652 29,360,167 25,608,366 37,940,357 10,907,066 13,701,517 14,343,834 15,506,744 13,235,175 17,112,292 14,856,394 13,618,859 14,930,351 16,120,083 16,038,814 19,066,651 13,635,105 14,611,306 15,634,130 21,489,953 17,403,081 22,431,824
3,101,381 3,243,795 3,395,960 18,655,674 22,403,062 21,125,161 22,297,675 22,563,421 24,308,678 21,979,414 22,135,435 23,076,246 22,098,358 22,957,948 28,103,673 28,868,602 27,135,148 29,667,557
8,856,537 11,077,329 12,657,817 10,846,900 12,063,672 13,027,485 1,903,305 2,567,681 3,028,627 892,751 1,061,452 1,312,024 2,633,080 3,077,467 3,237,659 3,051,917 3,808,292 4,198,812
10,413,930 11,352,014 19,686,522 19,150,367 12,590,587 15,065,675 4,244,827 3,823,094 6,624,778 7,108,686 8,424,895 8,894,205
332,340,519 360,122,422 401,042,909 435,210,375 451,283,565 508,539,082
12,870,519 13,580,069 13,219,015 - - -
345,211,038$ 373,702,491$ 414,261,924$ 435,210,375$ 451,283,565$ 508,539,082$
3,720,031$ 3,714,337$ 3,935,486$ 4,729,520$ 4,106,169$ 3,784,237$ 2,570,831 1,884,140 1,865,302 2,186,035 1,823,820 1,756,433
65,187 90,343 185,631 157,593 203,082 161,464 - - 71,914 43,429 42,001 44,340 - - 785,785 2,832,408 737,528 607,579
524,564 683,445 - - - - 110,434,258 113,894,699 112,224,080 155,959,407 157,928,371 203,623,622
- - 747,084 552,008 45,418 51,235
117,314,871 120,266,964 119,815,282 166,460,400 164,886,389 210,028,910
1,533,823 1,488,576 1,331,305 - - - 10,508,830 10,920,910 10,972,468 - - -
12,042,653 12,409,486 12,303,773 - - -
129,357,524$ 132,676,450$ 132,119,055$ 166,460,400$ 166,460,400$ 210,028,910$
- 117 -
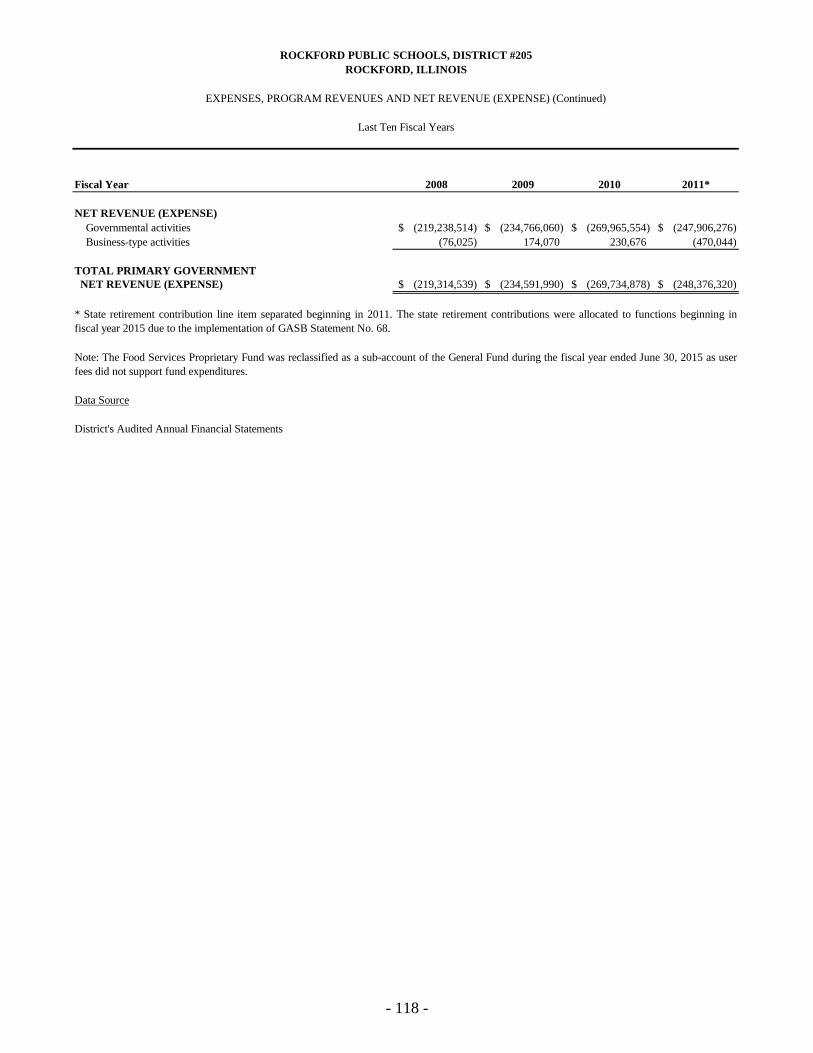
Fiscal Year 2008 2009 2010 2011*
NET REVENUE (EXPENSE)
Governmental activities (219,238,514)$ (234,766,060)$ (269,965,554)$ (247,906,276)$ Business-type activities (76,025) 174,070 230,676 (470,044)
TOTAL PRIMARY GOVERNMENT
NET REVENUE (EXPENSE) (219,314,539)$ (234,591,990)$ (269,734,878)$ (248,376,320)$
Data Source
District's Audited Annual Financial Statements
* State retirement contribution line item separated beginning in 2011. The state retirement contributions were allocated to functions beginning infiscal year 2015 due to the implementation of GASB Statement No. 68.
Note: The Food Services Proprietary Fund was reclassified as a sub-account of the General Fund during the fiscal year ended June 30, 2015 as userfees did not support fund expenditures.
ROCKFORD PUBLIC SCHOOLS, DISTRICT #205
ROCKFORD, ILLINOIS
EXPENSES, PROGRAM REVENUES AND NET REVENUE (EXPENSE) (Continued)
Last Ten Fiscal Years
- 118 -

2012 2013 2014 2015 2016 2017
(215,025,648)$ (239,855,458)$ (281,227,627)$ (268,479,975)$ (286,397,176)$ (298,510,172)$ (827,866) (1,170,583) (915,242) - - -
(215,853,514)$ (241,026,041)$ (282,142,869)$ (268,749,975)$ (286,397,176)$ (298,510,172)$
- 119 -

Fiscal Year 2008 2009 2010 2011
NET REVENUE (EXPENSE)
Governmental activities (219,238,514)$ (234,766,060)$ (269,965,554)$ (247,906,276)$ Business-type activities (76,025) 174,070 230,676 (470,044)
TOTAL PRIMARY GOVERNMENT
NET REVENUE (EXPENSE) (219,314,539)$ (234,591,990)$ (269,734,878)$ (248,376,320)$
GENERAL REVENUES AND OTHER
CHANGES IN NET POSITION
Governmental activitiesTaxesProperty taxes, general and specific purposes 130,636,643$ 137,571,414$ 142,474,713$ 146,929,076$ Property taxes, debt service 12,962,633 12,759,301 13,169,384 13,646,700 Corporate property replacement taxes 25,547,820 22,348,477 18,079,739 23,447,497 State aid-formula grants 87,045,848 95,811,421 110,506,976 78,130,244 Investment earnings 3,695,462 2,767,798 1,114,592 777,898 Other 2,846,265 2,974,396 2,180,268 518,982 Gain on sale of capital assets - - - - Transfers in (out) (123,248) (26,914) 8,482 (10,511)
Total governmental activities 262,611,423 274,205,893 287,534,154 263,439,886
Business-type activitiesOther 27,051 22,585 43,610 - Transfers in (out) 123,248 26,914 8,482 10,511
Total business-type activities 150,299 49,499 52,092 10,511
TOTAL PRIMARY GOVERNMENT 262,761,722$ 274,255,392$ 287,586,246$ 263,450,397$
CHANGE IN NET POSITION
Governmental activities 43,372,909$ 39,439,833$ 17,568,600$ 15,533,610$ Business-type activities 74,274 223,569 282,768 (459,533)
TOTAL PRIMARY GOVERNMENT
CHANGES IN NET POSITION 43,447,183$ 39,663,402$ 17,851,368$ 15,074,077$
Data Source
District's Audited Annual Financial Statements
ROCKFORD PUBLIC SCHOOLS, DISTRICT #205
ROCKFORD, ILLINOIS
GENERAL REVENUES AND TOTAL CHANGE IN NET POSITION
Last Ten Fiscal Years
- 120 -

2012 2013 2014 2015 2016 2017
(215,025,648)$ (239,855,458)$ (281,227,627)$ (268,749,975)$ (286,397,176)$ (298,510,172)$ (827,866) (1,170,583) (915,242) - - -
(215,853,514)$ (241,026,041)$ (282,142,869)$ (268,749,975)$ (286,397,176)$ (298,510,172)$
151,983,603$ 147,883,312$ 141,461,370$ 143,009,227$ 141,406,671$ 140,520,578$ 14,070,132 14,584,379 15,099,347 11,283,184 13,388,878 13,067,090 21,568,780 22,037,762 22,762,158 23,824,790 19,141,723 26,039,815 79,061,402 85,015,862 75,355,915 95,623,462 109,373,106 115,810,724
612,912 613,029 751,417 778,438 1,021,857 665,850 356,326 421,666 776,799 1,960,605 1,879,315 4,438,991
- - - 10,415 162,752 - (11,333) (6,016) (5,028) 1,445,831 - -
267,641,822 270,549,994 256,201,978 277,935,952 286,374,302 300,543,048
- - - - - - 11,333 6,016 5,028 (1,445,831) - -
11,333 6,016 5,028 (1,445,831) - -
267,653,155$ 270,556,010$ 256,207,006$ 276,490,121$ 286,374,302$ 300,543,048$
52,616,174$ 30,694,536$ (25,025,649)$ 9,185,977$ (22,874)$ 2,032,876$ (816,533) (1,164,567) (910,214) (1,445,831) - -
51,799,641$ 29,529,969$ (29,935,863)$ 7,740,146$ (22,874)$ 2,032,876$
- 121 -
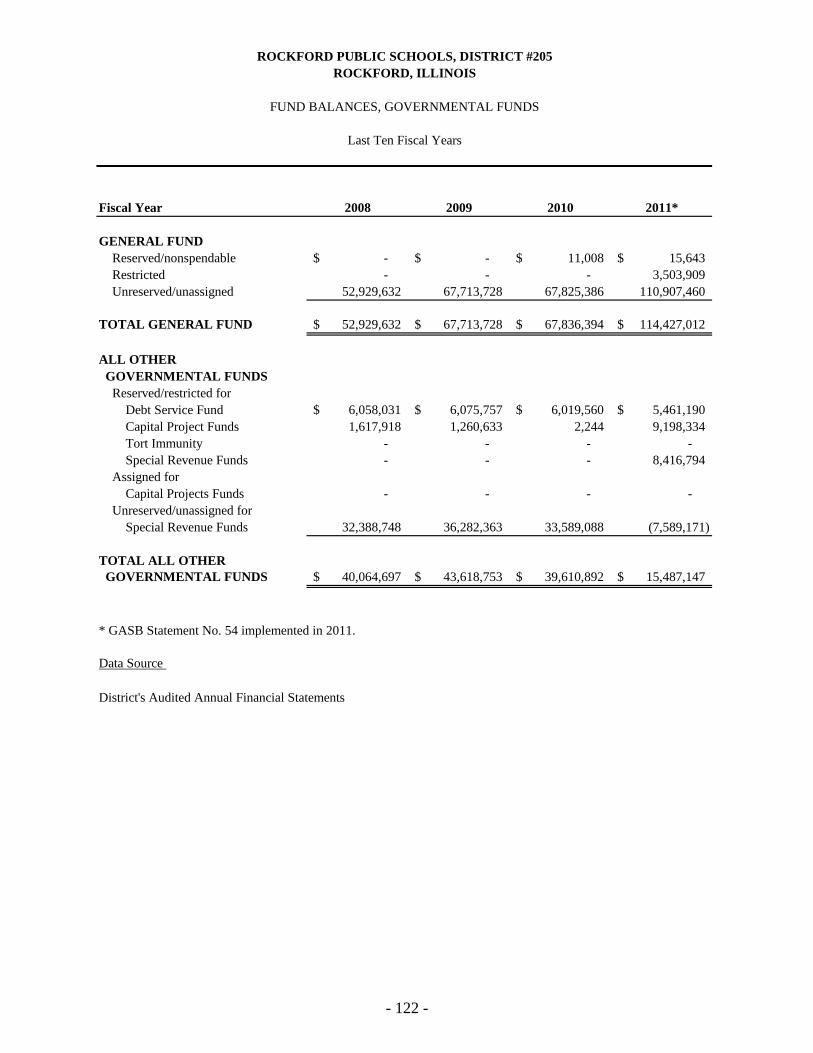
Fiscal Year 2008 2009 2010 2011*
GENERAL FUND
Reserved/nonspendable -$ -$ 11,008$ 15,643$ Restricted - - - 3,503,909 Unreserved/unassigned 52,929,632 67,713,728 67,825,386 110,907,460
TOTAL GENERAL FUND 52,929,632$ 67,713,728$ 67,836,394$ 114,427,012$
ALL OTHER
GOVERNMENTAL FUNDS
Reserved/restricted forDebt Service Fund 6,058,031$ 6,075,757$ 6,019,560$ 5,461,190$ Capital Project Funds 1,617,918 1,260,633 2,244 9,198,334 Tort Immunity - - - - Special Revenue Funds - - - 8,416,794
Assigned forCapital Projects Funds - - - -
Unreserved/unassigned forSpecial Revenue Funds 32,388,748 36,282,363 33,589,088 (7,589,171)
TOTAL ALL OTHER
GOVERNMENTAL FUNDS 40,064,697$ 43,618,753$ 39,610,892$ 15,487,147$
Data Source
District's Audited Annual Financial Statements
ROCKFORD PUBLIC SCHOOLS, DISTRICT #205
ROCKFORD, ILLINOIS
FUND BALANCES, GOVERNMENTAL FUNDS
Last Ten Fiscal Years
* GASB Statement No. 54 implemented in 2011.
- 122 -

2012 2013 2014 2015 2016 2017
-$ -$ -$ -$ 45,567$ 1,251,072$ 6,632,268 8,888,659 29,644,947 30,574,121 31,715,848 32,645,445
128,273,256 120,974,848 60,318,447 61,124,212 58,628,669 59,717,115
134,905,524$ 129,863,507$ 89,963,394$ 91,698,333$ 90,390,084$ 93,613,632$
7,148,770$ 7,071,799$ 4,719,230$ 2,258,926$ 2,138,318$ 3,969,117$ 5,572,685 101,421,193 104,537,272 122,568,838 105,759,618 70,303,886
- - 11,945,434 11,645,076 10,630,217 11,054,992 5,537,898 13,802,271 16,043,860 19,410,199 12,504,077 20,770,924
10,229,172 25,576,794 - - - -
(8,763,275) (8,330,022) (9,672,691) (10,549,575) (2,256,716) (4,498,585)
19,725,250$ 139,542,035$ 127,573,105$ 145,333,464$ 128,775,514$ 101,600,334$
- 123 -

Fiscal Year 2008 2009 2010 2011
LOCAL SOURCES
Property taxes 143,599,276$ 150,330,715$ 155,644,097$ 160,575,776$ Corporate personal property replacement taxes 25,547,820 22,348,477 18,079,739 23,447,497 Payments of surplus monies from TIF districts - - - - Charges for services 4,670,691 4,973,401 4,683,297 4,878,586
Total local sources 173,817,787 177,652,593 178,407,133 188,901,859
STATE SOURCES
Unrestricted state aid 67,342,462 54,882,612 59,469,341 78,130,244 Restricted state aid 62,911,778 60,433,880 61,969,274 77,498,978
Total state sources 130,254,240 115,316,492 121,438,615 155,629,222
FEDERAL SOURCES
Restricted federal aid 29,917,789 45,056,148 57,783,314 34,760,928 Refund of prior year's expenditures - - - - Investment income 3,695,462 2,767,798 1,114,592 777,898
Total federal sources 33,613,251 47,823,946 58,897,906 35,538,826
TOTAL REVENUES 337,685,278$ 340,793,031$ 358,743,654$ 380,069,907$
Data Source
District's Audited Annual Financial Statements
ROCKFORD PUBLIC SCHOOLS, DISTRICT #205
ROCKFORD, ILLINOIS
GOVERNMENTAL FUNDS REVENUES
Last Ten Fiscal Years
- 124 -
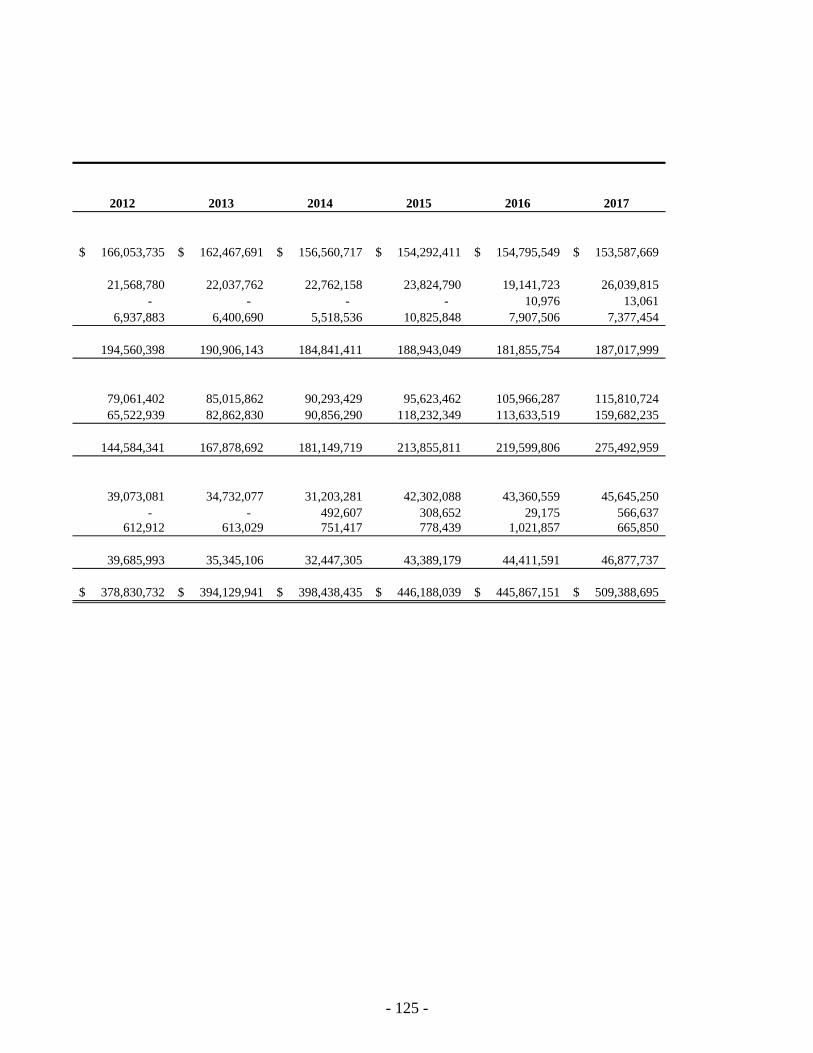
2012 2013 2014 2015 2016 2017
166,053,735$ 162,467,691$ 156,560,717$ 154,292,411$ 154,795,549$ 153,587,669$
21,568,780 22,037,762 22,762,158 23,824,790 19,141,723 26,039,815 - - - - 10,976 13,061
6,937,883 6,400,690 5,518,536 10,825,848 7,907,506 7,377,454
194,560,398 190,906,143 184,841,411 188,943,049 181,855,754 187,017,999
79,061,402 85,015,862 90,293,429 95,623,462 105,966,287 115,810,724 65,522,939 82,862,830 90,856,290 118,232,349 113,633,519 159,682,235
144,584,341 167,878,692 181,149,719 213,855,811 219,599,806 275,492,959
39,073,081 34,732,077 31,203,281 42,302,088 43,360,559 45,645,250 - - 492,607 308,652 29,175 566,637
612,912 613,029 751,417 778,439 1,021,857 665,850
39,685,993 35,345,106 32,447,305 43,389,179 44,411,591 46,877,737
378,830,732$ 394,129,941$ 398,438,435$ 446,188,039$ 445,867,151$ 509,388,695$
- 125 -

Fiscal Year 2008 2009 2010* 2011*
INSTRUCTION
Regular programs 103,779,706$ 108,765,729$ 94,026,728$ 101,369,563$ Special programs 45,629,296 38,880,913 45,267,959 47,094,560 Other instructional programs 25,341,969 37,951,089 31,169,681 31,847,336 State retirement contribution - - 36,060,321 34,872,891
Total instruction 174,750,971 185,597,731 206,524,689 215,184,350
SUPPORTING SERVICES
Pupils 18,555,256 18,552,073 20,187,058 20,505,697 Instructional staff 11,562,267 12,138,146 17,574,055 12,706,467 General administration 5,646,603 5,684,210 14,571,252 14,368,662 School administration 12,892,663 14,350,551 14,418,271 15,247,491 Business 8,271,437 8,724,950 3,229,880 3,159,800 Operations and maintenance 21,335,604 22,483,141 19,960,489 21,635,968 Transportation 19,664,401 18,834,269 19,607,215 21,620,338 Central 4,225,795 4,887,310 5,761,970 6,678,075 Other 1,110,868 1,389,151 1,997,578 2,158,334
Total supporting services 103,264,894 107,043,801 117,307,768 118,080,832
COMMUNITY SERVICES 5,300,602 5,053,395 4,447,474 3,083,787
CAPITAL OUTLAY 3,266,389 6,278,007 12,706,775 6,146,052
DEBT SERVICE
Principal 11,204,683 11,609,683 12,679,683 13,729,683 Interest and charges 5,277,792 4,710,248 4,050,039 3,325,263
Total debt service 16,482,475 16,319,931 16,729,722 17,054,946
INTERGOVERNMENTAL
Payments to other governments 122,087 2,135,100 4,903,939 8,320,199
TOTAL EXPENDITURES 303,187,418$ 322,427,965$ 362,620,367$ 367,870,166$
DEBT SERVICE AS A PERCENTAGE
OF NONCAPITAL EXPENDITURES 5.50% 5.16% 4.78% 4.71%
* State retirement contribution line item separated.
Data Source
District's Audited Annual Financial Statements
ROCKFORD PUBLIC SCHOOLS, DISTRICT #205
Last Ten Fiscal Years
ROCKFORD, ILLINOIS
GOVERNMENTAL FUNDS EXPENDITURES AND DEBT SERVICE RATIO
- 126 -

2012* 2013* 2014* 2015 2016 2017
88,195,295$ 93,511,480$ 96,340,200$ 131,979,197$ 134,420,336$ 158,311,962$ 36,944,577 39,723,219 44,731,560 54,409,388 70,880,440 76,857,390 29,801,618 31,910,430 33,057,649 51,677,506 41,771,652 49,157,601 34,028,625 39,421,383 51,588,181 - - -
188,970,115 204,566,512 225,717,590 238,066,091 247,072,428 284,326,953
18,760,723 20,446,944 21,322,333 28,774,564 30,488,982 35,669,954 10,722,513 13,361,441 13,983,629 15,284,601 14,601,409 16,090,976 15,227,953 13,471,776 14,656,800 15,863,485 18,348,750 18,329,450 13,394,779 14,343,454 15,137,540 21,146,177 19,997,772 20,835,660
3,014,785 3,138,956 3,223,655 18,479,663 22,301,643 23,474,997 21,645,802 22,609,044 27,408,233 27,286,765 28,508,797 28,737,023 20,638,899 20,606,541 22,177,995 21,402,719 19,224,321 20,858,445
8,332,381 10,313,193 11,181,438 9,116,470 11,481,054 10,850,355 1,896,821 2,567,681 3,016,359 88,236 1,017,064 1,114,402
113,634,656 120,859,030 132,107,982 157,442,680 165,969,792 175,961,262
2,596,970 3,071,479 3,155,905 2,998,927 3,535,858 3,888,264
14,774,150 16,027,728 55,242,369 55,242,369 47,791,572 38,880,545
14,878,905 16,000,000 14,200,000 11,300,000 9,190,000 9,290,000 2,526,728 1,788,895 3,252,248 3,015,000 4,360,527 5,604,929
17,405,633 17,788,895 17,452,248 14,315,000 13,550,527 14,894,929
17,020,316 18,554,480 19,686,522 19,150,367 12,590,587 15,065,675
354,401,840$ 380,868,124$ 453,362,616$ 486,728,260$ 490,510,764$ 533,017,628$
5.12% 4.88% 4.38% 3.32% 3.06% 3.01%
- 127 -

Fiscal Year 2008 2009 2010 2011
EXCESS (DEFICIENCY) OF REVENUES
OVER EXPENDITURES 34,497,860$ 18,365,066$ (3,876,713)$ 12,199,741$
OTHER FINANCING SOURCES (USES)
Issuance of general obligation bonds sold - - - 9,992,698 Premium on bonds - - - 105,623 Transfer in 3,688,119 3,074,996 1,135,911 199,900 Transfer (out) (3,811,367) (3,101,910) (1,144,393) (210,411) Proceeds from the sale of District assets - - - 179,322
Total other financing sources (uses) (123,248) (26,914) (8,482) 10,267,132
NET CHANGE IN FUND BALANCES 34,374,612$ 18,338,152$ (3,885,195)$ 22,466,873$
ROCKFORD PUBLIC SCHOOLS, DISTRICT #205
ROCKFORD, ILLINOIS
OTHER FINANCING SOURCES AND USES AND NET CHANGES IN FUND BALANCESGOVERNMENTAL FUNDS
Last Ten Fiscal Years
- 128 -
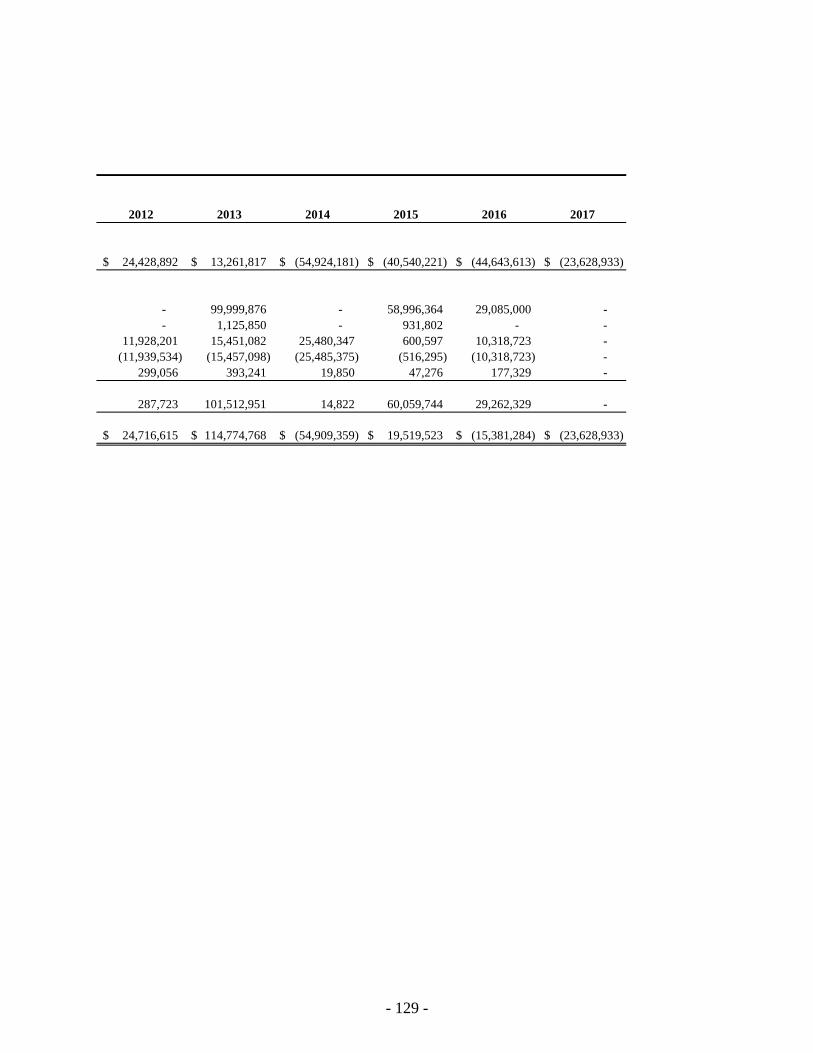
2012 2013 2014 2015 2016 2017
24,428,892$ 13,261,817$ (54,924,181)$ (40,540,221)$ (44,643,613)$ (23,628,933)$
- 99,999,876 - 58,996,364 29,085,000 - - 1,125,850 - 931,802 - -
11,928,201 15,451,082 25,480,347 600,597 10,318,723 - (11,939,534) (15,457,098) (25,485,375) (516,295) (10,318,723) -
299,056 393,241 19,850 47,276 177,329 -
287,723 101,512,951 14,822 60,059,744 29,262,329 -
24,716,615$ 114,774,768$ (54,909,359)$ 19,519,523$ (15,381,284)$ (23,628,933)$
- 129 -

Total Taxable Total Estimated
Tax Equalized Direct Actual
Levy Residential Commercial Industrial Agricultural Railroad Assessed Percent Tax Taxable
Year Property Property Property Property Property Valuation Change Rate Value
2016 1,351,100,030$ 452,797,601$ 155,465,368$ 15,482,548$ 5,905,307$ 1,980,750,854$ 1.02% 7.803 5,942,252,562$
2015 1,344,370,098 441,846,556 154,355,773 15,070,648 5,136,977 1,960,780,052 (2.63%) 7.938 5,882,340,156
2014 1,401,214,615 434,183,451 159,051,737 14,381,676 4,873,755 2,013,705,234 (6.04%) 7.781 6,041,115,702
2013 1,510,010,484 455,238,300 159,346,606 14,345,559 4,106,006 2,143,046,955 (8.96%) 7.2301 6,429,140,865
2012 1,684,282,678 482,384,445 169,323,054 14,182,138 3,823,787 2,353,996,102 (9.09%) 6.688 7,061,988,306
2011 1,858,864,247 531,650,353 180,493,067 14,856,472 3,364,520 2,589,228,659 (5.47%) 6.559 7,767,685,977
2010 1,960,896,951 569,104,813 190,827,403 14,812,396 3,339,291 2,738,980,854 (3.36%) 6.015 8,216,942,562
2009 2,031,864,602 588,665,267 196,715,830 14,087,236 2,832,420 2,834,165,355 (0.49%) 5.576 8,502,496,065
2008 2,037,701,784 597,626,014 197,070,905 13,083,456 2,764,560 2,848,246,719 3.50% 5.452 8,544,740,157
2007 1,964,272,936 577,395,084 195,641,402 12,625,025 2,104,316 2,752,038,763 5.74% 5.338 8,256,116,289
Data SourceWinnebago County Clerk's, Department of Tax Extensions
ROCKFORD PUBLIC SCHOOLS, DISTRICT #205
ROCKFORD, ILLINOIS
ASSESSED VALUE AND ACTUAL VALUE OF TAXABLE PROPERTY
Last Ten Levy Years
Note: The county assesses property at approximately 33.3% of actual value. Estimated actual taxable value is calculated by dividing taxable value by percentage. Tax ratesare per $100 of assessed value.
- 130 -

Tax Levy Year 2007 2008 2009 2010 2011 2012 2013 2014 2015 2016
DISTRICT DIRECT RATES
Educational 3.7000 3.7000 3.7000 3.7000 3.7145 3.2945 4.0000 4.0000 4.0000 4.0000Tort Immunity 0.1687 0.2840 0.3844 0.4169 0.3239 0.2921 0.2794 0.3110 0.3042 0.3012Operations and Maintenance 0.5000 0.5000 0.5000 0.6922 0.5508 0.7500 0.7500 0.7500 0.7500 0.7500Transportation 0.2000 0.2000 0.2000 0.2623 0.3600 0.4946 0.4551 0.7732 0.9383 0.8180Municipal Retirement/Social Security 0.1642 0.1633 0.1339 0.1954 0.2022 0.3087 0.2093 0.3262 0.3224 0.3193Working Cash 0.0500 0.0500 0.0500 0.0500 0.0500 0.0500 0.0500 0.0500 0.0500 0.0495Special Education 0.0400 0.0400 0.0750 0.1314 0.7384 0.8000 0.8000 0.8000 0.8000 0.8000Building Safety 0.0500 0.0500 0.0500 0.0500 0.0527 0.0535 0.1000 0.1000 0.1000 0.0990Bond and Interest 0.4652 0.4647 0.4832 0.5170 0.5670 0.6450 0.5863 0.6706 0.6730 0.6661
Total direct 5.3381 5.4520 5.5765 6.0152 6.5595 6.6884 7.2301 7.7810 7.9379 7.8031
OVERLAPPING RATES
Rockford School District Number 205 5.3381 5.4520 5.5765 6.0152 6.5595 6.6884 7.2301 7.781 7.9379 7.8031Winnebago County 0.7704 0.7835 0.7934 0.8299 0.8676 0.9423 1.0329 1.0845 1.0984 1.0826Winnebago County Forest Preserve District 0.0905 0.0859 0.0859 0.0898 0.0956 0.1072 0.1165 0.1199 0.1203 0.1207Rockford Township 0.1048 0.1052 0.1070 0.1088 0.1119 0.1200 0.1288 0.1394 0.1452 0.1455City of Rockford 2.2026 2.2085 2.2297 2.3595 2.5191 2.8178 3.0811 3.4325 3.3595 3.3207Rockford Park District 0.7198 0.7319 0.7455 0.7869 0.8432 0.9522 1.0577 1.1286 1.1629 1.1544Rock River Water Reclamation District 0.1221 0.1243 0.1268 0.1362 0.1469 0.1665 0.1856 0.2100 0.2075 0.2082Rockford Library District 0.3147 0.3233 0.3309 0.3564 0.3860 0.4422 0.4724 0.5042 0.5196 0.5190Greater Rockford Airport Authority 0.0884 0.0890 0.0901 0.0954 0.0937 0.1024 0.1043 0.1063 0.1073 0.1103Community College District Number 511 0.4410 0.4578 0.4583 0.4503 0.4541 0.4477 0.4630 0.4823 0.4893 0.4927Rockford Township Road 0.0918 0.0922 0.0939 0.0955 0.1049 0.1149 0.1299 0.1419 0.1484 0.1487
Total direct and overlapping rate 10.2842 10.4536 10.6380 11.3239 12.1825 12.9016 14.0023 15.1306 15.2963 15.1059
Data SourceWinnebago County Clerk's Office
Last Ten Levy Years
DIRECT AND OVERLAPPING PROPERTY TAX RATES
ROCKFORD, ILLINOIS
ROCKFORD PUBLIC SCHOOLS, DISTRICT #205
- 131 -
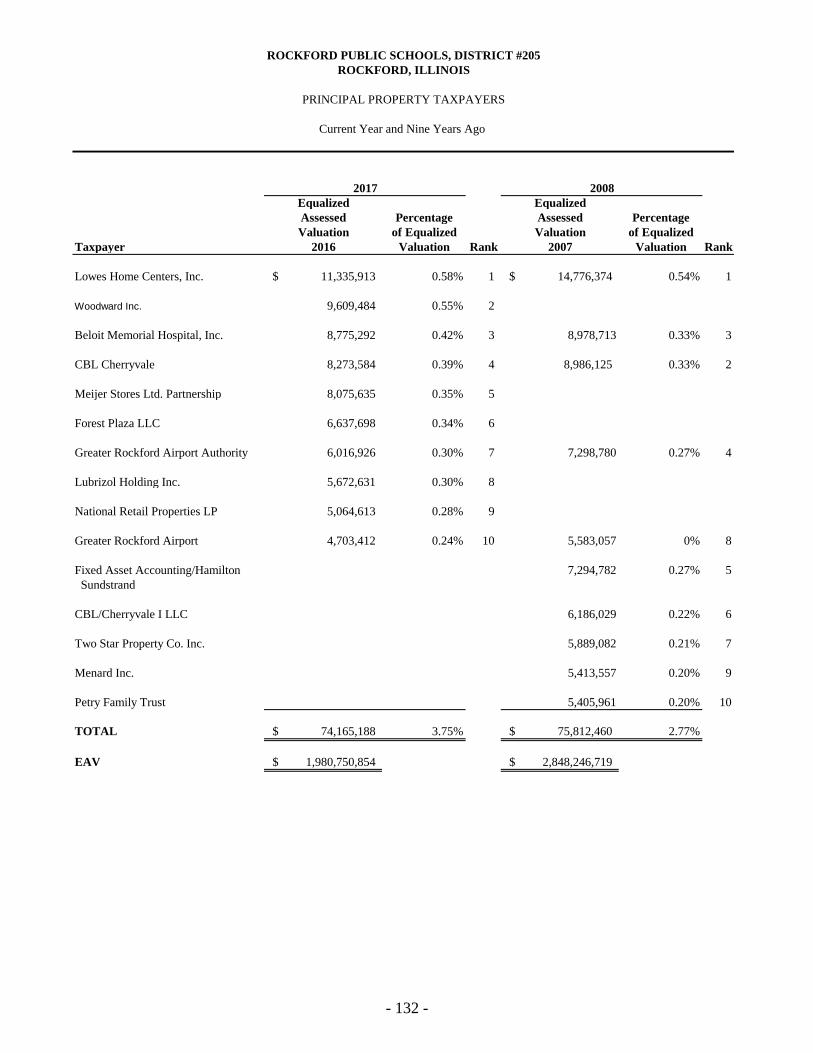
Equalized Equalized
Assessed Percentage Assessed Percentage
Valuation of Equalized Valuation of Equalized
Taxpayer 2016 Valuation Rank 2007 Valuation Rank
Lowes Home Centers, Inc. 11,335,913$ 0.58% 1 14,776,374$ 0.54% 1
Woodward Inc. 9,609,484 0.55% 2
Beloit Memorial Hospital, Inc. 8,775,292 0.42% 3 8,978,713 0.33% 3
CBL Cherryvale 8,273,584 0.39% 4 8,986,125 0.33% 2
Meijer Stores Ltd. Partnership 8,075,635 0.35% 5
Forest Plaza LLC 6,637,698 0.34% 6
Greater Rockford Airport Authority 6,016,926 0.30% 7 7,298,780 0.27% 4
Lubrizol Holding Inc. 5,672,631 0.30% 8
National Retail Properties LP 5,064,613 0.28% 9
Greater Rockford Airport 4,703,412 0.24% 10 5,583,057 0% 8
Fixed Asset Accounting/Hamilton 7,294,782 0.27% 5 Sundstrand
CBL/Cherryvale I LLC 6,186,029 0.22% 6
Two Star Property Co. Inc. 5,889,082 0.21% 7
Menard Inc. 5,413,557 0.20% 9
Petry Family Trust 5,405,961 0.20% 10
TOTAL 74,165,188$ 3.75% 75,812,460$ 2.77%
EAV 1,980,750,854$ 2,848,246,719$
ROCKFORD PUBLIC SCHOOLS, DISTRICT #205
ROCKFORD, ILLINOIS
PRINCIPAL PROPERTY TAXPAYERS
Current Year and Nine Years Ago
2017 2008
- 132 -

Extended
Tax Levied Collections Total
Levy for the Percentage in Subsequent Total Percentage of
Year LevyYear Amount of Levy Years Collections Levy
2016 155,618,090$ 73,037,752$ 46.93% -$ 73,037,752$ 46.93%
2015 155,435,776 80,879,886 52.03% 72,799,466 153,679,352 98.87%
2014 156,686,404 82,051,106 52.37% 73,263,439 155,314,545 99.12%
2013 154,944,440 78,137,811 50.43% 75,669,535 153,807,346 99.27%
2012 157,444,675 80,536,117 51.15% 75,869,353 156,405,470 99.34%
2011 169,840,442 86,990,557 51.22% 81,703,188 168,693,745 99.32%
2010 164,557,651 70,371,736 42.76% 93,190,642 163,562,378 99.40%
2009 157,864,109 78,503,250 49.73% 78,762,038 157,265,288 99.62%
2008 155,104,050 78,659,071 50.71% 75,622,156 154,281,227 99.47%
2007 146,735,090 72,873,963 49.66% 73,278,244 146,152,207 99.60%
Data Source
Winnebago County Clerk's Office
ROCKFORD PUBLIC SCHOOLS, DISTRICT #205
PROPERTY TAX LEVIES AND COLLECTIONS
Last Ten Levy Years
Fiscal Year of the Levy
Collections within the
ROCKFORD, ILLINOIS
- 133 -
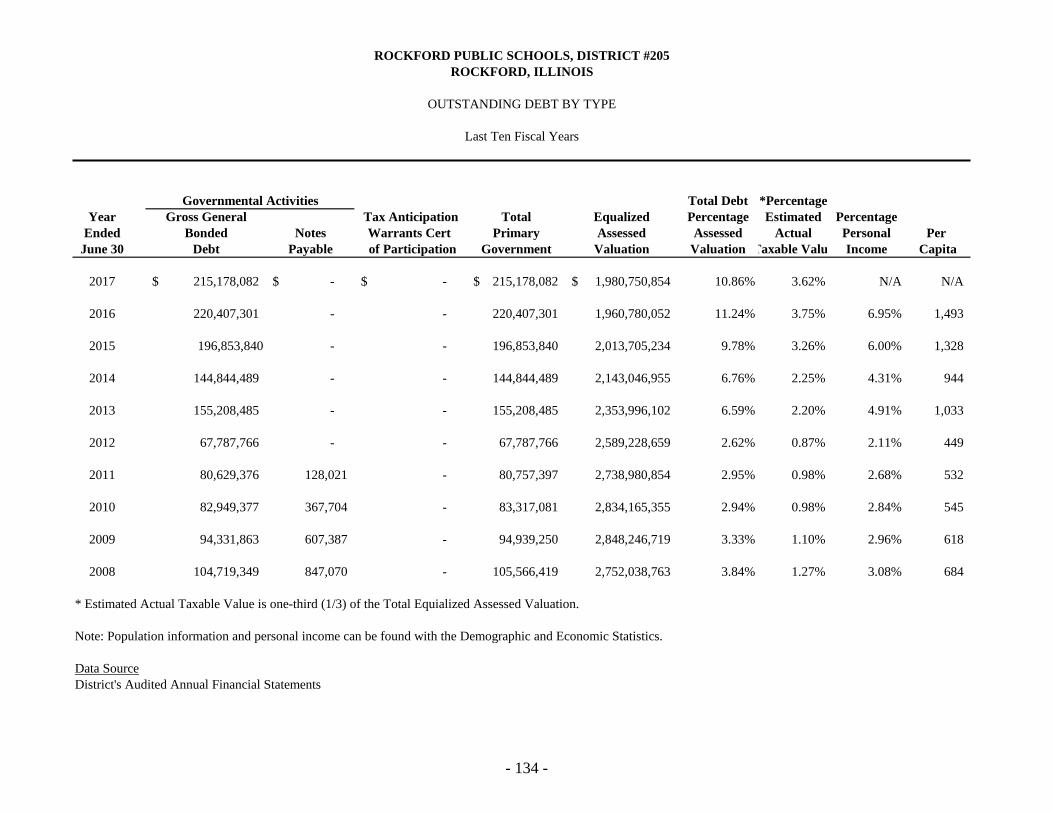
Total Debt *Percentage
Year Gross General Tax Anticipation Total Equalized Percentage Estimated Percentage
Ended Bonded Notes Warrants Cert Primary Assessed Assessed Actual Personal Per
June 30 Debt Payable of Participation Government Valuation Valuation Taxable Value Income Capita
2017 215,178,082$ -$ -$ 215,178,082$ 1,980,750,854$ 10.86% 3.62% N/A N/A
2016 220,407,301 - - 220,407,301 1,960,780,052 11.24% 3.75% 6.95% 1,493
2015 196,853,840 - - 196,853,840 2,013,705,234 9.78% 3.26% 6.00% 1,328
2014 144,844,489 - - 144,844,489 2,143,046,955 6.76% 2.25% 4.31% 944
2013 155,208,485 - - 155,208,485 2,353,996,102 6.59% 2.20% 4.91% 1,033
2012 67,787,766 - - 67,787,766 2,589,228,659 2.62% 0.87% 2.11% 449
2011 80,629,376 128,021 - 80,757,397 2,738,980,854 2.95% 0.98% 2.68% 532
2010 82,949,377 367,704 - 83,317,081 2,834,165,355 2.94% 0.98% 2.84% 545
2009 94,331,863 607,387 - 94,939,250 2,848,246,719 3.33% 1.10% 2.96% 618
2008 104,719,349 847,070 - 105,566,419 2,752,038,763 3.84% 1.27% 3.08% 684
* Estimated Actual Taxable Value is one-third (1/3) of the Total Equialized Assessed Valuation.
Note: Population information and personal income can be found with the Demographic and Economic Statistics.
Data SourceDistrict's Audited Annual Financial Statements
ROCKFORD PUBLIC SCHOOLS, DISTRICT #205
ROCKFORD, ILLINOIS
OUTSTANDING DEBT BY TYPE
Last Ten Fiscal Years
Governmental Activities
- 134 -

Estimated
Share of
See Estimated Direct and
Debt Note Percentage Overlapping
Outstanding Below Applicable (1) Debt
Overlapping DistrictsWinnebago County 110,315,000$ (1) 54.81% 60,463,652$ Winnebago County Forest Preserve 2,879,090 (2) 54.81% 1,578,029 Greater Rockford Airport Authority 27,345,638 75.11% 20,539,309 Village of Cherry Valley 192,000 (1) 100.00% 192,000 City of Loves Park 4,813,795 (1) 33.37% 1,606,363 City of Rockford 104,785,000 (1)(3) 98.57% 103,286,575 Village of Roscoe 2,185,000 1.95% 42,608 Sanitary District 37,420,000 72.30% 27,054,660 Rockford Park District 46,945,000 (1) 86.34% 40,532,313 Northwest Fire 645,000 96.83% 624,554 Community College District No. 511 100,865,000 (2) 70.27% 70,877,836
Total overlapping debt 438,390,523 326,797,897
District direct debt 215,178,082$ 100.00% 215,178,082
TOTAL DIRECT AND OVERLAPPING DEBT 541,975,979$
(2) Includes original principal amounts of outstanding General Obligation Capital Appreciation Bonds.(3) Excludes self-supporting bonds for which an abatement is filed annually.
Data SourceWinnebago County Clerks Office
June 30, 2017
ROCKFORD PUBLIC SCHOOLS, DISTRICT #205
COMPUTATION OF DIRECT AND OVERLAPPING GOVERNMENTAL ACTIVITIES DEBT
ROCKFORD, ILLINOIS
Note: The percentage of overlapping debt applicable is estimated using taxable assessed property values.Applicable percentages were estimated by determining the portion of the District's taxable assessed value thatis within the government's boundaries and dividing it by the District's total taxable assessed value.
(1) Excludes principal amounts of outstanding General Obligation (Alternate Revenue Source) Bonds whichare expected to be paid from sources other than general taxation.
- 135 -

Fiscal Year 2008 2009 2010 2011 2012 2013 2014 2015 2016 2017
Debt limit 379,781,349$ 393,058,047$ 391,114,819$ 377,979,358$ 357,313,555$ 324,851,462$ 296,077,402$ 278,233,677$ 270,587,647$ 273,343,618$
Total net debt applicable to limit 104,781,242 94,542,492 83,308,742 70,342,632 55,592,632 139,592,629 125,392,508 176,873,105 167,683,105 195,618,969
Legal debt margin 275,000,107$ 298,515,555$ 307,806,077$ 307,636,726$ 301,720,923$ 185,258,833$ 170,684,894$ 101,360,572$ 102,904,542$ 77,724,649$
TOTAL NET DEBT
APPLICABLE TO THE LIMIT AS
A PERCENTAGE OF DEBT LIMIT 27.59% 24.05% 21.30% 18.61% 15.56% 42.97% 42.35% 63.57% 61.97% 71.57%
FUTURE FINANCING: At the present time the District has no plans to issue additional debt. Legal Debt Margin Calculation for Fiscal 2016SHORT-TERM BORROWING: The District has no tax anticipation notes or warrents outstanding.DEBT PAYMENT HISTORY: The District has no record of default and has met its debt repayment obilgations promptly. Equalized Assessed Value 1,980,750,854$
Debt limit percentage 13.80%
Debt limit 273,343,618
Debt applicable to limit General obligation bonds 195,618,969
LEGAL DEBT MARGIN 77,724,649$
Last Ten Fiscal Years
LEGAL DEBT MARGIN INFORMATION
ROCKFORD, ILLINOIS
ROCKFORD PUBLIC SCHOOLS, DISTRICT #205
- 136 -

Total
Pledged Funds Debt
Fiscal Year Revenue Available Principal Interest Service Coverage
Corporatepersonal propertyreplacement
2017 tax 26,039,815$ -$ 1,185,804$ 1,185,804$ 4.55%
Note: Details of the District's outstanding debt can be found in the notes to the financial statements.
(Alternate Revenue Source -
Qualified School Construcion)
Series 2016
QUALIFIED SCHOOL CONSTRUCTION BONDS
ROCKFORD PUBLIC SCHOOLS, DISTRICT #205
ROCKFORD, ILLINOIS
PLEDGED REVENUE COVERAGE - ALTERNATE REVENUE SOURCE -
June 30, 2017
Allowable Funding Sources
GO Bonds
- 137 -

Per Capita
Calendar Estimated Personal Personal Winnebago Boone
Year Population Income Income County County
2016 147,651 3,169,771,668$ 21,468$ (a) 5.7% 5.3%
2015 148,278 3,283,023,198 22,141 6.4% 5.8%
2014 153,509 3,361,079,555 21,895 11.5% 11.8%
2013 150,251 3,158,426,271 21,021 11.6% 11.5%
2012 150,915 3,207,698,325 21,255 11.6% 11.8%
2011 151,904 3,013,775,360 19,840 12.7% 13.4%
2010 152,943 2,938,035,030 19,210 15.3% 15.9%
2009 153,587 3,211,657,757 20,911 14.8% 15.1%
2008 154,370 3,432,416,950 22,235 8.6% 9.5%
2007 154,206 3,425,994,702 22,217 6.3% 6.9%
Source: (a) U.S. Census Bureau; years 2014-2006 Rockford Region Economic Development District
ROCKFORD PUBLIC SCHOOLS, DISTRICT #205
DEMOGRAPHIC AND ECONOMIC INFORMATION
Last Ten Calendar Years
Unemployment Rate
ROCKFORD, ILLINOIS
- 138 -

Number of Percentage Number of Percentage
Employer Employees (1) Rank of Total Employees (2) Rank of Total
Fiat Chrysler Automobiles/Daimler Chrysler 4,323 1 17.3% 4,000 1 17.4%
Rockford School District 3,525 2 14.1% 3,500 2 15.2%
Mercyhealth/Rockford Health Systems 3,195 3 12.0% 2,900 3 12.6%
Swedish American Health System 2,988 4 12.0% 2,900 4 12.6%
OSF Healthcare 2,800 5 11.2% 2,000 7 8.7%
UTC Aerospace Systems 2,200 6 8.8%
Wal-Mart Stores 1,611 7 6.5%
Woodward 1,540 8 6.2% 1,300 8 5.7%
PCI - Packaging Coordinators, Inc. 1,500 9 6.0%
Winnebago County 1,449 10 5.8%
City of Rockford 1,201 9 5.2%
Hamilton Sundstrand Corporation 2,300 5 10.0%
United Parcel Service 2,200 6 9.6%
Cadbury Adams 700 10 3.0%
Total Employment 25,131 23,001
Data Source(1) Rockford Area Economic Development Council. 2017 data was not available at the time of publication.(2) Based on archived data (February 2007 telephone canvass of employers).
ROCKFORD PUBLIC SCHOOLS, DISTRICT #205
ROCKFORD, ILLINOIS
PRINCIPAL EMPLOYERS
Current Year and Nine Years Ago
2016 2007
- 139 -
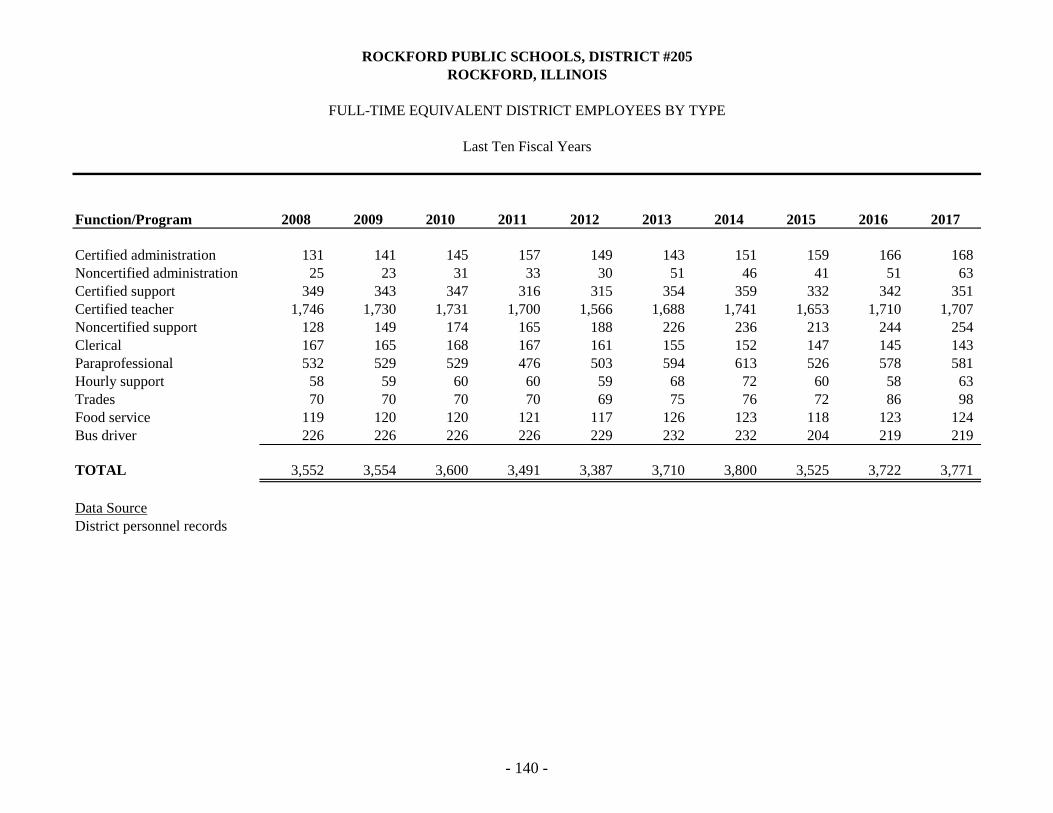
Function/Program 2008 2009 2010 2011 2012 2013 2014 2015 2016 2017
Certified administration 131 141 145 157 149 143 151 159 166 168 Noncertified administration 25 23 31 33 30 51 46 41 51 63 Certified support 349 343 347 316 315 354 359 332 342 351 Certified teacher 1,746 1,730 1,731 1,700 1,566 1,688 1,741 1,653 1,710 1,707 Noncertified support 128 149 174 165 188 226 236 213 244 254 Clerical 167 165 168 167 161 155 152 147 145 143 Paraprofessional 532 529 529 476 503 594 613 526 578 581 Hourly support 58 59 60 60 59 68 72 60 58 63 Trades 70 70 70 70 69 75 76 72 86 98 Food service 119 120 120 121 117 126 123 118 123 124 Bus driver 226 226 226 226 229 232 232 204 219 219
TOTAL 3,552 3,554 3,600 3,491 3,387 3,710 3,800 3,525 3,722 3,771
Data SourceDistrict personnel records
Last Ten Fiscal Years
FULL-TIME EQUIVALENT DISTRICT EMPLOYEES BY TYPE
ROCKFORD, ILLINOIS
ROCKFORD PUBLIC SCHOOLS, DISTRICT #205
- 140 -

Cost Cost
Fiscal Operating Per Percentage Total Per Percentage
Year Enrollment Expenditures Pupil Change Expenses Pupil Change
2017 28,512 472,183,832$ 16,560.88$ 11.81% 533,017,628$ 18,694.50$ 8.67%
2016 28,689 422,315,284 14,720.46 2.05% 490,510,765 17,097.52 0.78%
2015 29,325 413,820,788 14,111.54 8.47% 486,728,260 16,597.72 7.36%
2014 29,140 381,509,248 13,092.29 10.58% 453,362,616 15,558.09 21.32%
2013 29,090 345,019,950 11,860.43 7.11% 373,702,491 12,846.42 8.25%
2012 28,131 322,132,070 11,451.14 (6.22%) 345,211,038 12,271.55 (7.01%)
2011 29,485 343,480,436 11,649.33 3.29% 371,232,436 12,590.55 3.91%
2010 29,912 332,526,602 11,116.83 11.17% 357,251,382 11,943.41 10.50%
2009 29,066 299,112,812 10,290.81 5.72% 323,309,228 11,123.28 5.45%
2008 29,407 282,933,739 9,621.31 7.92% 306,605,499 10,426.28 5.88%
Note: Operating expenditures less debt service and capital outlay.
Data SourceDistrict records and audited financial statements
ROCKFORD PUBLIC SCHOOLS, DISTRICT #205
OPERATING STATISTICS
Last Ten Fiscal Years
ROCKFORD, ILLINOIS
- 141 -
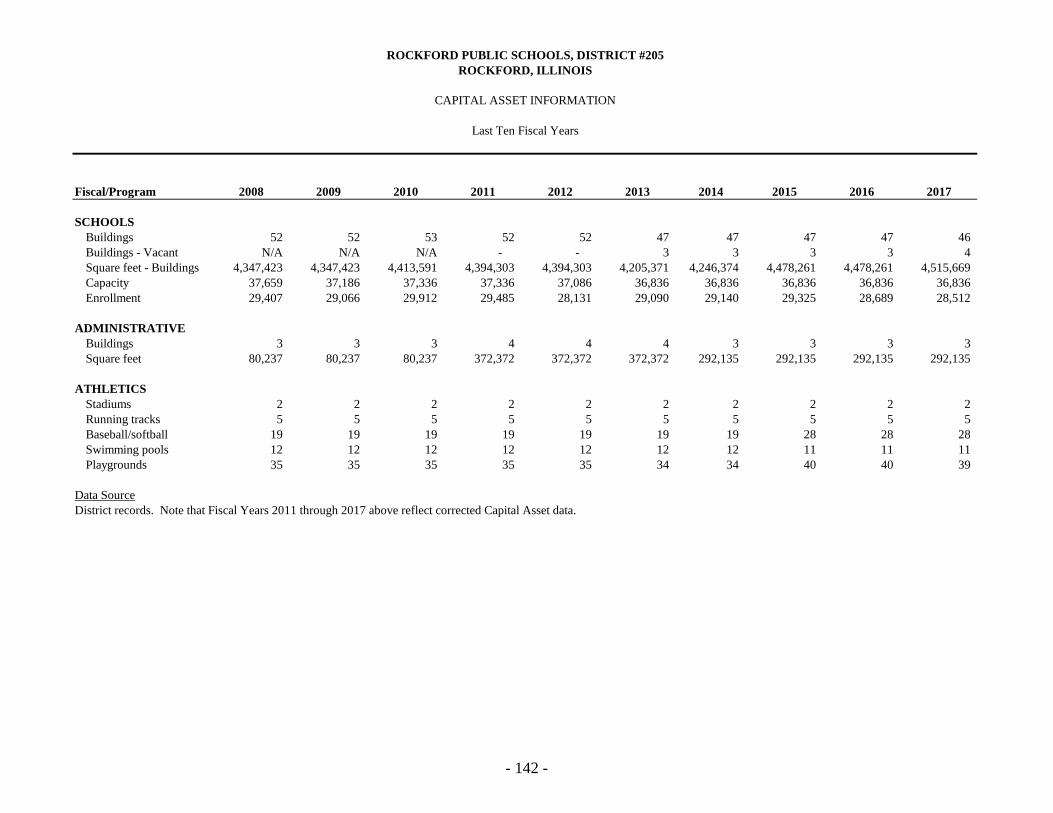
Fiscal/Program 2008 2009 2010 2011 2012 2013 2014 2015 2016 2017
SCHOOLS
Buildings 52 52 53 52 52 47 47 47 47 46 Buildings - Vacant N/A N/A N/A - - 3 3 3 3 4 Square feet - Buildings 4,347,423 4,347,423 4,413,591 4,394,303 4,394,303 4,205,371 4,246,374 4,478,261 4,478,261 4,515,669 Capacity 37,659 37,186 37,336 37,336 37,086 36,836 36,836 36,836 36,836 36,836 Enrollment 29,407 29,066 29,912 29,485 28,131 29,090 29,140 29,325 28,689 28,512
ADMINISTRATIVE
Buildings 3 3 3 4 4 4 3 3 3 3 Square feet 80,237 80,237 80,237 372,372 372,372 372,372 292,135 292,135 292,135 292,135
ATHLETICS
Stadiums 2 2 2 2 2 2 2 2 2 2 Running tracks 5 5 5 5 5 5 5 5 5 5 Baseball/softball 19 19 19 19 19 19 19 28 28 28 Swimming pools 12 12 12 12 12 12 12 11 11 11 Playgrounds 35 35 35 35 35 34 34 40 40 39
Data SourceDistrict records. Note that Fiscal Years 2011 through 2017 above reflect corrected Capital Asset data.
Last Ten Fiscal Years
CAPITAL ASSET INFORMATION
ROCKFORD, ILLINOIS
ROCKFORD PUBLIC SCHOOLS, DISTRICT #205
- 142 -

District State District State District State District State
ReadingGrade 3 56% 72% 57% 72% 57% 74% 59% 75%Grade 4 59% 73% 57% 74% 59% 74% 58% 75%Grade 5 61% 74% 60% 74% 61% 75% 63% 76%Grade 6 67% 79% 64% 80% 66% 81% 69% 84%Grade 7 65% 78% 63% 78% 60% 78% 60% 79%Grade 8 69% 81% 72% 84% 72% 84% 69% 85%
MathematicsGrade 3 75% 85% 78% 85% 77% 86% 76% 87%Grade 4 79% 85% 74% 86% 77% 86% 76% 88%Grade 5 77% 81% 76% 82% 75% 83% 76% 84%Grade 6 69% 83% 68% 82% 71% 85% 69% 84%Grade 7 66% 80% 69% 83% 69% 84% 70% 84%Grade 8 64% 80% 67% 82% 71% 84% 71% 86%
WritingGrade 3 X X X X X X X XGrade 5 X X X X X X X XGrade 6 X X X X X X X XGrade 8 X X X X X X X X
ScienceGrade 4 61% 76% 61% 77% 61% 77% 62% 79%Grade 7 69% 79% 69% 80% 68% 82% 66% 82%
Social StudiesGrade 4 X X X X X X X XGrade 7 X X X X X X X X
Prairie State Achievement ExamGrade 11 34% 53% 35% 53% 36% 53% 35% 51%
IMAGE X X X X X X X X
Overall ISATPerformance 67% 79% 67% 80% 67% 81% 67% 82%
Overall PerformanceAll State Tests 63% 75% 63% 76% 63% 76% 63% 77%
Overall PerformancePartnership for Assessment of Readiness for College and Careers (PARCC) X X X X X
X - Testing not administered
Data SourceIllinois State Board of Education
20102009
*These charts show the percentage of student scores meeting or exceeding expectations for the grades and subjects tested on Partnership forAssessment of Readiness for College (PARCC) that have demonstrated readiness for the next grade level/course and, ultimately, are on track forcollege and careers.
Note: These charts present the overall percentages of state test scores categorized as meeting or exceeding the Illinois Learning standards for theDistrict and the state. Illinois State Board of Education did not issue district-wide reports in 2000 and 2001. The 2007-08 school year was the firsttime that Limited English Proficient (LEP) students took the ISAT or PSAE (with accommodations) instead of the IMAGE test.
2008 2011
Last Ten Fiscal Years
DISTRICT/STATE AVERAGESTATE OF ILLINOIS STANDARDIZED TEST SUMMARY
ROCKFORD, ILLINOIS
ROCKFORD PUBLIC SCHOOLS, DISTRICT #205
- 143 -

District State District State District State District State District State
60% 76% 43% 59% 37% 55% 29% 35% 24% 36%61% 76% 42% 59% 41% 56% 29% 40% 23% 37%64% 78% 43% 59% 42% 58% 32% 38% 23% 35%65% 82% 38% 59% 38% 57% 29% 35% 26% 35%60% 78% 37% 58% 39% 59% 30% 40% 24% 37%69% 96% 38% 60% 34% 56% 25% 40% 22% 39%
75% 88% 39% 55% 36% 56% 21% 35% 21% 40%77% 88% 47% 60% 48% 64% 16% 28% 19% 31%73% 84% 47% 59% 56% 64% 18% 27% 19% 32%72% 85% 40% 60% 42% 60% 15% 27% 16% 29%68% 85% 39% 59% 36% 58% 15% 28% 16% 27%67% 85% 37% 59% 42% 60% 18% 32% 17% 32%
X X X X X X X X X XX X X X X X X X X XX X X X X X X X X XX X X X X X X X X X
63% 80% 65% 81% 61% 76% X X X X60% 80% 60% 79% 58% 80% X X X X
X X X X X X X X X XX X X X X X X X X X
35% 51% 39% 53% 39% 54% X X X X
X X X X X X X X X X
67% 82% 41% 59% 41% 59% X X X X
62% 77% 41% 58% 40% 58% 22% 33% 19% 33%
X X X X X X 23% 33% 19% 33%
2016 *2015 *20142012 2013
- 144 -