financial information - horiba
TRANSCRIPT

© 2021 HORIBA, Ltd. All rights reserved.
HORIBA, Ltd.
Financial Information
May, 2021
Nomura Investment Forum Asia 2021
1

© 2021 HORIBA, Ltd. All rights reserved. 2
2020 Results
2021 1Q (Jan.- Mar) Results
2021 Forecast
Topics – HORIBA’s Contribution for Social Issues
Shareholder Return
Financial Data
Corporate Profile
Contents

© 2021 HORIBA, Ltd. All rights reserved. 3
2020 Results
2021 1Q (Jan.- Mar) Results
2021 Forecast
Topics – HORIBA’s Contribution for Social Issues
Shareholder Return
Financial Data
Corporate Profile
Contents
© 2021 HORIBA, Ltd. All rights reserved. 4
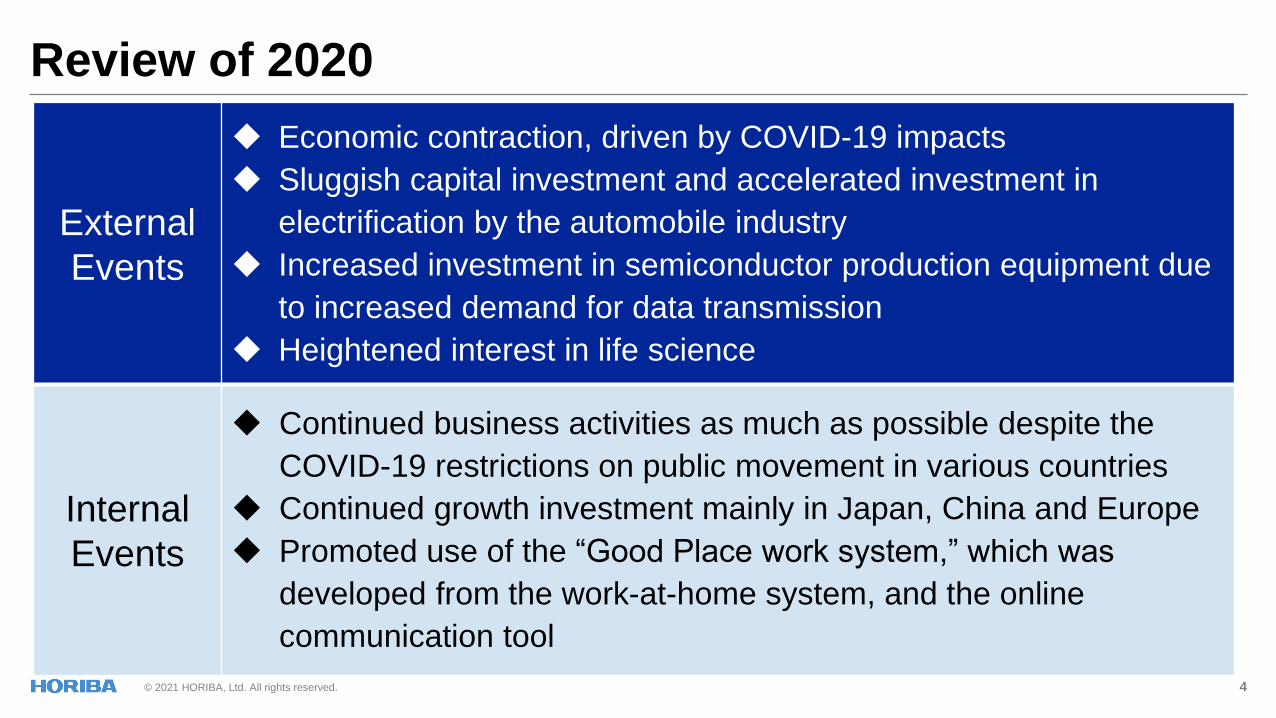
External
Events
Economic contraction, driven by COVID-19 impacts
Sluggish capital investment and accelerated investment in
electrification by the automobile industry
Increased investment in semiconductor production equipment due
to increased demand for data transmission
Heightened interest in life science
Internal
Events
Continued business activities as much as possible despite the
COVID-19 restrictions on public movement in various countries
Continued growth investment mainly in Japan, China and Europe
Promoted use of the “Good Place work system,” which was
developed from the work-at-home system, and the online
communication tool
Review of 2020
© 2021 HORIBA, Ltd. All rights reserved. 5
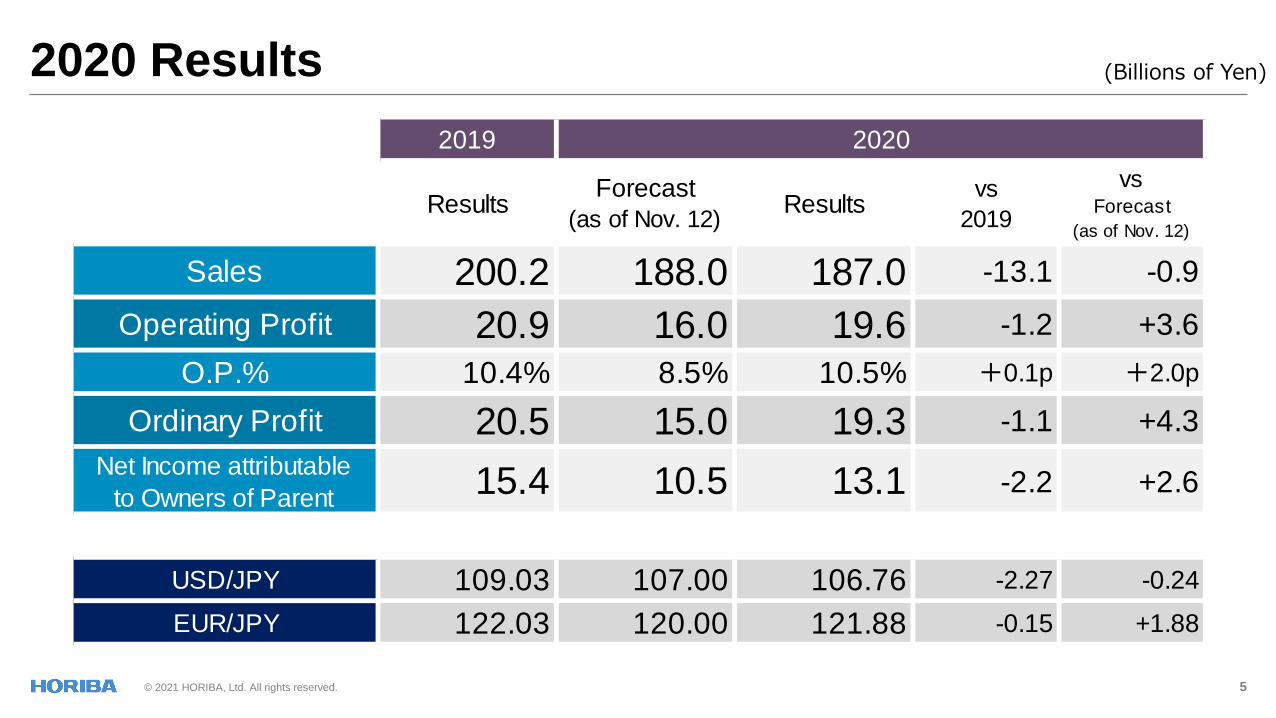
(Billions of Yen)2020 Results
2019
ResultsForecast
(as of Nov. 12)Results
vs
2019
vsForecast
(as of Nov. 12)
Sales 200.2 188.0 187.0 -13.1 -0.9
Operating Profit 20.9 16.0 19.6 -1.2 +3.6
O.P.% 10.4% 8.5% 10.5% +0.1p +2.0p
Ordinary Profit 20.5 15.0 19.3 -1.1 +4.3
Net Income attributable
to Owners of Parent15.4 10.5 13.1 -2.2 +2.6
USD/JPY 109.03 107.00 106.76 -2.27 -0.24
EUR/JPY 122.03 120.00 121.88 -0.15 +1.88
2020
© 2021 HORIBA, Ltd. All rights reserved.
2019 2019
Results Forecast(as of Nov. 12)
Resultsvs
2019
vs
Forecast(as of Nov. 12)
Results Forecast(as of Nov. 12)
Resultsvs
2019
vs
Forecast(as of Nov. 12)
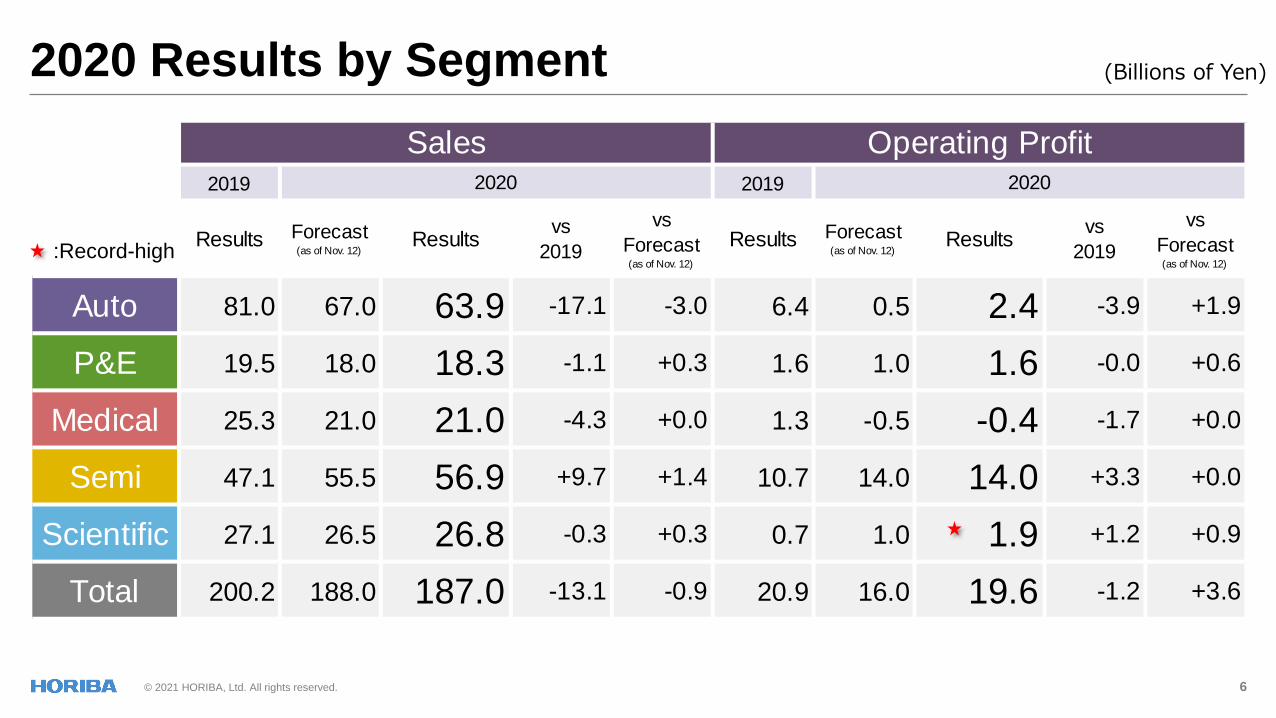
Auto 81.0 67.0 63.9 -17.1 -3.0 6.4 0.5 2.4 -3.9 +1.9
P&E 19.5 18.0 18.3 -1.1 +0.3 1.6 1.0 1.6 -0.0 +0.6
Medical 25.3 21.0 21.0 -4.3 +0.0 1.3 -0.5 -0.4 -1.7 +0.0
Semi 47.1 55.5 56.9 +9.7 +1.4 10.7 14.0 14.0 +3.3 +0.0
Scientific 27.1 26.5 26.8 -0.3 +0.3 0.7 1.0 1.9 +1.2 +0.9
Total 200.2 188.0 187.0 -13.1 -0.9 20.9 16.0 19.6 -1.2 +3.6
Sales Operating Profit2020 2020
6
2020 Results by Segment (Billions of Yen)
:Record-high
© 2021 HORIBA, Ltd. All rights reserved. 7
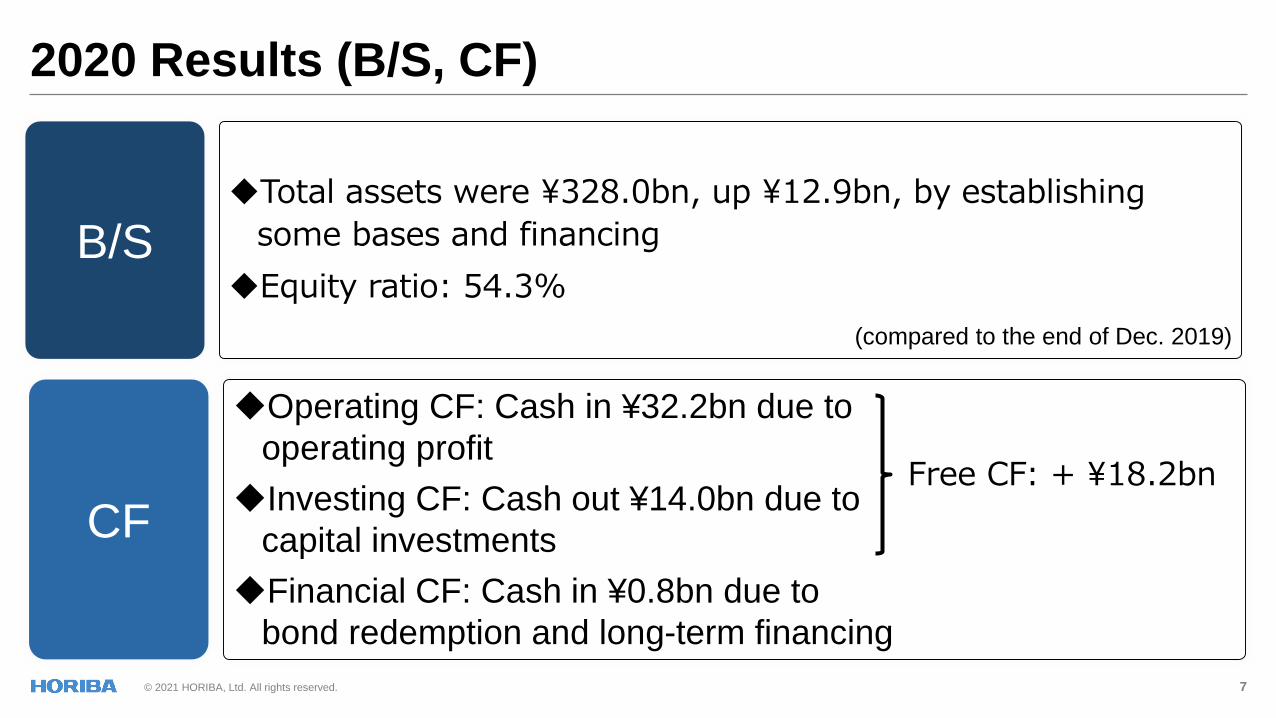
2020 Results (B/S, CF)
Total assets were ¥328.0bn, up ¥12.9bn, by establishing
some bases and financing
Equity ratio: 54.3%B/S
CFFree CF: + ¥18.2bn
(compared to the end of Dec. 2019)
Operating CF: Cash in ¥32.2bn due to
operating profit
Investing CF: Cash out ¥14.0bn due to
capital investments
Financial CF: Cash in ¥0.8bn due to
bond redemption and long-term financing

© 2021 HORIBA, Ltd. All rights reserved. 8
2020 Results
2021 1Q (Jan.- Mar) Results
2021 Forecast
Topics – HORIBA’s Contribution for Social Issues
Shareholder Return
Financial Data
Corporate Profile
Contents
© 2021 HORIBA, Ltd. All rights reserved. 9
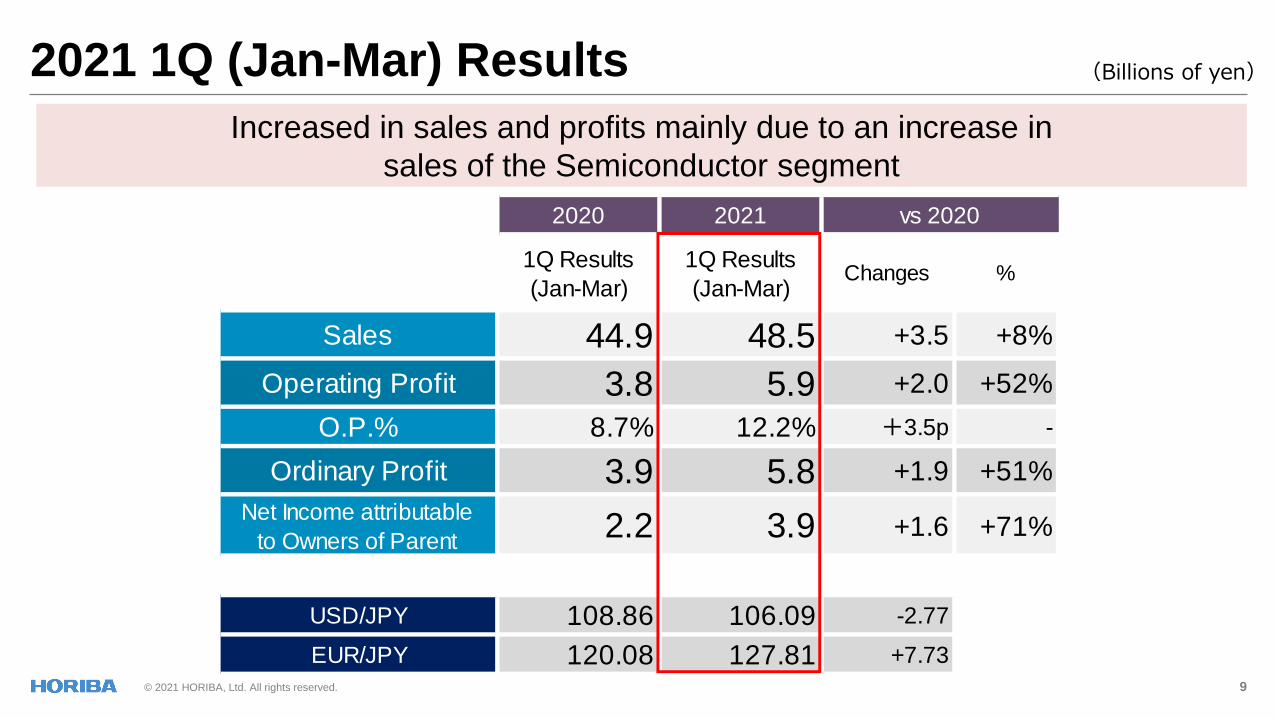
(Billions of yen)2021 1Q (Jan-Mar) Results
Increased in sales and profits mainly due to an increase in
sales of the Semiconductor segment
2020 2021
1Q Results
(Jan-Mar)
1Q Results
(Jan-Mar)Changes %
Sales 44.9 48.5 +3.5 +8%
Operating Profit 3.8 5.9 +2.0 +52%
O.P.% 8.7% 12.2% +3.5p -
Ordinary Profit 3.9 5.8 +1.9 +51%
Net Income attributable
to Owners of Parent2.2 3.9 +1.6 +71%
USD/JPY 108.86 106.09 -2.77
EUR/JPY 120.08 127.81 +7.73
vs 2020
© 2021 HORIBA, Ltd. All rights reserved. 10
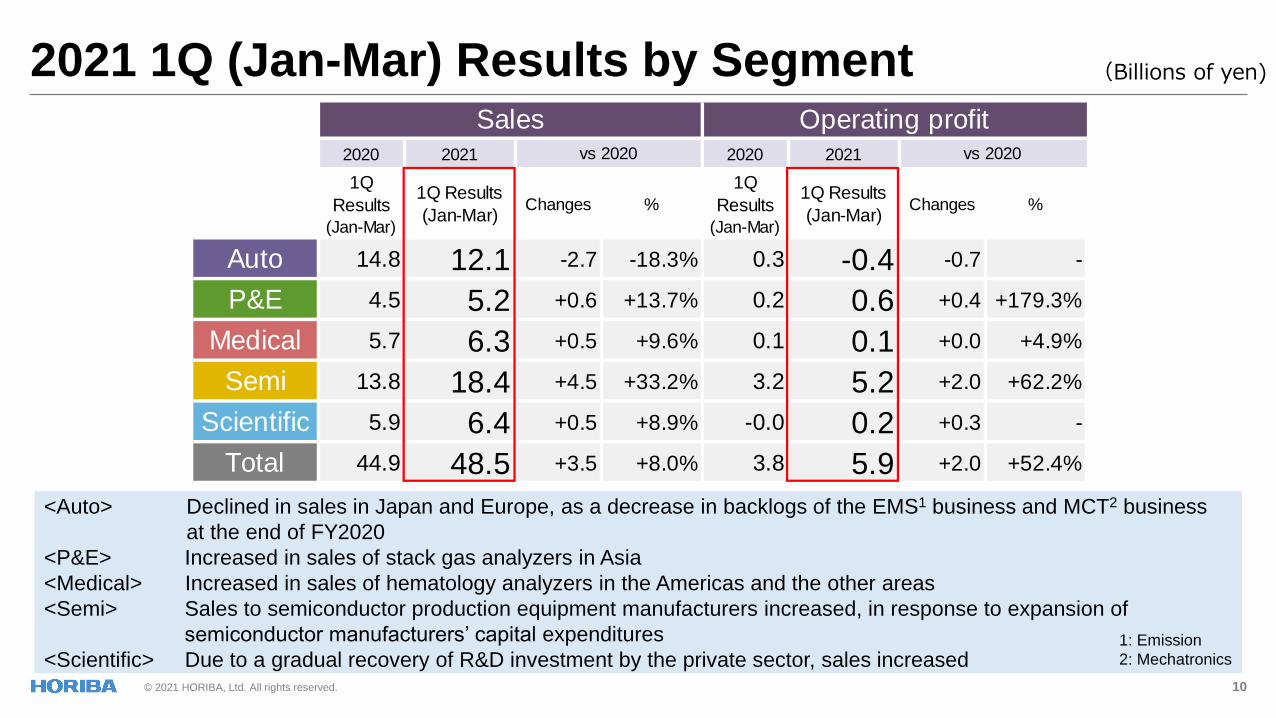
(Billions of yen)2021 1Q (Jan-Mar) Results by Segment
<Auto> Declined in sales in Japan and Europe, as a decrease in backlogs of the EMS1 business and MCT2 business
at the end of FY2020
<P&E> Increased in sales of stack gas analyzers in Asia
<Medical> Increased in sales of hematology analyzers in the Americas and the other areas
<Semi> Sales to semiconductor production equipment manufacturers increased, in response to expansion of
semiconductor manufacturers’ capital expenditures
<Scientific> Due to a gradual recovery of R&D investment by the private sector, sales increased1: Emission
2: Mechatronics
2020 2021 2020 2021
1Q
Results
(Jan-Mar)
1Q Results
(Jan-Mar)Changes %
1Q
Results
(Jan-Mar)
1Q Results
(Jan-Mar)Changes %
Auto 14.8 12.1 -2.7 -18.3% 0.3 -0.4 -0.7 -
P&E 4.5 5.2 +0.6 +13.7% 0.2 0.6 +0.4 +179.3%
Medical 5.7 6.3 +0.5 +9.6% 0.1 0.1 +0.0 +4.9%
Semi 13.8 18.4 +4.5 +33.2% 3.2 5.2 +2.0 +62.2%
Scientific 5.9 6.4 +0.5 +8.9% -0.0 0.2 +0.3 -
Total 44.9 48.5 +3.5 +8.0% 3.8 5.9 +2.0 +52.4%
Sales Operating profitvs 2020 vs 2020
© 2021 HORIBA, Ltd. All rights reserved. 11
2020 Results
2021 1Q (Jan.- Mar) Results
2021 Forecast
Topics – HORIBA’s Contribution for Social Issues
Shareholder Return
Financial Data
Corporate Profile
Contents
© 2021 HORIBA, Ltd. All rights reserved. 12
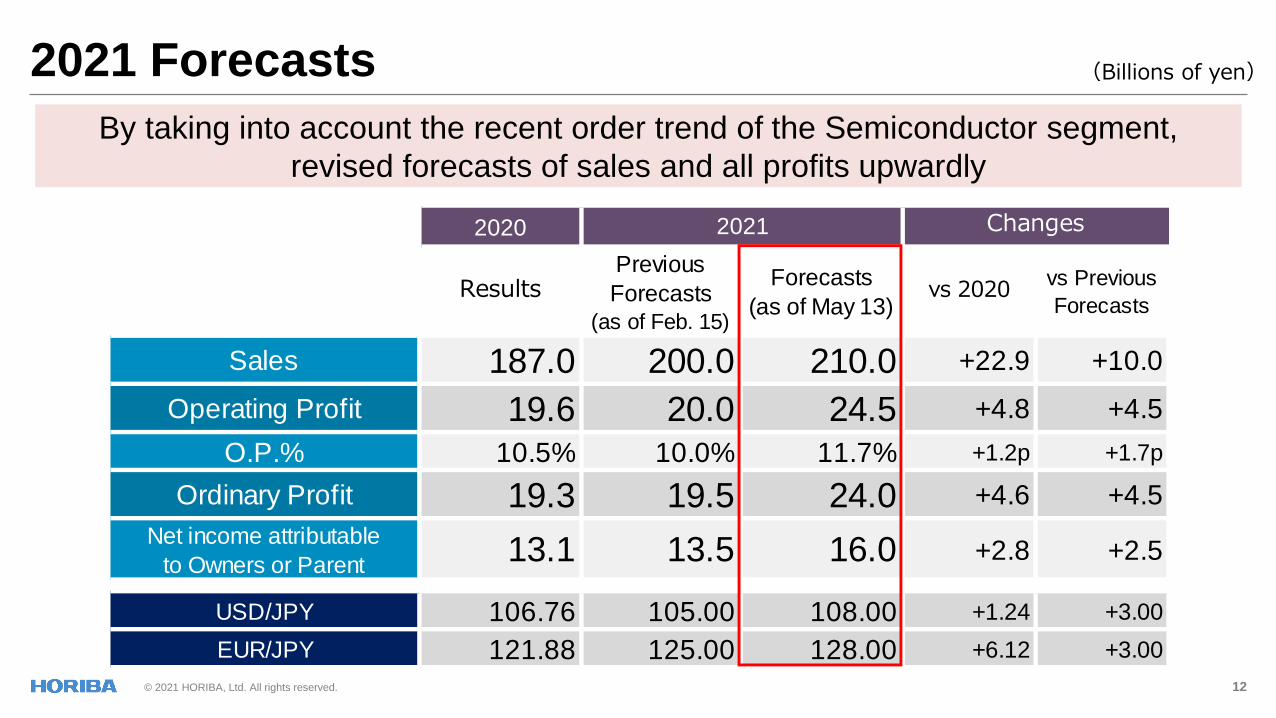
2021 Forecasts (Billions of yen)
By taking into account the recent order trend of the Semiconductor segment,
revised forecasts of sales and all profits upwardly
2020
ResultsPrevious
Forecasts
(as of Feb. 15)
Forecasts
(as of May 13)vs 2020
vs Previous
Forecasts
Sales 187.0 200.0 210.0 +22.9 +10.0
Operating Profit 19.6 20.0 24.5 +4.8 +4.5
O.P.% 10.5% 10.0% 11.7% +1.2p +1.7p
Ordinary Profit 19.3 19.5 24.0 +4.6 +4.5
Net income attributable
to Owners or Parent13.1 13.5 16.0 +2.8 +2.5
USD/JPY 106.76 105.00 108.00 +1.24 +3.00
EUR/JPY 121.88 125.00 128.00 +6.12 +3.00
2021 Changes

© 2021 HORIBA, Ltd. All rights reserved.
2020 2020
Results
Previous
Forecasts
(as of Feb. 15)
Forecasts
(as of May 13)vs 2020
vs Previous
ForecastsResults
Previous
Forecasts
(as of Feb. 15)
Forecasts
(as of May 13)vs 2020
vs Previous
Forecasts
Auto 63.9 64.0 64.0 +0.0 - 2.4 1.0 1.0 -1.4 -
P&E 18.3 21.0 21.0 +2.6 - 1.6 1.5 1.5 -0.1 -
Medical 21.0 25.0 25.0 +3.9 - -0.4 0.5 0.5 +0.9 -
Semi 56.9 61.0 71.0 +14.0 +10.0 14.0 15.5 20.0 +5.9 +4.5
Scientific 26.8 29.0 29.0 +2.1 - 1.9 1.5 1.5 -0.4 -
Total 187.0 200.0 210.0 +22.9 +10.0 19.6 20.0 24.5 +4.8 +4.5
Sales Operating
2021 Changes 2021 Changes
13
2021 Forecasts by Segments (Billions of yen)
<Semi> Revised sales upward by 25% year-on-year, considering the recent order trend
<General> Recognize the procurement risk mainly due to the global shortage of electronic components
:Record-high
© 2021 HORIBA, Ltd. All rights reserved. 14
2020 Results
2021 1Q (Jan.- Mar) Results
2021 Forecast
Topics – HORIBA’s Contribution for Social Issues
Shareholder Return
Financial Data
Corporate Profile
Contents
© 2021 HORIBA, Ltd. All rights reserved. 15
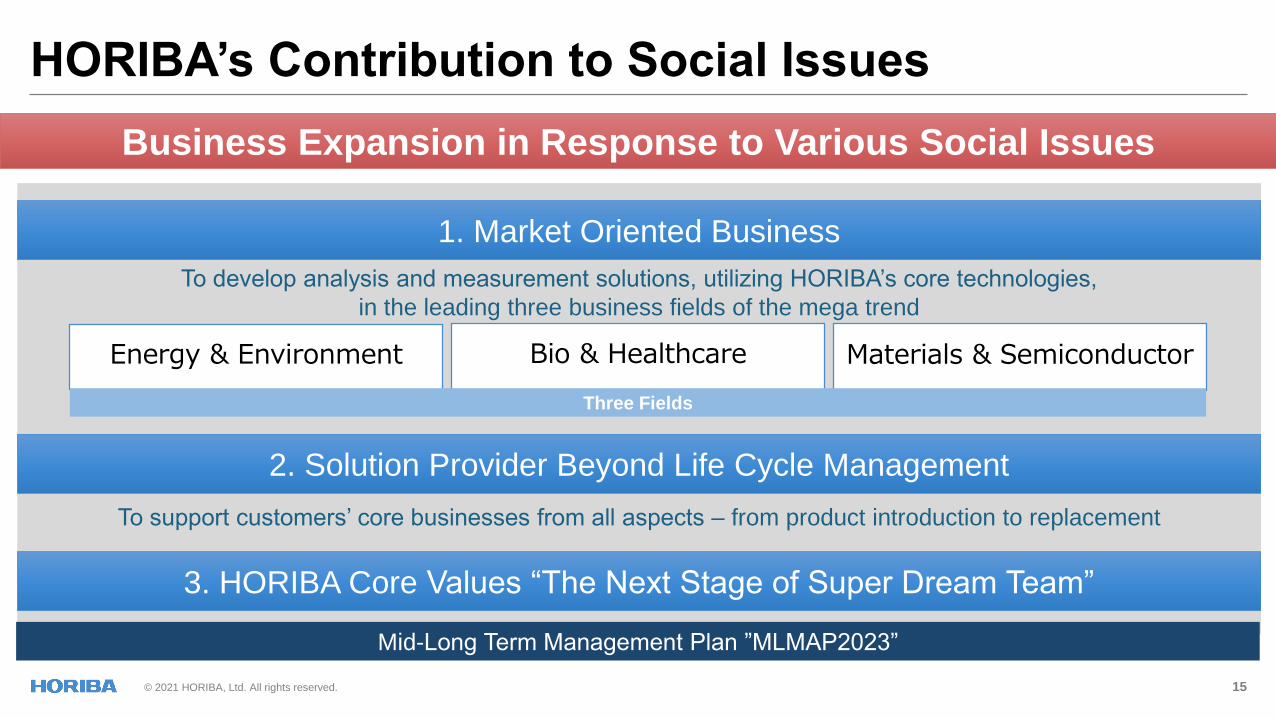
HORIBA’s Contribution to Social Issues
Business Expansion in Response to Various Social Issues
1. Market Oriented Business
Energy & Environment Bio & Healthcare Materials & Semiconductor
2. Solution Provider Beyond Life Cycle Management
To develop analysis and measurement solutions, utilizing HORIBA’s core technologies,
in the leading three business fields of the mega trend
To support customers’ core businesses from all aspects – from product introduction to replacement
Three Fields
3. HORIBA Core Values “The Next Stage of Super Dream Team”
Mid-Long Term Management Plan ”MLMAP2023”
© 2021 HORIBA, Ltd. All rights reserved. 16
MLMAP2023
Market Oriented BusinessMaterials & Semiconductor
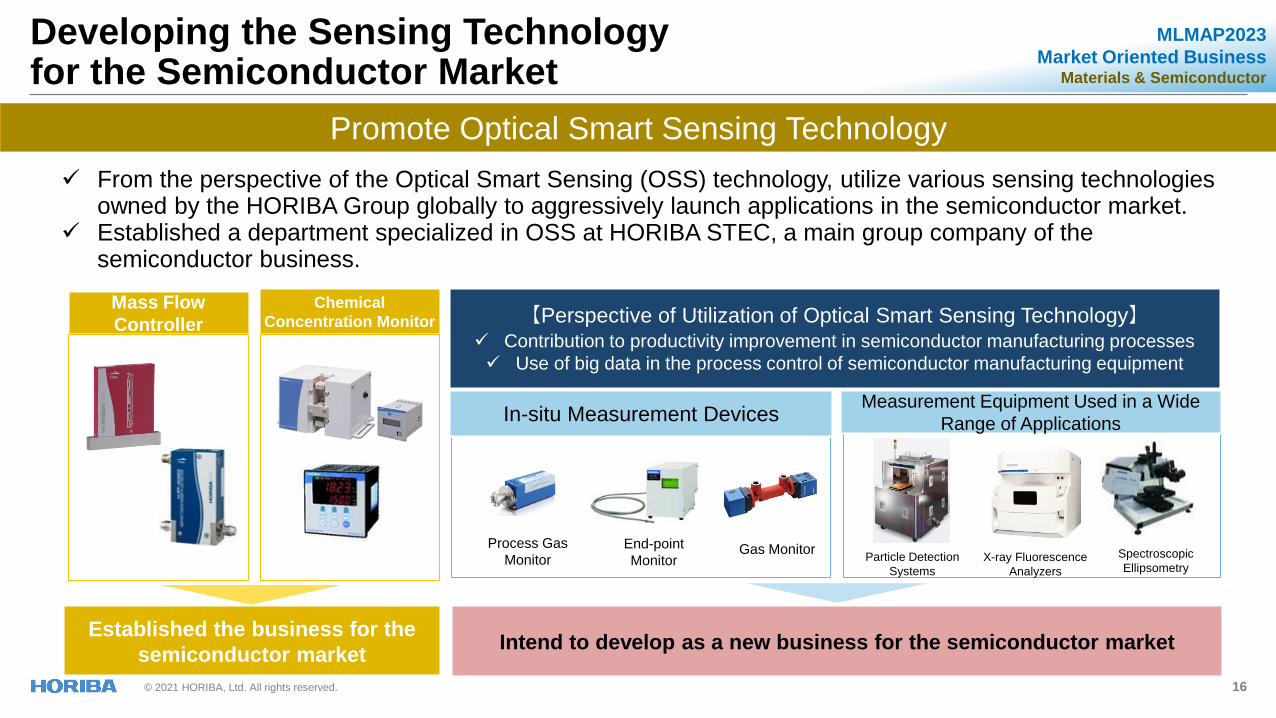
Promote Optical Smart Sensing Technology
From the perspective of the Optical Smart Sensing (OSS) technology, utilize various sensing technologies owned by the HORIBA Group globally to aggressively launch applications in the semiconductor market.
Established a department specialized in OSS at HORIBA STEC, a main group company of the semiconductor business.
Mass Flow
Controller
Chemical
Concentration Monitor
Established the business for the
semiconductor marketIntend to develop as a new business for the semiconductor market
【Perspective of Utilization of Optical Smart Sensing Technology】 Contribution to productivity improvement in semiconductor manufacturing processes
Use of big data in the process control of semiconductor manufacturing equipment
In-situ Measurement Devices
Particle Detection
Systems
X-ray Fluorescence
Analyzers
Spectroscopic
Ellipsometry
Process Gas
MonitorEnd-point
Monitor
Measurement Equipment Used in a Wide
Range of Applications
Developing the Sensing Technology for the Semiconductor Market
Gas Monitor
© 2021 HORIBA, Ltd. All rights reserved. 17
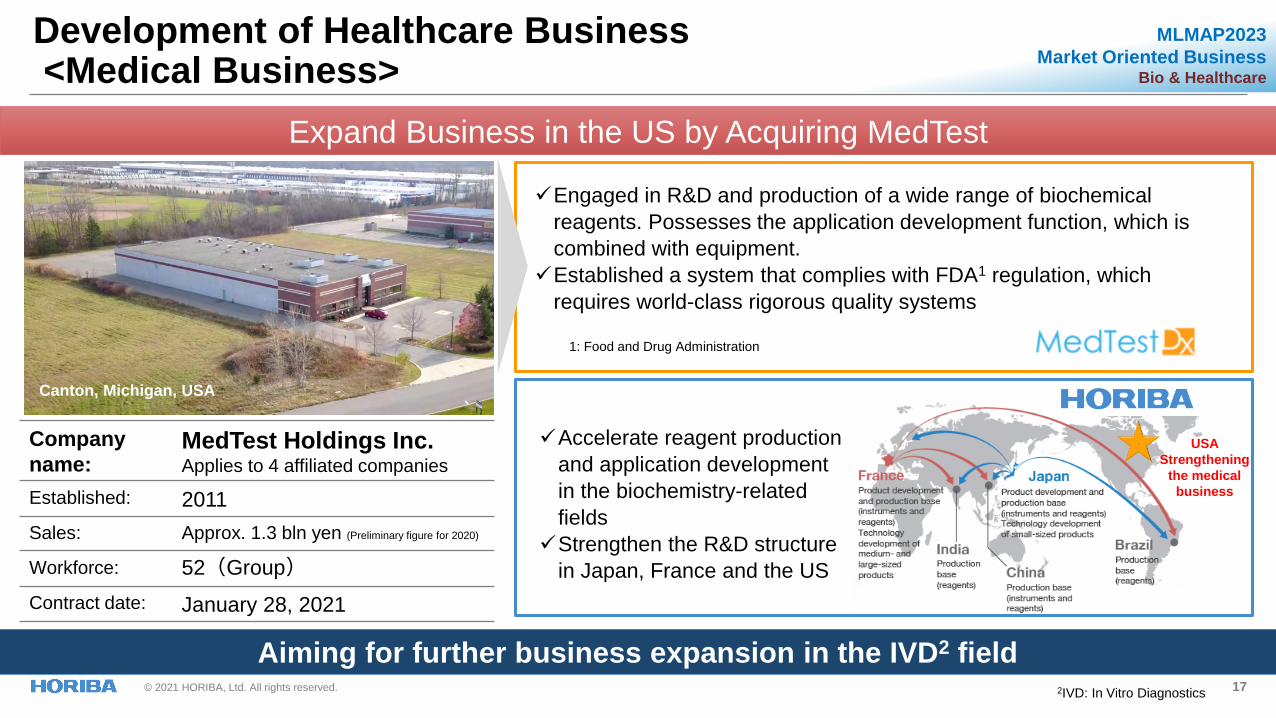
Expand Business in the US by Acquiring MedTest
Company
name:MedTest Holdings Inc.Applies to 4 affiliated companies
Established: 2011
Sales: Approx. 1.3 bln yen (Preliminary figure for 2020)
Workforce: 52(Group)
Contract date: January 28, 2021
Canton, Michigan, USA
MLMAP2023
Market Oriented BusinessBio & Healthcare
Accelerate reagent production
and application development
in the biochemistry-related
fields
Strengthen the R&D structure
in Japan, France and the US
Engaged in R&D and production of a wide range of biochemical
reagents. Possesses the application development function, which is
combined with equipment.
Established a system that complies with FDA1 regulation, which
requires world-class rigorous quality systems
USA
Strengthening
the medical
business
2IVD: In Vitro Diagnostics
Aiming for further business expansion in the IVD2 field
Development of Healthcare Business<Medical Business>
1: Food and Drug Administration

© 2021 HORIBA, Ltd. All rights reserved.
MLMAP2023
Market Oriented BusinessBio & Healthcare
18
Business Expansion in the Pharmaceutical Industry
Contribution in a Wide Range, from R&D to Production Processes
Probe
Probe
Probe
Pharmaceutical process evaluation
Process Raman System
Bioreactor
Analytical Probe &
Microscopic Raman
Reactor monitoring in the
pharmaceutical
manufacturing process
• API concentration, crystal
polymorph monitoring
• Control of hydrates, etc.
ViewsizerTM
3000
Nanoparticle Measurement
Instrument
Microbial Rapid
Inspection Device
Rapica
Highly-sensitive and rapid microbial
contamination inspectionAnalysis of exosomes1 in blood
1: Exosomes: Granular materials, diameter
50-150nm, secreted by various cells
Inspection for vaccine shipping
Aqualog
Fluorescence AnalyzerTransmission Raman
Spectrometer
Quantitative analysis of medicinal
ingredients in tablets

© 2021 HORIBA, Ltd. All rights reserved. 19
Hydrogen Energy: "Clean," "Storable and Transportable," and "Inexhaustible"
Hydrogen Smartly
Production Storage Use
"Hydrogen Energy Project,” a cross-organization consisting of five existing businesses, was established in order to strengthen efforts in the
hydrogen-related market.
Aiming to contribute to a hydrogen energy society by using HORIBA's core technology in capturing various aspects of hydrogen
Water Electrolysis Cell
Performance EvaluationHydrogen Embrittlement Evaluation Fuel Cell System Evaluation
Evaluator
EC/ESControl the
temperature and
flow volume of
water and evaluate
the performance
and efficiency of
water electrolysis
cells up to 5000 kW.
rf-GD-OES1 (GDS)
Evaluate the
hydrogen
distribution during
plating. Identify the
release of hydrogen
Evaluator
EC/ESMeet the fuel cell
test requirements of
the R&D stage and
conduct
performance
evaluation and
cycle evaluation
Please see the link to the website for other products (Japanese only).
https://www.horiba.com/jp/corporate-news/events/horiba-showcase/wsew/2020/corner/fc-expo/
A wide range of coverage
from demonstration experiments to practical use
Established the Hydrogen Energy Project
MLMAP2023
Market Oriented BusinessEnergy & EnvironmentHydrogen Energy Society and HORIBA
1: Radio Frequency Glow
Discharge Optical
Emission Spectrometry

© 2021 HORIBA, Ltd. All rights reserved.
Vehicle Drivetrain Engine Battery/Fuel Cell
Measurement
Analyzer
Testing
Procedures
Engineering
HORIBA's Technologies
Vehicle Electrification and HORIBA
Provide Total Solution for the Vehicle Development – from Internal Combustion Engine to Electrification
MLMAP2023
Market Oriented BusinessEnergy & Environment
Electrified
Vehicle
Vehicle type PowertrainR&D Technology requirement
Vehicle Drivetrain Engine Batty/Fuel cell
(ICE) Internal Combustion Engine Vehicle Engine ✔ ✔ ✔
(HEV) Hybrid Electric Vehicle Engine + Motor ✔ ✔ ✔ ✔
(PHEV) Plug-in Hybrid Electric Vehicle Motor + Engine ✔ ✔ ✔ ✔
(FCEV) Fuel Cell Electric Vehicle Motor ✔ ✔ ✔
(BEV) Battery Electric vehicle Motor ✔ ✔ ✔
20
© 2021 HORIBA, Ltd. All rights reserved.
COMMUNICATION
SIMULATION
21
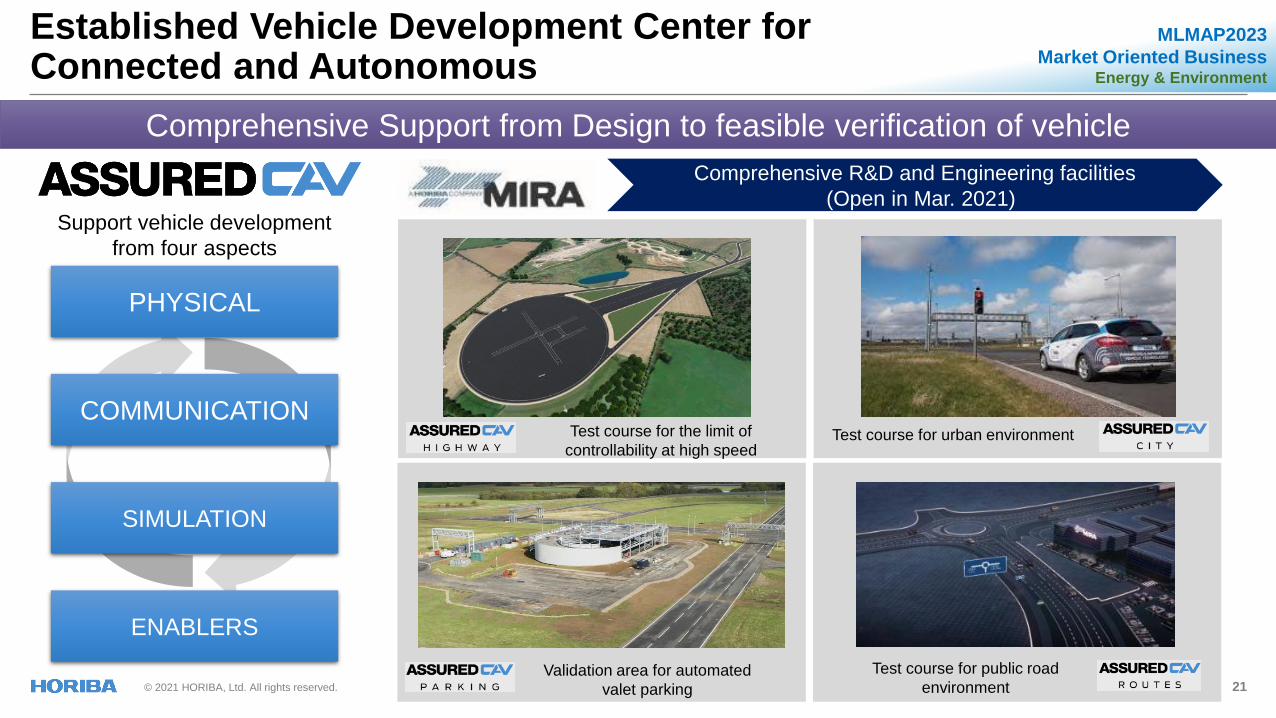
Comprehensive Support from Design to feasible verification of vehicle
PHYSICAL
ENABLERS
Support vehicle development
from four aspects
Test course for the limit of
controllability at high speedTest course for urban environment
Validation area for automated
valet parking
Test course for public road
environment
Comprehensive R&D and Engineering facilities
(Open in Mar. 2021)
MLMAP2023
Market Oriented BusinessEnergy & Environment
Established Vehicle Development Center for Connected and Autonomous

© 2021 HORIBA, Ltd. All rights reserved. 22
HORIBA MIRA's Latest Projects
MIRA technology park
Lease out the R&D Buildings
to vehicle manufacturing
companies etc.
Companies, which supply the
innovative vehicle-related
products globally, are located
in MIRA technology park
HORIBA MIRA & REE Automotive HORIBA MIRA & TOGG
Test circuits in HORIBA MIRA
Invited REE Automotive1 to open its Engineering Center of
Excellence in MIRA Technology Park
Supporting REE Automotive to develop their EV platform
and to supply globally
1: REE Automotive Ltd : a start-up company related to EV in Israel
Be a key partner of TOGG during the development
project of its pioneering electric SUV
TOGG will utilize the test sites and equipment in MIRA
technology park to implement the vehicle durability tests
and others
Up to 38 test equipment supports
vehicle development which
satisfy the global standard
MLMAP2023
Market Oriented BusinessEnergy & Environment
Vehicle Electrification and HORIBA[HORIBA MIRA]
© 2021 HORIBA, Ltd. All rights reserved. 23
MLMAP2023
Market Oriented BusinessEnergy & Environment/Materials & Semiconductor
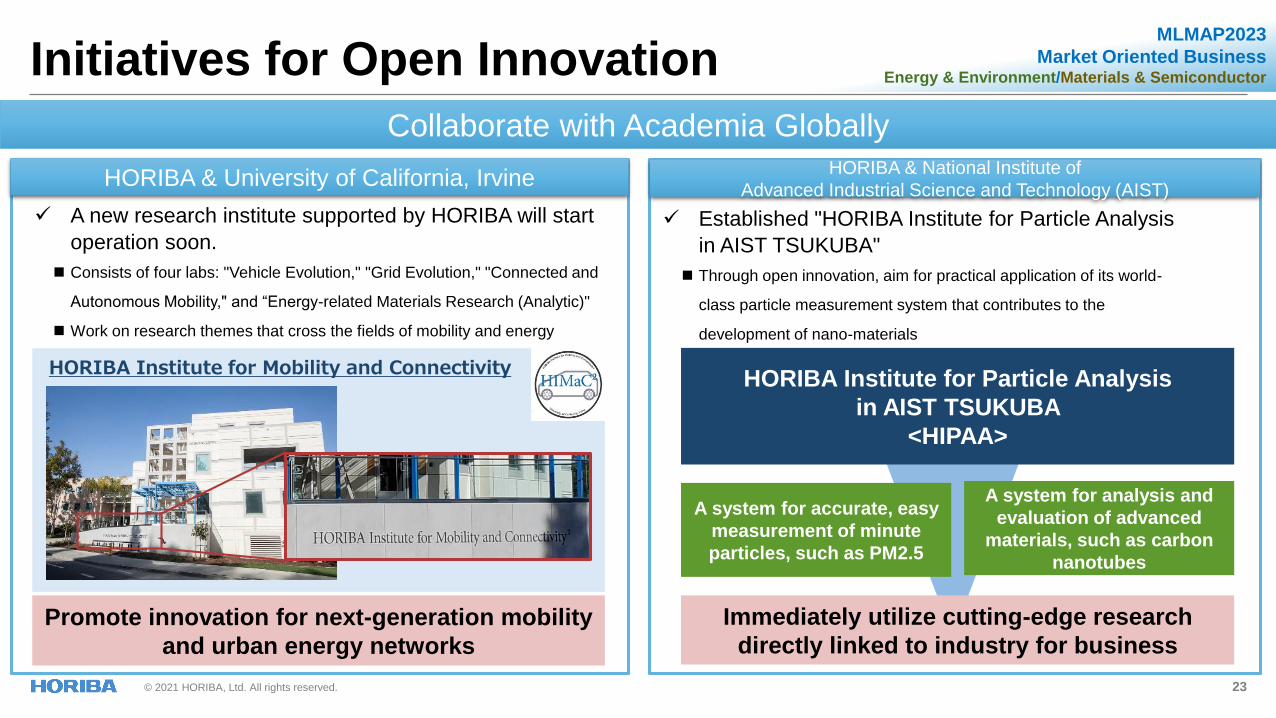
Established "HORIBA Institute for Particle Analysis
in AIST TSUKUBA"
Through open innovation, aim for practical application of its world-
class particle measurement system that contributes to the
development of nano-materials
Collaborate with Academia Globally
HORIBA Institute for Particle Analysis
in AIST TSUKUBA
<HIPAA>
A system for accurate, easy
measurement of minute
particles, such as PM2.5
A system for analysis and
evaluation of advanced
materials, such as carbon
nanotubes
Immediately utilize cutting-edge research
directly linked to industry for business
Initiatives for Open Innovation
A new research institute supported by HORIBA will start
operation soon.
Consists of four labs: "Vehicle Evolution," "Grid Evolution," "Connected and
Autonomous Mobility," and “Energy-related Materials Research (Analytic)"
Work on research themes that cross the fields of mobility and energy
HORIBA & University of California, IrvineHORIBA & National Institute of
Advanced Industrial Science and Technology (AIST)
Promote innovation for next-generation mobility
and urban energy networks
HORIBA Institute for Mobility and Connectivity

© 2021 HORIBA, Ltd. All rights reserved. 24
Leading the Market as an Advanced Company in Spectroscopic Technology
Relocated an R&D and production base in Lille, France and doubled the
building area.
Strengthened spectroscopic technology engineering and production
functions.
Expanded the target market to a wide range of fields from semiconductors
to pharmaceuticals and drug discovery, and cells and genes.
Strengthened functions and realized
development and supply of higher
quality products.
Increased importance of the bio-life
science field
Rising demand in spectroscopic
analysis technology and equipment Location: Premises of HORIBA
FRANCE SAS (Lille, France )
Workforce: 106 (as of Jan. 2021)
Investment: Approx. 1.3 billion yen
LabRAM Soleil
【Raman Spectrometers】
Use for analysis of material
composition and molecular
structure
MLMAP2023
Market Oriented BusinessMaterials & Semiconductor
Opened a Production Base for Advanced Spectroscopic Technology in Europe
© 2021 HORIBA, Ltd. All rights reserved. 25
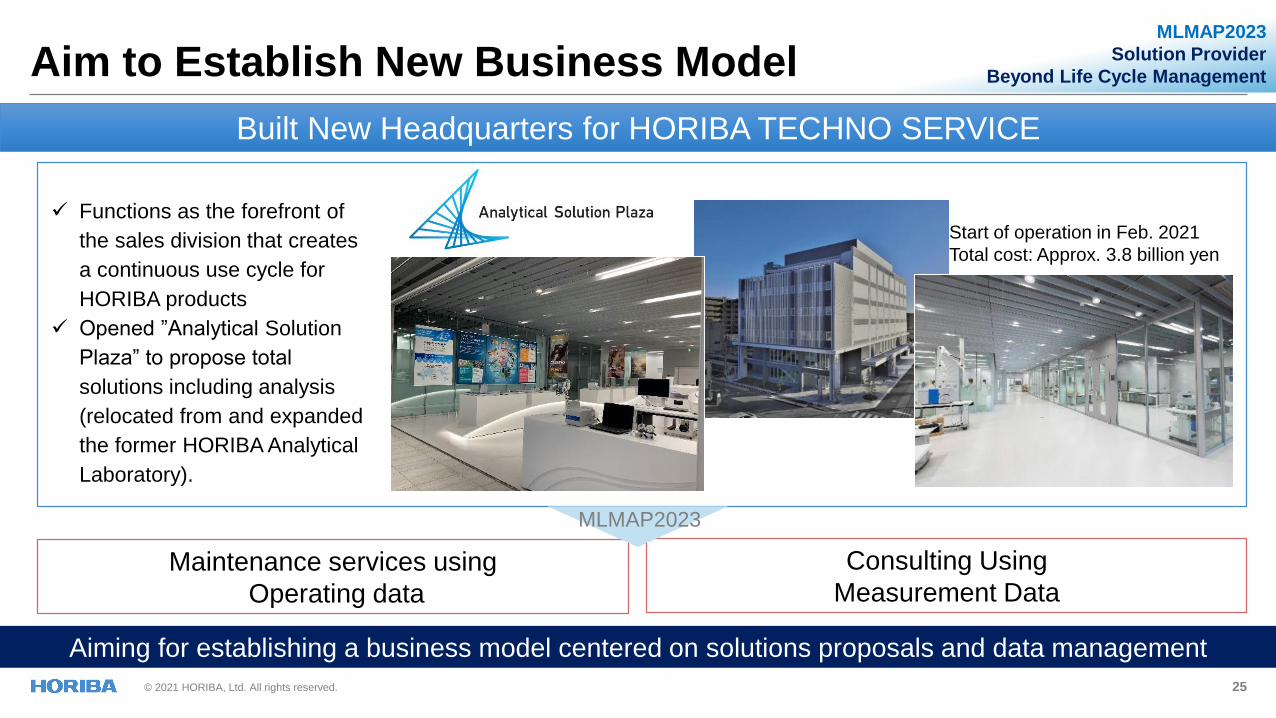
Built New Headquarters for HORIBA TECHNO SERVICE
Maintenance services using
Operating data
Consulting Using
Measurement Data
Aiming for establishing a business model centered on solutions proposals and data management
MLMAP2023
Start of operation in Feb. 2021
Total cost: Approx. 3.8 billion yen
MLMAP2023
Solution Provider
Beyond Life Cycle Management
Functions as the forefront of
the sales division that creates
a continuous use cycle for
HORIBA products
Opened ”Analytical Solution
Plaza” to propose total
solutions including analysis
(relocated from and expanded
the former HORIBA Analytical
Laboratory).
Aim to Establish New Business Model

© 2021 HORIBA, Ltd. All rights reserved. 26
Participation in the Initial Analysis Project
Six international teams are conducting initial analysis of samples taken
from the asteroid, Ryugu.
HORIBA TECHNO SERVICE, which specializes in high-precision
microanalysis, belongs to the chemical analysis team.
Analysis, using a fluorescent X-ray analyzer, is scheduled to begin in
June 2021 at the "Analytical Solution Plaza“ in the new building
(Illustrated by Akihiro Ikeshita)
【Asteroid Ryugu】
• An unknown rock, located 340 million kilometers
from the earth.
• Ryugu retains information on the early formation
stages of solar system and is considered to be an
asteroid rich in organic matter and water.
• Hayabusa2 took 5.4 grams sample from the
asteroid.
Expect elucidation of the mystery of the origin of asteroids, the birth of the solar system, and the birth of life
【X-ray fluorescence analysis】
• Analyze the constituent elements and
composition ratio of a substance from the energy
and intensity of fluorescent X-rays generated
when a sample is irradiated with X-rays.
• One of the HORIBA’s core technologies
(From right) Dr. Hisayoshi Yurimoto, Leader of Chemical
Analysis Team and Professor of Hokkaido University
Mr. Hiroo Chihara, President, HORIBA TECHNO SERVICE
MLMAP2023
Solution Provider
Beyond Life Cycle Management
Participation in the HAYABUSA2 Sample Analysis Project
© 2021 HORIBA, Ltd. All rights reserved. 27
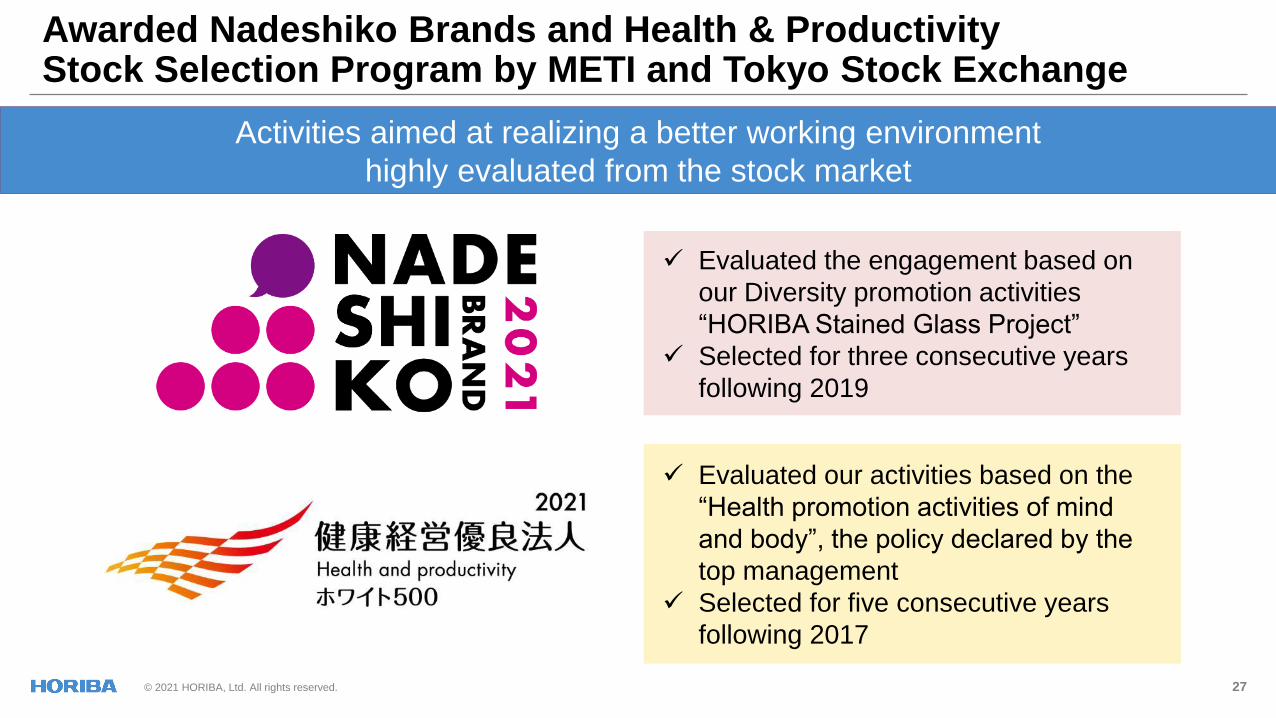
Activities aimed at realizing a better working environment
highly evaluated from the stock market
Evaluated the engagement based on
our Diversity promotion activities
“HORIBA Stained Glass Project”
Selected for three consecutive years
following 2019
Evaluated our activities based on the
“Health promotion activities of mind
and body”, the policy declared by the
top management
Selected for five consecutive years
following 2017
Awarded Nadeshiko Brands and Health & Productivity Stock Selection Program by METI and Tokyo Stock Exchange
© 2021 HORIBA, Ltd. All rights reserved. 28
2020 Results
2021 1Q (Jan.- Mar) Results
2021 Forecast
Topics – HORIBA’s Contribution for Social Issues
Shareholder Return
Financial Data
Corporate Profile
Contents

© 2021 HORIBA, Ltd. All rights reserved.
39 44
13 17
40 4060 67 70
85
116 125 130
90110
10
20
50
145
19.0%
44.0%
17.0%
9.0%
20.0%
29.0% 28.2% 26.8%30.6%
27.6%
30.0%27.4%
35.4%
28.8% 29.0%
0.0%
15.0%
30.0%
45.0%
60.0%
0
40
80
120
160
2007 2008 2009 2010 2011 2012 2013 2014 2015 2016 2017 2018 2019 2020 2021(F)
Ordinary Div. (yen) Commemorative Div. (yen) Total Return Ration (%)
29
Basic Policy Dividend payment + Share buyback = 30% of Consolidated net profit to be targeted
Remaining earnings are retained internally for strategic investment (i.e. facilities, M&A)
Dividends per share and Share buybacks
2019 Results: 130YEN [Interim 50yen / Year-end 80yen]
2020 Results: 90YEN [Interim 30yen / Year-end 60yen]
2021 Forecast: 110YEN [Interim 40yen / Year-end 70yen]
Shareholder Return
配当推移
Share Buyback
Share Buyback
© 2021 HORIBA, Ltd. All rights reserved. 30
2020 Results
2021 1Q (Jan.- Mar) Results
2021 Forecast
Topics – HORIBA’s Contribution for Social Issues
Shareholder Return
Financial Data
Corporate Profile
Contents
© 2021 HORIBA, Ltd. All rights reserved. 31
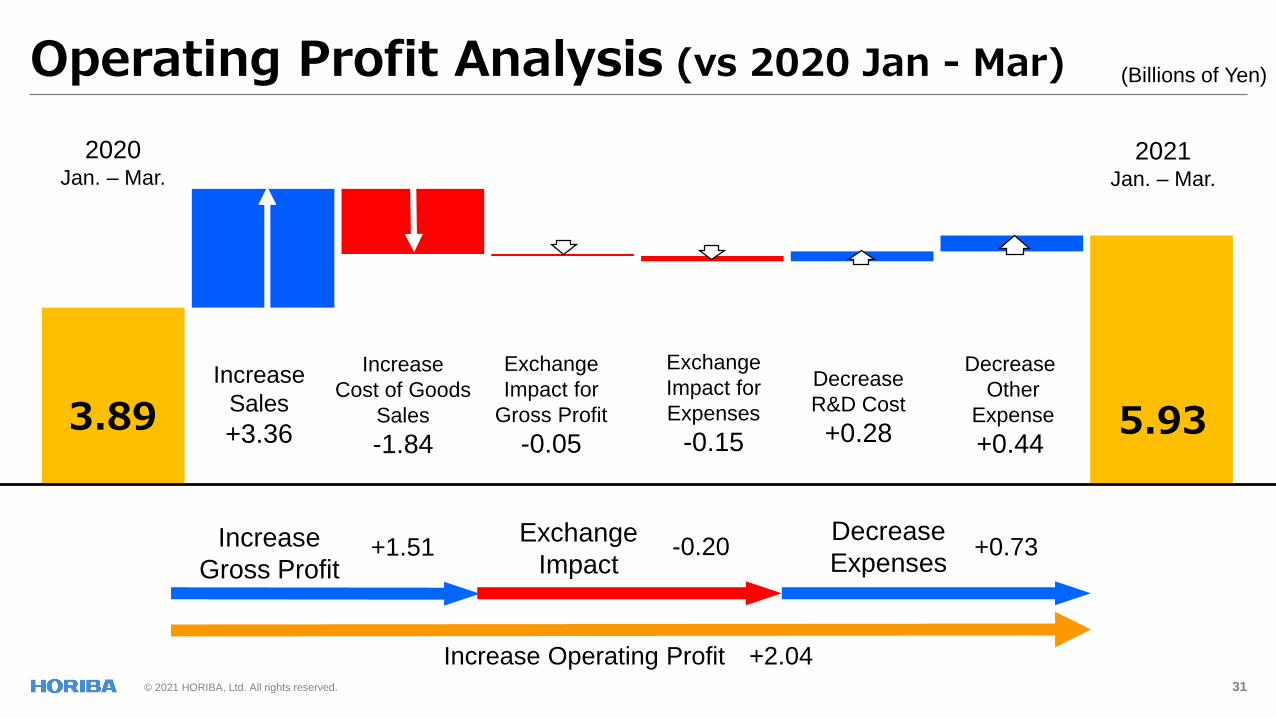
Operating Profit Analysis (vs 2020 Jan - Mar)
5.933.89
(Billions of Yen)
2021Jan. – Mar.
2020Jan. – Mar.
Increase
Sales
+3.36
Increase
Cost of Goods
Sales
-1.84
Exchange
Impact for
Gross Profit
-0.05
Decrease
R&D Cost
+0.28
Exchange
Impact for
Expenses
-0.15
Decrease
Other
Expense
+0.44
+1.51 +0.73Increase
Gross Profit
Exchange
Impact
Decrease
Expenses-0.20
Increase Operating Profit +2.04

© 2021 HORIBA, Ltd. All rights reserved. 32
Impact of Fluctuation in Foreign exchange
Increase Sales +0.22
Increase Cost of Goods Sales -0.28
Increase Expenses -0.15
Impact to Operating Profit -0.20
(Yen)2020
Jan - Mar
2021
Jan - MarDiff.
USD 108.86 106.09 -2.77
EUR 120.08 127.81 +7.73
SalesOperating
Profit
USD -5.40 -2.60
EUR -3.20 -0.00
(Yen)2021
Forecast
USD 108.00
EUR 128.00
(Billions of Yen)
Exchange rate impact
for 2021 Jan. - Mar.
(vs 2020 Jan. - Mar.)
Exchange rate impact
for 2021 Forecast1 yen impact of Sales and O.P.
(Yen appreciation)
© 2021 HORIBA, Ltd. All rights reserved. 33
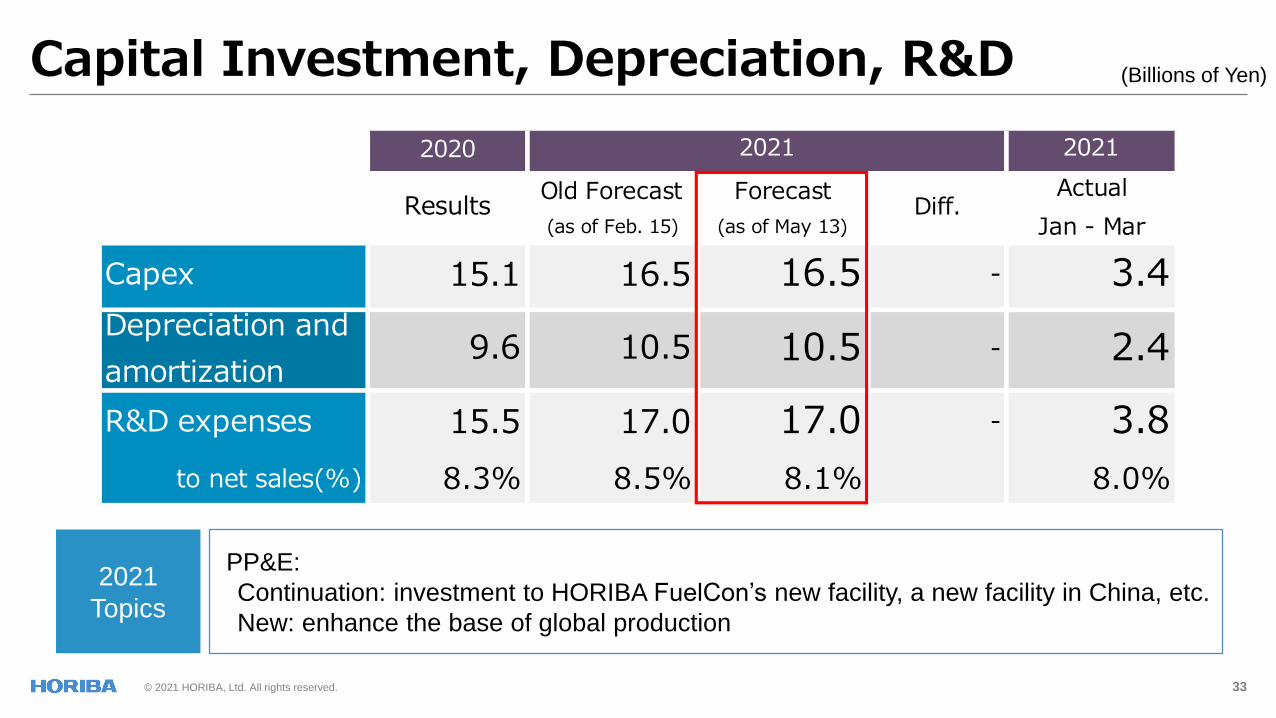
Capital Investment, Depreciation, R&D (Billions of Yen)
PP&E:
Continuation: investment to HORIBA FuelCon’s new facility, a new facility in China, etc.
New: enhance the base of global production
2021
Topics
2020
ResultsOld Forecast
(as of Feb. 15)
Forecast
(as of May 13)Diff.
Actual
Jan - Mar
15.1 16.5 16.5 - 3.4
9.6 10.5 10.5 - 2.4
15.5 17.0 17.0 - 3.8
8.3% 8.5% 8.1% 8.0%
2021
Capex
R&D expenses
to net sales(%)
2021
Depreciation and
amortization
© 2021 HORIBA, Ltd. All rights reserved. 34
2020 Results
2021 1Q (Jan.- Mar) Results
2021 Forecast
Outlines by Business Segment
Topics – HORIBA’s Contribution for Social Issues
Shareholder Return
Financial Data
Corporate Profile
Contents
© 2021 HORIBA, Ltd. All rights reserved. 35
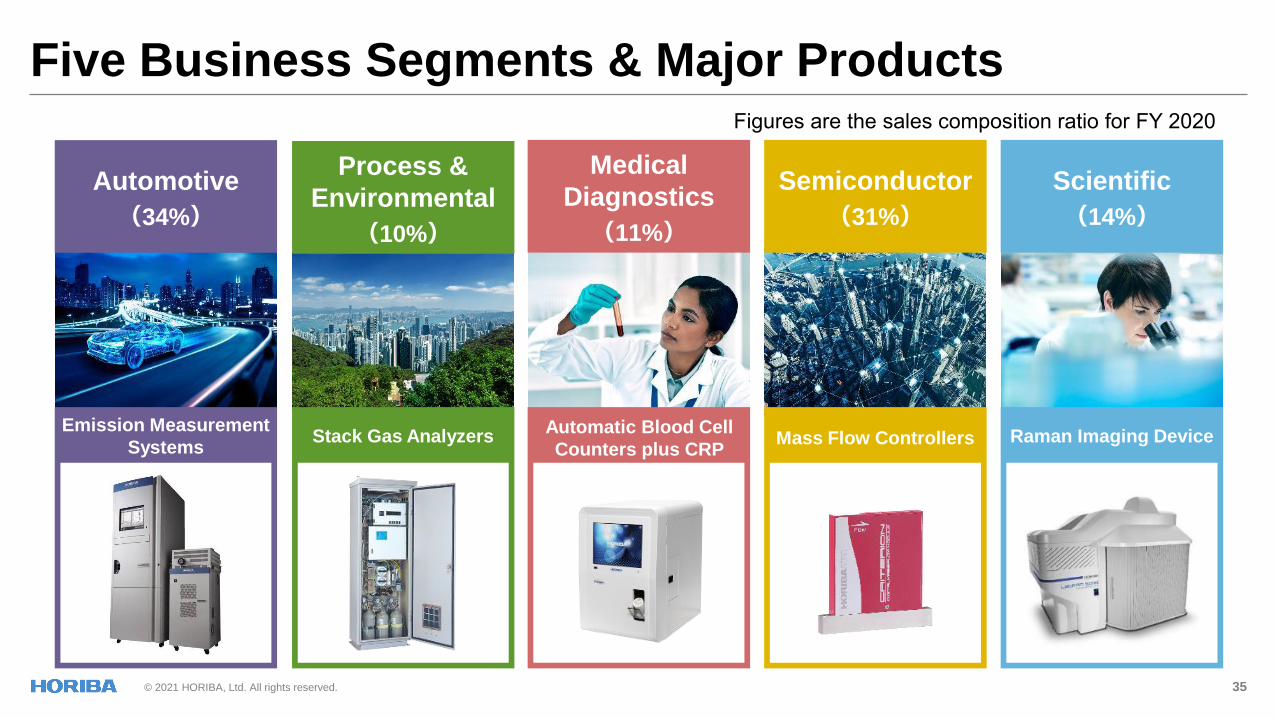
Figures are the sales composition ratio for FY 2020
Five Business Segments & Major Products
Automotive
(34%)
Process &
Environmental
(10%)
Medical
Diagnostics
(11%)
Semiconductor
(31%)
Scientific
(14%)
Emission Measurement
SystemsStack Gas Analyzers
Automatic Blood Cell
Counters plus CRPMass Flow Controllers Raman Imaging Device
© 2021 HORIBA, Ltd. All rights reserved.
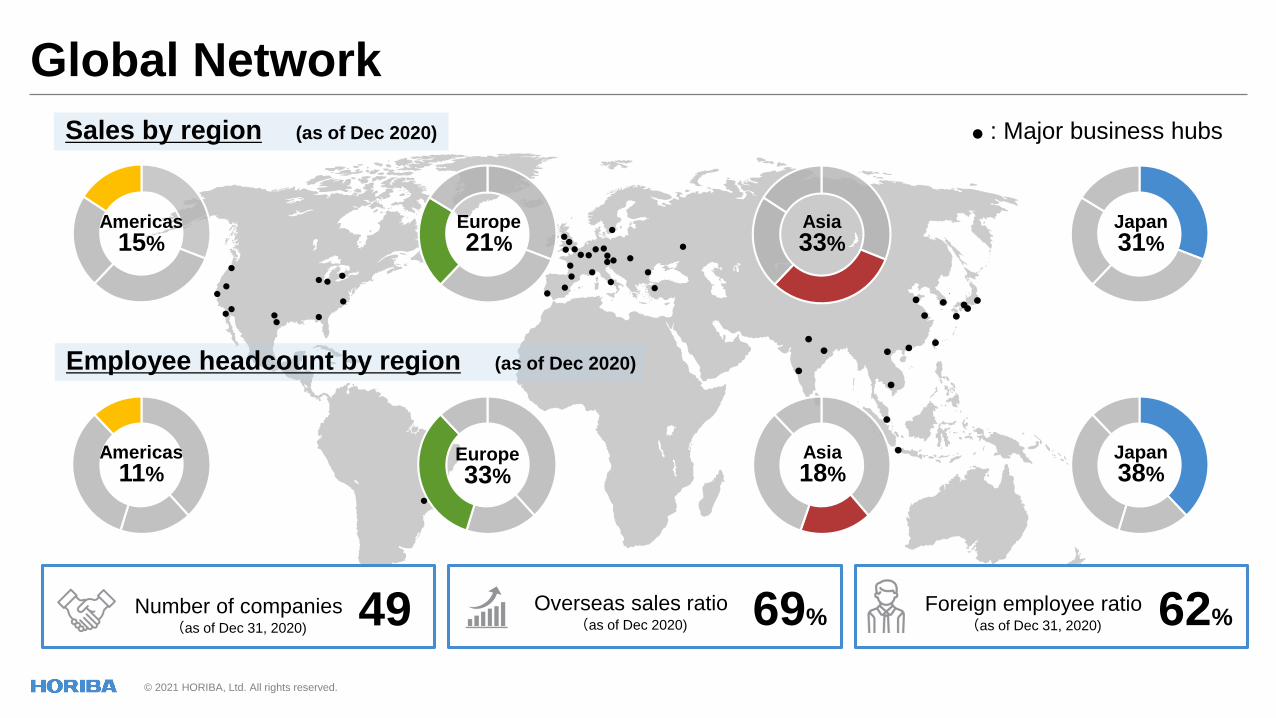
Global Network
● : Major business hubs
Japan
31%Americas
15%Asia
33%Europe
21%
Sales by region (as of Dec 2020)
Employee headcount by region (as of Dec 2020)
Japan
38%Americas
11%Asia
18%Europe
33%
Number of companies (as of Dec 31, 2020)
Overseas sales ratio(as of Dec 2020)
Foreign employee ratio(as of Dec 31, 2020)49 69% 62%
© 2021 HORIBA, Ltd. All rights reserved.
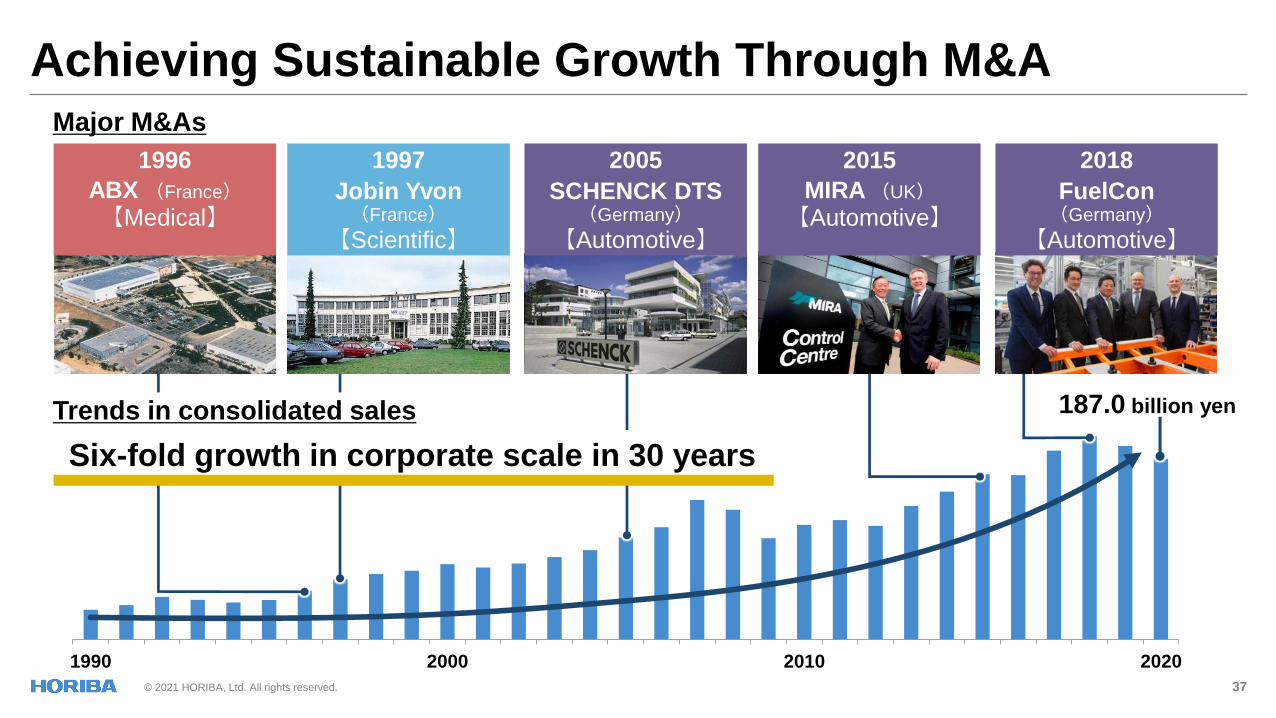
1990 2000 2010 2020
37
Achieving Sustainable Growth Through M&A
1996
ABX (France)
【Medical】
1997
Jobin Yvon(France)
【Scientific】
2005
SCHENCK DTS (Germany)
【Automotive】
2015
MIRA (UK)
【Automotive】
187.0 billion yen
Major M&As
2018
FuelCon(Germany)
【Automotive】
Trends in consolidated sales
Six-fold growth in corporate scale in 30 years
© 2021 HORIBA, Ltd. All rights reserved.
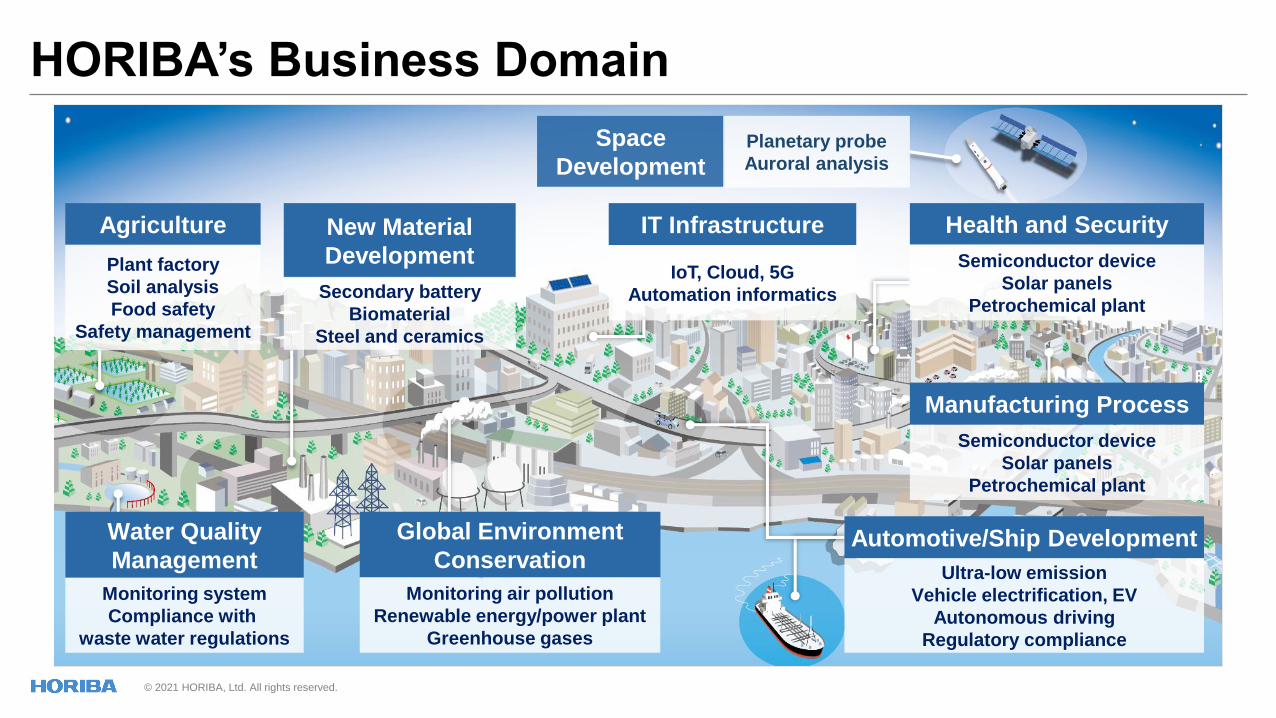
HORIBA’s Business Domain
Space
Development
Agriculture
Plant factory
Soil analysis
Food safety
Safety management
IT Infrastructure
IoT, Cloud, 5G
Automation informatics
Water Quality
Management
Monitoring system
Compliance with
waste water regulations
Global Environment
Conservation
Monitoring air pollution
Renewable energy/power plant
Greenhouse gases
Automotive/Ship Development
Ultra-low emission
Vehicle electrification, EV
Autonomous driving
Regulatory compliance
Planetary probe
Auroral analysis
Semiconductor device
Solar panels
Petrochemical plant
Manufacturing Process
Health and Security
Semiconductor device
Solar panels
Petrochemical plant
New Material
Development
Secondary battery
Biomaterial
Steel and ceramics
© 2021 HORIBA, Ltd. All rights reserved.© 2021 HORIBA, Ltd. All rights reserved. 39