everything begins - horiba
TRANSCRIPT

01
Everything beginswith measurement
HORIBA’s “measuring” domains
Human health and safety
Food safety Drinking water Medical tests Driving safety Environmental radiation measurement
R&D on new materials and new energy technologies
Next-generation materials Next-generation displays Secondary battery Clean energy
Productivity improvement in manufacturing process
Semiconductor devices Flat panel displays Solar cells Printed circuit boards Painting and coating Petrochemical plants

02HORIBA Report 2013 |
Analysis and measurement provides the base for all kinds of technologies.By pursuing “measuring technologies”, HORIBA contributes to a pleasant and enjoyable society with consideration for the global environment, energy issues, human health, and public safety.
Quality management
Electric appliances Cosmetics Foods Pharmaceuticals
R&D on next-generation vehicles
Ultra-low emission Fuel efficiency Greenhouse gas Alternative fuels Engines, drive-lines and brakes Electric motors Eco-drive
Environmental preservation
Air pollution monitoring Water quality monitoring for rivers, lakes, and oceans Plant emission regulations Water quality regulations Agricultural and daily use water Hazardous substances Chemical fertilizers

1985.3 1986.3 1987.3 1988.3 1989.3 1990.3 1991.3 1992.3 1993.3 1994.3 1995.3 1996.3 1997.3 1998.3 1999.3
03
Under the corporate motto “Joy and Fun” HORIBA has achieved continuous growth based on its corporate philosophy.
Corporate motto
■ Net sales− Operating income
Consolidated net sales and operating income
Atsushi Horiba becomes President & CEO
1992 Acquire ABX S.A.(now HORIBA ABX S.A.S.)in France
1996
Acquire Instruments S.A. (now HORIBA Jobin Yvon S.A.S.)
in France
1997
“Joy and Fun”Originates from the belief that if we take interest and pride in the work that occupies most of the active time in our lives, in the place where we spend the large part of each day, then as a result our satisfaction with life will increase, and we will be able to enjoy our lives even more. Taking interest and pride in our work leads us to “Joy and Fun.”

2000.3 2001.3 2002.3 2003.3 2004.3 2005.3 2006.122006.3 2007.12 2008.12 2009.12 2010.12 2011.12 2012.12 2013.12
04HORIBA Report 2013 |
Corporate philosophy
Launch current Mid-Long Term Management Plan
[[2011-2015]
2011
Business operations
We, at HORIBA, believe that our mission is to apply our most advanced analytical technologies to provide highly original analytical and measuring products and equipment, thereby contributing to the progress of science and technology and the preservation of global environment.
Customer responsiveness
We maintain a philosophy of pursuing technology to the ultimate degree in both the fundamental and applied technology fields, supplying products that continuously satisfy customers’ requirements.
Responsibility to shareholders and investorsWe have the basic policy of paying a certain amount of net income of each fiscal year to shareholders as cash dividends.
Employees
We are proud of the entrepreneurial spirit that led to the creation of HORIBA.
Launch previous Mid-Long Term Management Plan
[[2006-2010]
2006
Launch “One Company Matrix Management”
2004
Begin direct sales of Automotive Test Systems in Japan
2002
Acquire MCT(Mechatronics)business of Carl Schenck AG in Germany
2005¥138.1
billion
¥13.7 billion

Index
P01 Everything begins with measurement
P07 Message from the CEO
P11 Progress of the Mid-Long Term Management Plan
P13 Message from the CFO
P15 Business overview Overview by region and by segment Automotive Test Systems; Medical-Diagnostic Instruments & Systems; Semiconductor Instruments & Systems; Scientific Instruments & Systems; Process & Environmental Instruments & Systems
P27 Value creation based on invisible values Human resources; Technologies
P33 Corporate governance Directors, auditors, and officers An Outside Director’s views on HORIBA’s corporate governance
P37 Corporate social responsibility
P41 One Company Song
P42 Financial data Eleven-year summary
P78 Corporate philosophy “Joy and Fun”
P79 Corporate data
05
Index
Editorial policy
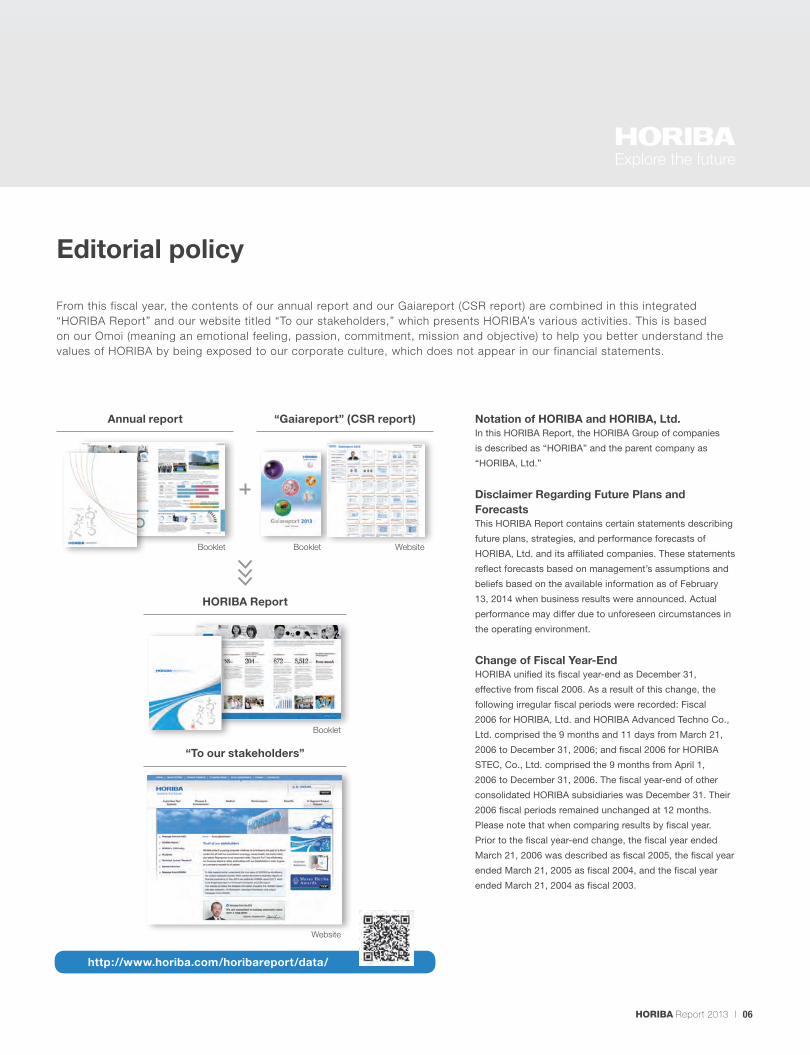
From this fiscal year, the contents of our annual report and our Gaiareport (CSR report) are combined in this integrated “HORIBA Report” and our website titled “To our stakeholders,” which presents HORIBA’s various activities. This is based on our Omoi (meaning an emotional feeling, passion, commitment, mission and objective) to help you better understand the values of HORIBA by being exposed to our corporate culture, which does not appear in our financial statements.
Notation of HORIBA and HORIBA, Ltd.In this HORIBA Report, the HORIBA Group of companies
is described as “HORIBA” and the parent company as
“HORIBA, Ltd.”
Disclaimer Regarding Future Plans and ForecastsThis HORIBA Report contains certain statements describing
future plans, strategies, and performance forecasts of
HORIBA, Ltd. and its affiliated companies. These statements
reflect forecasts based on management’s assumptions and
beliefs based on the available information as of February
13, 2014 when business results were announced. Actual
performance may differ due to unforeseen circumstances in
the operating environment.
Change of Fiscal Year-EndHORIBA unified its fiscal year-end as December 31,
effective from fiscal 2006. As a result of this change, the
following irregular fiscal periods were recorded: Fiscal
2006 for HORIBA, Ltd. and HORIBA Advanced Techno Co.,
Ltd. comprised the 9 months and 11 days from March 21,
2006 to December 31, 2006; and fiscal 2006 for HORIBA
STEC, Co., Ltd. comprised the 9 months from April 1,
2006 to December 31, 2006. The fiscal year-end of other
consolidated HORIBA subsidiaries was December 31. Their
2006 fiscal periods remained unchanged at 12 months.
Please note that when comparing results by fiscal year.
Prior to the fiscal year-end change, the fiscal year ended
March 21, 2006 was described as fiscal 2005, the fiscal year
ended March 21, 2005 as fiscal 2004, and the fiscal year
ended March 21, 2004 as fiscal 2003.
http://www.horiba.com/horibareport/data/
Annual report “Gaiareport” (CSR report)
HORIBA Report
“To our stakeholders”
Booklet
Booklet
Website
Booklet Website
06HORIBA Report 2013 |

Chairman, President & CEO
We are committed to raising corporate value over a long-termAs a CEO, one of my important roles is to continually enhance
HORIBA’s corporate value. In Kyoto, where our head office
is located, there are many long-standing companies with
a history of 100 years or more. From these pioneers, I
am learning day by day that it is important to disseminate
management philosophy, invest in human resources and
technologies to be invulnerable to economic downturns,
continuously create innovation inspired by “venture spirit,”
have a spirit of challenge without being satisfied with the
status quo, win the trust of customers and enhance long-term
value to run the business in harmony with society.
In 2013, we celebrated the 60th anniversary of our foundation.
I see this as one way point, and we will strive to further
enhance our corporate value.
Mid-Long Term Management Plan[2011-2015]
Net sales OperatingIncome Ratio ROE*
¥150 billionFiscal 2013 -¥138.1 billion
13% or moreFiscal 2013 -
9.9%
11% or moreFiscal 2013 -
8.4%*Return on equity
Concentrated investment in highly profitable businessContinued investment and steady growth in the Medical-Diagnostic Instruments &Systems segment
Change from strategy led by “technology development” toone led by “customer viewpoint and business models”Business expansion and profitability improvement through restructuring of MCT businessMarket share expansion based on proposing solutions from the customer viewpoint
→Application deployment by using HORIBA’s Total Solution(Automotive Test Systems segment)→Expand services through acquisition of the process analytical equipment business in North America (Process & Environmental Instruments & Systems segment)
Complete “One Company Matrix Management”Completion of One Company in the Americas through reorganization; implementation in Europe and Asia
Accelerate global product development and productionAccelerate opening of reagent plants in theMedical- Diagnostic Instruments & Systems segment→Establish stable global supply system Develop a sales support organization in Southeast AsiaAccelerate global implementation of ERP(Enterprise Resource Planning) systems
Numerical targets
Aiming to achieve sustainable growth and high profitability
150
120
90
60
30
0
15
12
9
6
3
0
%
2004 2005 2006 2007 2008 2009 2010 2011 2015Plan
OperatingIncome Ratio
2012 2013
Planning to realize well-balanced growth in operating income
20
15
10
5
0
2005 2013 2015Plan
Process & Environmental
Scientific
Semiconductor
Medical
Automotive58%
31% 25%
8%18%
30%22% 35%
30%
9%
7%
7.5%
3%
9%
7.5%
20.0
13.7
11.2
Net Sales (left) Operating Income Ratio (right) ROE (right)Billions of yen Billions of yen
ROE
07
Message from the CEO

Both sales and profits increased in fiscal 2013In fiscal 2013, ended December 31, 2013, HORIBA posted consolidated net sales of ¥138.1 billion (up 17.5% year-on-year), operating income of ¥13.7 billion (up 16.9%) and net income of ¥8.9 billion (up 21.7%). Both revenue and profit increased in response to the depreciation of the Japanese yen and a recovery in semiconductor market conditions, with net profit reached an all-time high. All business segments reported increased revenue, but profit declined, except in the Semiconductor Instruments & Systems segment, where market conditions recovered. This means to me that we are facing many challenges.The Semiconductor Instruments & Systems segment recorded a large increase in revenue and profit. This is partly attributable to the upturn in investment in the semiconductor industry from spring 2013 but also to the fact that HORIBA’s global market share for its mainstay mass flow controllers increased to 48%* from 43% of fiscal 2012. This was achieved because HORIBA maintained proactive investment while competitors reduced their investment due to the economic downturn. Although the Automotive Test Systems segment posted an increase in sales, profit declined albeit slightly. The recovery of R&D investment at automakers around the world helped drive the sales increase in the EMS (Emission Measurement Systems) business and the MCT (Mechatronics) business. We introduced new products in EMS, where we have an 80%* global market share, and improved profitability in the MCT business. However, owing to increased product development investment in the ITS (Intelligent Transport Systems) business, the profitability of the overall Automotive Test Systems segment declined.In the Medical-Diagnostic, Process & Environmental and Scientific Instruments & Systems segments, sales increased with the depreciation of the Japanese yen but demand was stagnant and profit decreased mainly because of the uncertain political situation and economic downturn in Europe as well as a reduction in government budgets in various countries. (* HORIBA’s estimates)
We expect to achieve the sales target of the Mid-Long Term Management Plan[2011-2015] a year ahead of plan, but improving profitability is an issueIn regard to the Mid-Long Term Management Plan [2011-2015] , we expect to achieve the sales target of ¥150 billion in fiscal 2014, one year ahead of plan. Operating income has also approached a record-high level, but the hurdle to achieving the target of ¥20 billion in fiscal 2015 is still somewhat high. HORIBA’s overall operating income ratio in fiscal 2013 was 9.9%, almost the same level as in the previous year, but as it fell short of the Mid-Long Term Management Plan [2011-2015] target of 13%, I believe that improving profitability is a challenge we must tackle. Holding back investment and diverting it to profit to achieve quantitative targets is an option but we intend to maintain investment in order to continuously enhance our growth potential. In the Medical-Diagnostic Instruments & Systems segment, where high growth and high earnings are expected, we have
been promoting a strategy of “concentrated investment” with which we increased investment in reagent manufacturing bases in the so-called BRICs (Brazil, Russia, India, and China) region where demand is expanding. We strengthened the management structure of Medical-Diagnostic Instruments & Systems segment in France, which is an important core base for HORIBA’s product development, and North America, which has high growth potential, to rapidly bring products to the market and speed up decision-making processes. We are also enhancing cooperation between Japan and France in product development, and planning to launch new products that combine the strength of France’s fundamental technologies and Japan’s production technologies. However, it will take some time for these initiatives to bear fruit.In the Automotive Test Systems segment, we broadened the line-up of MEXA-ONE, HORIBA’s first new motor exhaust gas analyzer in 17 years, that was announced in 2012, and accelerated sales activities to capture demand in the automobile industry, which is in a recovery phase. The segment achieved its sales target of the Mid-Long Term Management Plan [2011-2015] in fiscal 2013, two years in advance, and we also expect operating income to attain its target in fiscal 2014, one year ahead of the plan.In the Semiconductor Instruments & Systems segment, new products that we launched from 2012 to 2013 won high acclaim, which led to higher sales in Asia, where demand is growing, and the expansion of global market share. We aim to boost earnings by maintaining new product development even during downturns in demand and establishing and running an organization that can adequately meet customers’ requirements for analytical precision and delivery. In the Process & Environmental Instruments & Systems segment, sales in the oil refining process measurement equipment business that HORIBA acquired in March 2013 were robust. We expanded the business targeting the petroleum and chemicals industries in the U.S. state of Texas, where demand for shale gas and oil is growing significantly. In the Scientific Instruments & Systems segment, HORIBA acquired a fluorescence spectroscopy business from Photon Technology International, Inc., based in the U.S., and its global affiliates in February 2014. By generating synergies with HORIBA’s technologies, we aim to increase sales in the field of regenerative medicine, where iPS cell research is a representative example, and the field of drug discovery.In addition to such initiatives to improve earnings within the Mid-Long Term Management Plan [2011-2015], we commenced construction of “HORIBA BIWAKO E-HARBOR” to further strengthen our earnings structure for the next Mid-Long Term Management Plan. We will speed up new product launches and enhance production efficiency by transferring the gas measurement businesses of the Automotive Test Systems and Process & Environmental Instruments & Systems segments there in order to organically combine development, design and production. At the same time, we aim to make HORIBA BIWAKO E-HARBOR to be a new base of “craftsmanship” unique to Japan that utilizes our expertise and accumulated know-hows, where further innovation of core technologies is promoted while handing down technologies to the next generation (see page 32 for more details).
08HORIBA Report 2013 |
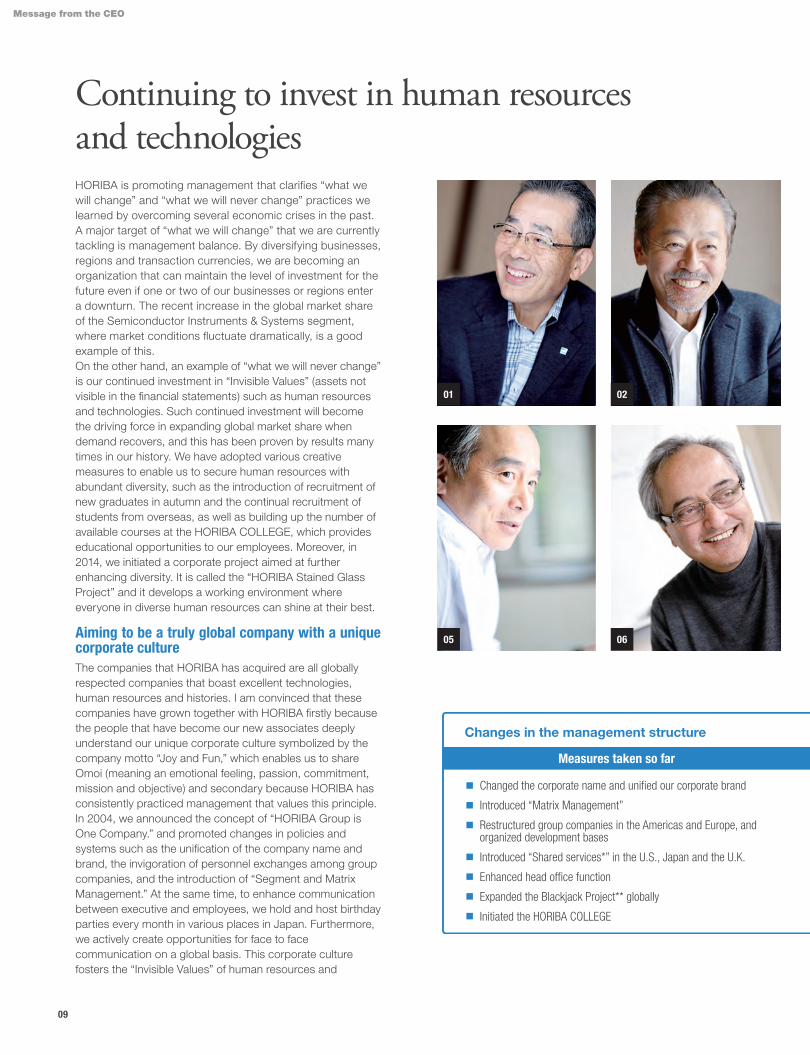
01 02
05 06
Continuing to invest in human resources and technologiesHORIBA is promoting management that clarifies “what we will change” and “what we will never change” practices we learned by overcoming several economic crises in the past. A major target of “what we will change” that we are currently tackling is management balance. By diversifying businesses, regions and transaction currencies, we are becoming an organization that can maintain the level of investment for the future even if one or two of our businesses or regions enter a downturn. The recent increase in the global market share of the Semiconductor Instruments & Systems segment, where market conditions fluctuate dramatically, is a good example of this.On the other hand, an example of “what we will never change” is our continued investment in “Invisible Values” (assets not visible in the financial statements) such as human resources and technologies. Such continued investment will become the driving force in expanding global market share when demand recovers, and this has been proven by results many times in our history. We have adopted various creative measures to enable us to secure human resources with abundant diversity, such as the introduction of recruitment of new graduates in autumn and the continual recruitment of students from overseas, as well as building up the number of available courses at the HORIBA COLLEGE, which provides educational opportunities to our employees. Moreover, in 2014, we initiated a corporate project aimed at further enhancing diversity. It is called the “HORIBA Stained Glass Project” and it develops a working environment where everyone in diverse human resources can shine at their best.
Aiming to be a truly global company with a unique corporate cultureThe companies that HORIBA has acquired are all globally respected companies that boast excellent technologies, human resources and histories. I am convinced that these companies have grown together with HORIBA firstly because the people that have become our new associates deeply understand our unique corporate culture symbolized by the company motto “Joy and Fun,” which enables us to share Omoi (meaning an emotional feeling, passion, commitment, mission and objective) and secondary because HORIBA has consistently practiced management that values this principle. In 2004, we announced the concept of “HORIBA Group is One Company.” and promoted changes in policies and systems such as the unification of the company name and brand, the invigoration of personnel exchanges among group companies, and the introduction of “Segment and Matrix Management.” At the same time, to enhance communication between executive and employees, we hold and host birthday parties every month in various places in Japan. Furthermore, we actively create opportunities for face to face communication on a global basis. This corporate culture fosters the “Invisible Values” of human resources and
Changes in the management structure
Changed the corporate name and unified our corporate brand
Introduced “Matrix Management”
Restructured group companies in the Americas and Europe, andorganized development bases
Introduced “Shared services*” in the U.S., Japan and the U.K.
Enhanced head office function
Expanded the Blackjack Project** globally
Initiated the HORIBA COLLEGE
Expand “Shared services” in Europe and Asia
Implement ERP (Enterprise Resource Planning) systems inall group companies, making it complete(Implemented in Europe in 2014)
Measures taken so far Measures to take from now on
* “Shared services” refer to the consolidation of certain common services in several divisions and organizations in order to enhance the productivity of the entire company or group companies and achieve cost reductions.** See the activities in detail on page 30.
09
Message from the CEO

0403
07
01 Dr. Kozo IshidaExecutive Vice Chairman
02 Atsushi HoribaChairman, President & CEO
03 Juichi SaitoExecutive Vice President and General Manager of Corporate & Segment Strategy Division
04 Sunao KikkawaSenior Corporate Officer, General Manager of Finance & Control Division
05 Dr. Masayuki AdachiDirector and General Manager of Research & Development DivisionPresident of HORIBA Jobin Yvon S.A.S.
06 Dr. Jai HakhuExecutive Corporate Officer,Chairman, President & CEO ofHORIBA International Corporation
07 Takashi NaganoSenior Corporate Officer, General Manager of Sales DivisionPresident of HORIBA KOREA LTD.
technologies, and we ultimately provide these “Invisible Values” to customers in the form of real “products and services” that have enabled the creation of our current corporate value. We are indeed proud that all the business activities we conduct are contributing to the realization of a comfortable and sustainable society, and this is also the basic concept of our Corporate Social Responsibility.HORIBA is not just another Japanese company that conducts business around the world. Rather, our objective is to be a truly global company with an understanding of the diverse culture, customs, and values of the countries and regions where we conduct business in harmony with the local community and employees. We have also signed the United Nations Global Compact, a set of universally accepted principles in the areas of human rights, labor, environment and anti-corruption that the United Nations advocates, and we are monitoring our activities from the perspective of global standards.Based on these initiatives and sustainable profit growth, I firmly believe we will consequently receive a fair market valuation from investors around the world as a true global company.
We forecast a dividend increase in fiscal 2014In fiscal 2013, we achieved record-high consolidated net income of ¥8.9 billion. To reward our owners (shareholders)*, we paid a record-high annual dividend per share of ¥60 in fiscal 2013, as we revised our dividend policy that had been based on non-consolidated net income since HORIBA’s public listing to the one based on consolidated net income. (In fiscal 2012, we paid an annual dividend of ¥50, including a commemorative dividend of ¥10.) For fiscal 2014, we are currently forecasting an annual dividend per share of ¥64, based on forecast consolidated net income of ¥9 billion.HORIBA will continue to contribute to society by pursuing analytical and measurement technologies and helping to overcome various issues associated with energy and the environment. We will also continue to supply a wide variety of products in order to provide a healthy life and “assurance” to all people. Furthermore, when our operating environment is favorable, we will not be complacent, and when it is uncertain, we will pursue management strategies which turn risk into opportunity by correctly ascertaining the situation and acting boldly. I sincerely hope that all our stakeholders understand and agree with our management policy and will continue to support us for many years to come.(* HORIBA fully recognizes the importance of its shareholders and
frequently calls them owners.)
April 2014
Chairman, President & CEO Atsushi Horiba
Changes in the management structure
Changed the corporate name and unified our corporate brand
Introduced “Matrix Management”
Restructured group companies in the Americas and Europe, andorganized development bases
Introduced “Shared services*” in the U.S., Japan and the U.K.
Enhanced head office function
Expanded the Blackjack Project** globally
Initiated the HORIBA COLLEGE
Expand “Shared services” in Europe and Asia
Implement ERP (Enterprise Resource Planning) systems inall group companies, making it complete(Implemented in Europe in 2014)
Measures taken so far Measures to take from now on
* “Shared services” refer to the consolidation of certain common services in several divisions and organizations in order to enhance the productivity of the entire company or group companies and achieve cost reductions.** See the activities in detail on page 30.
10HORIBA Report 2013 |

半半半
Net sales ¥150.0billion
Fiscal 2013: ¥138.1 billion
13% or more
Fiscal 2013: 9.9%
Operating income ratio 11%
or moreFiscal 2013: 8.4%
ROE*
2005 2010
Contributed by growth in the Semiconductor segment
2010 2013
Steady growth of the Automotive segment
2010 2015
More balanced portfolio with growth in the Medical segment
Accelerate efforts toward achieving goals of the Mid-Long Term Management Plan [2011-2015]During fiscal 2013, the third year of the Mid-Long Term Management Plan [2011-2015], HORIBA made significant investments in establishing business bases, mainly in reagent plants for the Medical-Diagnostic Instruments & Systems segment, the segment we focus. In terms of progress in achieving profit target, however, we still face challenges and need to speed up toward our goals.
Numerical targets for fiscal 2015 (announced in February 2011)
Net sales and operating income by business segment
Assumed exchange rates:¥80/U.S. dollar
¥110/Euro* Return on equity
Business portfolios aimed by the Mid-Long Term Management PlanVertical axis: Operating income ratio in the final year / Horizontal axis: Compound annual growth rate of net sales / Size of circle: Net sales volume in the final year
2015Plan
2014Forecast
201320122011 2015Plan
2014Forecast
201320122011 2015Plan
2014Forecast
201320122011 2015Plan
2014Forecast
201320122011 2015Plan
2014Forecast
201320122011
2015Plan
2014Forecast
201320122011 2015Plan
2014Forecast
201320122011 2015Plan
2014Forecast
201320122011 2015Plan
2014Forecast
201320122011 2015Plan
2014Forecast
201320122011
38
23 24 22
14
2.83.1
4.9
1.4
2.5
43
2217
20
13
4.4
2.4 2.2
0.91.6
49
2624 22
14
4.2
2.4
4.8
0.91.2
54
28 2724
15
5.2
2.5
5.0
1.0 1.3
46
3430
24
16
5.0
6.0 6.0
1.5 1.5
Automotive Medical Semiconductor Scientific Process & Environmental
Net salesBillions of yen
OperatingincomeBillions of yen
35%
25%
15%
5%
-5%
35%
25%
15%
5%
-5%
35%
25%
15%
5%
-5%
2% 2% 2%4% 4% 4%6% 6% 6%8% 8% 8%AutomotiveAutomotive
AutomotiveSemiconductor
Semiconductor Semiconductor
MedicalMedical
Medical
Process &Environmental Process &
Environmental
Process & Environmental
Scientific Scientific
Scientific
Profitability Profitability Profitability
Growth Growth Growth
11
Progress of the Mid-Long Term Management Plan

Key measures initiated or achieved in fiscal 2013
Progress in reform of the Medical-Diagnostic Instruments & Systems segment
In fiscal 2013, to drive growth in the Medical-Diagnostic Instruments & Systems segment we are focusing on, we opened a new reagent plant in India and began expanding a reagent plant in Brazil.In addition, we acquired U.S. company Cameron's process measurement equipment business line for the Process & Environmental Instruments & Systems segment.In Japan, we acquired electron beam technologies of Topcon Corporation for the Scientific Instruments & Systems segment and opened HORIBA STEC Kyoto Fukuchiyama Technology Center for the Semiconductor Instruments & Systems segment.Major investments and key measures, including plans, of the Mid-Long Term Management Plan [2011-2015] are as follows:
During the five years of the Mid-Long Term Management Plan [2011-2015] we plan to improve the profitability of the segment by promoting reagent production expansion worldwide and sales growth in North America and Asia.
From 2011 to 2013 From 2014 onward
Japan Overseas Japan Overseas
Automotive Merged HORIBA ITECH Co., Ltd. (ITS business)
Opened HORIBA Shanghai Technical Center (EMS and MCT business) in China
Opened a plant in Czech Republic (MCT business)
Opened a representative office in TurkeyTo open HORIBA
BIWAKO E-HARBOR
Process &Environmental
Acquired U.S. company Cameron's process measurement equipment business
Opened a representative office in Vietnam
Medical Expanded production capacity at the Aso plant
Opened a reagent plant in ChinaOpened a representative
office in IndonesiaOpened a reagent plant in India
Expanded a reagent plant in Brazil
To open HORIBA ABX Development Center
(France)
SemiconductorOpened HORIBA STEC
Kyoto Fukuchiyama Technology Center
Incorporated the branch in Taiwan as HORIBA Taiwan, Inc.
Established Beijing HORIBA METRON Instruments Co., Ltd.
(joint venture) in China.
To open HORIBA Advanced Technology
Center
Scientific Acquired electron beam technologies of Topcon Corp.
Opened HORIBA Europe Research Center in France.
Acquired fluorescence spectroscopy business of Photon Technology
International Inc.
Initiatives progressing as planned
Initiatives that need speeding up
・Expand sales of small-sized hematology analyzers in Asia (equipment export from Japan, local production)
・Establish reagent production bases worldwide
・Introduce medium-sized and large-sized hematology analyzers to the Americas and Europe
・Accelerate growth in Asia
Measures for improvement
・ Reform management of HORIBA ABX S.A.S. in France, an R&D base for medium-sized and large- sized hematology analyzers
・ Enhance R&D base in France・ Strengthen development collaboration between Japan and France
12HORIBA Report 2013 |

HORIBA is achieving sustainable growth and higher ROE by seeking earnings growth and rewards to shareholders in a balanced manner.
Implementing shareholder return linked to earnings growth2013 onwards: Aiming for payout ratio of 30% of HORIBA’s consolidated net income**Target total returns to shareholders at 30% of consolidated net income, by combining the amount of dividend payments and share buybacks.
Select an optimal financing method, responding to capital needs and with due consideration to factors such as the equity ratio, capital cost, market interest rates, and credit ratings
Achieving a high ROE based on earnings growthTarget of the Mid-Long Term Management Plan [2011-2015]: 11% or more
Implement a shareholder return policy linked to earnings growthHORIBA frequently calls shareholders owners and puts
emphasis on exceeding their expectations. In 1974, when
a majority of companies paid fixed dividends, we were the
first listed Japanese company to start paying shareholder
dividends based on a payout ratio and have continued this
practice without interruption for 39 years. (See Corporate
Philosophy on page 78.)
Starting in 2013, we changed to a dividend policy targeting
total returns to shareholders (the combined amount
of dividend payments and share buybacks) at 30% of
consolidated net income, instead of targeting 30% of
nonconsolidated net income, in order to link shareholder
return directly to consolidated operating results.
Financial policies
HORIBA maintains an appropriate level of liquidity in hand to
ensure efficient funding in response to capital requirements.
This is an important guideline for HORIBA’s financing activities.
We define liquidity in hand to be a sum of cash and cash
equivalents and the open amount of the commitment lines that
have been negotiated with financial institutions. At the end of
fiscal 2013, liquidity in hand amounted to ¥54.2 billion, which
was ¥49.2 billion in cash and cash equivalents and a ¥5.0
billion open balance of commitment lines with banks.
We consider this cash on hand and commitment lines as
reserves for future capital expenditures, M&A activities, and
other expenditures to be incurred in the future.
Basic capital policy
Sunao Kikkawa Senior Corporate Officer and General Manager of Finance & Control Division
Sunao Kikkawa joined HORIBA, Ltd. in 1974. He was assigned to work at HORIBA Instruments Incorporated
(U.S.) in 1982 and returned to HORIBA, Ltd. in 1988. He was appointed General Manager of the Accounting
Department in 1996 and Senior Corporate Officer in 2007. He made efforts toward globalizing HORIBA’s
accounting operations along with the Group’s globalization and maintaining compliance with international
accounting standards. At present he is engaged in raising efficiency in capital strategy and group administrative
operations as Senior Corporate Officer and General Manager of the Finance & Control Division.
13
Message from the CFO
1
20.4
0.7
0.2
3
102
1
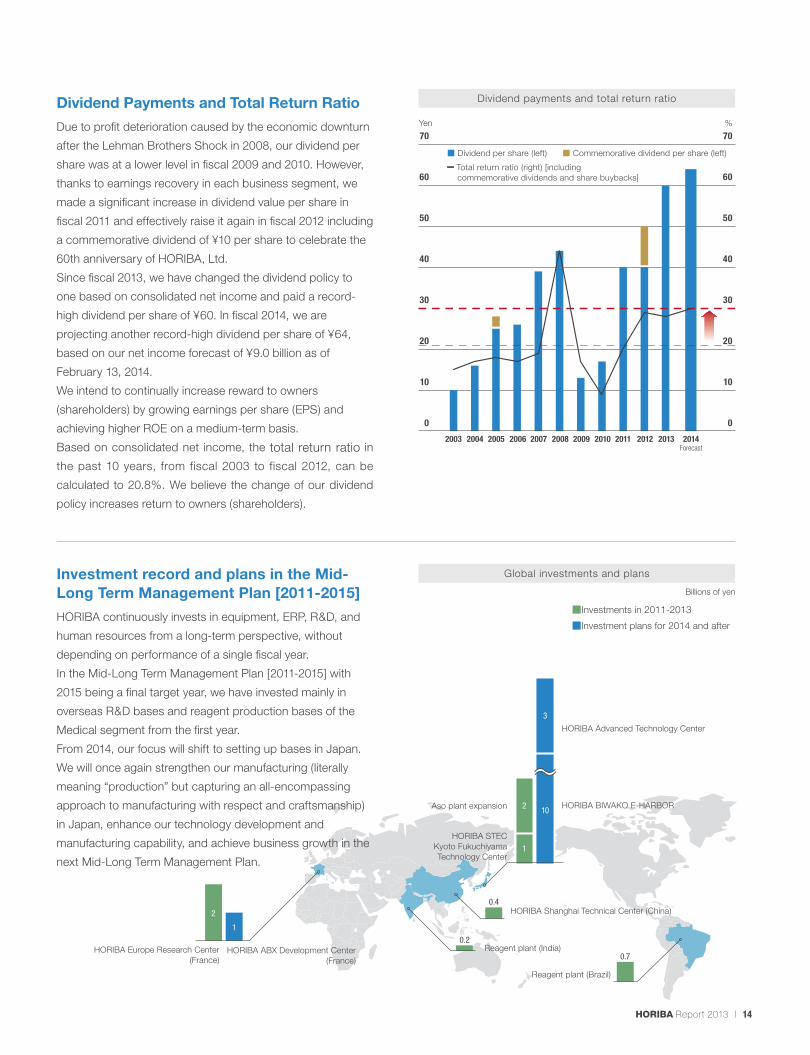
Dividend Payments and Total Return Ratio
Due to profit deterioration caused by the economic downturn
after the Lehman Brothers Shock in 2008, our dividend per
share was at a lower level in fiscal 2009 and 2010. However,
thanks to earnings recovery in each business segment, we
made a significant increase in dividend value per share in
fiscal 2011 and effectively raise it again in fiscal 2012 including
a commemorative dividend of ¥10 per share to celebrate the
60th anniversary of HORIBA, Ltd.
Since fiscal 2013, we have changed the dividend policy to
one based on consolidated net income and paid a record-
high dividend per share of ¥60. In fiscal 2014, we are
projecting another record-high dividend per share of ¥64,
based on our net income forecast of ¥9.0 billion as of
February 13, 2014.
We intend to continually increase reward to owners
(shareholders) by growing earnings per share (EPS) and
achieving higher ROE on a medium-term basis.
Based on consolidated net income, the total return ratio in
the past 10 years, from fiscal 2003 to fiscal 2012, can be
calculated to 20.8%. We believe the change of our dividend
policy increases return to owners (shareholders).
Investment record and plans in the Mid-Long Term Management Plan [2011-2015]
HORIBA continuously invests in equipment, ERP, R&D, and
human resources from a long-term perspective, without
depending on performance of a single fiscal year.
In the Mid-Long Term Management Plan [2011-2015] with
2015 being a final target year, we have invested mainly in
overseas R&D bases and reagent production bases of the
Medical segment from the first year.
From 2014, our focus will shift to setting up bases in Japan.
We will once again strengthen our manufacturing (literally
meaning “production” but capturing an all-encompassing
approach to manufacturing with respect and craftsmanship)
in Japan, enhance our technology development and
manufacturing capability, and achieve business growth in the
next Mid-Long Term Management Plan.
■ Dividend per share (left) ■ Commemorative dividend per share (left)
- Total return ratio (right) [including commemorative dividends and share buybacks]
2003 2004 2005 2006 2007 2008 2009 2010 2011 2012 2013 2014Forecast
Dividend payments and total return ratio
Global investments and plans
Yen
70
60
50
40
30
20
10
0
70
60
50
40
30
20
10
0
%
Reagent plant (India)
HORIBA Shanghai Technical Center (China)
HORIBA ABX Development Center (France)
Reagent plant (Brazil)
HORIBA Europe Research Center (France)
■Investments in 2011-2013
■Investment plans for 2014 and after
半半
HORIBA Advanced Technology Center
Aso plant expansion
HORIBA STEC Kyoto Fukuchiyama Technology Center
HORIBA BIWAKO E-HARBOR
Billions of yen
14HORIBA Report 2013 |
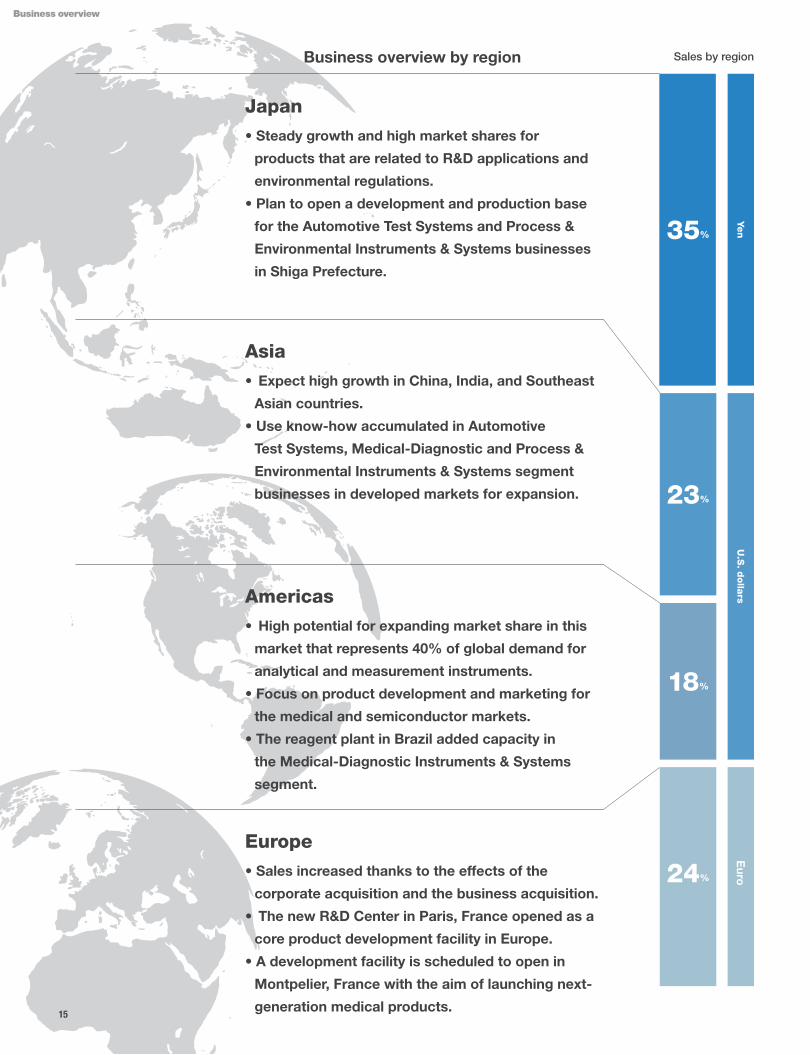
Business overview by region Sales by region
Japan
• Steady growth and high market shares for
products that are related to R&D applications and
environmental regulations.
• Plan to open a development and production base
for the Automotive Test Systems and Process &
Environmental Instruments & Systems businesses
in Shiga Prefecture.
Asia
• Expect high growth in China, India, and Southeast
Asian countries.
• Use know-how accumulated in Automotive
Test Systems, Medical-Diagnostic and Process &
Environmental Instruments & Systems segment
businesses in developed[markets for expansion.
Americas
• High potential for expanding market share in this
market that represents 40% of global demand for
analytical and measurement instruments.
• Focus on product development and marketing for
the medical and semiconductor markets.
• The reagent plant in Brazil added capacity in
the Medical-Diagnostic Instruments & Systems
segment.
Europe
• Sales increased thanks to the effects of the
corporate acquisition and the business acquisition.
• The new R&D Center in Paris, France opened as a
core product development facility in Europe.
• A development facility is scheduled to open in
Montpelier, France with the aim of launching next-
generation medical products.
35%
23%
18%
24%
Yen
U.S
. dolla
rsE
uro
15
Business overview
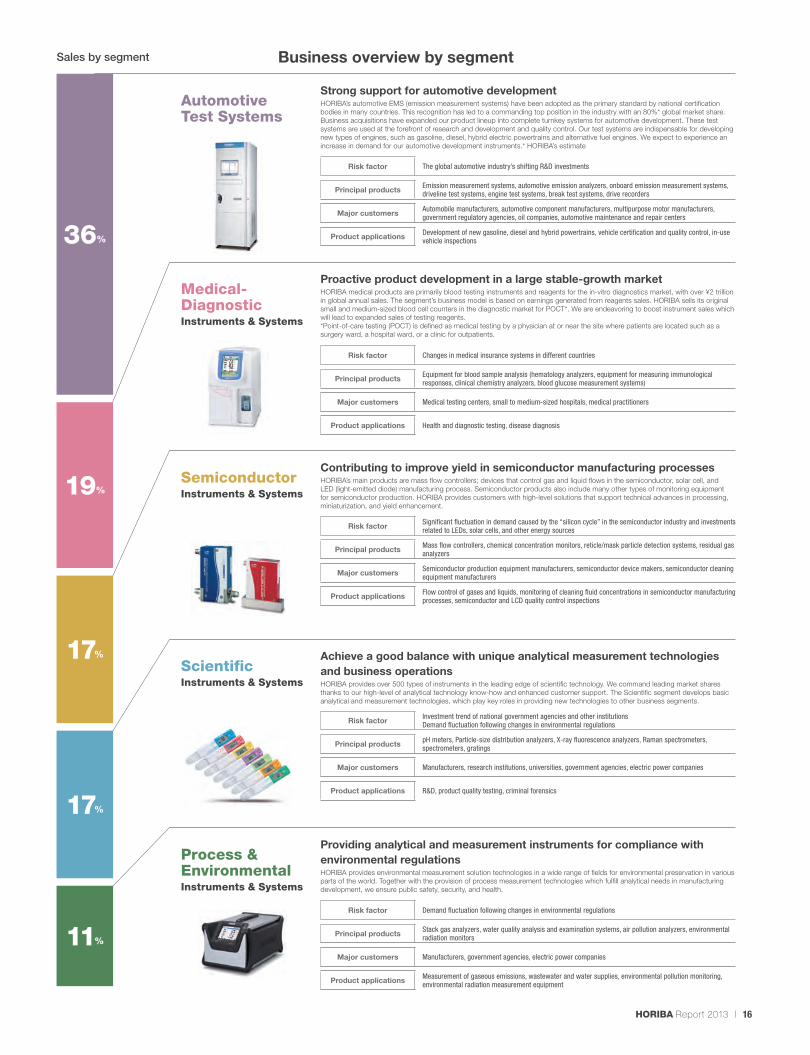
Sales by segment Business overview by segment
36%
19%
17%
17%
11%
Strong support for automotive developmentHORIBA’s automotive EMS (emission measurement systems) have been adopted as the primary standard by national certification bodies in many countries. This recognition has led to a commanding top position in the industry with an 80%* global market share. Business acquisitions have expanded our product lineup into complete turnkey systems for automotive development. These test systems are used at the forefront of research and development and quality control. Our test systems are indispensable for developing new types of engines, such as gasoline, diesel, hybrid electric powertrains and alternative fuel engines. We expect to experience an increase in demand for our automotive development instruments.* HORIBA’s estimate
Automotive Test Systems
Proactive product development in a large stable-growth marketHORIBA medical products are primarily blood testing instruments and reagents for the in-vitro diagnostics market, with over ¥2 trillion in global annual sales. The segment’s business model is based on earnings generated from reagents sales. HORIBA sells its original small and medium-sized blood cell counters in the diagnostic market for POCT*. We are endeavoring to boost instrument sales which will lead to expanded sales of testing reagents.*Point-of-care testing (POCT) is defined as medical testing by a physician at or near the site where patients are located such as a surgery ward, a hospital ward, or a clinic for outpatients.
Medical-DiagnosticInstruments & Systems
Contributing to improve yield in semiconductor manufacturing processesHORIBA’s main products are mass flow controllers; devices that control gas and liquid flows in the semiconductor, solar cell, and LED (light-emitted diode) manufacturing process. Semiconductor products also include many other types of monitoring equipment for semiconductor production. HORIBA provides customers with high-level solutions that support technical advances in processing, miniaturization, and yield enhancement.
SemiconductorInstruments & Systems
Achieve a good balance with unique analytical measurement technologies and business operationsHORIBA provides over 500 types of instruments in the leading edge of scientific technology. We command leading market shares thanks to our high-level of analytical technology know-how and enhanced customer support. The Scientific segment develops basic analytical and measurement technologies, which play key roles in providing new technologies to other business segments.
Scientific Instruments & Systems
Providing analytical and measurement instruments for compliance with environmental regulationsHORIBA provides environmental measurement solution technologies in a wide range of fields for environmental preservation in various parts of the world. Together with the provision of process measurement technologies which fulfill analytical needs in manufacturing development, we ensure public safety, security, and health.
Process &EnvironmentalInstruments & Systems
Risk factor The global automotive industry’s shifting R&D investments
Principal products Emission measurement systems, automotive emission analyzers, onboard emission measurement systems, driveline test systems, engine test systems, break test systems, drive recorders
Major customers Automobile manufacturers, automotive component manufacturers, multipurpose motor manufacturers, government regulatory agencies, oil companies, automotive maintenance and repair centers
Product applications Development of new gasoline, diesel and hybrid powertrains, vehicle certification and quality control, in-use vehicle inspections
Risk factor Changes in medical insurance systems in different countries
Principal products Equipment for blood sample analysis (hematology analyzers, equipment for measuring immunological responses, clinical chemistry analyzers, blood glucose measurement systems)
Major customers Medical testing centers, small to medium-sized hospitals, medical practitioners
Product applications Health and diagnostic testing, disease diagnosis
Risk factor Significant fluctuation in demand caused by the “silicon cycle” in the semiconductor industry and investments related to LEDs, solar cells, and other energy sources
Principal products Mass flow controllers, chemical concentration monitors, reticle/mask particle detection systems, residual gas analyzers
Major customers Semiconductor production equipment manufacturers, semiconductor device makers, semiconductor cleaning equipment manufacturers
Product applications Flow control of gases and liquids, monitoring of cleaning fluid concentrations in semiconductor manufacturing processes, semiconductor and LCD quality control inspections
Risk factor Investment trend of national government agencies and other institutionsDemand fluctuation following changes in environmental regulations
Principal products pH meters, Particle-size distribution analyzers, X-ray fluorescence analyzers, Raman spectrometers, spectrometers, gratings
Major customers Manufacturers, research institutions, universities, government agencies, electric power companies
Product applications R&D, product quality testing, criminal forensics
Risk factor Demand fluctuation following changes in environmental regulations
Principal products Stack gas analyzers, water quality analysis and examination systems, air pollution analyzers, environmental radiation monitors
Major customers Manufacturers, government agencies, electric power companies
Product applications Measurement of gaseous emissions, wastewater and water supplies, environmental pollution monitoring, environmental radiation measurement equipment
16HORIBA Report 2013 |

MEXA has No. 1 global market share in emission measurement systemsSince introducing the first MEXA in 1964, HORIBA has been a pioneer in emission measurement systems. We have provided the global market with the latest technologies required for automotive development, meeting ever changing requirements. HORIBA’s emission measurement systems command the top position in the industry with an 80%* worldwide market share and have been adopted as the primary standard by national certification bodies in many countries and by major global automotive manufacturers and their component suppliers. (*HORIBA’s estimate)We have delivered over 9,000 MEXA units to our customers. Anticipating a recovery in investment in the market, we plan to expand the sales of MEXA-ONE, which was introduced in 2012. We are committed to continuing support for automotive development by responding to increasing demand for the measurement of the emission characteristics of alternative fuels such as biofuel, and the measurement of emissions in more diverse applications such as construction machinery, ships, locomotives, and general purpose utility engines.
New Intelligent Transport System (ITS) business modelHORIBA started “HORIBA FLEET LINKAGE” services in November 2013. These services support safe driving and efficient fleet management. Cloud-stored data from HORIBA drive recorders and transport management systems (digital tachographs, etc.), is retrieved and analyzed to help fleet companies reduce fuel costs and manage their workload more efficiently.
Proposing HORIBA’s total solutions for a wide range of applicationsHORIBA offers a broad range of test and measurement systems for automotive development, including systems for vehicles, engines, powertrains, drivelines and brakes, as well as its mainstay MEXA-series emission measurement systems. This portfolio range enables us to respond to the diverse analysis and measurement needs of our customers. In addition to providing test and measurement equipment, HORIBA can also provide comprehensive support for test cell layout, design, and construction oversight of automobile R&D facilities. Through our unique business model, extensive product lineup, and project management know-how, we are aiming to grow sales and enhance profitability.
Fiscal 2014Providing test and measurement systems for development of fuel-efficient vehiclesHORIBA increased sales in fiscal 2013, thanks to an increase in R&D investment by automotive manufacturers globally and the weakening of the yen. However, operating income was slightly lower than the previous year’s level due to our increased investment in the development on the Intelligent Transport System (ITS) business. In fiscal 2014, we are expecting automakers to continue their investment as competition within the industry intensifies. We will focus on improving the profitability of MEXA-ONE and expanding sales in the MCT business, providing efficient test and measurement systems for the development of new fuel-efficient vehicles.
Emissionsbusiness
MCT business
ITS business
67%
30%
3%
Japan:34%
Asia:24%
Americas:15%
Europe:27%
201220112010200920082007200620052004 2015Plan
2013
8
6
4
2
0
60
45
30
15
0
■Net sales (left) ーOperating income (right)Billions of yen Billions of yen
36%
Sales breakdown by business divisions
Net sales and operating income
Sales breakdown by region
Sales breakdown
17
Businessreview
Worldmarketshare
Worldmarketshare
Segmentsalesshare
Segmentsalesshare
80% 15%38% 5%
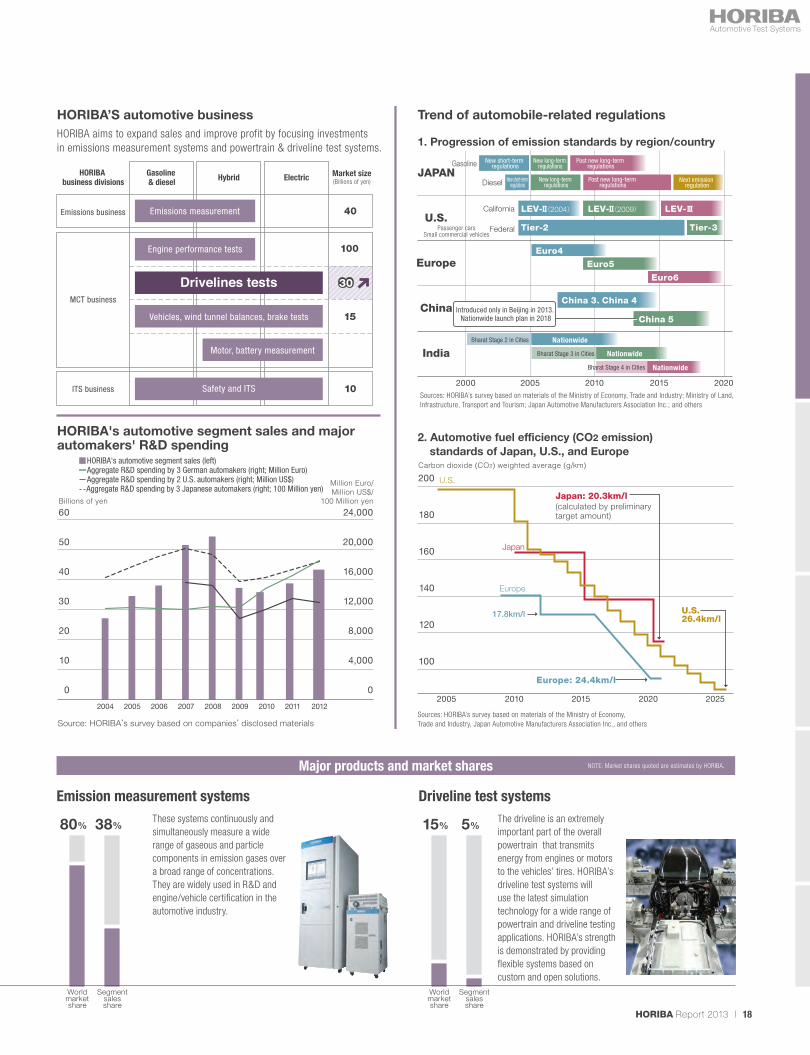
HORIBA’S automotive businessHORIBA aims to expand sales and improve profit by focusing investments in emissions measurement systems and powertrain & driveline test systems.
Trend of automobile-related regulations
1. Progression of emission standards by region/country
2. Automotive fuel efficiency (CO2 emission) standards of Japan, U.S., and Europe
HORIBA's automotive segment sales and major automakers' R&D spending
Sources: HORIBA’s survey based on materials of the Ministry of Economy, Trade and Industry; Ministry of Land, Infrastructure, Transport and Tourism; Japan Automotive Manufacturers Association Inc.; and others
Sources: HORIBA’s survey based on materials of the Ministry of Economy, Trade and Industry, Japan Automotive Manufacturers Association Inc., and others
JAPANGasoline
Diesel
2000 2005 2010 2015 2020
U.S.
Europe
China
India
New short-term regulations
New long-term regulations
Post new long-term regulations
Next emission regulation
Passenger carsSmall commercial vehicles
California
Federal
LEV-Ⅱ(2004) LEV-Ⅱ(2009) LEV-Ⅲ
Tier-2 Tier-3
Euro4
Euro5
Euro6
China 3、China 4
China 5Introduced only in Beijing in 2013.
Nationwide launch plan in 2018
Nationwide
2005 2010 2015 2020 2025
Carbon dioxide (CO2) weighted average (g/km)
200
180
160
140
120
100
Europe: 24.4km/l
17.8km/l
Japan: 20.3km/l(calculated by preliminary target amount)
U.S.26.4km/l
Japan
Europe
U.S.
200920082007200620052004 2010
Billions of yen
Million Euro/Million US$/
100 Million yen60
50
40
30
20
10
0
24,000
20,000
16,000
12,000
8,000
4,000
0
2011 2012
HORIBA business divisions
Emissions business
MCT business
ITS business
Electric Market size(Billions of yen)
40
100
15
10
Gasoline & diesel Hybrid
■HORIBA's automotive segment sales (left)Aggregate R&D spending by 3 German automakers (right; Million Euro)Aggregate R&D spending by 2 U.S. automakers (right; Million US$)Aggregate R&D spending by 3 Japanese automakers (right; 100 Million yen)
Drivelines tests
Vehicles, wind tunnel balances, brake tests
Safety and ITS
Motor, battery measurement
Engine performance tests
Emissions measurement
Source: HORIBA’s survey based on companies’ disclosed materials
30
New short-term regulations
New long-term regulations
Post new long-term regulations
Nationwide
Nationwide
Bharat Stage 2 in Cities
Bharat Stage 3 in Cities
Bharat Stage 4 in Cities
Major products and market shares
Emission measurement systems Driveline test systemsThese systems continuously and simultaneously measure a wide range of gaseous and particle components in emission gases over a broad range of concentrations.They are widely used in R&D and engine/vehicle certification in the automotive industry.
The driveline is an extremely important part of the overall powertrain that transmits energy from engines or motors to the vehicles’ tires. HORIBA’s driveline test systems will use the latest simulation technology for a wide range of powertrain and driveline testing applications. HORIBA’s strength is demonstrated by providing flexible systems based on custom and open solutions.
NOTE: Market shares quoted are estimates by HORIBA.
18HORIBA Report 2013 |

Testing reagents
Medical diagnostic instruments
Service and maintenance
53%
38%
9%
Japan:20%
Asia:14%
Americas:24%
Europe:42%
201220112010200920082007200620052004 2015Plan
2013
8
6
4
2
0
40
30
20
10
0
Billions of yen Billions of yen
19%
Net sales and operating income
Sales breakdown by region
The ratio of reagents sales at HORIBA’s Medical-Diagnostic Instruments & Systems segment has been stable at around 50-55%. Going forward, while an increase in sales in Asia may temporarily lower the sales ratio of testing reagents, we view positively such a temporary decline in the ratio which occurs in line with higher instruments sales growth.
Sales breakdown by business divisions
Sales breakdown
■Net sales (left) ーOperating income (right)
Stable business model supported by sales of reagentsThe business model for HORIBA’s Medical-Diagnostic Instruments and Systems segment features expansion in the installed base of HORIBA medical-diagnostic instruments such as hematology and chemistry analyzers to generate stable profits from growing reagent sales.Our products are used in blood testing, biochemical and other clinical areas that are directly linked to assessing and diagnosing personal health. As such, the business is less sensitive to economic fluctuation, when compared to most other industries. Another characteristic of this segment is that currency risk has been diversified by having two bases for development and production, namely, Japan and France. Going forward, we aim to diversify risks and improve profitability by expanding exports of high-share distinctive and differentiated products from Japan.
Strengthen the organizational structure to develop next-generation products Aiming for stable supply of reagentsHORIBA ABX S.A.S. (France) will establish a new development base to accelerate the introduction of new products to expand the market share and address growing customer needs in Europe and Americas.Regarding testing reagents, which are important profit sources in this segment, our strategy is to initiate local production of reagents in mass-consumption areas. The end result is to reduce costs of distribution and inventory management, to respond promptly to customer needs, and to improve profitability. We have been making steady progress accordingly. Reagent plants in Aso, Kumamoto Prefecture, and in China began operation in 2012 while a plant in India began operation and capacity expanded in Brazil in 2013.
Fiscal 2014Reinforce product supply system for achieving sales growth in AsiaIn fiscal 2013, Medical-Diagnostic Instruments & Systems segment sales increased year-on-year, partly due to the positive impact of the depreciation of the Japanese yen. However, lower export margins on products manufactured in France and advance investment in expansion of the sales network in North America caused a slight decrease in profits. Meanwhile, in order to address a surge in demand in Asia, we accelerated our efforts to expand sales of hematology and CRP analyzer, which has been a strategic product of Japan in the Chinese, Indian and other Asian markets, with the aim of a higher market share and improved profitability. Our focus in fiscal 2014 is to strengthen the organization and speed up development of medium and large-sized products. In addition, we will strive to raise profitability when the expanded reagent plant in Brazil and a new reagent plant in India start full-scale operation.
Instruments & Systems
19
Businessreview

8% 100%80% 10%
Business development by test category
Test category Clinical chemistry
¥1 trillionMarket size
Private practitioners
Hospital units and surgery rooms
(POCT*)
Hospitals
Large hospitalsTesting centers
Small and medium-sized hospitals
¥1 trillion
Clinical chemistry analyzers
Blood glucose measurement
systems
Hematology
¥0.2 trillion
CRP analysis
Hematology analyzer systems
Immunology Coagulation
¥0.1 trillion
Coagulation reagents
*Point-of-care testing (POCT) is defined as medical testing by a physician at or near the site where patients are located such as a surgery ward, a hospital ward, or a clinic for outpatients.
JapanProduct developmentand production base
(instruments and reagents)Development technologyof small-sized products
FranceProduct development and production base
(instruments and reagents)Development technology
of medium and large-sized products
BrazilProduction base
(Reagents)
Instruments・ Small-sized products: Expand sale of our hematology and CRP analyzer to Asia ・ Medium-sized products: Introduce products for the Chinese market by integrating technologies in Japan and France ・ Medium and large-sized products: Accelerate product development to expand market shares in Europe and Americas
Reagents・The local supply systems have resulted in cost reductions for distribution and inventory management, thereby improving profitability.
Field in which HORIBA exhibits strength
Global product development and supply system
ChinaProduction base
(instrumentsand reagents)
Small and medium-sized
hematology analyzers
IndiaProduction base
(Reagents)
Major products and market shares
Hematology analyzers Hematology and CRP analyzers
Blood tests are essential for diagnosis and assessing the health of people and animals. These analyzers check red and white blood cell counts as well as hemoglobin concentrations and platelet counts.
This is the first analyzer in the world to simultaneously measure blood cell counts and C-Reactive Protein (CRP), which the body produces in response to internal inflammation, thus facilitating faster and more accurate diagnosis.
Pentra MS CRP
Joint initiatives to develop products for China, in Japan and FranceWe have been developing medium and large-sized products in France and small systems in Japan. In the case of “Pentra MS CRP”, a new medium-sized hematology and CRP analyzer, with the aim of selling in the Chinese market, we have succeeded in our development by merging the technologies of our bases in Japan and France. Triggered by the sharing of technological know-how through the development of the new product, our intention is to speed up new product development both in Japan and in France.
NOTE: Market shares quoted are estimates by HORIBA.
Worldmarketshare
Worldmarketshare
Segmentsalesshare
Segmentsalesshare
20HORIBA Report 2013 |

Mass flow controllers
Wet process monitors
Dry process monitors
Other
81%
12%
5%
2%
Japan:45%
Americas:16%
Asia:34%
Europe:5%
201220112010200920082007200620052004 2015Plan
2013
17%
Net sales and operating income
Sales breakdown by region
30
20
10
0
9
6
3
0
Billions of yen Billions of yen
Sales breakdown by business divisions
Sales breakdown
■Net sales (left) ーOperating income (right)
Products that fulfill the needs of new markets and new applicationsHORIBA has products used throughout the semiconductor manufacturing process such as mass flow controllers which are essential for dry chamber semiconductor manufacturing equipment, and chemical concentration monitors, which are used in semiconductor wafer cleaning and etching processes. In particular, our mass flow controllers have a leading 48%* global semiconductor market share. These highly sophisticated products satisfy customer requirements for improved productivity and performance enhancements in next-generation miniaturized manufacturing processes. HORIBA aims at further raising its market share. (*HORIBA’s estimate)
Expansion of sales in Asia, supported by strong trust from global semiconductor makersMuch of HORIBA’s service strength lies in its capability to support customers in Asia. Our strategy is to expand our market share by earning more credibility not only from semiconductor, solar cell, and LED manufacturing equipment makers, but also from semiconductor device makers by developing enhanced, quality products that satisfy anticipated customer demand.At the Aso plant, which is operated by the Semiconductor Instruments & Systems segment, we are building a system to adjust production with the needs of the Medical- Diagnostic Instruments & Systems segment. We are thus prepared to meet customers’ delivery requirements during phases of expanding demand. Flexible plant management according to fluctuations in production demand is one of HORIBA’s greatest strengths.
Fiscal 2014Response to strong demand and focus on developing next-generation productsIn the first half of fiscal 2013, a rapid recovery in demand for semiconductors triggered favorable sales of mass flow controllers to makers of equipment for manufacturing silicon semiconductors and other products. We rapidly increased production for a broad range of products at our Aso plant, which had just completed a capacity expansion in 2012. HORIBA’s global share of mass flow controllers is inching up, partly because our overseas customers in semiconductor manufacturing equipment-related makers are shifting more production to Asia.In fiscal 2014, we expect high levels of demand to persist for the first six months, but moving toward the second half of fiscal 2014, we need to watch carefully the investment outlook for semiconductor makers, particularly in South Korea and Taiwan. Another area we are focusing on is a potential increase in demand from makers of manufacturing equipment for solar cells and LEDs.
Instruments & Systems
21
Businessreview

These compact units are used in semiconductor manufacturing to monitor concentrations of chemical cleaning agents. They ensure cleansing fluids are precisely delivered and properly used, thereby optimizing the cleaning process and boosting production yields.
48% 80%81% 12%
Trillions of yen
20082007200620052004 20102009 2011 2012 2013
6
5
4
3
2
1
0
Billions of yen30
25
20
15
10
5
0
Worldwide sales of semiconductor manufacturing equipment (right)
HORIBA’s Semiconductor Instruments & Systems segment sales (left)
200920082007200620052004 20112010 2012 2013
%50
40
30
20
(*HORIBA’s estimate)
Major products and market shares
Mass flow controllers Chemical concentration monitors
These high-precision gas and liquid controllers regulate flow rates in semiconductor manufacturing processes, typically in thin-film formation processes.They are indispensable components for high quality semiconductor and LED production.
HORIBA’s Semiconductor Instruments & Systems segment sales compared to worldwide sales of semiconductor manufacturing equipment
HORIBA’s global market share for mass flow controllersHORIBA has maintained more than 40%* of the global mass flow controller market share since fiscal 2009. It is noteworthy that our share expanded in the period from a downturn phase, which started in 2009 and lasted until a recovery in 2010, by successfully meeting our customers’ needs through new product introductions and expanded production capacity. In our view, this is attributed to the success of our balanced management, which minimized the reduction in manufacturing investment and production capacity during a significant downturn in the market.Our global market share rose to 48%* in fiscal 2013, as a result of an increase in the ratio of standard adoption at semiconductor manufacturers for new products and the shift of production to Asia by semiconductor manufacturing equipment-related makers. (* HORIBA’s estimates)
Enhanced development facilities to accelerate response to customer needsHORIBA STEC Kyoto Fukuchiyama Technology Center opened in 2013 as the first research-only facility. Its main focus is to develop mass flow controllers and next-generation advanced material control equipment. Moreover, HORIBA Advanced Technology Center, which is under construction in a site adjacent to HORIBA STEC Co., Ltd., is scheduled to be completed by the end of 2014. By assembling our semiconductor sensor-related development teams at the Center, each group company’s know-how will be brought together to enhance production technology. We also intend to accelerate development speed by promptly conducting actual gas and liquid tests on new sensors for use on manufacturing lines for mass flow controllers and other products. We will establish a structure to respond more quickly to the needs of semiconductors and semiconductor manufacturing equipment-related makers that are engaged in advanced research.
HORIBA STEC Kyoto Fukuchiyama Technology Center (Fukuchiyama City, Kyoto Prefecture)
HORIBA Advanced Technology Center (Kyoto City, Kyoto Prefecture)
(Rendering)
New building
NOTE: Market shares quoted are estimates by HORIBA.
Worldmarketshare
Worldmarketshare
Segmentsalesshare
Segmentsalesshare
22HORIBA Report 2013 |
3
2
1
0
30
20
10
0
■Net sales (left) ーOperating income (right)Billions of yen Billions of yen
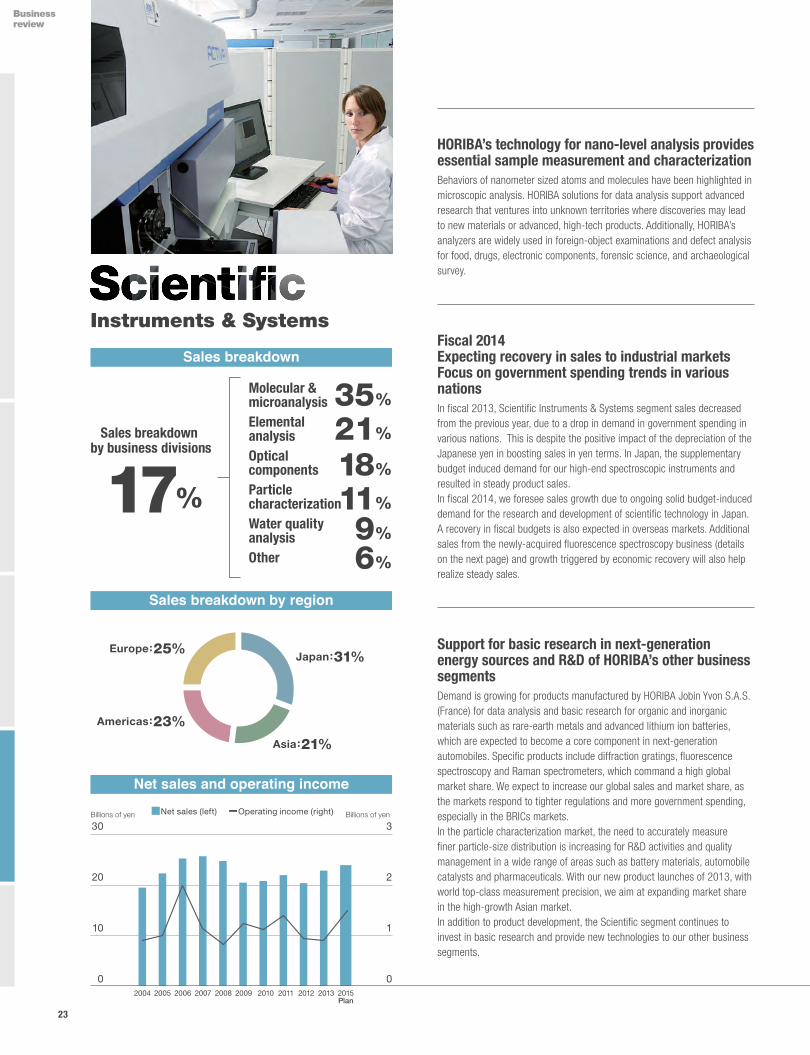
Molecular & microanalysisElemental analysis Optical componentsParticle characterizationWater quality analysisOther
35%
21%
18%
11%
9%
6%
Japan:31%
Asia:21%
Americas:23%
Europe:25%
201220112010200920082007200620052004 2015Plan
2013
Net sales and operating income
Sales breakdown by region
Sales breakdown
17%
Sales breakdown by business divisions
HORIBA’s technology for nano-level analysis provides essential sample measurement and characterizationBehaviors of nanometer sized atoms and molecules have been highlighted in microscopic analysis. HORIBA solutions for data analysis support advanced research that ventures into unknown territories where discoveries may lead to new materials or advanced, high-tech products. Additionally, HORIBA’s analyzers are widely used in foreign-object examinations and defect analysis for food, drugs, electronic components, forensic science, and archaeological survey.
Support for basic research in next-generation energy sources and R&D of HORIBA’s other business segmentsDemand is growing for products manufactured by HORIBA Jobin Yvon S.A.S. (France) for data analysis and basic research for organic and inorganic materials such as rare-earth metals and advanced lithium ion batteries, which are expected to become a core component in next-generation automobiles. Specific products include diffraction gratings, fluorescence spectroscopy and Raman spectrometers, which command a high global market share. We expect to increase our global sales and market share, as the markets respond to tighter regulations and more government spending, especially in the BRICs markets. In the particle characterization market, the need to accurately measure finer particle-size distribution is increasing for R&D activities and quality management in a wide range of areas such as battery materials, automobile catalysts and pharmaceuticals. With our new product launches of 2013, with world top-class measurement precision, we aim at expanding market share in the high-growth Asian market.In addition to product development, the Scientific segment continues to invest in basic research and provide new technologies to our other business segments.
Fiscal 2014Expecting recovery in sales to industrial marketsFocus on government spending trends in various nationsIn fiscal 2013, Scientific Instruments & Systems segment sales decreased from the previous year, due to a drop in demand in government spending in various nations. This is despite the positive impact of the depreciation of the Japanese yen in boosting sales in yen terms. In Japan, the supplementary budget induced demand for our high-end spectroscopic instruments and resulted in steady product sales. In fiscal 2014, we foresee sales growth due to ongoing solid budget-induced demand for the research and development of scientific technology in Japan. A recovery in fiscal budgets is also expected in overseas markets. Additional sales from the newly-acquired fluorescence spectroscopy business (details on the next page) and growth triggered by economic recovery will also help realize steady sales.
Instruments & Systems
23
Businessreview

HORIBA is recognized as one of the top pH meter brands beginning with a history of its development of Japan’s first glass electrode pH meter in the 1950’s. HORIBA offers a full pH product line to satisfy diverse customer needs ranging from desk-top models to support laboratory research to rugged instruments for field applications measuring river water, groundwater, and waste water.
30% 50%17% 7%
Major products and market shares
Raman spectrometers pH meters
Raman spectroscopy is a spectroscopic technique that provides information about the molecular structure of molecules by measuring the vibrational modes of a molecule. The vibrational modes of a molecule, which are a molecular fingerprint offering a quantitative measurement, can be used to identify the chemical under analysis. In recent years, Raman spectroscopy has attracted attention for new applications in material research. Raman has a very weak light scattering machanism, so a highly-sensitive and optimal optical design is necessary. HORIBA Jobin Yvon’s outstanding know-how in optics-related technology has been successfully applied in the core development of our extremely high performance Raman spectrometers.
Acquired fluorescence spectroscopy business of Photon Technology InternationalHORIBA acquired Photon Technology International (PTI), which operates in four countries and commands a high market share in high-end research fluorescence spectroscopy. After the acquisition, HORIBA has a combined 21% share*. We will use synergies between both companies to accelerate fluorescence product line growth. PTI has a long standing collaboration with a prestigious laboratory in the Faculty of Medicine and Dentistry of the University of Western Ontario in Ontario, Canada. PTI has been involved with this renowned university in the development of application software directly targeted to users’ needs.*Source: SDI report in 2012 Employees of Photon Technology International at an exhibition
Applications covered
Research on iPS cells and other regenerative medical therapies; drug discovery; and development of next-generation food and agricultural products
Products
Fluorometer, fluorescence microscopy, lifetime measurement equipment and optical components including spectrometers, light sources and lasers
Expanding functions of demonstration labs, which will support sales expansion in growth marketsWith regards to the many products in HORIBA’s Scientific Instruments & Systems segment, it is important to address the requirements of scientists and engineers for high precision and to provide diverse analytical applications. We are setting up demonstration labs in various parts of the world so that our customers can actually touch and experience products. We also provide services to analyze measurement samples brought in by customers as a way to expand the number of users.In recent years, we have focused on setting up demonstration labs in Asia and opened the demostration lab in Shanghai, China in 2013. We also plan to expand the lab in Brazil into a new location in 2014.
HORIBA’s demonstration lab in Shanghai, China
NOTE: Market shares quoted are estimates by HORIBA.
Worldmarketshare
Japan marketshare
Segmentsalesshare
Segmentsalesshare
24HORIBA Report 2013 |

Stack gas analysis
Water qualityanalysis
Air pollution analysis
Other
36%
32%
14%
18%
Japan:55%
Asia:16%
Americas:15%
Europe:14%
201220112010200920082007200620052004 2015Plan
2013
4
3
2
1
0
20
15
10
5
0
■Net sales (left) ーOperating income (right)Billions of yen Billions of yen
11%
Net sales and operating income
Sales breakdown by region
Sales breakdown by business divisions
Sales breakdown
HORIBA supports global environmental measuresand new energy industriesWe provide analytical and measurement instruments for a wide variety of applications to measure air, water, and soil constituents. We supply these instruments to various industries whose work is essential for environmental emissions reduction and process monitoring. We play an important role in gas measurement and monitoring of industrial liquid waste in the electric power, steel, and chemical industries as well as energy industries including oil refining, and heavy chemicals; purified water management for medical and semiconductor use; and constant monitoring and control of water quality in the pharmaceutical, food, and cosmetics fields. In addition, HORIBA’s accurate and accessible technology helps ensure public safety by providing accurate environmental radiological measurements, demand for which has expanded since the Great East Japan Earthquake of March 2011.
Aiming to become No. 1 in the global environmental regulation businessHORIBA is determined to grow its markets share in the global environmental analytical instrument markets, estimated at ¥150 billion, by utilizing its accumulated know-how and experience in Japan, Europe, and the Americas. We also aim to expand our market share in the water quality measurement field, by giving added emphasis to pH measuring technology, a HORIBA core business since its foundation in the 1950s. Moreover, we will further develop business by leveraging HORIBA’s expertise in the environmental and analytical instrument markets in Asia and other emerging nations, where demand is projected to grow rapidly. In addition, the process measurement equipment business we recently acquired will be important for our development of business in various industries.
Fiscal 2014 Explore demand in Japan’s water-related marketFocus on demand trends for stack gas analyzersIn fiscal 2013, despite no significant change in private investment, demand for stack gas analyzers at thermal power plants was firm. In fiscal 2014, we will focus on creating demand in Japan with our new water quality measurement instruments. In addition, we will continue to pay attention to demand growth for air pollution analyzers, triggered by PM2.5 and other problems, and we expect an increase in present sales and profits.
Instruments & Systems
25
Businessreview

50% 20%36% 32%
Major products and market shares
Stack gas analyzers H-1 series of industrial water quality analyzersThese analyzers provide highly sensitive and precise measurements of NOx, SO2, CO, CO2, and O2 constituents in gases emitted by boilers and furnaces in thermal power stations and refuse incineration facilities. A single unit can simultaneously and continuously measure all five gases. HORIBA has a leading market share in this competitive market in Japan and seeks sales growth in the global market.
These industrial water quality analyzers perform in a wide range of applications from pure water for semiconductor and food to water treatment to sewage and industrial wastewater. They confirm progress in wastewater treatment processes and control water treatment equipment. Moreover, we have developed pH electrodes that resist damage in harsh environment by strengthening their toughness, thereby reducing the frequency of electrode replacement and maintenance operations. By responding to expanding worldwide needs for remote monitoring services in water and sewage quality management and process monitoring, HORIBA pursues sales growth in the global market.
Target market: Environmental regulation marketStack gas analyzersHORIBA has a leading market share in Japan in continuous emission monitoring systems used in plants and other facilities that generate gaseous emissions and soot. Our instruments have established a widely recognized credibility for robust and reliable sampling systems, which are essential in continuous measurement of a variety of gases. The analyzers are used in applications for power generation, petrochemicals, steel, paper, foods and pharmaceuticals.
Water quality analyzersHORIBA‘s products are used for monitoring and control in water treatment processes. We have a wide-ranging water quality product line to measure pH, the basic water quality indicator, as well as chemical oxygen demand (COD), total nitrogen, and total phosphorous.Our products have been highly evaluated in the water quality analysis field by companies in the electric power, gas, petrochemicals, steel, paper, foods, and pharmaceuticals industries.
Air pollution analyzersHORIBA’s air pollution analyzers have won high acclaim in the field as highly reliable analyzers that demonstrate excellent precision and long-term stability at ppb* concentrations. They are used in over 50 countries to monitor air quality by municipal governments and private industries. Demand has been expanding for PM2.5-related monitoring. * ppb: parts per billion. One part per billion denotes one part per 1,000,000,000 parts. This notation is mainly used for describing low concentration measurements.
Customers’ life cycle costing (LCC) approach in making proposals on water quality measurementHORIBA aims at reducing life cycle costs (LCC) of products, in addition to improving performance. On top of a reduction in maintenance costs for customers, a decrease in LCC enables savings in energy, water, and waste, thereby helping to lower the environmental burden. We will continue to be active in making LCC proposals to expand our market share.
Target marketsSales breakdown in water quality
measurement in 2013Target area
30% Water quality measurement and monitoring in lakes and rivers
Environmental measurement
10%
Used in quality management and other process management in the electric power, chemical, and pharmaceutical industries
Process management
20%
Contribution to water quality management through HORIBA’s sensitive analysis technology, which is required for water management at drinking water treatment plants, etc.
Water
40%Monitoring activated sludge treatment process at sewage treatment plants, for industrial liquid waste, etc.
Sewage
NOTE: Market shares quoted are estimates by HORIBA.
Progress of the process measurement equipment business in
North AmericaThe process measurement equipment business, which was acquired from the U.S. company Cameron in February 2013, generated ¥1.2 billion in sales in fiscal 2013. At present, a new measurement demand is emerging in the U.S., where the shale gas revolution is taking place, as there is a switch from coal to gas as fuel for power generation.By capturing such measurement demand, we expect the synergy effect to increase sales of HORIBA’s stack gas analyzers. The Process & Environmental Instruments & System segment in the U.S. aims to generate sales of ¥6 billion by fiscal 2018.
Japanmarketshare
Japanmarketshare
Segmentsalesshare
Segmentsalesshare
26HORIBA Report 2013 |

27
I n v i s i b l e V a l u e s
Assets not visible in the financial statements
Value-creat ing spira lCreating values by using our “Invisible Values” is one of HORIBA’s important management philosophies.
The earnings statement and balance sheet both embody visible and important values. However, we believe that the essence
of good management is to increase “Invisible Values” which are firmly rooted in corporate culture.
Management’s emphasis on maximizing short-term earnings will not foster sustainable growth or an increase in corporate
value; these two objectives cannot be achieved if there is neglect to invest in Invisible Values.
Humanresources
Organizationalstructure
Brands
Customers
Technologies
Continual investment regardless of economic upturns and downturns
Practice of “Joy and Fun”
Diverse human resources attracted to HORIBA’s Omoi
Focus on analytical and measurement technologies
Responding scrupulously to customers’ needs
Creation ofincremental
corporate value
Value creation based on invisible values
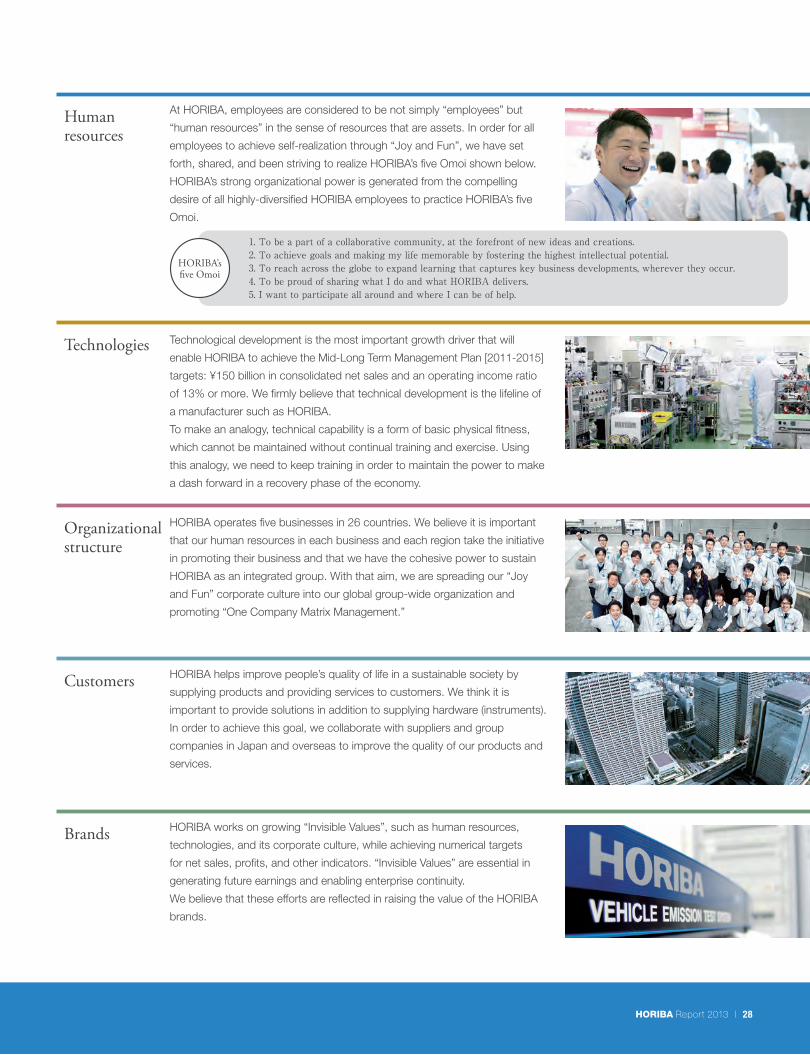
28HORIBA Report 2013 |
Human resources
At HORIBA, employees are considered to be not simply “employees” but
“human resources” in the sense of resources that are assets. In order for all
employees to achieve self-realization through “Joy and Fun”, we have set
forth, shared, and been striving to realize HORIBA’s five Omoi shown below.
HORIBA’s strong organizational power is generated from the compelling
desire of all highly-diversified HORIBA employees to practice HORIBA’s five
Omoi.
Technologies Technological development is the most important growth driver that will
enable HORIBA to achieve the Mid-Long Term Management Plan半[2011-2015]半
targets: ¥150 billion in consolidated net sales and an operating income ratio
of 13% or more. We firmly believe that technical development is the lifeline of
a manufacturer such as HORIBA.
To make an analogy, technical capability is a form of basic physical fitness,
which cannot be maintained without continual training and exercise. Using
this analogy, we need to keep training in order to maintain the power to make
a dash forward in a recovery phase of the economy.
Organizational structure
HORIBA operates five businesses in 26 countries. We believe it is important
that our human resources in each business and each region take the initiative
in promoting their business and that we have the cohesive power to sustain
HORIBA as an integrated group. With that aim, we are spreading our “Joy
and Fun” corporate culture into our global group-wide organization and
promoting “One Company Matrix Management.”
Customers HORIBA helps improve people’s quality of life in a sustainable society by
supplying products and providing services to customers. We think it is
important to provide solutions in addition to supplying hardware (instruments).
In order to achieve this goal, we collaborate with suppliers and group
companies in Japan and overseas to improve the quality of our products and
services.
Brands HORIBA works on growing “Invisible Values”, such as human resources,
technologies, and its corporate culture, while achieving numerical targets
for net sales, profits, and other indicators. “Invisible Values” are essential in
generating future earnings and enabling enterprise continuity.
We believe that these efforts are reflected in raising the value of the HORIBA
brands.
HORIBA’s five Omoi
1. To be a part of a collaborative community, at the forefront of new ideas and creations.2. To achieve goals and making my life memorable by fostering the highest intellectual potential.3. To reach across the globe to expand learning that captures key business developments, wherever they occur.4. To be proud of sharing what I do and what HORIBA delivers.5. I want to participate all around and where I can be of help.

29
Human resources
Regardless of economic upturns and downturns, HORIBA has consistently invested in human
resources, which are precious “Invisible Values”.
What lays the foundation for sustainable value creation is the understanding each HORIBA
employee has of our corporate motto “Joy and Fun” and a corporate culture that is symbolized by
”open and fair” and “entrepreneurial spirit,” and puts this heritage into practice at work.
Number of Japanese nationals who have received overseas training
204 employees
As early as 1984 we adopted a policy of sending people abroad for one-year period to acquire international experience and an international perspective. Applications for this are made at the initiative of each individual and the final decision is made at an interview with the president. By 2014, 204 employees had been given this opportunity for personal development.We will continue to value the willingness of employees to take up challenges, send them to overseas bases, and develop human resources with multicultural perspective.
Overseas employee ratio
58%Largely as a result of mergers and acquisitions, of the present 5,787 HORIBA group employees, 58% work outside of Japan (31% in Europe, 14% in the Americas, and 13% in Asia except Japan).This high ratio was not achieved by pursuing low-cost overseas labor forces. In fact, HORIBA has acquired very talented people, many holding doctorate degrees, through acquisitions.
Ratio of female managers
13%At the end of 2013, females accounted for 13% of HORIBA managerial level persons. At HORIBA, Ltd., the ratio was 5%.The percentage of females among all group employees was 25%. We believe that we have ample opportunities for females to develop their abilities and advance within the organization. The HORIBA Stained Glass Project is one way whereby we provide an environment for that.
Value creation based on invisible values

30HORIBA Report 2013 |
Moreover, unique value creation, taking advantage of diversity in different experiences, cultural attributes, and viewpoints, is critical for each
and every one of us to go about our business around the globe. We launched the HORIBA Stained Glass Project in January 2014 in order
to further enhance our organization so as to make the most of the abilities and individuality of each of us. Through facilitating communication
among employees, we will optimize the stage for creating greater value.
Face to face communication with management
Every monthThe President and other executives host birthday parties in various locations every month for employees with birthdays falling in the month. The parties create opportunities for face to face communication between management and employees and provide an opportunity to exchange their Omoi, resulting in an atmosphere of openness between them.
Users of Fun House
5,512 persons
With the belief that a training center could create more value than a manufacturing plant, we opened a training center that we named the Fun House.In 2013, 5,512 people in total used the facility to attend the HORIBA COLLEGE courses, training sessions for new employees, Blackjack Project World Cup competition, Global Strategy and Budget Meetings by global top management, and many more events. Attendees can actively communicate face to face by spending time together while being away from everyday assignment.
Blackjack Project
672 ideas for change
The Blackjack Project, which began in 1997 with the objective of changing the awareness and activities of employees, has resulted in the submission of 672 suggestions and proposals for change in 2013. These proposals extend over a wide range, from quality control to health management. We hold an internal World Cup competition among candidate proposals from each region where we operate. This annual competition also provides an opportunity to demonstrate to management and employees how we make Omoi a reality. We see the Blackjack Project as having an important function to globally share and promote the understanding of corporate culture, experience and knowledge.
20122011201020092008200720062005 2013
800
600
400
200
0
■Overseas■Japan
Number of ideas for change
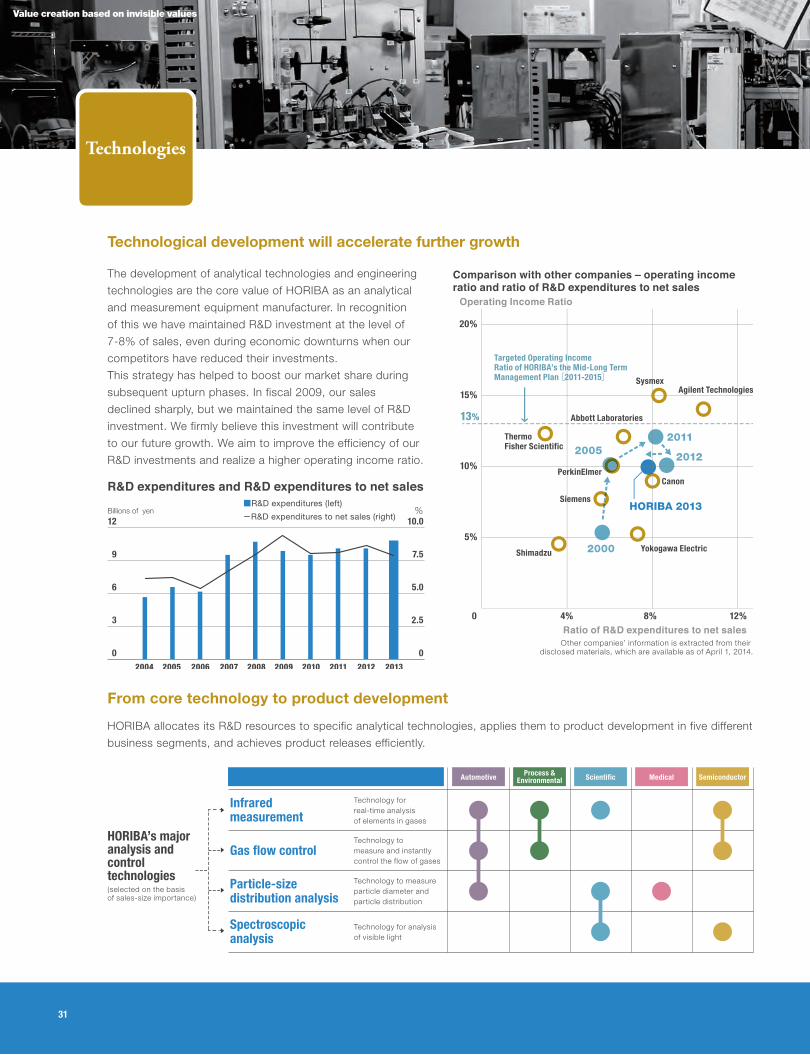
31
Technologies
Technological development will accelerate further growth
The development of analytical technologies and engineering
technologies are the core value of HORIBA as an analytical
and measurement equipment manufacturer. In recognition
of this we have maintained R&D investment at the level of
7-8% of sales, even during economic downturns when our
competitors have reduced their investments.
This strategy has helped to boost our market share during
subsequent upturn phases. In fiscal 2009, our sales
declined sharply, but we maintained the same level of R&D
investment. We firmly believe this investment will contribute
to our future growth. We aim to improve the efficiency of our
R&D investments and realize a higher operating income ratio.
R&D expenditures and R&D expenditures to net sales
12
9
6
3
0
10.0
7.5
5.0
2.5
0
Billions of yen %
2004 2005 2006 2007 2008 2009 2010 2011 20132012
■R&D expenditures (left)
R&D expenditures to net sales (right)
Comparison with other companies – operating income ratio and ratio of R&D expenditures to net sales
Operating Income Ratio
Ratio of R&D expenditures to net salesOther companies’ information is extracted from their
disclosed materials, which are available as of April 1, 2014.
HORIBA 2013
20%
15%
10%
5%
12%8%4%0
Shimadzu
Siemens
Thermo Fisher Scientific
PerkinElmer
Yokogawa Electric
Canon
Agilent TechnologiesSysmex
Abbott Laboratories
2011
13%
2005
2000
Targeted Operating Income Ratio of HORIBA’s the Mid-Long Term Management Plan[2011-2015]
2012
Infrared measurement
Technology for real-time analysis of elements in gases
Gas flow controlTechnology to measure and instantly control the flow of gases
Particle-size distribution analysis
Technology to measure particle diameter and particle distribution
Spectroscopic analysis
Technology for analysis of visible light
MedicalAutomotive Process &Environmental Scientific Semiconductor
HORIBA’s major analysis and control technologies(selected on the basis of sales-size importance)
From core technology to product development
HORIBA allocates its R&D resources to specific analytical technologies, applies them to product development in five different
business segments, and achieves product releases efficiently.
Value creation based on invisible values
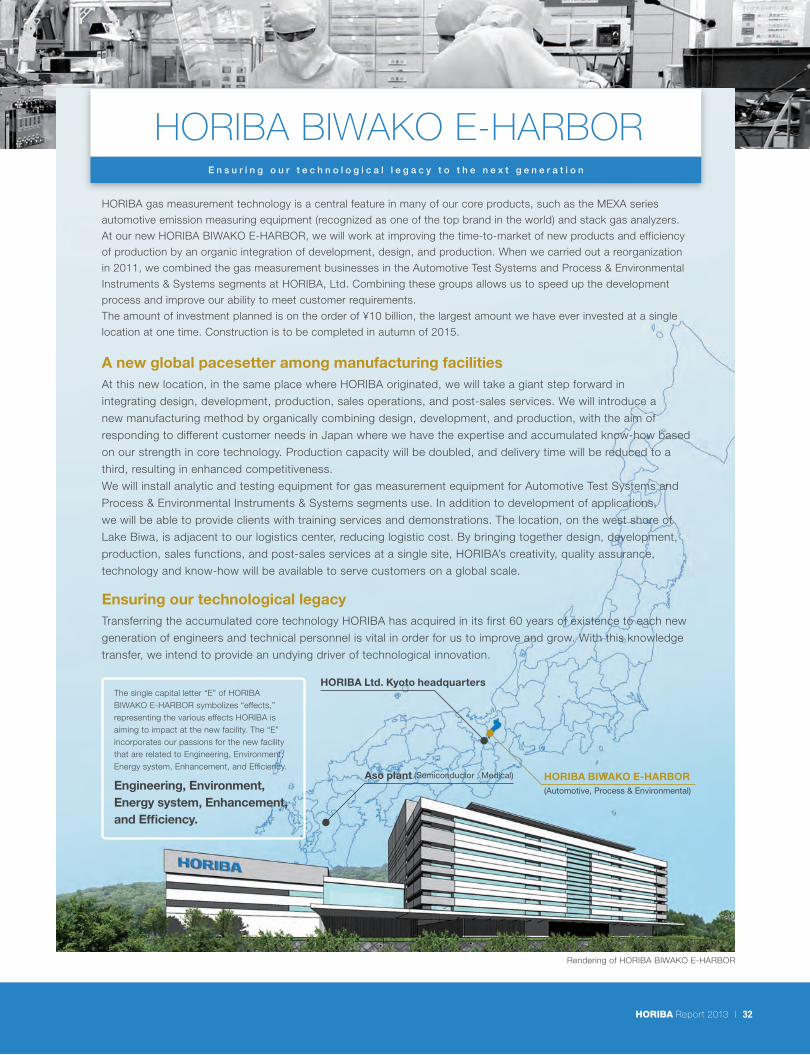
HORIBA BIWAKO E-HARBORE n s u r i n g o u r t e c h n o l o g i c a l l e g a c y t o t h e n e x t g e n e r a t i o n
32HORIBA Report 2013 |
HORIBA gas measurement technology is a central feature in many of our core products, such as the MEXA series
automotive emission measuring equipment (recognized as one of the top brand in the world) and stack gas analyzers.
At our new HORIBA BIWAKO E-HARBOR, we will work at improving the time-to-market of new products and efficiency
of production by an organic integration of development, design, and production. When we carried out a reorganization
in 2011, we combined the gas measurement businesses in the Automotive Test Systems and Process & Environmental
Instruments & Systems segments at HORIBA, Ltd. Combining these groups allows us to speed up the development
process and improve our ability to meet customer requirements.
The amount of investment planned is on the order of ¥10 billion, the largest amount we have ever invested at a single
location at one time. Construction is to be completed in autumn of 2015.
A new global pacesetter among manufacturing facilitiesAt this new location, in the same place where HORIBA originated, we will take a giant step forward in
integrating design, development, production, sales operations, and post-sales services. We will introduce a
new manufacturing method by organically combining design, development, and production, with the aim of
responding to different customer needs in Japan where we have the expertise and accumulated know-how based
on our strength in core technology. Production capacity will be doubled, and delivery time will be reduced to a
third, resulting in enhanced competitiveness.
We will install analytic and testing equipment for gas measurement equipment for Automotive Test Systems and
Process & Environmental Instruments & Systems segments use. In addition to development of applications,
we will be able to provide clients with training services and demonstrations. The location, on the west shore of
Lake Biwa, is adjacent to our logistics center, reducing logistic cost. By bringing together design, development,
production, sales functions, and post-sales services at a single site, HORIBA’s creativity, quality assurance,
technology and know-how will be available to serve customers on a global scale.
Ensuring our technological legacyTransferring the accumulated core technology HORIBA has acquired in its first 60 years of existence to each new
generation of engineers and technical personnel is vital in order for us to improve and grow. With this knowledge
transfer, we intend to provide an undying driver of technological innovation.
Rendering of HORIBA BIWAKO E-HARBOR
The single capital letter “E” of HORIBA BIWAKO E-HARBOR symbolizes “effects,” representing the various effects HORIBA is aiming to impact at the new facility. The “E” incorporates our passions for the new facility that are related to Engineering, Environment, Energy system, Enhancement, and Efficiency.
Engineering, Environment, Energy system, Enhancement, and Efficiency.
HORIBA BIWAKO E-HARBOR(Automotive, Process & Environmental)
HORIBA Ltd. Kyoto headquarters
Aso plant (Semiconductor , Medical)
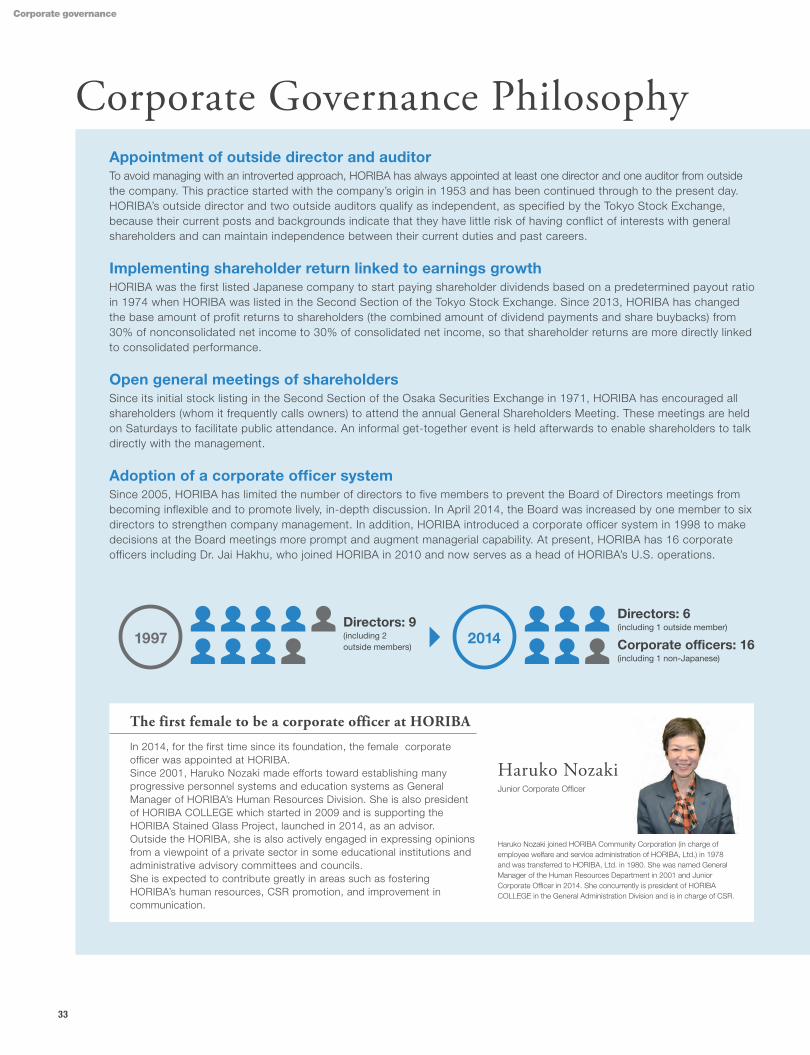
Corporate Governance PhilosophyAppointment of outside director and auditorTo avoid managing with an introverted approach, HORIBA has always appointed at least one director and one auditor from outside the company. This practice started with the company’s origin in 1953 and has been continued through to the present day.HORIBA’s outside director and two outside auditors qualify as independent, as specified by the Tokyo Stock Exchange, because their current posts and backgrounds indicate that they have little risk of having conflict of interests with general shareholders and can maintain independence between their current duties and past careers.
Implementing shareholder return linked to earnings growthHORIBA was the first listed Japanese company to start paying shareholder dividends based on a predetermined payout ratio in 1974 when HORIBA was listed in the Second Section of the Tokyo Stock Exchange. Since 2013, HORIBA has changed the base amount of profit returns to shareholders (the combined amount of dividend payments and share buybacks) from 30% of nonconsolidated net income to 30% of consolidated net income, so that shareholder returns are more directly linked to consolidated performance.
Open general meetings of shareholdersSince its initial stock listing in the Second Section of the Osaka Securities Exchange in 1971, HORIBA has encouraged all shareholders (whom it frequently calls owners) to attend the annual General Shareholders Meeting. These meetings are held on Saturdays to facilitate public attendance. An informal get-together event is held afterwards to enable shareholders to talk directly with the management.
Adoption of a corporate officer systemSince 2005, HORIBA has limited the number of directors to five members to prevent the Board of Directors meetings from becoming inflexible and to promote lively, in-depth discussion. In April 2014, the Board was increased by one member to six directors to strengthen company management. In addition, HORIBA introduced a corporate officer system in 1998 to make decisions at the Board meetings more prompt and augment managerial capability. At present, HORIBA has 16 corporate officers including Dr. Jai Hakhu, who joined HORIBA in 2010 and now serves as a head of HORIBA’s U.S. operations.
In 2014, for the first time since its foundation, the female corporate officer was appointed at HORIBA.Since 2001, Haruko Nozaki made efforts toward establishing many progressive personnel systems and education systems as General Manager of HORIBA’s Human Resources Division. She is also president of HORIBA COLLEGE which started in 2009 and is supporting the HORIBA Stained Glass Project, launched in 2014, as an advisor.Outside the HORIBA, she is also actively engaged in expressing opinions from a viewpoint of a private sector in some educational institutions and administrative advisory committees and councils.She is expected to contribute greatly in areas such as fostering HORIBA’s human resources, CSR promotion, and improvement in communication.
1997 2014Directors: 9(including 2 outside members)
Directors: 6(including 1 outside member)
Corporate officers: 16(including 1 non-Japanese)
The first female to be a corporate officer at HORIBA
Haruko Nozaki joined HORIBA Community Corporation (in charge of employee welfare and service administration of HORIBA, Ltd.) in 1978 and was transferred to HORIBA, Ltd. in 1980. She was named General Manager of the Human Resources Department in 2001 and Junior Corporate Officer in 2014. She concurrently is president of HORIBA COLLEGE in the General Administration Division and is in charge of CSR.
Haruko NozakiJunior Corporate Officer
33
Corporate governance

Since the 1950’s, when Japanese corporations paid little attention to corporate governance, HORIBA has pledged to conduct its
corporate affairs by the following policies.
Corporate governance structure chart
Board of Directors(Directors)
Board of Auditors(Auditors) Independent Auditor
President
Corporate Officers/Division Managers
Committees, etc.*
Internal Control Promotion Committee
HORIBA CSR Promotion Committee Compliance Committee
Directors and Corporate Officers’
Meeting/ Operations Committee/
Management Committee
Business Execution Monitoring
Internal controls
General Meeting of Shareholders
Litigation, Exports, Legal Affairs, Fixed assets, Public-Sector Grants, Subsidiary Audits
Joy and Fun, Open and Fair HORIBA Corporate Philosophy and Ethical Guidelines
Internal Auditing(Group Internal Audit Office)
Integrated Management System (IMS)(Quality, Environmental, Health & Safety and Business Continuity Management)
Appointment,Dismissal
Coordination
Appointment,Dismissal
Supervising,Monitoring
Supervising, Monitoring Financial Audit
Supervision
Reporting
Supervising
Supervising
Coordination
CoordinationCoordination
HORIBA, Ltd. CSR Promotion Committee**
Reporting Principles
Promotion
Advisory,Proposals
ReportingDiscussed Items
Reporting
Selection, DismissalBusiness ExecutionInstructions
Appointment,Dismissal
ReportingSupervisionEntrusting BusinessExecution
Approval of Resignation, Dismissal, and ReappointmentJudging Suitability of the Independent Auditors
Direction and Orders, Reporting
* Committees, etc. refer to committees and conferences that are established and registered based on the "Regulations concerning conferences and committees," such as the Promotion Committee for Management of Business with Public Subsidies and the Safety and Health Committee.
** The CSR Promotion Committee decides on the CSR Policy and priority measures and organizes CSR-related specific activities. In addition, it discusses andapproves the issues and the measures concerning the promotion of risk management.
34HORIBA Report 2013 |

Board of directors, auditors, and corporate officers
Executive Vice President and General Manager of Corporate & Segment Strategy Division Juichi Saito
1982
2005
2013
Joined HORIBA, Ltd. and held positions such as General Manager of Engine Measurement Planning & Development Department and President of HORIBA Instruments Inc. (US)
Appointed as HORIBA’s Director
Appointed as Executive Vice President up to the present
Director and General Manager of Research & Development Division Dr. Masayuki Adachi
1985
2006
2007
2014
Joined HORIBA, Ltd. and held positions such as General Manager of Emission analysis Research & Development Division and General Manager of Engine Measurement System Management Division.
Appointed as HORIBA’s Corporate Officer
Appointed as President of HORIBA International Corporation (US)
Appointed as Director up to the presentAppointed as President of HORIBA Jobin Yvon S.A.S. up to the present
Auditor Toshihiko Uno
1974
2002
2004
2011
2012
Joined HORIBA, Ltd. and held positions such as General Manager of Hardware Development and General Manager of Production Center
Appointed as HORIBA’s Corporate Officer
Appointed as Senior Corporate Officer
Resigned as Senior Corporate Officer
Appointed as HORIBA’s Auditor up to the present
Executive Vice Chairman Dr. Kozo Ishida
1970
1988
2002
2005
2014
Joined HORIBA, Ltd. and held positions such as General Manager of Products Department Ⅰ of Development and Sales Headquarters and President of HORIBA Europe GmbH
Appointed as HORIBA’s Director
Appointed as Executive Vice President
Appointed as Executive Vice President and Representative Director
Appointed as Executive Vice Chairman up to the present
Managing Director, General Manager of General Administration Division, and Tokyo Branch Manager Fumitoshi Sato
1976
2004
2005
Joined the Bank of Japan and held positions such as Aoyama Branch Manager and Fukuoka Branch Manager
Joined HORIBA, Ltd. and appointed as Senior Corporate Officer
Appointed as Managing Director up to the present
Director (Outside), Independent Director Masahiro Sugita
See page 36.
Auditor (Outside), Independent Auditor Kanji Ishizumi
1971
1981
1995
Joined the Ministry of International Trade and Industry 1975 Registered as Attorney at Law
Appointed as representative partner of the Chiyoda Kokusai Law Offices up to the present
Appointed as HORIBA’s Auditor up to the present
Auditor (Outside), Independent Auditor Keisuke Ishida
1978
2000
2001
2005
Appointed as Representative Director and CEO, SHASHIN KAGAKU CO., LTD.
Appointed as Representative Director, Chairman of the Board, CEO, SHASHIN KAGAKU CO., LTD. up to the present
Appointed as Chairman of the Board, SK-Electronics Co., Ltd. up to the present
Appointed as HORIBA’s Auditor up to the present
Chairman, President and CEO Atsushi Horiba
1972
1982
1992
2005
Joined HORIBA, Ltd. and held positions such as General Manager of Overseas Technology Department and General Manager of Overseas Headquarters
Appointed as HORIBA’s Director
Appointed as President and CEO
Appointed as Chairman, President and CEO up to the present
Board of directors and auditors
Corporate officersExecutive Corporate Officer Dr. Jai Hakhu
Senior Corporate Officer Sunao KikkawaTakashi NaganoHideyuki Koishi
Corporate Officer Yuichi MurogaHiroshi KawamuraAtsushi Nakamine
Junior Corporate Officer Seiji UsuiNarihiro OkuTadao NakamuraTsukasa SatakeYasuo YamashitaKenichi OboriHideyuki NishibunHaruko NozakiYoshimasa Tanaka
35
Corporate governance
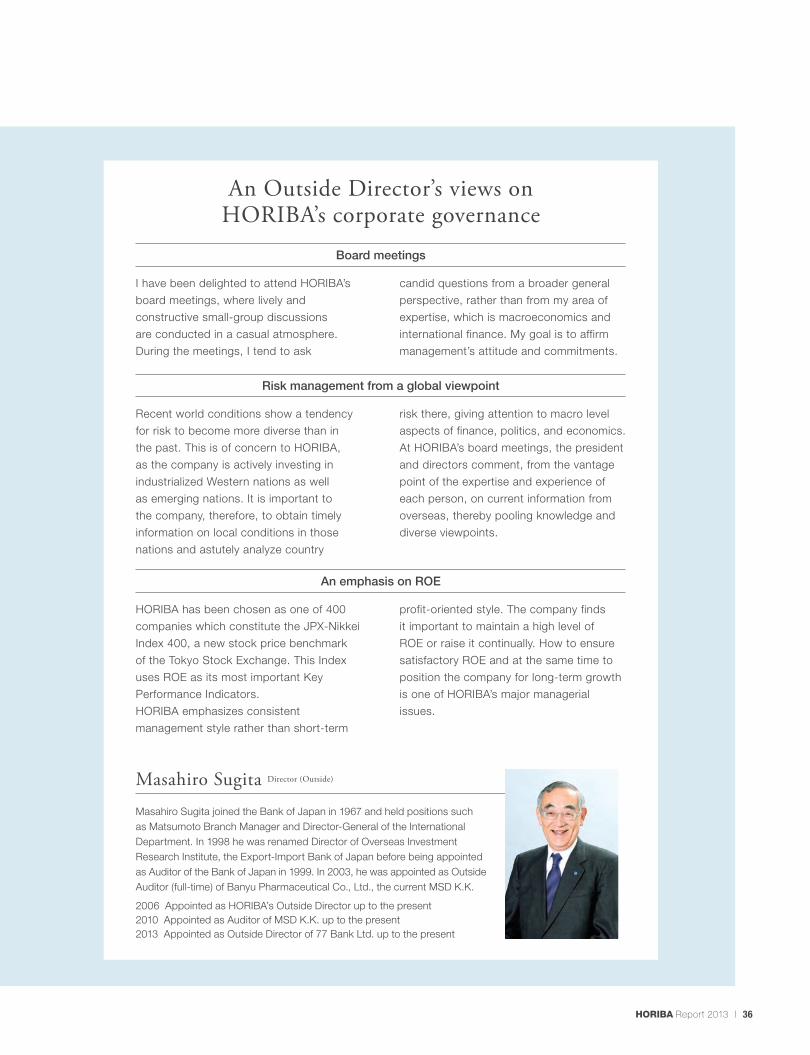
An Outside Director’s views on HORIBA’s corporate governance
Masahiro Sugita Director (Outside)
Masahiro Sugita joined the Bank of Japan in 1967 and held positions such as Matsumoto Branch Manager and Director-General of the International Department. In 1998 he was renamed Director of Overseas Investment Research Institute, the Export-Import Bank of Japan before being appointed as Auditor of the Bank of Japan in 1999. In 2003, he was appointed as Outside Auditor (full-time) of Banyu Pharmaceutical Co., Ltd., the current MSD K.K.
2006半 Appointed as HORIBA’s Outside Director up to the present2010 Appointed as Auditor of MSD K.K. up to the present2013 Appointed as Outside Director of 77 Bank Ltd. up to the present
Board meetings
I have been delighted to attend HORIBA’s
board meetings, where lively and
constructive small-group discussions
are conducted in a casual atmosphere.
During the meetings, I tend to ask
candid questions from a broader general
perspective, rather than from my area of
expertise, which is macroeconomics and
international finance. My goal is to affirm
management’s attitude and commitments.
Risk management from a global viewpoint
Recent world conditions show a tendency
for risk to become more diverse than in
the past. This is of concern to HORIBA,
as the company is actively investing in
industrialized Western nations as well
as emerging nations. It is important to
the company, therefore, to obtain timely
information on local conditions in those
nations and astutely analyze country
risk there, giving attention to macro level
aspects of finance, politics, and economics.
At HORIBA’s board meetings, the president
and directors comment, from the vantage
point of the expertise and experience of
each person, on current information from
overseas, thereby pooling knowledge and
diverse viewpoints.
An emphasis on ROE
HORIBA has been chosen as one of 400
companies which constitute the JPX-Nikkei
Index 400, a new stock price benchmark
of the Tokyo Stock Exchange. This Index
uses ROE as its most important Key
Performance Indicators.
HORIBA emphasizes consistent
management style rather than short-term
profit-oriented style. The company finds
it important to maintain a high level of
ROE or raise it continually. How to ensure
satisfactory ROE and at the same time to
position the company for long-term growth
is one of HORIBA’s major managerial
issues.
36HORIBA Report 2013 |

Striving to be a valuable company to everyoneUnder the corporate motto of “Joy and Fun,” HORIBA intends to make its business grow by building good partnerships with all
stakeholders. By this, HORIBA means it aspires to become a valuable company to everyone.
HORIBA Group CSR Policy Promoting CSR through operations
Signed the United Nations Global Compact
Integrated Management System (IMS)
* IMS (Integrated Management System) is the integration of ISO, OHSAS, and other management systems as a single management system. * HORIBA, Ltd. and HORIBA STEC Co., Ltd. have obtained Quality Management Systems for Medical Devices (ISO 13485) certification.* Please visit HORIBA Report [WEB: G] for more details.
Quality Management
Systems (ISO9001)
Quality Management Systems for
Medical Devices (ISO 13485)
Environmental Management Systems
(ISO14001)
Business Continuity
Management Systems
(ISO22301)
GroupIMS
Based on its commitments to energy, human health, the environment and safety, HORIBA will pursue corporate
initiatives to contribute to the realization of “a life of content for all.”
We formed the HORIBA Group CSR Promotion Committee in April 2005 in order to promote group-wide CSR activities.
The committee, which is chaired by Dr. Kozo Ishida, Executive Vice Chairman of HORIBA, Ltd. and participated in by
four directors in charge of CSR at the four group companies in Japan, decides on CSR policy and priority measures.
Each of the group companies has its own CSR Promotion Committee where the policy and measures decided by the
HORIBA Group CSR Promotion Committee are implemented, and our social contributions concerning education, the
environment, local communities, and other areas are compiled and reported.
In agreement with the ten principles in the areas of human rights, labor, the environment,
and anti-corruption, which the Global Compact (GC) of the United Nations sets forth for
companies within their sphere of influence, HORIBA declared its concurrence to the UN’s
policy initiative in April 2011.
Actions taken to date in connection with the policy initiative are shown on the following
page. In addition, we have joined the Global Compact Japan Network and is actively
involved in committee work in the organization.
This is one more way whereby we are engaged in activities needed and useful to society.
To provide customers with high-quality reliable products, HORIBA has adopted
the IMS*, which is a combination of the Quality Management Systems ISO9001,
Environmental Management Systems ISO14001, and Occupational Health &
Safety Management System OHSAS18001. With this, we became the first
Japanese company in the analysis and measurement industry to acquire the JQA
Integrated Management System Certifications (JQA-IG0001-08) as Group IMS
from the Japan Quality Assurance Organization, or JQA.
In February 2014, we also acquired certification for ISO22301, the international
standard for Business Continuity Management Systems, in the medical area,
which is directly related to human life, and established a system that can supply
stable number of products even in the wake of an earthquake, accident, or various
diverse risk events.
We will continue to embrace the IMS activities as we aim to enhance quality, the
environment, occupational health & safety, and product supply systems, and strive
to raise corporate value.
Occupational Health & Safety Management
Systems (OHSAS18001)
37
Corporate social responsibility

NEXT PAGE
NEXT PAGE
NEXT PAGE
NEXT PAGE
HORIBA’s initiatives
Stakeholders Themes Major activities
Society[WEB: A]
Contributing to Analysis and Measurement Industry, and Local Communities
Masao Horiba Awards; leadership in associations and groups; support for recovery from to the Great East Japan Earthquake
Employees’ contribution to societyPublishing a technical report, Readout; participating community events; hosting interns; environmental preservation activities; environmental classes at schools
Unique corporate messagesCorporate advertisements in newspapers and magazines; “Gaiapress” (an information website on the environment, nature, space, and science)
Environment[WEB: B]
Prevention and alleviation of environmental problems (GC Principles 7 & 8)
Popularize instruments for working with new material, new energy, next-generation vehicles R&D and of environmental monitoring systems; conserving resources and energy in production activities: waste water monitoring; chemical substance management; reduction in waste
Suppliers[WEB: C]
Establishments of partnerships with production partner companies
(GC Principle 10)
Conference with production partner companies; workshops on products and quality; plant tours; quality study group; World Skills International; QC workshops; Kaizen activity presentations; technical study groups
Customers[WEB: D]
Improvement in customer satisfactionQuality initiatives; customer support center; services by HORIBA Techno Service Co., Ltd.; organizing in-house technical exhibitions, Craftsmanship competition; initiatives to enhance efficiency
Develop Eco-design friendly products (GC Principle 9)
Evaluation of design for environment; response to various regulations; customer usability enhancement
Owners*[WEB: E]
Responsibility to owners and investors
General Shareholder Meetings; informal get-together events with shareholders; IR briefings for institutional investors; IR visits (Europe, Americas, Asia); tours for investors at exhibitions; briefings for individual investors; timely information disclosure
Employees[WEB: F]
Respect rights, personality, and individuality of employees (GC Principles 1-6)
Promote diversity through the HORIBA Stained Glass Project; HORIBA COLLEGE; various work systems; job posting system; sending trainees overseas; use of various hiring routes; office visits by employees’ family members; communication with executives at employees’ birthday parties
Ensure safe, healthy, pleasant workplaces for employees
Executives’ workplace safety patrol; installation of the Health Management Office; seminars by obstericians; promote health and near-mile diet by a nutritionist at cafeteria; safety and crime-prevention workshop; self-defense firefighters’ training
* HORIBA considers shareholders as important stakeholders and frequently calls them “owners”.
http://www.horiba.com/horibareport/data/HORIBA Report Web Data Book
For a company to achieve sustained business growth, it must be valuable to all stakeholders, which encompass not
only those in business fields but also those in local communities, those concerned with the global environment, and
suppliers. Further details of HORIBA’s activities, which do not appear in the financial statements, are in the HORIBA
Report Web Data Book.
38HORIBA Report 2013 |

Working together with societyContributing to analysis and measurement industry and local communities
Masao Horiba Awards
Ties to local community and employees’ families
Specific themes
2004: pH measurement
2005: Infrared related analysis and measurement technologies
2006: X-ray analysis
2007: Measurement technologies for cells or biological particles
2008: Measurement and analytical technologies related to internal combustion engines
2009: The analysis of the surface of material for the semiconductor and related industries
2010: In situ and continuous measurement of harmful airborne substances affecting human health, safety, and security
2011: Ultra high-sensitive or ultra high-speed analytical method and technology using electromagnetic radiation from the NIR to the X-ray
2012: Radiation measurement
2013: Measurement of water property
2014: Gas measurement
278
1,443
2,3272,200
2,480
2009 2010 2011 2012 2013
10
30
4144
42■Persons
-Events
The number of pupils who have been present at our classes, and the number of such events
The Masao Horiba Award, named after the founder of HORIBA Ltd., was
established to promote research in the field of analysis and measurement
technology by researchers working at universities or public research
institutes in Japan and overseas. HORIBA has made awards to 37 promising
researchers and engineers from 2004 to 2013 and has supported their
activities. We hope the award will continue to serve as a source of motivation
and encouragement for those winners.
Based on HORIBA’s wish to show children how interesting and important
the science of “measuring” is, in 1994 the company started a program of
enlisting employees to give talks at school or at events. HORIBA employees
demonstrate scientific matters by using ordinary objects and materials
from daily life and show pupils how plants and animals use their sensory
capabilities, with the thought that some of these pupils may go on later in life
to work with analytic technology.
So that the families of employees can better know what HORIBA does,
HORIBA has held Open House events every year since 2003 and invited
employees’ families to visit the company offices or work sites. Up to 2013,
951 family members have accepted
HORIBA’s invitation. In this way
HORIBA is working to assure the
families that HORIBA is a great place
to work.
39
Corporate social responsibility

Working alongside customersConsiderate attention to products
Development of long-life, low-energy “Eco-design” products
Working together with suppliersEstablishment of partnerships with production partner companies
Increasing market shares together with suppliers during downturns
“Eco-design” product
Portable pH/water quality meters
6 times
2 times 28
96
Former model:D-51
New model:D-71
Former model:#9615-10D
New model:#9631-10D
Reduction in annual number of batteries replaced
The number of batteries when using 5 hours/day X 240 days
Reduction in annual number of electrodes replaced
Calculation of electrode life when a 1% solution of hydrofluoric acid is used 2 hours/day for 240 days
Improvement in usable duration of
hydrofluoric acid
Design of low energy consumption circuits
Total number of production partner companies
1,055companies
Of which have been with us for 6 years or longer
777companies
(74%)
HORIBA has adopted an internal standard to determine “Eco-design” products in order to provide products that
reflect responsible product life cycles, such as, longer operating life and energy savings. This standard is used
when developing new products. With social and economic matters such
as the rise in energy costs, we use quantitative measurement to determine
how products represent a reduction in energy requirements or a reduction
in materials used. HORIBA’s “Eco-design” products target a 25% reduction
compared to conventional models.
HORIBA considers the relationships we have built and maintained with our
regular production partner companies as “Invisible Values.” Over the long term
we have developed strong ties with these suppliers, which has enabled us to
provide customers with high-quality products and reliable delivery scheduling.
We are now increasing procurement on a global basis through our network
of overseas companies. In Japan, in order to ensure continuation of our
Win-Win relationships, we provide opportunities to share our thoughts and
experience in business matters with the suppliers, and help them to develop
the next generation of managers. The regular suppliers that have been doing
business with HORIBA for 6 years or longer since 2008 is 777 (74% of a total
of 1,055 suppliers). They have been able to prosper in good times and survive
tough times, together with us. One reason we have been able to keep up with
demand and increase our market shares, even during a period of a strong surge
in demand, is that our relationships with these suppliers has enabled us to
respond very quickly to customer demand.
40HORIBA Report 2013 |

One Company Song
HORIBA beyond bordersWhen HORIBA celebrated its 60th anniversary in 2013,
one of our activities was to adopt a company song,
which was named “Joy & Fun” by employees. It conveys
the message that HORIBA is “One Company” while
incorporating a number of nationalities and cultures.
Based on words from employees worldwide, incorporating
their Omoi (meaning an emotional feeling, passion,
commitment, mission and objective) on the One Company
message, lyrics and music were commissioned to
Hiroaki Hayama, a well-known songwriter in Japan.
Joy & Funlyrics & music by Hiroaki Hayama
Looking to the future in your innocent eyes
I am trying for the best for your life
Not afraid of going against the wind
Cause’ everything’s going to be alright
We were born in a different place
There is surely a different sky
Just as long as you see the light
Let us cry together as one
Hand in hand, why not speak out
And in no time you’ll be fine
Joy & Fun, tomorrow’s a new day
I’ll be there by your side
In search of brighter days
We are one, oh cannot be replaced
And facing each other
So we’re there for the world
HORIBA on YouTube
One Company Song 検 索
The “Joy & Fun” song is on YouTube and is accessible to all interested in HORIBA.Please watch our employees singing the song in various locations worldwide.
41
One Company Song

FINANCIAL DATAYear Ended December 31, 2013
42HORIBA Report 2013 |
Financial data

2004.3 2005.3 2006.3 2006.12 2007.12 2008.12 2009.12 2010.12 2011.12 2012.12 2013.12 2013.12
For the Year: Millions of yen Thousands of U.S. dollars
Net sales ¥85,073 ¥92,492 ¥105,665 ¥116,099 ¥144,283 ¥134,248 ¥104,538 ¥118,556 ¥123,456 ¥117,609 ¥138,136 $1,310,712
Operating costs and expenses 78,223 83,119 94,390 104,392 127,753 123,290 99,394 106,256 108,549 105,857 124,402 1,180,396
Operating income 6,850 9,373 11,275 11,707 16,530 10,958 5,144 12,299 14,906 11,751 13,733 130,306
Net income 2,074 3,524 6,473 6,510 8,691 6,039 3,161 7,927 8,664 7,396 8,999 85,387
Capital expenditures 3,501 3,956 5,664 5,059 9,336 6,645 4,534 4,033 4,670 7,882 7,680 72,872
Depreciation and amortization 3,037 2,944 3,173 3,246 4,161 4,955 4,573 4,523 4,146 3,743 4,279 40,601
Research and development expenses 5,129 5,636 6,553 6,136 9,474 10,662 9,831 9,480 10,060 10,092 10,774 102,229
At Year-End: Millions of yen Thousands of U.S. dollars
Total assets ¥92,657 ¥99,913 ¥119,976 ¥129,236 ¥154,367 ¥133,279 ¥129,580 ¥137,290 ¥144,649 ¥153,836 ¥189,269 $1,795,891
Cash and cash equivalents 13,603 16,108 14,884 15,673 20,565 22,660 27,590 34,459 35,767 38,858 49,246 467,273
Trade notes and accounts receivable
Affiliated companies - - - - - 63 6 1 126 4 25 237
Other 29,143 30,595 37,408 42,485 45,873 37,330 34,505 36,425 39,249 37,516 47,386 449,625
Inventories 19,402 22,012 27,273 30,947 33,734 29,802 23,363 24,843 26,288 28,101 33,085 313,929
Property, plant and equipment, net 18,841 18,481 20,223 21,700 24,071 23,115 23,602 22,516 22,924 28,179 33,326 316,215
Trade notes and accounts payable
Affiliated companies 58 26 45 44 53 40 52 60 0 - - -
Other 8,700 11,264 13,017 14,917 16,792 11,063 10,515 13,423 13,196 11,829 16,409 155,697
Liabilities with interest 21,460 16,042 13,866 16,224 25,177 20,984 18,348 17,128 18,358 18,083 24,577 233,200
Shareholders’ equity 43,348 52,263 65,446 72,371 80,377 76,829 79,906 84,019 90,232 99,248 114,209 1,083,679
Share price at end of fiscal period (¥) 1,380 1,950 3,690 4,400 4,100 1,237 2,250 2,303 2,320 2,489 3,590 U.S. dollars 34.06
Number of employees (consolidated) 3,808 3,984 4,461 4,697 4,976 5,146 5,133 5,202 5,448 5,530 5,787
Per Share Information: Yen U.S. dollars
Net income - basic ¥62.90 ¥98.33 ¥154.27 ¥154.23 ¥205.01 ¥142.76 ¥74.77 ¥187.46 ¥204.88 ¥174.87 ¥212.76 $2.01Net income - diluted 50.10 83.81 146.97 153.70 204.39 142.71 74.68 187.11 204.41 174.37 212.01 2.01
Net assets 1,350.31 1,415.75 1,548.08 1,710.75 1,892.64 1,816.96 1,889.58 1,986.77 2,133.44 2,346.45 2,699.88 25.61
Cash dividends 10.00 16.00 28.00 26.00 39.00 44.00 13.00 17.00 40.00 50.00 60.00 0.56
Financial Ratios:
Operating income to net sales (%) 8.1 10.1 10.7 10.1 11.5 8.2 4.9 10.4 12.1 10.0 9.9 Return on assets (%) 2.2 3.7 5.9 5.2 6.1 4.2 2.4 5.9 6.1 5.0 5.2
Return on equity (%) 5.0 7.4 11.0 9.4 11.4 7.7 4.0 9.7 9.9 7.8 8.4
Shareholders' equity ratio (%) 46.8 52.3 54.6 56.0 52.1 57.6 61.7 61.2 62.4 64.5 60.3
Consolidated dividend payout ratio (%) 15.3 16.5 18.1 16.9 19.0 30.8 17.4 9.1 19.5 28.6 28.2
Nonconsolidated dividend payout ratio (%) 30.3 41.8 33.8 30.0 30.1 30.0 30.0 30.3 30.5 37.5 48.9
Eleven-Year Summary
Notes: The stated amounts are rounded down to the nearest million yen from the year, ended December 31, 2009, but are rounded (up or down) to the nearest million yen prior to that year.
1. The U.S. dollar amounts are provided solely for convenience at the rate of ¥105.39 to US$1.00, the rate prevailing on December 31, 2013.
2. Effective from the year ended December 31, 2006, HORIBA adopted the revised accounting standard for presentation of net assets in the balance sheet. The amounts in prior years have not been restated.
3. For the year ended December 31, 2006, the accounting term for HORIBA, Ltd. and HORIBA Advanced Techno Co., Ltd. was only 9 months and 11 days and that for HORIBA STEC Co., Ltd. was only 9 months as a result of a change in the fiscal year-end to December 31.
43
Financial data

2004.3 2005.3 2006.3 2006.12 2007.12 2008.12 2009.12 2010.12 2011.12 2012.12 2013.12 2013.12
For the Year: Millions of yen Thousands of U.S. dollars
Net sales ¥85,073 ¥92,492 ¥105,665 ¥116,099 ¥144,283 ¥134,248 ¥104,538 ¥118,556 ¥123,456 ¥117,609 ¥138,136 $1,310,712
Operating costs and expenses 78,223 83,119 94,390 104,392 127,753 123,290 99,394 106,256 108,549 105,857 124,402 1,180,396
Operating income 6,850 9,373 11,275 11,707 16,530 10,958 5,144 12,299 14,906 11,751 13,733 130,306
Net income 2,074 3,524 6,473 6,510 8,691 6,039 3,161 7,927 8,664 7,396 8,999 85,387
Capital expenditures 3,501 3,956 5,664 5,059 9,336 6,645 4,534 4,033 4,670 7,882 7,680 72,872
Depreciation and amortization 3,037 2,944 3,173 3,246 4,161 4,955 4,573 4,523 4,146 3,743 4,279 40,601
Research and development expenses 5,129 5,636 6,553 6,136 9,474 10,662 9,831 9,480 10,060 10,092 10,774 102,229
At Year-End: Millions of yen Thousands of U.S. dollars
Total assets ¥92,657 ¥99,913 ¥119,976 ¥129,236 ¥154,367 ¥133,279 ¥129,580 ¥137,290 ¥144,649 ¥153,836 ¥189,269 $1,795,891
Cash and cash equivalents 13,603 16,108 14,884 15,673 20,565 22,660 27,590 34,459 35,767 38,858 49,246 467,273
Trade notes and accounts receivable
Affiliated companies - - - - - 63 6 1 126 4 25 237
Other 29,143 30,595 37,408 42,485 45,873 37,330 34,505 36,425 39,249 37,516 47,386 449,625
Inventories 19,402 22,012 27,273 30,947 33,734 29,802 23,363 24,843 26,288 28,101 33,085 313,929
Property, plant and equipment, net 18,841 18,481 20,223 21,700 24,071 23,115 23,602 22,516 22,924 28,179 33,326 316,215
Trade notes and accounts payable
Affiliated companies 58 26 45 44 53 40 52 60 0 - - -
Other 8,700 11,264 13,017 14,917 16,792 11,063 10,515 13,423 13,196 11,829 16,409 155,697
Liabilities with interest 21,460 16,042 13,866 16,224 25,177 20,984 18,348 17,128 18,358 18,083 24,577 233,200
Shareholders’ equity 43,348 52,263 65,446 72,371 80,377 76,829 79,906 84,019 90,232 99,248 114,209 1,083,679
Share price at end of fiscal period (¥) 1,380 1,950 3,690 4,400 4,100 1,237 2,250 2,303 2,320 2,489 3,590 U.S. dollars 34.06
Number of employees (consolidated) 3,808 3,984 4,461 4,697 4,976 5,146 5,133 5,202 5,448 5,530 5,787
Per Share Information: Yen U.S. dollars
Net income - basic ¥62.90 ¥98.33 ¥154.27 ¥154.23 ¥205.01 ¥142.76 ¥74.77 ¥187.46 ¥204.88 ¥174.87 ¥212.76 $2.01Net income - diluted 50.10 83.81 146.97 153.70 204.39 142.71 74.68 187.11 204.41 174.37 212.01 2.01
Net assets 1,350.31 1,415.75 1,548.08 1,710.75 1,892.64 1,816.96 1,889.58 1,986.77 2,133.44 2,346.45 2,699.88 25.61
Cash dividends 10.00 16.00 28.00 26.00 39.00 44.00 13.00 17.00 40.00 50.00 60.00 0.56
Financial Ratios:
Operating income to net sales (%) 8.1 10.1 10.7 10.1 11.5 8.2 4.9 10.4 12.1 10.0 9.9 Return on assets (%) 2.2 3.7 5.9 5.2 6.1 4.2 2.4 5.9 6.1 5.0 5.2
Return on equity (%) 5.0 7.4 11.0 9.4 11.4 7.7 4.0 9.7 9.9 7.8 8.4
Shareholders' equity ratio (%) 46.8 52.3 54.6 56.0 52.1 57.6 61.7 61.2 62.4 64.5 60.3
Consolidated dividend payout ratio (%) 15.3 16.5 18.1 16.9 19.0 30.8 17.4 9.1 19.5 28.6 28.2
Nonconsolidated dividend payout ratio (%) 30.3 41.8 33.8 30.0 30.1 30.0 30.0 30.3 30.5 37.5 48.9
HORIBA, Ltd. and Consolidated Subsidiaries
The years ended March 20, 2004 - 2006 and the years ended December 31, 2006 - 2013.
Computations: Shareholders’ equity = net assets - subscription rights to shares - minority interests
Net income per share (¥) = (net income – projected bonuses to directors and corporate auditors)*
/ (average number of shares issued and outstanding in the fiscal period, corrected for treasury stock)
Net assets per share (¥) = (shareholders’ equity – projected bonuses to directors and corporate auditors)*
/ (number of shares issued and outstanding, corrected for treasury stock)
Operating income to net sales (%) = 100 x operating income / net sales
Return on assets (ROA, %) = 100 x net income / average total assets in prior fiscal period
Return on equity (ROE, %) = 100 x net income / average shareholders’ equity in prior fiscal period
Shareholders’ equity ratio (%) = 100 x shareholders’ equity / total assets
Consolidated dividend payout ratio (%) = 100 x dividends paid / net income (consolidated)
Nonconsolidated dividend payout ratio (%) = 100 x dividends paid / net income (nonconsolidated)
*Directors' and corporate auditors' bonuses from the year ended December 31, 2006 are recognized in selling, general and administrative expenses.
44HORIBA Report 2013 |

150,000
120,000
90,000
60,000
30,000
0
Millions of yen
Process & Environmental
Scientific
Semiconductor
Medical-Diagnostic
AutomotiveTest Systems
12.0
10.0
8.0
6.0
4.0
2.0
0
18,000
15,000
12,000
9,000
6,000
3,000
0
8.2
4.9
10.4
10,958 5,144 12,299 16,530 11,707 11,275 9,373 6,850 14,906
12.1
10.0
9.9
11.5
10.1
10.7 10.1
8.1
100
75
50
25
0
40,000
30,000
20,000
10,000
0
81 8285
92
82 86
93
74
70
60
50
40
30
20
10
0
44
13 17
39
26
28
16
10
10,000
8,000
6,000
4,000
2,000
0
4,955
4,573
4,523
3,246
4,161
3,173 2,944 3,037
6,645
4,534
4,033
9,336
5,059
5,664
3,956 3,501
2012.122008.12 2009.12 2010.12 2011.122007.122006.122006.32005.32004.3
Millions of yen % Millions of yen Days
Yen Millions of yen
143
75
187
205
175
213 205
154 154
98
63
2013.122012.12
3,000
2,500
2,000
1,500
1,000
500
0
300
250
200
150
100
50
02008.12 2009.12 2010.12 2011.122007.122006.122006.32005.32004.3
Yen Yen
1,817 1,890
1,987
2,1332,346
2,700
1,893 1,711 1,548
1,416 1,350
76
8581
29,802 23,363 24,843 33,734 30,947 27,273 22,012 19,402 26,288
2012.12
4,146
4,670
2012.12
3,743
4,279
7,882
7,680
2013.122008.12 2009.12 2010.12 2011.122007.122006.122006.32005.32004.3
10
9
8
7
6
5
4
3
2
1
0
200,000
180,000
160,000
140,000
120,000
100,000
80,000
60,000
40,000
20,000
0
4.2
2.4
5.9 6.1
5.2
5.9
3.7
2.2
Millions of yen %
6.1
5.0
5.2
2012.122008.12 2009.12 2010.12 2011.122007.122006.122006.32005.32004.3
40
2012.12
50
60
2013.122008.12 2009.12 2010.12 2011.122007.122006.122006.32005.32004.3
12,000
10,000
8,000
6,000
4,000
2,000
0
7.9
9.4
8.0
6.6
5.3
6.2 6.1 6.0
Millions of yen %
10,662 9,831 9,480 9,474 6,136 6,553 5,636 5,129 10,060
8.1
8.6
7.8
2012.122008.12 2009.12 2010.12 2011.122007.122006.122006.32005.32004.3
10,465
85,073 8,999
92,492 10,319
105,665 9,753
116,099
14,290
144,283
13,721
134,248
12,022
104,538 11,787
118,556
23,582
17,301
14,764
18,960
27,022
18,777
18,183
19,510
34,446
20,508
18,039
22,351
37,945
22,989
20,111
25,300
51,475
25,836
26,934
25,748
54,232
24,722
16,762
24,810
37,192
22,337
12,483
20,503
35,751
22,514
27,676
20,825
2012.122008.12 2009.12 2010.122007.122006.122006.32005.32004.3 2011.12
2008.12 2009.12 2010.12
12.0
10.0
8.0
6.0
4.0
2.0
0.0
12,000
10,000
8,000
6,000
4,000
2,000
02007.122006.122006.32005.32004.3
7.7
4.0
9.7
2011.12
9.9
11.4
9.4
11.0
7.4
5.0
Millions of yen %
6,039 3,161 7,927 8,691 6,510 6,473 3,524 2,074 8,664
Net IncomeReturn on Equity (ROE)
R&D ExpedituresR&D Expeditures to Net Sales
Operating IncomeRatio of Operating Income to Net Sales
InventoriesDays
Net Income per Share (left)Net Assets per Share (right)
Capital ExpendituresDepreciations and Amortization
14,558
123,456
38,678
23,485
24,694
22,040
10,662 9,831 9,480 9,474 6,136 6,553 5,636 5,129 10,060
2013.12
133,279 129,580 137,290 154,367 129,236 119,976 99,913 92,657 144,649 133,279 129,580 137,290 154,367 129,236 119,976 99,913 92,657 144,649
2013.12
29,802 23,363 24,843 33,734 30,947 27,273 22,012 19,402 26,288
2013.122008.12 2009.12 2010.12 2011.122007.122006.122006.32005.32004.3
10,958 5,144 12,299 16,530 11,707 11,275 9,373 6,850 14,906
2013.12
13,709
117,609
43,230
22,400
17,861
20,406
2012.12 2013.12
7.8 8.4
7,396 6,039 3,161 7,927 8,691 6,510 6,473 3,524 2,074 8,664 7,396
11,75111,751 28,10128,101
153,836153,836 10,09210,092
2013.12
14,711
138,136
49,524
22,913
26,832
24,153
8,9998,999
13,73313,733
Total AssetsReturn on Assets (ROA)
189.296189.269
33,08533,085
12.0
10.0
8.0
6.0
4.0
2.0
010,77410,774
Net Sales by Segment
Net Income and Return on Equity (ROE)
Net Income per Share and Net Assets per Share
In fiscal 2013, ended December 31,
2013, HORIBA’s net sales increased
from the previous year in all
segments, as the weaker yen
boosted the value of overseas sales
when converted into yen and
investments by semiconductor
manufacturers and automakers also
grew. The net sales amount was the
second highest following that of
fiscal 2007.
In addition to an increase in
operating income, an
extraordinary gain associated
with the sale of a building in the
U.S. contributed to record-high
net income.
This resulted in ROE rising by 0.6
percentage points to 8.4%.
Fiscal 2013 net assets per share
reached a record high of ¥2,700,
while net income per share also
ended up at a record high of
¥213, up ¥38 from the previous
year. The price to book value ratio
was approximately 1.3 times.
Eleven-Year Summary
45
Financial data

150,000
120,000
90,000
60,000
30,000
0
Millions of yen
Process & Environmental
Scientific
Semiconductor
Medical-Diagnostic
AutomotiveTest Systems
12.0
10.0
8.0
6.0
4.0
2.0
0
18,000
15,000
12,000
9,000
6,000
3,000
0
8.2
4.9
10.4
10,958 5,144 12,299 16,530 11,707 11,275 9,373 6,850 14,906
12.1
10.0
9.9
11.5
10.1
10.7 10.1
8.1
100
75
50
25
0
40,000
30,000
20,000
10,000
0
81 8285
92
82 86
93
74
70
60
50
40
30
20
10
0
44
13 17
39
26
28
16
10
10,000
8,000
6,000
4,000
2,000
0
4,955
4,573
4,523
3,246
4,161
3,173 2,944 3,037
6,645
4,534
4,033
9,336
5,059
5,664
3,956 3,501
2012.122008.12 2009.12 2010.12 2011.122007.122006.122006.32005.32004.3
Millions of yen % Millions of yen Days
Yen Millions of yen
143
75
187
205
175
213 205
154 154
98
63
2013.122012.12
3,000
2,500
2,000
1,500
1,000
500
0
300
250
200
150
100
50
02008.12 2009.12 2010.12 2011.122007.122006.122006.32005.32004.3
Yen Yen
1,817 1,890
1,987
2,1332,346
2,700
1,893 1,711 1,548
1,416 1,350
76
8581
29,802 23,363 24,843 33,734 30,947 27,273 22,012 19,402 26,288
2012.12
4,146
4,670
2012.12
3,743
4,279
7,882
7,680
2013.122008.12 2009.12 2010.12 2011.122007.122006.122006.32005.32004.3
10
9
8
7
6
5
4
3
2
1
0
200,000
180,000
160,000
140,000
120,000
100,000
80,000
60,000
40,000
20,000
0
4.2
2.4
5.9 6.1
5.2
5.9
3.7
2.2
Millions of yen %
6.1
5.0
5.2
2012.122008.12 2009.12 2010.12 2011.122007.122006.122006.32005.32004.3
40
2012.12
50
60
2013.122008.12 2009.12 2010.12 2011.122007.122006.122006.32005.32004.3
12,000
10,000
8,000
6,000
4,000
2,000
0
7.9
9.4
8.0
6.6
5.3
6.2 6.1 6.0
Millions of yen %
10,662 9,831 9,480 9,474 6,136 6,553 5,636 5,129 10,060
8.1
8.6
7.8
2012.122008.12 2009.12 2010.12 2011.122007.122006.122006.32005.32004.3
10,465
85,073 8,999
92,492 10,319
105,665 9,753
116,099
14,290
144,283
13,721
134,248
12,022
104,538 11,787
118,556
23,582
17,301
14,764
18,960
27,022
18,777
18,183
19,510
34,446
20,508
18,039
22,351
37,945
22,989
20,111
25,300
51,475
25,836
26,934
25,748
54,232
24,722
16,762
24,810
37,192
22,337
12,483
20,503
35,751
22,514
27,676
20,825
2012.122008.12 2009.12 2010.122007.122006.122006.32005.32004.3 2011.12
2008.12 2009.12 2010.12
12.0
10.0
8.0
6.0
4.0
2.0
0.0
12,000
10,000
8,000
6,000
4,000
2,000
02007.122006.122006.32005.32004.3
7.7
4.0
9.7
2011.12
9.9
11.4
9.4
11.0
7.4
5.0
Millions of yen %
6,039 3,161 7,927 8,691 6,510 6,473 3,524 2,074 8,664
Net IncomeReturn on Equity (ROE)
R&D ExpedituresR&D Expeditures to Net Sales
Operating IncomeRatio of Operating Income to Net Sales
InventoriesDays
Net Income per Share (left)Net Assets per Share (right)
Capital ExpendituresDepreciations and Amortization
14,558
123,456
38,678
23,485
24,694
22,040
10,662 9,831 9,480 9,474 6,136 6,553 5,636 5,129 10,060
2013.12
133,279 129,580 137,290 154,367 129,236 119,976 99,913 92,657 144,649 133,279 129,580 137,290 154,367 129,236 119,976 99,913 92,657 144,649
2013.12
29,802 23,363 24,843 33,734 30,947 27,273 22,012 19,402 26,288
2013.122008.12 2009.12 2010.12 2011.122007.122006.122006.32005.32004.3
10,958 5,144 12,299 16,530 11,707 11,275 9,373 6,850 14,906
2013.12
13,709
117,609
43,230
22,400
17,861
20,406
2012.12 2013.12
7.8 8.4
7,396 6,039 3,161 7,927 8,691 6,510 6,473 3,524 2,074 8,664 7,396
11,75111,751 28,10128,101
153,836153,836 10,09210,092
2013.12
14,711
138,136
49,524
22,913
26,832
24,153
8,9998,999
13,73313,733
Total AssetsReturn on Assets (ROA)
189.296189.269
33,08533,085
12.0
10.0
8.0
6.0
4.0
2.0
010,77410,774
Operating Income and Ratio of Operating Income to Net Sales Inventories and Inventory Turnover (Days)
Total Assets and Return on Assets (ROA)R&D Expenditures andR&D Expenditures to Net Sales
Cash Dividends per ShareCapital Expenditures andDepreciations and Amortization
46HORIBA Report 2013 |

HORIBA, Ltd. and Consolidated Subsidiaries | Consolidated Financial Review
During the fiscal year ended December 31, 2013, the U.S.
economy saw a moderate recovery mainly due to a mild
increase in consumer spending and some recovery in
housing starts and capital spending. The European economy
remained sluggish, partly due to the impact of fiscal
tightening in several countries, but showed signs of
bottoming out toward the latter half of the year. With regard
to Asia, China’s economy continued to expand but at a
slower rate of growth, while the economy in other areas in
Asia slowed down. In Japan, the economy recovered
gradually on the back of some recovery in consumer
spending and steady public spending, and despite lackluster
growth in exports. The annual average exchange rates for
2013 were 97.73 yen against the U.S. dollar and 129.78 yen
against the euro, marking respective depreciation of 18%
against the U.S. dollar and 21% against the euro, compared
to the previous year.
In the analytical and measurement equipment market, a
recovery in capital spending by semiconductor manufacturers
led to an increase in demand from the first half of 2013 and
helped the semiconductor-related market sustain its strength.
In the automobile-related market, capital spending and R&D
investment by Japanese and overseas automakers sustained
firm trends from the previous year. With regard to the
scientific and environmental-related markets, however,
private companies were cautious in capital spending and
R&D investments in analytical and measurement equipment,
resulting in a sustained weakness in demand.
In the face of these economic conditions, HORIBA, Ltd.
(“the Company”) and its consolidated subsidiaries (together
“the HORIBA Group” or “HORIBA” as a consolidated group)
implemented measures to enhance our businesses in 2013.
The HORIBA Group promoted business restructuring through
the Corporate & Segment Strategy Division, which was
established in fiscal year 2011 to design and promote overall
business strategy, and accelerated the launch of products
that met market needs.
By business segment, in the Automotive Test System
Segment, the MCT (Mechatronics) business which had been
acquired from Carl Schenck AG (Germany) in 2005 continued
to realize profits thanks to the successful transfer of
production bases and cost reduction. Also, the segment
promoted sales of its new engine emission measurement
systems which began the sales from 2013, a mainstay
HORIBA product.
In the Process & Environmental Instruments & Systems
Segment, the acquisition of the U.S. company Cameron’s
process analysis product line resulted in the business growth
in the oil refining market including shale oil and gas.
In the Medical-Diagnostic Instruments & Systems Segment,
with the aim of responding to growing demand for testing
reagents in various countries, HORIBA completed building its
first reagent plant in India and expanded a reagent plant in
Brazil.
In the Semiconductor Instruments & Systems Segment,
HORIBA STEC Co., Ltd. completed construction of a
technology center in Fukuchiyama, Kyoto, while the company
started to build an advanced technology center in Kyoto city,
Kyoto. These efforts are intended to accelerate the
development speed of semiconductor-related products and
promote efficiency in manufacturing.
The Scientific Instruments & Systems Segment acquired
electron beam technologies of Topcon Corp, which will
accelerate product development by using microscopic
imaging technologies.
Furthermore, HORIBA opened an office in Turkey with the
aim of expanding sales channel in the automotive business.
Moreover in Europe, HORIBA Jobin Yvon S.A.S. in France
implemented the HORIBA Group’s Enterprise Resource
Planning System (GEO System), with the aim of speeding up
its decision making and promoting common operational
processes, and began to use the system in January 2014. On
the financial side, HORIBA issued 15 billion yen of straight
corporate bonds (7 years to maturity; coupon rate, 0.609%
per annum) to gain funds for future capital investment,
working capital, and repaying HORIBA, Ltd. No.3 Unsecured
Straight Bonds.
On the background of the yen’s depreciation, as a result of
47
Financial data
such measures and sales efforts, both of consolidated net
sales and profits increased from a year ago.
Net Sales
In the fiscal year ended December 31, 2013, consolidated net
sales increased by ¥20,526 million, or 17.5%, year-on-year to
¥138,136 million. The average foreign exchange rate applied
in book closings was ¥97.73 to the U.S. dollar, compared
with ¥79.81 for the previous year, and ¥129.78 to the euro,
compared with ¥102.55 for the previous year. Using the
exchange rates for the previous year, consolidated sales for
fiscal 2013 would have been ¥122,486 million. Thus, ¥15,649
million in increased sales can be attributed to the
depreciation of the yen.
Cost of Sales, SG&A Expenses, and Operating Income
Consolidated cost of sales increased by ¥12,405 million to
¥80,625 million. The cost of sales ratio increased by 0.4
percentage points from a year ago to 58.4%, due mainly to
the decline in sales of environmental radiation monitors,
which had seen increased demand after the Great East Japan
Earthquake. Excluding ¥7,176 million from fluctuations in
foreign exchange rates, however, the actual increase in cost
was ¥5,228 million rather than the nominal increase of
¥12,405 million.
Selling, general and administrative (SG&A) expenses
increased by ¥6,139 million from the previous year to ¥43,777
million. The ratio to net sales improved by 0.3 percentage
points to 31.7%, due mainly to the depreciation of the yen,
and a significant increase in sales of mass flow controllers,
which owes to an increased production at semiconductor
production equipment manufacturers, supported by a rise in
capital investment by semiconductor makers. Excluding
¥4,520 million from fluctuations in foreign exchange rates,
however, the actual increase in SG&A expenses was ¥1,618
million rather than the nominal increase of ¥6,139 million.
As a result, consolidated operating income increased by
¥1,981 million, or 16.9%, year-on-year to ¥13,733 million.
The operating income ratio was 9.9%, down 0.1 percentage
points from 10.0% for the previous year.
Business Segments
The operating results of each business segment are
summarized as follows.
(Automotive Test Systems)
In addition to a recovery in capital spending and R&D
spending by automakers in Japan, Europe, and North
America, the yen weakness was attributable to an increase in
sales. However, the profitability of the driving management
systems and drive recorders business deteriorated mainly
due to an increase in development cost of new products and
a drop in orders. Consequently, sales in the segment
increased by 14.6% year-on-year to 49,524 million yen, but
operating income decreased by 2.8% to 4,287 million yen.
(Process & Environmental Instruments & Systems)
The segment sales showed underlying strength on the back
of steady sales of stack gas analyzers for thermal power
plants and an increase in sales of process analysis product
lines which were acquired in February 2013. However, sales
of environmental radiation monitors, which had seen
increased demand after the Great East Japan Earthquake,
declined.
As a result, although sales in the segment rose by 7.3%
year-on-year to 14,711 million yen, operating income
declined by 23.1% to 1,263 million yen.
(Medical-Diagnostic Instruments & Systems)
The segment increased sales, due to steady sales of blood
cell testing instruments in some Asian countries, and the
weaker yen. However, expenses for developing sales
channels in North America increased, which was mainly
because of an increase in selling, general and administrative
expenses. Consequently, sales in the segment increased by
19.8% year-on-year to 26,832 million yen, but operating
income decreased by 2.0% to 2,429 million yen.
48HORIBA Report 2013 |

HORIBA, Ltd. and Consolidated Subsidiaries | Consolidated Financial Review
(Semiconductor Instruments & Systems)
Owing to increased production at semiconductor production
equipment manufacturers supported by a rise in capital
investment by semiconductor makers, sales of mass flow
controllers, the segment’s major product, increased
significantly. As a result, segment sales rose by 35.2%
year-on-year to 24,153 million yen and operating income
soared by 111.7% to 4,815 million yen.
(Scientific Instruments & Systems)
Although sales were higher after yen conversion due to the
weaker yen, sales to universities and government laboratories
decreased due to a reduction in government budgets in
Europe. Consequently, although sales in the segment
increased by 12.3% year-on-year to 22,913 million yen,
operating income declined by 0.6% to 937 million yen.
Net Income
Consolidated operating income increased from a year ago. In
addition, other income (expenses) improved by ¥380 million
from fiscal 2012 to a loss of ¥201 million, mainly due to the
gain on sales of the fixed assets by the transfer of the
headquarter of the subsidiary in the U.S. As a result, pretax
income increased by ¥2,361 million, or 21.1%, to ¥13,532
million, and net income increased by ¥1,603 million, or
21.7%, to ¥8,999 million.
Financial Position
As of December 31, 2013, total consolidated assets were
¥189,269 million, up ¥35,432 million from December 31,
2012. The main factors contributing to the increase of total
assets were an increase in cash and cash equivalents of
¥10,388 million and an increase in trade notes and accounts
receivable of ¥9,890 million.
Total consolidated liabilities increased by ¥20,423 million
from the previous year to ¥74,723 million. The increase in
total liabilities was due mainly to an increase of ¥4,580 million
in trade notes and accounts payable, and ¥5,420 million in
long-term debt. HORIBA, Ltd. No.3 Unsecured Straight
Bonds were assigned under a debt assumption agreement
with financial institutions, to which a transitional measure for
the accounting standard for financial instruments was
applied. Thus, it is treated as having been redeemed.
Total consolidated net assets amounted to ¥114,545 million,
up ¥15,009 million from a year ago, due mainly to an increase
of ¥6,752 million in retained earnings and ¥6,882 million in
foreign currency translation adjustments.
Cash Flows
(Cash Flow from Operating Activities)
Net cash provided by operating activities amounted to
¥15,076 million, compared to ¥13,395 million provided in the
previous year. Factors contributing to this amount included
posting of income before tax and depreciation and
amortization expense.
(Cash Flow from Investing Activities)
Net cash used in investment activities amounted to ¥8,111
million, compared to ¥7,891 million used in the previous year,
due mainly to payments for purchases of property, plant and
equipment.
(Cash Flow from Financing Activities)
Net cash provided by financing activities amounted to ¥2,324
million, compared to ¥3,304 million used in the previous year.
This was mainly attributable to proceeds from issuance of
corporate bonds, despite payments for redemption of
corporate bonds and payments for dividends.
As a result, there was a net increase of ¥10,388 million in
cash and cash equivalents to ¥49,246 million as of December
31, 2013.
Dividend Policy
The Company believes that the distribution of profits to
shareholders is one of its priority issues while giving due
consideration to ensuring a stable management base and
internal reserves for business expansion. Its basic policy
49
Financial data

regarding dividends is to maintain a total shareholder return
ratio of around 30% of consolidated net income of the
Company, combined with the amount of dividend payments
and the amount of share buyback. In addition, The Company
will appropriate internal reserves as basic funds for working
capital for business expansion, capital expenditure,
investment in research and development, and the
reinforcement of the financial strength, making returns to
shareholders through the development of businesses for the
future.
Major Risks
1. Business Risks
(1) Risks Associated with International Business Activities
HORIBA conducts business activities in many countries
around the world, including the U.S and countries in Europe
and Asia. Major risks associated with the entry into these
overseas markets and conducting business there include
sudden shifts in economic conditions or in product supply
and demand, sudden changes in retail prices due to
competition, changes in laws, regulations and tax systems
and social disruptions such as terrorism and war. These risks
could affect HORIBA’s financial position and business results.
To protect against fluctuations in foreign currency exchange
rates, HORIBA promotes local production and supply.
HORIBA also employs foreign exchange forward contracts
within the limits of its transaction amounts of foreign currency
denominated receivables and payables to import and export
transactions to minimize foreign exchange risks. However,
fluctuations in foreign exchange rates could still have an
impact when financial statements prepared in local currencies
are translated into Japanese yen for the consolidated
financial statements, and a major change in foreign exchange
rates beyond our estimates could affect our financial
condition and business performance.
(2) Changes in Performance or Financial Position
Associated with Acquisitions and Alliances
HORIBA has actively promoted corporate acquisitions and
alliances to enhance the efficiency and effectiveness of its
business operations. HORIBA conducts complete and
diligent investigations when making acquisitions and forming
alliances in order to avoid any negative impact on earnings
and cash flows. However, it is possible that HORIBA’s
financial condition and business performance could be
affected if an acquisition or alliance did not proceed in
accordance with initial plans.
(3) Repair of Facilities Following Natural Disasters and
Associated Delays in Delivery, etc.
The HORIBA Group's manufacturing bases are located in
diverse areas, including Japan (Kyoto, Shiga and Kumamoto
Prefectures), Europe (France, Germany and the Czech
Republic), Americas the U.S. and Brazil and Asia (China,
South Korea, and India). However, it is possible that
HORIBA’s financial condition and business performance
could be affected in the case of a major earthquake or other
natural disasters, as HORIBA’s manufacturing facilities could
be damaged and require expensive repairs or an interruption
to HORIBA’s supply chain could affect HORIBA’s production
and/or distribution.
(4) Risks Associated with Contracts and Transactions
HORIBA enters into various contracts with customers,
suppliers and other stakeholders and conducts its business
activities based on these contracts. Nevertheless, there is a
possibility of claims for damages arising from different views
of performance or different understandings of business terms
between parties. It is possible that such circumstances could
result in HORIBA facing a claim for compensation.
(5) Litigation Risks
Arising from HORIBA’s violation of the Antimonopoly Law in
past bidding, HORIBA has received claims for damages from
13 municipal government agencies as of December 31, 2013.
HORIBA found that certain parts of the claims regarding the
scope of the transaction and calculation of the damages
amounts were unacceptable and has decided to ask for
50HORIBA Report 2013 |

HORIBA, Ltd. and Consolidated Subsidiaries | Consolidated Financial Review
judicial relief. Nevertheless, HORIBA has set aside provisions
for possible losses from litigation, and it is possible that the
HORIBA Group’s financial condition and business
performance could be affected depending on the progress of
the litigation.
(6) Other Business Risks
In addition to the above-mentioned risks, other risks include
a risk of breakdown or malfunction of information systems,
threats related to information security and risks associated
with laws and regulations imposed on businesses. HORIBA is
taking preventive measures against these risks but they could
affect HORIBA’s financial position and business results.
2. Risks Associated with Development and Production
(1) Compensation for Product Liability
HORIBA conducts optimum quality control for its products
and services and strives to maintain the highest standards of
reliability. Nevertheless, there is always the possibility of
recalls or litigation arising from unforeseen defects. HORIBA
carries insurance for product liability, but there can be no
guarantee that this insurance would cover the full amount of
any unforeseen damages. Such circumstances could have an
affect on HORIBA’s financial condition and business
performance.
(2) Delays in Development of New Products
The measuring instruments business in which HORIBA
operates is extremely specialized and requires high levels of
technical capability. HORIBA, therefore, invests large sums in
product development. However, it is possible that expected
returns of this investment will not be realized due to
unforeseen circumstances.
(3) Risks Concerning Intellectual Property Rights
HORIBA possesses a wide range of intellectual property
rights related to the products it manufactures, including
patents, trademarks and expertise, which give it superiority in
terms of competitiveness. HORIBA exercises all possible
caution regarding the management and protection of these
intellectual property rights. However, in the case of
infringement by a third party, it is possible that HORIBA will
be unable to attain its expected earnings. There is also a
possibility of disputes over intellectual property rights with
other companies. Such disputes could significantly affect
HORIBA’s financial condition and business performance.
(4) Risks Associated with Fluctuations in Raw Material
Prices
HORIBA takes into account the risk of fluctuations in
purchasing prices and makes arrangements such as advance
purchasing to manage this risk when it is deemed necessary.
However, it may require some time for an increase in
purchasing prices to be passed on and reflected in selling
prices. Such circumstances could significantly affect
HORIBA’s financial condition and business performance.
3. Financial Risks
(1) Shifts in the Market Price of Securities and Other
Assets
HORIBA holds shares in its major alliance partners and other
companies as part of its technology and business strategies
for the future. HORIBA’s acquisitions and sales of investment
securities are carefully inspected by the Board of Directors.
Market prices of the shares are reported to top management
on a timely basis, and the purpose for holding the investment
securities is properly reviewed. If declines in the market price
or profitability of land, buildings or other assets occurred in
the future, there could be a negative impact on the financial
condition and business performance of HORIBA reflected by
the application of impairment accounting.
(2) Reversal of Deferred Tax Assets Resulting From
Changes in Systems or Accounting Policies
It is possible that changes in systems or accounting policies
(e.g., reductions in tax rates) could require HORIBA to reverse
its deferred tax assets at the end of the fiscal year.
51
Financial data

(3) Dissolution of Employees’ Pension Fund
The Kyoto Machinery and Metal Employees’ Pension Fund
(general type), of which the Company and a domestic
consolidated subsidiary are members, resolved to adopt a
policy to carry out a special dissolution at the representative
assembly.
Accordingly, HORIBA plans to post an estimated loss in
association with the dissolution as “Provision for loss on
dissolution of the employees’ pension fund” for fiscal 2014.
However, it expects to be approved for dissolution in early
2018. It is possible that an estimated loss will change, due to
changes in the operating environment for the Fund, and in
case of such as voluntary withdrawals, closures and
bankruptcies of the Fund members other than HORIBA.
4. Risks by Business Segment
HORIBA operates in five business segments: Automotive Test
Systems, Process & Environmental Instruments & Systems,
Medical-Diagnostic Instruments & Systems, Semiconductor
Instruments & Systems and Scientific Instruments & Systems.
HORIBA can achieve balanced growth by overcoming each
segment’s weakness with complementary strengths among
all the business segments. Nevertheless, each business
segment carries risks associated with fluctuations in its
respective operations.
(1) Automotive Test Systems
Emission measurement systems, the main products of the
Automotive Test Systems segment, are used by automobile
manufacturers, automotive component manufacturers and
government agencies. The setting of legal limits on exhaust
emissions affects the demand for these measurement
systems. It is possible, therefore, that the financial condition
and business performance of HORIBA will be significantly
affected by future regulations. Furthermore, capital
expenditures related to shifts in the automation of automotive
test systems could have a significant impact on HORIBA’s
financial condition and business performance.
(2) Process & Environmental Instruments & Systems
Demand for environmental-related products such as
analyzers for air pollution and water quality may be affected
by changes in environmental regulations. Changes in the
demand for these products could have a significant impact
on HORIBA Group’s financial condition and business
performance.
(3) Medical-Diagnostic Instruments & Systems
The main products in the Medical-Diagnostic Instruments &
Systems segment are hematology analyzers, which are small-
and medium-sized equipment used by small- and medium-
sized hospitals and medical practitioners, the target market.
Price competition for these products that is beyond our
expectations could have a significant impact on HORIBA’s
financial condition and business performance.
(4) Semiconductor Instruments & Systems
The main products in this segment are fluid control products
for semiconductor manufacturing processes and products
that support R&D and quality testing by semiconductor
manufacturers. To minimize fluctuations in the semiconductor
market, HORIBA makes efforts to shorten the lead time for
these products and quickly respond to customers’ needs.
Nevertheless, sharp fluctuations in the demand for
semiconductors and the investment of semiconductor
manufacturers could affect the financial condition and
business performance of HORIBA.
(5) Scientific Instruments & Systems
Scientific analysis instruments are the main products of the
Scientific Instruments & Systems segment and are used for
R&D and product quality testing. There is a risk that the
demand for these products could be affected by the R&D
budgets of government agencies and the R&D investment
and production of private enterprises and have a significant
impact on HORIBA Group’s financial condition and business
performance.
52HORIBA Report 2013 |

Consolidated Balance Sheets
Consolidated Balance SheetsHORIBA, Ltd. and Consolidated Subsidiaries Thousands ofFor the years ended December 31, 2012 and December 31, 2013 U.S. dollars
Millions of yen (Note 1)
ASSETS 12/2012 12/2013 12/2013
Current assets:Cash and cash equivalents......................................................................................................................................................................................................................................¥38,858 ¥49,246 $467,273Trade notes and accounts receivable (Note 7)
Affiliated companies...........................................................................................................................................................................................................................................4 25 237Other......................................................................................................................................................................................................................................................37,516 47,386 449,625
Allowance for doubtful receivables.............................................................................................................................................................................................................................(856) (914) (8,672)Marketable securities (Note 5).................................................................................................................................................................................................................................1,501 1,800 17,079Inventories (Note 6)...........................................................................................................................................................................................................................................28,101 33,085 313,929Deferred tax assets (Note 15)..................................................................................................................................................................................................................................2,881 3,186 30,230Other current assets...........................................................................................................................................................................................................................................3,980 6,419 60,907
Total current assets...........................................................................................................................................................................................................................................111,988 140,235 1,330,629Property, plant and equipment:
Land......................................................................................................................................................................................................................................................8,172 9,504 90,179Buildings and structures.......................................................................................................................................................................................................................................24,210 27,688 262,719Machinery, equipment and vehicles..............................................................................................................................................................................................................................12,807 16,175 153,477Construction in progress.......................................................................................................................................................................................................................................1,851 1,763 16,728Other property, plant and equipment............................................................................................................................................................................................................................13,386 14,952 141,873
Total......................................................................................................................................................................................................................................................60,428 70,085 665,006Accumulated depreciation.......................................................................................................................................................................................................................................(32,249) (36,758) (348,780)
Net property, plant and equipment..............................................................................................................................................................................................................................28,179 33,326 316,215Investments and other noncurrent assets:
Investment securities (Note 5).................................................................................................................................................................................................................................3,977 5,984 56,779Investments in nonconsolidated subsidiaries and affiliates.....................................................................................................................................................................................................67 105 996Deferred tax assets (Note 15)..................................................................................................................................................................................................................................2,030 1,750 16,604Allowance for doubtful accounts................................................................................................................................................................................................................................(74) (45) (426)Other investments and other assets.............................................................................................................................................................................................................................3,176 2,801 26,577
Total......................................................................................................................................................................................................................................................9,178 10,597 100,550Intangibles:
Goodwill (Note 20)......................................................................................................................................................................................................................................................319 314 2,979Software......................................................................................................................................................................................................................................................3,488 3,054 28,978Other intangibles..............................................................................................................................................................................................................................................681 1,741 16,519
Total......................................................................................................................................................................................................................................................4,490 5,110 48,486Total assets...................................................................................................................................................................................................................................................¥153,836 ¥189,269 $1,795,891
LIABILITIES AND NET ASSETSCurrent liabilities:
Short-term loans (Note 8)......................................................................................................................................................................................................................................¥4,300 ¥5,534 $52,509Current portion of long-term debt (Note 8).....................................................................................................................................................................................................................1,388 1,229 11,661Trade notes and accounts payable:
Affiliated companies...........................................................................................................................................................................................................................................- - -Other......................................................................................................................................................................................................................................................11,829 16,409 155,697
Accounts payable - other.......................................................................................................................................................................................................................................9,195 12,112 114,925Accrued income taxes...........................................................................................................................................................................................................................................1,317 3,523 33,428Deferred tax liabilities (Note 15).............................................................................................................................................................................................................................6 87 825Accrued bonuses to employees...................................................................................................................................................................................................................................902 905 8,587Accrued bonuses to directors and corporate auditors.................................................................................................................................38 56 531Reserve for product warranty...................................................................................................................................................................................................................................1,176 1,492 14,156Other current liabilities......................................................................................................................................................................................................................................7,504 10,786 102,343
Total current liabilities......................................................................................................................................................................................................................................37,662 52,138 494,714Long-term liabilities:
Long-term debt (Note 8) .......................................................................................................................................................................................................................................12,394 17,814 169,029Deferred tax liabilities (Note 15).............................................................................................................................................................................................................................153 659 6,252Employees' retirement benefits (Note 9)........................................................................................................................................................................................................................2,066 2,406 22,829Directors' and corporate auditors' retirement benefits......................................................................................................................................195 - -Provision for compensation losses..............................................................................................................................................................................................................................457 158 1,499Other noncurrent liabilities...................................................................................................................................................................................................................................1,370 1,546 14,669
Total long-term liabilities......................................................................................................................................................................................................................................16,637 22,585 214,299Total liabilities..............................................................................................................................................................................................................................................54,299 74,723 709,014
Contingent liabilities (Note 13)Net assets (Note 10):Shareholders' equity:
Common stock...................................................................................................................................................................................................................................................12,011 12,011 113,967Authorized - 100,000,000 sharesIssued and outstanding - 42,297,169 shares (excluding treasury stock) at 12/2012Issued and outstanding - 42,301,569 shares (excluding treasury stock) at 12/2013
Capital surplus................................................................................................................................................................................................................................................18,717 18,717 177,597Retained earnings..............................................................................................................................................................................................................................................71,725 78,477 744,634Treasury stock - 235,583 shares at 12/2012 and 231,183 shares at 12/2013.................................................................................................................................................................................................................................................(780) (765) (7,258)
Total shareholders' equity.........................................................................................................................................................................................................................................101,674 108,441 1,028,949Accumulated other comprehensive income:
Unrealized gains (losses) on available-for-sale securities.....................................................................................................................................................................................................................987 2,296 21,785Deferred gains or losses on hedges (Note 14)...................................................................................................................................................................................................................- 3 28Foreign currency translation adjustments.......................................................................................................................................................................................................................(3,413) 3,468 32,906
Total accumulated other comprehensive income....................................................................................................................................................................................................................(2,426) 5,768 54,730Subscription rights to shares (Note 11)..................................................................................................................................................................................................................................245 335 3,178Minority interests in consolidated subsidiaries...................................................................................................................................42 0 0
Total net assets.....................................................................................................................................................................................................................................................99,536 114,545 1,086,867Total liabilities and net assets...............................................................................................................................................................................................................................¥153,836 ¥189,269 $1,795,891
See the notes to the consolidated financial statements.
53
Financial data

Consolidated Statements of Income
Consolidated Statements of IncomeHORIBA, Ltd. and Consolidated Subsidiaries Thousands ofFor the years ended December 31, 2012 and December 31, 2013 U.S. dollars
(Note 1)12/2012 12/2013 12/2013
Net sales (Note 20)............................................................................................................................................................................................................................................¥117,609 ¥138,136 $1,310,712
Operating costs and expenses (Note 20):Cost of sales..................................................................................................................................................................................................................................................68,220 80,625 765,015Selling, general and administrative expenses...................................................................................................................................................................................................................37,637 43,777 415,380
Total operating costs and expenses.............................................................................................................................................................................................................................105,857 124,402 1,180,396
Operating income (Note 20).....................................................................................................................................................................................................................................11,751 13,733 130,306
Other income (expenses):Interest and dividend income...................................................................................................................................................................................................................................312 294 2,789Interest expense...............................................................................................................................................................................................................................................(478) (560) (5,313)Foreign exchange gains (losses), net...........................................................................................................................................................................................................................(206) (274) (2,599)Gain on sales of property, plant and equipment..................................................................................................................................................................................................................31 431 4,089Loss on sales of property, plant and equipment..................................................................................................................................................................................................................(0) (7) (66)Loss on disposal of property, plant and equipment..............................................................................................................................................................................................................(143) (65) (616)Impairment loss (Note 16)................................................................................................................................................................................................................(135) (190) (1,802)Gain on sales of investment securities (Note 5).........................................................................................................................................................................................................................- 17 161 Loss on valuation of investment securities (Note 5)....................................................................................................................................................................................................................(2) (15) (142)Gain on sales of subsidiaries and affiliates' stocks................................................................................................................................................................................................................- 67 635Subsidy income...................................................................................................................................................................................................................55 70 664 Reversal of provision for compensation losses..............................................................................................................................................................................67 173 1,641Gain on bargain purchase (Note 20)............................................................................................................................................................................- 64 607Other, net.....................................................................................................................................................................................................................................................(81) (206) (1,954)
Total other expenses, net......................................................................................................................................................................................................................................(581) (201) (1,907)
Income before income taxes and minority interests.....................................................................................................................................................................................................................................11,170 13,532 128,399
Income taxes (Note 15):Current......................................................................................................................................................................................................................................................3,236 4,280 40,611Deferred......................................................................................................................................................................................................................................................538 299 2,837
Total income taxes.............................................................................................................................................................................................................................................3,774 4,580 43,457
Income before minority interests...........................................................................................................................................................................................7,395 8,951 84,932
Minority interests in earnings (losses) of consolidated subsidiaries...........................................................................................................................................................................................(0) (47) (445)
Net income ..............................................................................................................................................................................................................................................¥7,396 ¥8,999 $85,387
U.S. dollars
(Note 1)12/2012 12/2013 12/2013
Per share information:Net income - basic............................................................................................................................................................................................................................¥174.87 ¥212.76 $2.01Net income - diluted............................................................................................................................................................................................................................174.37 212.01 2.01Cash dividends............................................................................................................................................................................................................................50.00 60.00 0.56
Consolidated Statements of Comprehensive IncomeHORIBA, Ltd. and Consolidated Subsidiaries
For the years ended December 31, 2012 and December 31, 2013 Thousands of U.S. dollars
(Note 1)
12/2012 12/2013 12/2013Income before minority interests ¥7,395 ¥8,951 $84,932Other comprehensive income (Note 19)
Unrealized gains (losses) on available-for-sale securities.................................................................................................................................................................270 1,308 12,411Deferred gains or losses on hedges.................................................................................................................................................................- 3 28Foreign currency translation adjustments..........................................................................................................................................................3,297 6,896 65,433Share of other comprehensive income of affiliates accounted for using equity method....................................... (2) (8) (75)Total other comprehensive income..................................................................................................................................................................3,565 8,199 77,796
Comprehensive income ¥10,960 ¥17,151 $162,738Total comprehensive income attributable to
Owners of the parent.............................................................................................................................................................................................................................10,956 ¥17,193 $163,136Minority interests...............................................................................................................................................................................................................................4 (42) (398)
See the notes to the consolidated financial statements.
Millions of yen
Yen
Millions of yen
54HORIBA Report 2013 |

Consolidated Statements of Changes in Net Assets
Consolidated Statements of Changes in Net AssetsHORIBA, Ltd. and Consolidated Subsidiaries Thousands ofFor the years ended December 31, 2012 and December 31, 2013 U.S. dollars
(Note 1)12/2012 12/2013 12/2013
Shareholders' equityCommon stock
Balance at beginning of current fiscal year.................................................................................................................................................................................................................................¥12,011 ¥12,011 $113,967Balance at end of current fiscal year.......................................................................................................................................................................................................................................¥12,011 ¥12,011 $113,967
Capital surplusBalance at beginning of current fiscal year.................................................................................................................................................................................................................................¥18,717 ¥18,717 $177,597Balance at end of current fiscal year.......................................................................................................................................................................................................................................¥18,717 ¥18,717 $177,597
Retained earningsBalance at beginning of current fiscal year.................................................................................................................................................................................................................................¥66,278 ¥71,725 $680,567Changes in items during the period:
Cash dividends.................................................................................................................................................................................................................................................(1,945) (2,241) (21,263)Net income.....................................................................................................................................................................................................................................................7,396 8,999 85,387Disposal of treasury stock.....................................................................................................................................................................................................................................(3) (5) (47)Total...................................................................................................................................................................................................................................5,446 6,752 64,066
Balance at end of current fiscal year.......................................................................................................................................................................................................................................¥71,725 ¥78,477 $744,634
Treasury stockBalance at beginning of current fiscal year.................................................................................................................................................................................................................................(¥788) (¥780) ($7,401)Changes in items during the period:
Disposal of treasury stock.....................................................................................................................................................................................................................................8 14 132Total...................................................................................................................................................................................................................................8 14 132
Balance at end of current fiscal year.......................................................................................................................................................................................................................................(¥780) (¥765) ($7,258)
Shareholders' equity, totalBalance at beginning of current fiscal year.................................................................................................................................................................................................................................¥96,219 ¥101,674 $964,740Changes in items during the period:
Cash dividends.................................................................................................................................................................................................................................................(1,945) (2,241) (21,263)Net income.....................................................................................................................................................................................................................................................7,396 8,999 85,387Disposal of treasury stock.....................................................................................................................................................................................................................................4 9 85Total...................................................................................................................................................................................................................................5,455 6,766 64,199
Balance at end of current fiscal year.......................................................................................................................................................................................................................................¥101,674 ¥108,441 $1,028,949
Accumulated other comprehensive incomeUnrealized gains (losses) on available-for-sale securities
Balance at beginning of current fiscal year.................................................................................................................................................................................................................................¥717 ¥987 $9,365Changes in items during the period:
Net changes in items other than shareholders' equity..............................................................................................................................................................................................270 1,308 12,411Total...................................................................................................................................................................................................................................270 1,308 12,411
Balance at end of current fiscal year.......................................................................................................................................................................................................................................¥987 ¥2,296 $21,785
Deferred gains or losses on hedgesBalance at beginning of current fiscal year.................................................................................................................................................................................................................................- - -Changes in items during the period:
Net changes in items other than shareholders' equity..............................................................................................................................................................................................- 3 28Total...................................................................................................................................................................................................................................- 3 28
Balance at end of current fiscal year.......................................................................................................................................................................................................................................- ¥3 $28
Foreign currency translation adjustments Balance at beginning of current fiscal year.................................................................................................................................................................................................................................(¥6,703) (¥3,413) ($32,384)Changes in items during the period:
Net changes in items other than shareholders' equity..............................................................................................................................................................................................3,289 6,882 65,300Total...................................................................................................................................................................................................................................3,289 6,882 65,300
Balance at end of current fiscal year.......................................................................................................................................................................................................................................(¥3,413) ¥3,468 $32,906
Accumulated other comprehensive income, totalBalance at beginning of current fiscal year.................................................................................................................................................................................................................................(¥5,986) (¥2,426) ($23,019)Changes in items during the period:
Net changes in items other than shareholders' equity..............................................................................................................................................................................................3,560 8,194 77,749Total...................................................................................................................................................................................................................................3,560 8,194 77,749
Balance at end of current fiscal year.......................................................................................................................................................................................................................................(¥2,426) ¥5,768 $54,730
Subscription rights to sharesBalance at beginning of current fiscal year.................................................................................................................................................................................................................................¥186 ¥245 $2,324Changes in items during the period:
Net changes in items other than shareholders' equity..............................................................................................................................................................................................58 90 853Total...................................................................................................................................................................................................................................58 90 853
Balance at end of current fiscal year.......................................................................................................................................................................................................................................¥245 ¥335 $3,178
Minority interests in consolidated subsidiariesBalance at beginning of current fiscal year.................................................................................................................................................................................................................................¥40 ¥42 $398Changes in items during the period:
Net changes in items other than shareholders' equity..............................................................................................................................................................................................2 (42) (398)Total...................................................................................................................................................................................................................................2 (42) (398)
Balance at end of current fiscal year.......................................................................................................................................................................................................................................¥42 ¥0 $0
Net assets, totalBalance at beginning of current fiscal year.................................................................................................................................................................................................................................¥90,460 ¥99,536 $944,453Changes in items during the period:
Cash dividends.................................................................................................................................................................................................................................................(1,945) (2,241) (21,263)Net income.....................................................................................................................................................................................................................................................7,396 8,999 85,387Disposal of treasury stock.....................................................................................................................................................................................................................................4 9 85Net changes in items other than shareholders' equity..............................................................................................................................................................................................3,621 8,242 78,204Total...................................................................................................................................................................................................................................¥9,076 ¥15,009 $142,413
Balance at end of current fiscal year.......................................................................................................................................................................................................................................¥99,536 ¥114,545 $1,086,867
See the notes to the consolidated financial statements.
Millions of yen
55
Financial data

Consolidated Statements of Cash Flows
Consolidated Statements of Cash FlowsHORIBA, Ltd. and Consolidated Subsidiaries Thousands ofFor the years ended December 31, 2012 and December 31, 2013 U.S. dollars
(Note 1)12/2012 12/2013 12/2013
Cash flows from operating activities:Income before income taxes and minority interests.....................................................................................................................................................................................................................................¥11,170 ¥13,532 $128,399Adjustments to reconcile income before income taxes and minority interests to net cash provided by operating activities:
Depreciation and amortization..................................................................................................................................................................................................................................3,743 4,279 40,601Impairment loss............................................................................................................................................................................................................................. 135 190 1,802Increase (decrease) in allowance for doubtful receivables......................................................................................................................................................................................................55 (160) (1,518)Increase (decrease) in provision for business structure improvement...........................................................................................................................................................................................(177) - -Increase (decrease) in employees' retirement benefits..........................................................................................................................................................................................................186 104 986Increase (decrease) in directors' and corporate auditors' retirement benefits ................................................................................................................................................................................(26) (195) (1,850)Increase (decrease) in provision for compensation losses.......................................................................................................................................................................................................(159) (299) (2,837)Interest and dividend income...................................................................................................................................................................................................................................(312) (294) (2,789)Interest expense...............................................................................................................................................................................................................................................478 560 5,313Foreign exchange losses (gains)................................................................................................................................................................................................................................13 (17) (161)Loss (gain) on sales of property, plant and equipment...........................................................................................................................................................................................................................(30) (424) (4,023)Loss on disposal of property, plant and equipment...............................................................................................................................................................................................................................143 65 616Loss (gain) on valuation of investment securities..............................................................................................................................................................................................................2 15 142Loss (gain) on sales of investment securities..................................................................................................................................................................................................................- (17) (161)Decrease (increase) in trade notes and accounts receivable.....................................................................................................................................................................................................4,133 (4,222) (40,060)Decrease (increase) in inventories.............................................................................................................................................................................................................................40 (630) (5,977)Increase (decrease) in trade notes and accounts payable........................................................................................................................................................................................................(2,345) 1,989 18,872Other, net..................................................................................................................................................................................................................................................... 1,417 3,209 30,448
Subtotal......................................................................................................................................................................................................................................................18,468 17,684 167,795Interest and dividends received................................................................................................................................................................................................................................305 289 2,742Interest paid.................................................................................................................................................................................................................................................. (499) (591) (5,607)Income taxes (paid) refund..............................................................................................................................................................................................................................................(4,879) (2,307) (21,890)
Net cash provided by (used in) operating activities............................................................................................................................................................................................................13,395 15,076 143,049
Cash flows from investing activities:Increase in time deposits......................................................................................................................................................................................................................................(2,410) (2,363) (22,421)Decrease in time deposits......................................................................................................................................................................................................................................2,410 1,505 14,280Decrease in time deposits restricted for use...................................................................................................................................................................................................................32 32 303 Payments for purchase of marketable securities.................................................................................................................................................................................................................(2,904) (2,404) (22,810)Proceeds from sales or redemption of marketable securities...................................................................................................................................................................................................................2,509 2,103 19,954Payments for purchase of property, plant and equipment.........................................................................................................................................................................................................(6,741) (6,040) (57,310)Proceeds from sales of property, plant and equipment...........................................................................................................................................................................................................79 870 8,255Payments for purchase of intangibles..........................................................................................................................................................................................................................(712) (1,535) (14,564)Payments for purchase of investment securities.................................................................................................................................................................................................................(147) (23) (218)Proceeds from sales or redemption of investment securities.....................................................................................................................................................................................................7 32 303Payments for purchase of stocks of subsidiaries and affiliates...............................................................................................................................................................................................(18) - -Proceeds from sales of stocks of subsidiaries and affiliates...............................................................................................................................................................................................- 77 730Payments for transfer of business.....................................................................................................................................................................................................................................................- (322) (3,055)Other, net..................................................................................................................................................................................................................................................... 3 (45) (426)
Net cash provided by (used in) investing activities............................................................................................................................................................................................................(7,891) (8,111) (76,961)
Cash flows from financing activities:Proceeds from issuance of corporate bonds................................................................................................................................................................................................................................- 14,919 141,559Payments for redemption of corporate bonds......................................................................................................................................................................................................................- (10,106) (95,891)Net increase (decrease) in short-term borrowings...............................................................................................................................................................................................................(2,395) 185 1,755Increase in long-term debt.....................................................................................................................................................................................................................................1,827 1,285 12,192Repayments of long-term debt...................................................................................................................................................................................................................................(635) (1,534) (14,555)Repayments on finance lease obligations.................................................................................................................................................................................. (156) (183) (1,736)Net decrease (increase) of treasury stock......................................................................................................................................................................................................................0 0 0Cash dividends paid............................................................................................................................................................................................................................................(1,943) (2,242) (21,273)
Net cash provided by (used in) financing activities............................................................................................................................................................................................................(3,304) 2,324 22,051
Effect of exchange rate changes on cash and cash equivalents...................................................................................................................................................................................................891 1,098 10,418Net increase (decrease) in cash and cash equivalents...........................................................................................................................................................................................................3,090 10,388 98,567Cash and cash equivalents at beginning of year.................................................................................................................................................................................................................35,767 38,858 368,706Cash and cash equivalents at end of year.......................................................................................................................................................................................................................¥38,858 ¥49,246 $467,273
See the notes to the consolidated financial statements.
Millions of yen
56HORIBA Report 2013 |

1. Basis of presenting consolidated financial statements
The accompanying consolidated financial statements of
HORIBA, Ltd. (“the Company”) have been prepared in
accordance with the provisions set forth in the Japanese
Financial Instruments and Exchange Law and its related
accounting regulations and in conformity with accounting
principles generally accepted in Japan (“Japanese GAAP”),
which are different in certain respects as to application and
disclosure requirements from International Financial
Reporting Standards.
The accounts of the consolidated overseas subsidiaries
have been prepared in accordance with either International
Financial Reporting Standards or U.S. generally accepted
accounting principles, with adjustments for the five
specified items as applicable. The accompanying
consolidated financial statements have been restructured
and translated into English, with some expanded
descriptions, from the consolidated financial statements of
the Company prepared in accordance with Japanese GAAP
and filed with the appropriate Local Finance Bureau of the
Ministry of Finance as required by the Japanese Financial
Instruments and Exchange Law. Some supplementary
information included in the statutory Japanese language
consolidated financial statements, but not required for fair
presentation, is not presented in the accompanying
consolidated financial statements.
At the shareholders’ meetings of the Company’s domestic
consolidated subsidiaries, held in March 2013, a resolution
was made to abolish a program of retirement benefits for
directors and corporate auditors. As it has been decided to
pay directors and corporate auditors the equivalent amount
of their retirement benefits of 201 million yen when each of
them would retire from his position, the retirement benefits
for directors and corporate auditors were drawn down and
included in “Other noncurrent liabilities.”
Following a review of the risk management policy,
HORIBA applies the hedge accounting method to a portion
of scheduled foreign currency-denominated transactions
from fiscal 2013.
Yen amounts are rounded down to the nearest million.
Therefore, total or subtotal amounts do not necessarily
correspond with the aggregate of such account balances.
The translation of the Japanese yen amounts into U.S.
dollar amounts is included solely for the convenience of
readers outside Japan, using the prevailing exchange rate
at December 31, 2013, which was ¥105.39 to U.S. $1.00.
The translations should not be construed as
representations that the Japanese yen amounts have been,
could have been or could in the future be converted into
U.S. dollars at this or any other rate of exchange. The U.S.
dollars amounts are then rounded down to the nearest
thousand.
Certain prior year amounts have been reclassified to
conform to the current year's presentation.
2. Summary of significant accounting policies
(a) Principles of consolidation
The consolidated financial statements include the accounts
of the Company and 37 (36 in fiscal 2012) of its subsidiaries
(“HORIBA” as a consolidated group). In fiscal 2013, one
company was newly incorporated.
The accompanying consolidated financial statements
include the accounts of the Company and significant
companies over which the Company has control through
majority voting rights or certain other conditions evidencing
control by the Company. Significant intercompany
transactions and accounts have been eliminated in
consolidation. In the elimination of investments in
subsidiaries, the assets and liabilities of the subsidiaries,
including the portions attributable to minority shareholders,
are evaluated using the fair value at the time the Company
acquired control of the respective subsidiary. Acquisition
costs that are in excess of the net assets of acquired
subsidiaries and affiliates and cannot be assigned to
specific individual accounts are amortized on a straight-line
basis over five years.
December 31 is the year-end of the consolidated
subsidiaries and that of the consolidated financial
HORIBA, Ltd. and Consolidated Subsidiaries | Note to Consolidated Financial Statements
57
Financial data

statements for fiscal 2012 and fiscal 2013.
Two of the Company’s subsidiaries are not included in the
consolidated accounts as the effect of their inclusion on
total assets, sales, income and retained earnings would
have been immaterial.
For one of the two nonconsolidated subsidiaries, the
equity method was applied.
The Company has two affiliated companies (four in fiscal
2012). Investments in the affiliates (generally 20%-50%
ownership) and in one nonconsolidated subsidiary were
accounted for on a cost basis, not by the equity method,
as the effect on income and retained earnings was
immaterial.
(b) Cash and cash equivalents
Cash and cash equivalents include cash on hand, readily
available bank deposits and short-term highly liquid
investments that are readily convertible into cash, have
insignificant risk of change in value and have original
maturities of three months or less from date of purchase.
(c) Securities
Available-for-sale securities with available fair market
values are stated at fair market value. Unrealized gains and
losses on these securities are reported, net of applicable
income taxes, as a separate component of net assets.
Realized gains and losses on the sale of such securities are
computed using moving average cost. Available-for-sale
securities with no available fair market value are stated
mainly at moving average cost.
(d) Inventories
Inventories are stated at the lower of average cost or net
realizable value. Cost is determined principally by the
weighted average method for merchandise, finished goods
and work-in-process and by the moving average method
for raw materials and supplies.
(e) Property, plant and equipment and depreciation
(except for leases)
Property, plant and equipment are stated at cost.
Depreciation is computed by the straight-line method over
the estimated useful life of the asset. The estimated useful
lives of buildings and structures range from 3 to 60 years
and those of machinery, equipment and vehicles from 2 to
18 years.
(f) Goodwill
Goodwill, which represents the excess of the purchase
price over the fair value of the net assets acquired, is
amortized on a straight-line basis over a period of five
years.
(g) Software
Amortization of computer software used by HORIBA is
computed by the straight-line method over the estimated
useful life of 3 to 10 years.
(h) Leases
With regard to leased assets under finance leases other
than those that are deemed to transfer ownership of the
leased property to the lessee, the lease term is deemed to
be the useful life, and depreciation is computed by the
straight-line method over the lease term with zero residual
value. Finance leases other than those that are deemed to
transfer ownership of the leased property to the lessee and
which commenced in fiscal years beginning prior to
January 1, 2009 continue to be accounted for in a way that
is similar to the method used for operating leases.
(i) Allowance for doubtful receivables
The Company and its domestic subsidiaries provide for
doubtful accounts principally at an amount computed
based on the actual ratio of bad debts in the past plus the
estimated uncollectible amounts of certain individual
receivables. The overseas subsidiaries provide for doubtful
accounts based on estimates made by management.
(j) Accrued bonuses to employees
Accrued bonuses to employees are provided for the
expected payment of employee bonuses for fiscal 2013 to
those employees employed at the end of the fiscal year.
(k) Accrued bonuses to directors and corporate auditors
Some consolidated subsidiaries provide for accrued
bonuses to directors and corporate auditors for the
expected payment of director and corporate auditor
bonuses for fiscal 2013 to those directors and corporate
58HORIBA Report 2013 |

auditors serving at the end of the fiscal year.
(l) Reserve for product warranty
The reserve for product warranty is provided for accrued
warranty expenses for products of the Company and
certain subsidiaries. The provision is based on estimates
made from actual past experience and product warranty
records and takes into account individual cases.
(m) Retirement benefits and pension plans
The Company and some consolidated subsidiaries provide
for employees’ severance and retirement benefits based on
estimated amounts of projected benefit obligation and the
fair value of plan assets.
Actuarial gains and losses are recognized in expenses
using the straight-line method over a fixed term of years (5
to 8 years), which is within the average of the estimated
remaining service years of employees, commencing with
the following period. In the Company and some domestic
consolidated subsidiaries, prior service costs are
recognized in expenses using the straight-line method over
a fixed term of years (10 years), which is within the average
of the estimated remaining service years of employees,
commencing in the period they arise. In some consolidated
subsidiaries, they are expensed as incurred.
(n) Provision for compensation losses
Provision is made for potential losses arising from paying
compensation for damages. It is provided for potential
compensation for damages to local public agencies and
litigation expenses that can be associated with an
infringement of the Antimonopoly Law.
(o) Sales and costs of completed construction
Sales and costs of completed construction were recorded
using the percentage of completion method when the
progress of the construction up to the end of fiscal 2013
was deemed to be certain (estimates of the ratio of
completion of construction work are based on the cost-to-
cost method). In the case of other construction, sales and
costs were recorded using the completed contract method.
(p) Foreign currency translation
Short-term and long-term receivables and payables in
foreign currencies are translated into Japanese yen based
on exchange rates at the balance sheet date.
Balance sheet accounts of consolidated foreign
subsidiaries are translated into Japanese yen at the
balance sheet date, except for shareholders’ equity
accounts, which are translated at historical rates. Revenue
and expense accounts of consolidated foreign subsidiaries
are translated into Japanese yen at average annual
exchange rates. Differences arising from the application of
the process stated above are presented separately in the
consolidated financial statements in “Foreign currency
translation adjustments” and “Minority interests in
consolidated subsidiaries” in net assets.
(q) Derivatives
Derivative financial instruments are stated at fair value, and
changes in the fair value are recognized as gains or losses,
unless the derivative financial instruments are used for
hedging purposes. HORIBA uses foreign currency
exchange contracts to manage risk related to its importing
and exporting activities. Regarding derivative transactions,
in addition to conducting exchange agreement transactions
within the limit of the balance of foreign currency-
denominated receivables and payables, HORIBA conducts
forward exchange agreement transactions for the expected
foreign currency-denominated receivables and payables,
which would be generated with certainty by scheduled
export or import trading. HORIBA also uses interest rate
swap contracts to avoid the risk of rising interest rates.
Contracts are entered into and controlled by the finance
department, which reports results to the director.
Transactions involving derivative contracts are limited to
highly rated banking institutions, and HORIBA considers
that there are no material credit risks associated with them.
(r) Hedge accounting
i) Hedge accounting method
Deferred hedge accounting is applied.
ii) Hedging instruments and hedged items
Hedging instruments: Forward foreign exchange contracts,
etc.
HORIBA, Ltd. and Consolidated Subsidiaries | Note to Consolidated Financial Statements
59
Financial data

Hedged items: Foreign currency-denominated forecast
transactions
iii) Hedging policy
Forward foreign exchange transactions are used to avoid
foreign currency risks, based on the Company’s
Administrative Rules.
iv) Assessment of hedge effectiveness
The effectiveness of hedges is assessed by comparing the
cumulative change of cash flows of both hedging
instruments and corresponding hedged items. However,
the assessment of effectiveness is not conducted for
forward foreign exchange contracts as the significant
conditions of both hedging instruments and corresponding
hedged items are the same.
(s) Research and development expenses
Research and development expenses are charged to
income when incurred. Research and development
expenses charged to income for fiscal 2012 and fiscal 2013
were ¥10,092 million and ¥10,774 million ($102,229
thousand), respectively.
(t) Income taxes
Income taxes comprise corporate tax, enterprise tax and
prefectural and municipal inhabitant taxes.
HORIBA recognizes the tax effects of loss carryforwards
and the temporary differences between the carrying
amounts of assets and liabilities for tax and financial
reporting. The provision for current income tax is computed
based on the pretax income included in the consolidated
statements of income.
The asset/liability approach is used to recognize deferred
tax assets and liabilities for the expected future tax
consequences of temporary differences between the
carrying amounts of assets and liabilities for financial
reporting purposes and the amounts used for income tax
purposes.
The Company and its consolidated domestic subsidiaries
have adopted the consolidated taxation system.
(u) Per share information
The computations of net income per share are based on
the weighted average number of shares of common stock
outstanding during each period. The weighted average
number of shares of common stock used in the
computation for fiscal 2012 and fiscal 2013 was 42,297
thousand and 42,299 thousand, respectively. Diluted net
income per share of common stock assumes full conversion
of dilutive convertible bonds at the beginning of the year or
at the later date of issuance, with an applicable adjustment
for related interest expense, net of tax and dilutive stock
option plans. The weighted average number of shares used
in the computation for fiscal 2012 and fiscal 2013 was
42,418 thousand and 42,448 thousand, respectively.
Cash dividends per share shown in the consolidated
statements of income represent actual amounts applicable
to earnings in the respective fiscal year, including dividends
to be paid after the end of the period.
3. Accounting standards issued but not yet effective
“Accounting Standard for Retirement Benefits” (ASBJ
Statement No. 26, issued on May 17, 2012) and “Guidance
on Accounting Standard for Retirement Benefits” (ASBJ
Guidance No. 25, issued on May 17, 2012)
(a) Overview
With a viewpoint of improving financial reporting and in
consideration of international trends, application of these
accounting standards is intended to improve the
accounting method for actuarial gains and losses and past
service costs that are yet to be recognized and the method
of calculation for retirement benefit obligations and service
cost and to expand disclosure.
(b) Date of application
HORIBA will apply this accounting standard effective from
the end of fiscal year beginning on or after January 1, 2014.
(c) Effect of applying these accounting standards
HORIBA is currently evaluating the effect of applying these
accounting standards on its consolidated financial
statements.
60HORIBA Report 2013 |

HORIBA, Ltd. and Consolidated Subsidiaries | Note to Consolidated Financial Statements
4. Financial instruments(1) Overview of financial instrumentsManagement policy
Financial instruments, risks and risk management
Supplementary explanation of the estimated fair value of financial instruments
(2) Fair value of financial instruments
Millions of yen Millions of yen12/2012 12/2013
Assets:(1) Cash and time deposits..................................................................................¥34,685 ¥34,685 - ¥42,228 ¥42,228 -(2) Trade notes and accounts receivable..................................................................................37,521 37,521 - 47,412 47,412 -(3) Marketable securities and investment securities
Available-for-sale securities..................................................................................9,931 9,931 - 16,127 16,127 -Total................................................................................................................................................¥82,138 ¥82,138 - ¥105,767 ¥105,767 -
Liabilities:(1) Trade notes and accounts payable..................................................................................¥11,829 ¥11,829 - ¥16,409 ¥16,409 -(2) Short-term loans..................................................................................................................5,523 5,523 - 6,606 6,606 -(3) Accounts payable - other.................................................................................................9,195 9,195 - 12,112 12,112 -(4) Accrued income taxes......................................................................................................1,317 1,317 - 3,523 3,523 -(5) Bonds................................................................................................................................10,000 10,239 239 15,000 14,891 (108)(6) Long-term loans..................................................................................................................2,113 2,145 32 2,576 2,477 (99)
Total.....................................................................................................................................................¥39,979 ¥40,251 ¥272 ¥56,229 ¥56,021 (¥207)
Derivative transactions(1) Hedge accounting not applied..................................................................................(¥190) (¥190) - (¥188) (¥188) -(2) Hedge accounting applied......................................................... - - - 5 5 -
Total.....................................................................................................................................................(¥190) (¥190) - (¥182) (¥182) -
Trade liabilities and loans are exposed to liquidity risk, but HORIBA endeavors to reduce this risk by using methods such asthe preparation of cash flow plans.
Regarding derivative transactions, in addition to conducting exchange agreement transactions within the limit of the balanceof foreign currency-denominated receivables and payables, HORIBA conducts forward exchange agreement transactions for theexpected foreign currency-denominated receivables and payables, which would be generated with certainty by scheduled exportor import trading. HORIBA conducts interest rate swap transactions aimed at avoiding interest rate fluctuation risk within thelimit of the balance of borrowings. HORIBA's policy is not to engage in speculative transactions.
HORIBA carries out fund management with an emphasis on security and procures funds mainly through bank borrowings andbond issuances. Derivatives are used to manage foreign exchange fluctuation risk and interest rate fluctuation risk, and it isHORIBA's policy not to engage in speculative transactions.
Notes receivable and accounts receivable, which are operating receivables, are exposed to the credit risk of customers.HORIBA endeavors to reduce this risk by conducting due date control and balance control and by attempting to promptlyrecognize collection concerns stemming from such factors as a deterioration in the financial condition of a customer.
Some operating receivables and payables are denominated in foreign currencies and are exposed to foreign exchangefluctuation risk. However, HORIBA endeavors to reduce this risk by offsetting foreign currency denominated operatingreceivables and payables and by using forward exchange contracts, etc.
Marketable securities are mainly short-term investments with high liquidity such as negotiable deposits. Investment securitiesare mainly shares of companies that have a business relationships with HORIBA and are exposed to market value fluctuationrisk. However, when acquiring or selling shares of a certain value, the Board of Directors considers the details of thetransactions and HORIBA endeavors to reduce any risk by ensuring that the market value information regarding the shares isreported to the management team in a timely manner.
Short-term loans are mainly for financing related to operating transactions, while long-term loans and corporate bonds aremainly for financing related to plant and equipment and working capital.
Most notes payable and accounts payable, which are operating payables, have payment due dates within one year.
The market value of financial instruments includes values based on market prices and amounts rationally calculated when thereare no market prices available. As HORIBA incorporates variable factors when making these calculations, the amounts maychange due to the adoption of different assumptions. With regard to contract amounts related to derivative transactions in theNotes to Consolidated Financial Statements item "Derivative transactions," the amounts do not indicate the market riskassociated with derivative transactions themselves.
Fair valueFair value DifferenceBook value Book valueDifference
The book value and fair value of financial instruments and any difference between the two as of December 31, 2012 and December31, 2013 are set forth in the table below. Financial instruments whose fair value was extremely difficult to estimate are not included(See Note 2).
61
Financial data

Thousands of U.S. dollars12/2013
Assets:(1) Cash and time deposits..................................................................................................................................................................................................................................................................................................$400,683 $400,683 -(2) Trade notes and accounts receivable..............................................................................................................................................................................................................................................................................................................................................449,871 449,871 -(3) Marketable securities and investment securities
Available-for-sale securities..........................................................................................................................................................................................................................................................153,022 153,022 -Total................................................................................................................................................................................................................................................................................................................................................................................................................................................................................................................................................$1,003,577 $1,003,577 -
Liabilities:(1) Trade notes and accounts payable......................................................................................................................................................................................................................................................................................................................$155,697 $155,697 -(2) Short-term loans..................................................................................................................................................................................................................................................................................................................................................................62,681 62,681 -(3) Accounts payable - other..........................................................................................................................................................................................................................................................114,925 114,925 -(4) Accrued income taxes..................................................................................................................................................................................................33,428 33,428 -(5) Bonds............................................................................................................................................................................................................................................................................142,328 141,294 (1,024)(6) Long-term loans..............................................................................................................................................................................................24,442 23,503 (939)
Total.................................................................................................................................................................................................................................................................$533,532 $531,558 ($1,964)
Derivative transactions(1) Hedge accounting not applied..............................................................................................................................................($1,783) ($1,783) -(2) Hedge accounting applied........................................................................................................................................................47 47 -
Total.........................................................................................................................................................................................................($1,726) ($1,726) -
Note 1. Method for calculating the fair value of financial instruments and notes regarding securities and derivative transactions.Assets(1) Cash and time deposits and (2) Trade notes and accounts receivable
(3) Marketable securities and investment securities
Liabilities
(1) Trade notes and accounts payable, (2) Short-term loans, (3) Accounts payable - other and (4) Accrued income taxes
(5) BondsMarket value for bonds issued by HORIBA is calculated based on market prices.
(6) Long-term loans
Derivative transactions
See Note 14 for derivative transactions.
Note 2. The following table summarizes financial instruments whose fair value was extremely difficult to estimate.Thousands of
U.S. dollars12/2012 12/2013 12/2013
Non-listed equity securities...................................................................................................................................................¥146 ¥129 $1,224Investments in nonconsolidated subsidiaries and affiliates.............................................................................................................67 105 996
As these are settled in the short term, market value approximates book value and is, therefore, based on the applicable bookvalue.
The above financial instruments were not included in "(3) Marketable securities and investment securities" because they didnot have market values and the fair value was extremely difficult to estimate.
Millions of yen
Net receivables (payables) derived from derivative transactions are displayed in the table above. Total net payables areshown in parenthesis.
Borrowings based on variable interest rates reflect market interest rates, and as the creditworthiness of HORIBA has notchanged significantly since execution, market value is considered to be approximate book value and is, therefore, based onapplicable book value. The value of borrowings with fixed interest rates is based on the total amount of principal and interestdiscounted at an interest rate of a similar new loan.
Book value
Market value for these is based on prices on securities exchanges in the case of shares, etc. For bonds, market value isbased on prices on securities exchanges or prices indicated by corresponding financial institutions. For marketable securitiesclassified by the purpose for which they are held, see Note 5.
Fair value Difference
As these are settled in the short term, market value approximates book value and is, therefore, based on the applicable bookvalue.
62HORIBA Report 2013 |

HORIBA, Ltd. and Consolidated Subsidiaries | Note to Consolidated Financial Statements
Note 3. Repayment schedule of monetary claims, available-for-sales securities with maturities and bonds held to maturity.
Cash and time deposits.........................................................................................................................................................¥34,685 - - -Trade notes and accounts receivable..................................................................................37,521 - - -Marketable securities and investment securities
Available-for-sale securities with maturities(1) Corporate bonds.............................................................................................................................................1,498 200 - -(2) Other.............................................................................................................................................1,000 18 7 -
Total....................................................................................................................................................................¥74,706 ¥219 ¥7 -
Cash and time deposits.........................................................................................................................................................¥42,228 - - -Trade notes and accounts receivable..................................................................................47,412 - - -Marketable securities and investment securities
Available-for-sale securities with maturities(1) Governmental/municipal bonds...........................................................................................................................................- 10 - -(2) Corporate bonds............................................................................................................................................401 200 - -(3) Other bonds............................................................................................................................................1,099 - - -(4) Other.............................................................................................................................................799 27 14 -
Total....................................................................................................................................................................¥91,941 ¥238 ¥14 -
Cash and time deposits........................................................................................................................................$400,683 - - -Trade notes and accounts receivable..................................................................................449,871 - - -Marketable securities and investment securities
Available-for-sale securities with maturities(1) Governmental/municipal bonds...........................................................................................................................................- 94 - -(2) Corporate bonds............................................................................................................................................3,804 1,897 - -(3) Other bonds............................................................................................................................................10,427 - - -(4) Other.............................................................................................................................................7,581 256 132 -
Total....................................................................................................................................................................$872,388 $2,258 $132 -
Note 4. Repayment schedule of bonds and long-term debt See Note 8 for short-term loans and long-term debt.
Over five yearsbut within ten
years
Over one yearbut within five
years
Over ten years
Over ten years
Thousands of U.S. dollars
Millions of yen
12/2013
Within oneyear
Over five yearsbut within ten
years
12/2013
Within oneyear
Over one yearbut within five
years
Over one yearbut within five
years
Over five yearsbut within ten
yearsOver ten years
12/2012
Millions of yen
Within oneyear
63
Financial data

5. Securities
Millions of yen Millions of yen12/2012 12/2013
Equity securities..................................................................................¥2,470 ¥860 ¥1,609 ¥5,636 ¥2,178 ¥3,457Governmental/municipal bonds..................................................................................- - - 10 10 0Corporate bonds..................................................................................600 599 1 100 100 0Other..................................................................................1,010 1,010 0 500 500 0Subtotal..................................................................................4,081 2,470 1,611 6,247 2,788 3,459
Equity securities..................................................................................1,151 1,310 (158) - - -Corporate bonds..................................................................................498 499 (0) 301 301 (0)Other bonds..................................................................................599 600 (0) 1,299 1,300 (0)Other..................................................................................3,598 3,598 - 8,278 8,278 (0)Subtotal..................................................................................5,849 6,008 (159) 9,879 9,880 (0)
Total.....................................................................................................................¥9,931 ¥8,479 ¥1,451 ¥16,127 ¥12,668 ¥3,458
Thousands of U.S. dollars12/2013
Equity securities..................................................................................................................................................................................................................................................................................................................................................................................................................$53,477 $20,666 $32,801Governmental/municipal bonds...................................................................................................... 94 94 0Corporate bonds....................................................................................................................................................948 948 0Other..........................................................................................................................................................................4,744 4,744 0Subtotal................................................................................................................................................................................................59,275 26,454 32,820
Corporate bonds..........................................................................................................................................................................2,856 2,856 (0)Other bonds..........................................................................................................................................................................12,325 12,335 (0)Other..........................................................................................................................................................................78,546 78,546 (0)Subtotal..........................................................................................................................................................................93,737 93,747 (0)
Total...................................................................................................................................................................................................................................$153,022 $120,201 $32,811
Note.
Thousands of
U.S. dollars12/2012 12/2013 12/2013
Total sales of available-for-sale securities............................................................................................ - ¥30 $284Related gains..........................................................................................................................................................................................................- 17 161
Impairment loss on marketable securities
Book value
Millions of yen
Difference
Securities with book values notexceeding acquisition costs:
Acquisitioncost
The following table summarizes available-for-sale securities sold for the fiscal year ended December 31, 2012 andDecember 31, 2013.
The following table summarizes acquisition costs and book values (fair values) of available-for-sale securities as ofDecember 31, 2012 and December 31, 2013.
Book valueAcquisition
costDifference
Non-listed equity securities, etc, of \146 million and \129 million ($1,224 thousand) for the fiscal year endedDecember 31, 2012 and December 31, 2013, respectively, are not included in the above table because they didnot have market values and the fair value was extremely difficult to estimate.
Securities with book valuesexceeding acquisition costs:
Acquisitioncost
Securities with book valuesexceeding acquisition costs:
Difference
The Company recognized an impairment loss of \2 million and \15 million ($142 thousand) in fiscal 2012 and fiscal2013, respectively, on available-for-sales securities. When applying impairment accounting, if the market value at theend of the term has fallen by more than 50% from the acquisition price, an impairment loss is applied to the entireamount. If the market value has fallen by approximately 30% to 50%, an impairment loss is applied to the amountrecognized as necessary after considering the possibility of recovery, etc.
Book value
Securities with book values notexceeding acquisition costs:
64HORIBA Report 2013 |

HORIBA, Ltd. and Consolidated Subsidiaries | Note to Consolidated Financial Statements
6. Inventories
Thousands ofU.S. dollars
12/2012 12/2013 12/2013Merchandise and finished goods......................................................................................................................................................................................................................................................¥10,099 ¥11,111 $105,427Work-in-process......................................................................................................................................................................................................................................................10,053 12,755 121,026Raw materials and supplies......................................................................................................................................................................................................................................................7,947 9,218 87,465
Total......................................................................................................................................................................................................................................................¥28,101 ¥33,085 $313,929
holidays
the ending balance at December 31, 2013.
8. Short-term loans and long-term debt
Thousands ofU.S. dollars
12/2012 12/2013 12/2013Unsecured:1.98% bonds due in 2014....................................................................................................................................................................¥10,000 - -0.609% bonds due in 2020....................................................................................................................................................................- 15,000 142,328Loans from banks due serially from 2014 to 2022
at rates from 2.00% to 17.65% per annum....................................................................................................................................................................3,335 3,648 34,614Lease obligations at 6.77% maturing serially through 2018 447 394 3,738
Total......................................................................................................................................................................................................................................................13,783 19,043 180,690
Current portion....................................................................................................................................................................(1,388) (1,229) (11,661)Long-term debt, less current portion....................................................................................................................................................................¥12,394 ¥17,814 $169,029
Thousands ofYear ending December 31 Millions of yen U.S. dollars
2014......................................................................................................................................................................................................................................................¥1,229 $11,6612015......................................................................................................................................................................................................................................................837 7,9412016......................................................................................................................................................................................................................................................543 5,1522017......................................................................................................................................................................................................................................................342 3,2452018......................................................................................................................................................................................................................................................284 2,694Thereafter......................................................................................................................................................................................................................................................15,807 149,985
Total......................................................................................................................................................................................................................................................¥19,043 $180,690
Thousands ofMillions of yen U.S. dollars
The maximum aggregate principal....................................................................................................................................................................¥17,376 $164,873Amount utilized......................................................................................................................................................................................................................................................1,077 10,219Balance available......................................................................................................................................................................................................................................................¥16,299 $154,654
loan commitments with 11 banks as follows:
As of December 31, 2013, the Company and its 9 subsidiaries had entered into agreements for bank overdrafts or
The aggregate annual maturities of long-term debt outstanding at December 31, 2013 were as follows:
Long-term debt at December 31, 2012 and December 31, 2013 consisted of the following:
in the ending balance at December 31, 2012 and notes in the amount of \290 million ($2,751 thousand) were included in
Short-term loans are generally represented by bank notes with annual interest rates ranging from 0.49% to 12.24% and
Inventories at December 31, 2012 and December 31, 2013 consisted of the following:
Millions of yen
December 31, 2012 and December 31, 2013, the end of the period, were bank holidays. Notes receivable maturing on
7. Notes receivable maturing on December 31, 2012 and December 31, 2013, which were bank
those dates were settled on the following business day. Therefore, notes in the amount of \318 million were included
0.48% to 15.93% at December 31, 2012 and December 31, 2013, respectively.
Millions of yen
65
Financial data
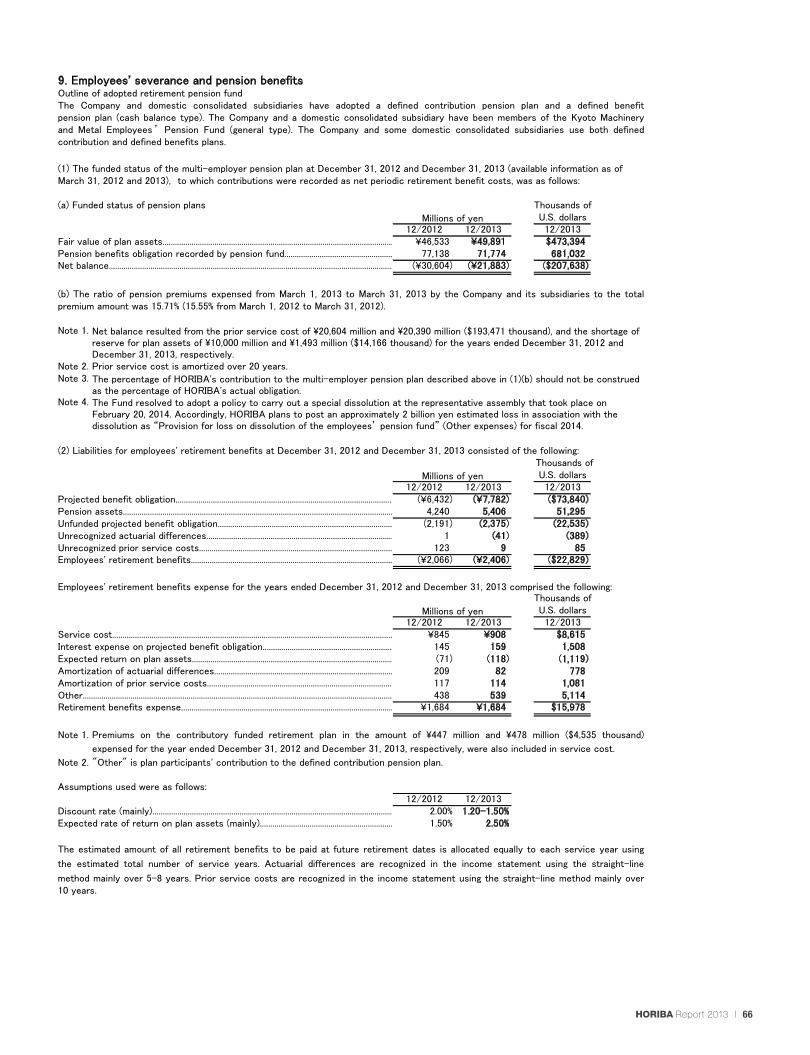
9. Employees' severance and pension benefitsOutline of adopted retirement pension fund
March 31, 2012 and 2013), to which contributions were recorded as net periodic retirement benefit costs, was as follows:
(a) Funded status of pension plans Thousands of
Millions of yen U.S. dollars12/2012 12/2013 12/2013
Fair value of plan assets................................................................................................................................................................ ¥46,533 ¥49,891 $473,394Pension benefits obligation recorded by pension fund................................................................................................................................................................ 77,138 71,774 681,032Net balance.................................................................................................................................................................................................... (¥30,604) (¥21,883) ($207,638)
premium amount was 15.71% (15.55% from March 1, 2012 to March 31, 2012).
Note 1.
Note 2. Prior service cost is amortized over 20 years.Note 3.
Note 4.
(2) Liabilities for employees' retirement benefits at December 31, 2012 and December 31, 2013 consisted of the following: Thousands of
Millions of yen U.S. dollars12/2012 12/2013 12/2013
Projected benefit obligation....................................................................................................................................................................(¥6,432) (¥7,782) ($73,840)Pension assets......................................................................................................................................................................................................................................................4,240 5,406 51,295Unfunded projected benefit obligation....................................................................................................................................................................(2,191) (2,375) (22,535)Unrecognized actuarial differences....................................................................................................................................................................1 (41) (389)Unrecognized prior service costs....................................................................................................................................................................123 9 85Employees' retirement benefits....................................................................................................................................................................(¥2,066) (¥2,406) ($22,829)
Employees' retirement benefits expense for the years ended December 31, 2012 and December 31, 2013 comprised the following:Thousands of
Millions of yen U.S. dollars12/2012 12/2013 12/2013
Service cost......................................................................................................................................................................................................................................................¥845 ¥908 $8,615Interest expense on projected benefit obligation....................................................................................................................................................................145 159 1,508Expected return on plan assets......................................................................................................................................................................................................................................................(71) (118) (1,119)Amortization of actuarial differences....................................................................................................................................................................209 82 778Amortization of prior service costs....................................................................................................................................................................117 114 1,081Other................................................................................................................................................................................................................438 539 5,114Retirement benefits expense......................................................................................................................................................................................................................................................¥1,684 ¥1,684 $15,978
Note 1.
expensed for the year ended December 31, 2012 and December 31, 2013, respectively, were also included in service cost.
Note 2. "Other" is plan participants' contribution to the defined contribution pension plan.
Assumptions used were as follows:12/2012 12/2013
Discount rate (mainly)......................................................................................................................................................................................................................................................2.00% 1.20-1.50%Expected rate of return on plan assets (mainly)....................................................................................................................................................................1.50% 2.50%
10 years.
The Fund resolved to adopt a policy to carry out a special dissolution at the representative assembly that took place onFebruary 20, 2014. Accordingly, HORIBA plans to post an approximately 2 billion yen estimated loss in association with thedissolution as “Provision for loss on dissolution of the employees’ pension fund” (Other expenses) for fiscal 2014.
Net balance resulted from the prior service cost of \20,604 million and \20,390 million ($193,471 thousand), and the shortage ofreserve for plan assets of \10,000 million and \1,493 million ($14,166 thousand) for the years ended December 31, 2012 andDecember 31, 2013, respectively.
The percentage of HORIBA's contribution to the multi-employer pension plan described above in (1)(b) should not be construedas the percentage of HORIBA's actual obligation.
(1) The funded status of the multi-employer pension plan at December 31, 2012 and December 31, 2013 (available information as of
The Company and domestic consolidated subsidiaries have adopted a defined contribution pension plan and a defined benefitpension plan (cash balance type). The Company and a domestic consolidated subsidiary have been members of the Kyoto Machineryand Metal Employees ’ Pension Fund (general type). The Company and some domestic consolidated subsidiaries use both definedcontribution and defined benefits plans.
(b) The ratio of pension premiums expensed from March 1, 2013 to March 31, 2013 by the Company and its subsidiaries to the total
Premiums on the contributory funded retirement plan in the amount of \447 million and \478 million ($4,535 thousand)
The estimated amount of all retirement benefits to be paid at future retirement dates is allocated equally to each service year using
the estimated total number of service years. Actuarial differences are recognized in the income statement using the straight-line
method mainly over 5-8 years. Prior service costs are recognized in the income statement using the straight-line method mainly over
66HORIBA Report 2013 |
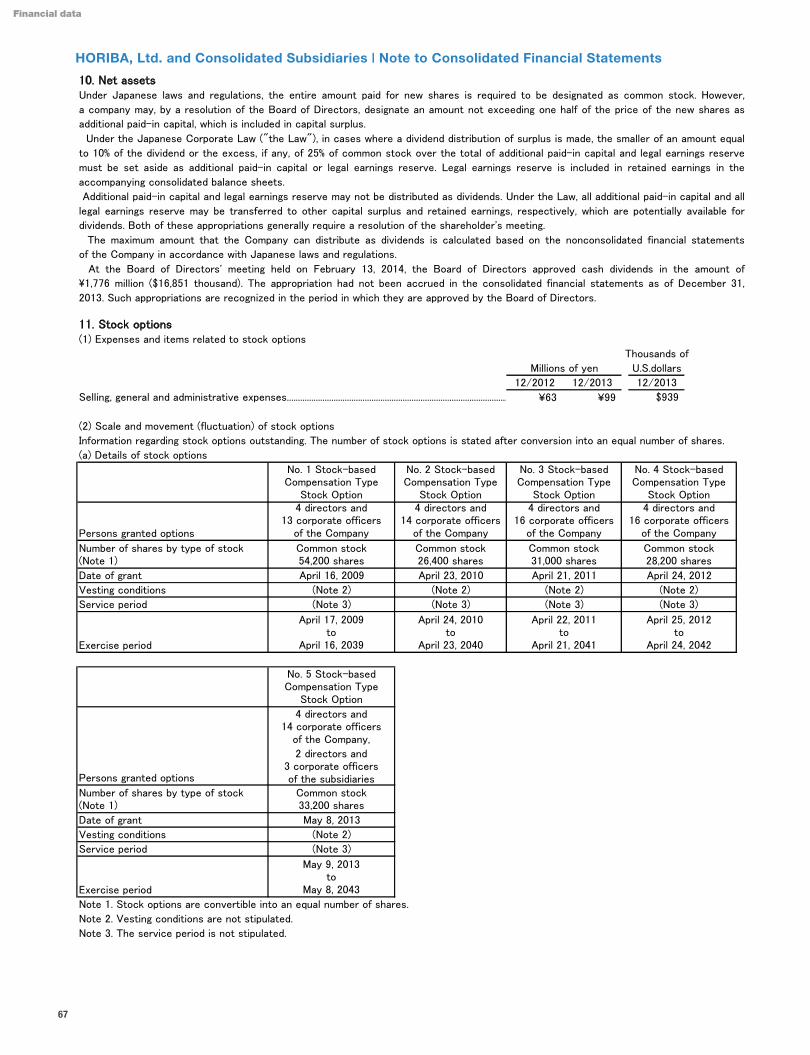
HORIBA, Ltd. and Consolidated Subsidiaries | Note to Consolidated Financial Statements
10. Net assets
11. Stock options (1) Expenses and items related to stock options
Thousands of
U.S.dollars
12/2012 12/2013 12/2013
Selling, general and administrative expenses....................................................................................................................................................................¥63 ¥99 $939
(2) Scale and movement (fluctuation) of stock options
Information regarding stock options outstanding. The number of stock options is stated after conversion into an equal number of shares.
(a) Details of stock options
Note 1. Stock options are convertible into an equal number of shares.
Note 2. Vesting conditions are not stipulated.
Note 3. The service period is not stipulated.
\1,776 million ($16,851 thousand). The appropriation had not been accrued in the consolidated financial statements as of December 31,
2013. Such appropriations are recognized in the period in which they are approved by the Board of Directors.
must be set aside as additional paid-in capital or legal earnings reserve. Legal earnings reserve is included in retained earnings in the
accompanying consolidated balance sheets.
legal earnings reserve may be transferred to other capital surplus and retained earnings, respectively, which are potentially available for
dividends. Both of these appropriations generally require a resolution of the shareholder's meeting.
The maximum amount that the Company can distribute as dividends is calculated based on the nonconsolidated financial statements
of the Company in accordance with Japanese laws and regulations.
Additional paid-in capital and legal earnings reserve may not be distributed as dividends. Under the Law, all additional paid-in capital and all
Under Japanese laws and regulations, the entire amount paid for new shares is required to be designated as common stock. However,
a company may, by a resolution of the Board of Directors, designate an amount not exceeding one half of the price of the new shares as
to 10% of the dividend or the excess, if any, of 25% of common stock over the total of additional paid-in capital and legal earnings reserve
additional paid-in capital, which is included in capital surplus.
Under the Japanese Corporate Law ("the Law"), in cases where a dividend distribution of surplus is made, the smaller of an amount equal
At the Board of Directors' meeting held on February 13, 2014, the Board of Directors approved cash dividends in the amount of
No. 2 Stock-basedCompensation Type
Stock Option
No. 3 Stock-basedCompensation Type
Stock Option
April 23, 2010 April 21, 2011
April 24, 2010to
April 23, 2040
Millions of yen
Common stock28,200 shares
April 24, 2012
(Note 2)
(Note 3)
April 25, 2012to
April 24, 2042
(Note 2)
(Note 3)
Persons granted options
4 directors and14 corporate officers
of the Company
4 directors and16 corporate officers
of the Company
Common stock26,400 shares
Common stock31,000 shares
April 22, 2011to
April 21, 2041
(Note 3)Service period
April 16, 2009
No. 1 Stock-basedCompensation Type
Stock Option4 directors and
13 corporate officersof the Company
(Note 2) (Note 2)
Common stock54,200 shares
(Note 3)
No. 4 Stock-basedCompensation Type
Stock Option
Number of shares by type of stock(Note 1)
Date of grant
Vesting conditions
4 directors and16 corporate officers
of the Company
Exercise period
April 17, 2009to
April 16, 2039
Number of shares by type of stock(Note 1)
Common stock33,200 shares
2 directors and3 corporate officersof the subsidiariesPersons granted options
May 8, 2013
Vesting conditions (Note 2)
(Note 3)
No. 5 Stock-basedCompensation Type
Stock Option
Date of grant
4 directors and14 corporate officers
of the Company,
Exercise period
May 9, 2013to
May 8, 2043
Service period
67
Financial data

(b) Number, movement and price of stock options
Stock options are convertible into an equal number of shares.
(i) Number of shares
(ii) Price per share
Weighted average stock price (yen)
Fair value at grant date (yen)
Weighted average stock price (yen)
Fair value at grant date (yen)
No. 1 Stock-basedCompensation Type
Stock Option
No. 2 Stock-basedCompensation Type
Stock Option
No. 3 Stock-basedCompensation Type
Stock Option
No. 4 Stock-basedCompensation Type
Stock Option
Balance at December 31, 2013 46,100 23,600 29,700
3,073 3,073 3,073 3,073
1,091 2,628 2,208 2,245
Option price (yen) 1 1 1 1
No. 1 Stock-basedCompensation Type
Stock Option
No. 2 Stock-basedCompensation Type
Stock Option
No. 3 Stock-basedCompensation Type
Stock Option
No. 4 Stock-basedCompensation Type
Stock Option
27,100
Exercised 1,300 600 700 1,100
Forfeited - - - -
Balance at December 31, 2012 47,400 24,200 30,400 28,200
Vested - - - -
Balance at December 31, 2013 - - - -Options after vesting(number of shares)
Forfeited - - - -
Vested - - - -
Balance at December 31, 2012 - - - -
Granted - - - -
Options before vesting(number of shares)
No. 5 Stock-basedCompensation Type
Stock Option
Options before vesting(number of shares)
Balance at December 31, 2012 -
Granted 33,200
Forfeited -
Vested 33,200
Balance at December 31, 2013 -Options after vesting(number of shares)
Balance at December 31, 2012 -
Vested 33,200
Exercised 700
Forfeited -
Balance at December 31, 2013 32,500
No. 5 Stock-basedCompensation Type
Stock Option
2,988
Option price (yen) 1
3,648
68HORIBA Report 2013 |

HORIBA, Ltd. and Consolidated Subsidiaries | Note to Consolidated Financial Statements
(3) Method to estimate fair unit value of stock options
using the Black-Scholes option pricing model as follows:
Note 1.
of April 29, 2013).
Note 2.
the mid-point of the exercise period.
Note 3. Expected dividend was calculated by using the actual dividend paid for the year ended December 31, 2012.
Note 4.
corresponds to the expected remaining period of the stock options.
(4) Condition regarding the estimate of the fair unit value of stock options
number of stock options granted is used as an estimate of the number of vested shares.
12. Leases
At December 31, 2012 and December 31, 2013, assets leased under non-capitalized finance leases were as follows:
Acquisition cost, accumulated depreciation and balance of assets leasedThousands of
Millions of yen U.S. dollars12/2012 12/2013 12/2013
Machinery, equipment and vehicles.....................................................................................................................................................................¥109 ¥109 $1,034Other property, plant and equipment....................................................................................................................................................................117 45 426Other intangibles....................................................................................................................................................................4 - -Less accumulated depreciation and amortization....................................................................................................................................................................(181) (128) (1,214)Total......................................................................................................................................................................................................................................................¥50 ¥27 $256
Note.
December 31, 2013 were as follows:Thousands of
Millions of yen U.S. dollarsPayments remaining: 12/2012 12/2013 12/2013
Payments due within 1 year....................................................................................................................................................................¥25 ¥20 $189Payments due after 1 year....................................................................................................................................................................29 8 75Total....................................................................................................................................................................¥54 ¥29 $275
Payments remaining under operating leases at December 31, 2012 and December 31, 2013 were as follows:Thousands of
Millions of yen U.S. dollarsPayments remaining: 12/2012 12/2013 12/2013
Payments due within 1 year....................................................................................................................................................................¥626 ¥805 $7,638Payments due after 1 year....................................................................................................................................................................1,846 1,603 15,210Total....................................................................................................................................................................¥2,472 ¥2,409 $22,857
13. Contingent liabilities
nonconsolidated subsidiaries in the amounts of \116 million at December 31, 2012.
thousand) of the HORIBA, Ltd. No. 3 Unsecured Straight Bonds at December 31, 2013.
policies - Leases."
December 31, 2008, the Company has continued to account for them in the same manner as operating leases, as stated above.
respectively. Lease payments under non-capitalized finance leases were \56 million and \25 million ($237 thousand) for the
years ended December 31, 2012 and December 31, 2013, respectively. Obligations under finance leases at December 31, 2012 and
The Company and certain consolidated subsidiaries were contingently liable as guarantors of loans to affiliated companies and
The above depreciation and amortization was calculated by the straight-line method over the term of the lease. If the above leases
had been capitalized, interest of \1 million and \0 million ($0 thousand) and depreciation and amortization of \52 million and
\23 million ($218 thousand) would have been recorded for the years ended December 31, 2012 and December 31, 2013,
With respect to finance lease transactions that do not transfer ownership and in which the lease transaction began before
The grant date fair value of No. 5 Stock-based Compensation Type Stock Option in the year ended December 31, 2013 was estimated
Stock price volatility was calculated based on actual weekly stock prices over 15 years (from the week of May 4, 1998 to the week
No. 5 Stock-basedCompensation Type
Stock Option
Stock price volatility (Note 1) 36.9%
Expected remaining period (Note 2) 15 Years
As it was difficult to estimate the expected remaining period without sufficient relevant data, it was determined to be exercised at
Risk free interest rate represents the comparable compound interest rate of strip government bonds whose remaining period
Retirement from the office of director is a condition to exercise stock options, but continuous employment is not. Accordingly, the initial
The outstanding amount for which the Company was contingently liable under a debt assumption agreement was \10,000 million ($94,885
Expected dividend (Note 3) \50/share
Risk free interest rate (Note 4) 1.14%
Finance leases which do not transfer ownership at December 31, 2012 and December 31, 2013 consisted of leases for office equipment
and software. The method of depreciation and amortization of lease assets is described in Note 2(h), "Summary of significant accounting
69
Financial data
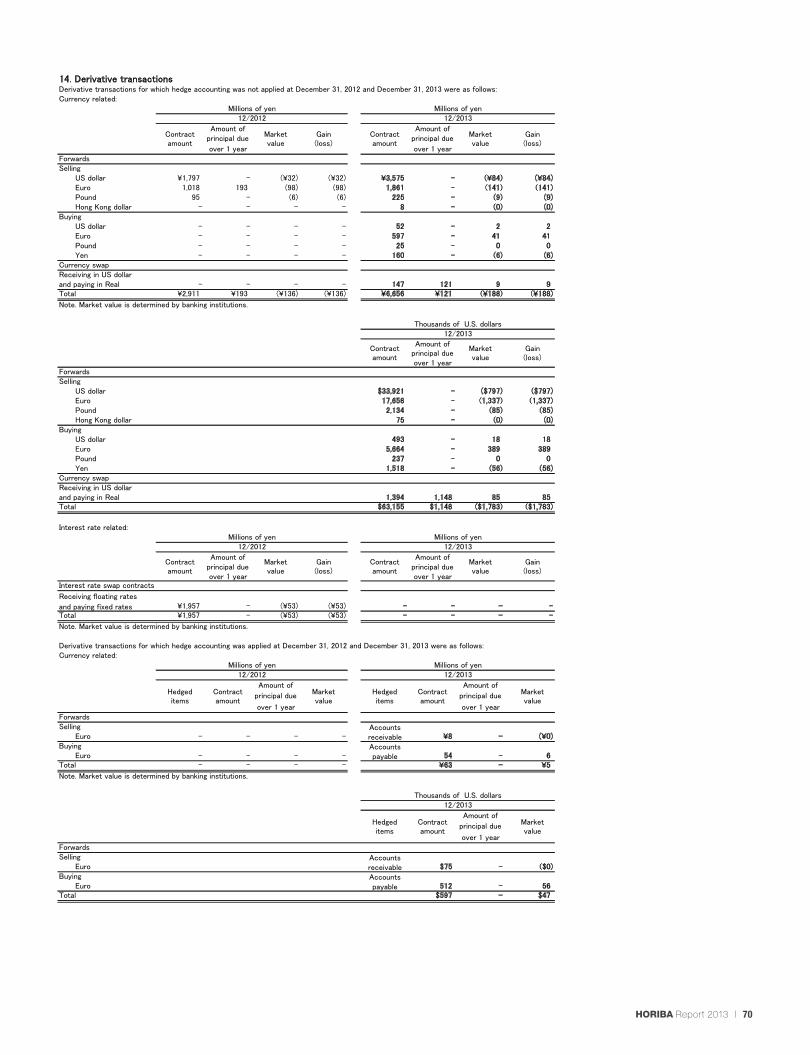
14. Derivative transactionsDerivative transactions for which hedge accounting was not applied at December 31, 2012 and December 31, 2013 were as follows:Currency related:
Millions of yen Millions of yen12/2012 12/2013
Amount of Amount ofprincipal due principal due
over 1 year over 1 yearForwardsSelling
US dollar ¥1,797 - (¥32) (¥32) ¥3,575 - (¥84) (¥84)Euro 1,018 193 (98) (98) 1,861 - (141) (141)Pound 95 - (6) (6) 225 - (9) (9)Hong Kong dollar - - - - 8 - (0) (0)
BuyingUS dollar - - - - 52 - 2 2Euro - - - - 597 - 41 41Pound - - - - 25 - 0 0Yen - - - - 160 - (6) (6)
Currency swapReceiving in US dollarand paying in Real - - - - 147 121 9 9Total ¥2,911 ¥193 (¥136) (¥136) ¥6,656 ¥121 (¥188) (¥188)
Note. Market value is determined by banking institutions.
Thousands of U.S. dollars12/2013
Amount ofprincipal dueover 1 year
ForwardsSelling
US dollar $33,921 - ($797) ($797)Euro 17,658 - (1,337) (1,337)Pound 2,134 - (85) (85)Hong Kong dollar 75 - (0) (0)
BuyingUS dollar 493 - 18 18Euro 5,664 - 389 389Pound 237 - 0 0Yen 1,518 - (56) (56)
Currency swapReceiving in US dollarand paying in Real 1,394 1,148 85 85Total $63,155 $1,148 ($1,783) ($1,783)
Interest rate related:Millions of yen Millions of yen
12/2012 12/2013
Amount of Amount ofprincipal due principal dueover 1 year over 1 year
Interest rate swap contracts
Receiving floating rates
and paying fixed rates ¥1,957 - (¥53) (¥53) - - - -Total ¥1,957 - (¥53) (¥53) - - - -
Note. Market value is determined by banking institutions.
Derivative transactions for which hedge accounting was applied at December 31, 2012 and December 31, 2013 were as follows:Currency related:
Millions of yen Millions of yen12/2012 12/2013
Amount of Amount of
principal due principal due
over 1 year over 1 yearForwardsSelling Accounts
Euro - - - - receivable ¥8 - (¥0)Buying Accounts
Euro - - - - payable 54 - 6Total - - - - ¥63 - ¥5
Note. Market value is determined by banking institutions.
Thousands of U.S. dollars12/2013
Amount of
principal due
over 1 yearForwardsSelling Accounts
Euro receivable $75 - ($0)Buying Accounts
Euro payable 512 - 56Total $597 - $47
Marketvalue
Hedgeditems
Contractamount
Marketvalue
Contractamount
Marketvalue
Hedgeditems
Hedgeditems
Contractamount
Marketvalue
Gain(loss)
Contractamount
Marketvalue
Gain(loss)
Gain(loss)
Contractamount
Marketvalue
Gain(loss)
Contractamount
Contractamount
Contractamount
Marketvalue
Marketvalue
Gain(loss)
70HORIBA Report 2013 |

HORIBA, Ltd. and Consolidated Subsidiaries | Note to Consolidated Financial Statements
15. Income taxes
31, 2013.
rate for financial statement purposes for the years ended December 31, 2012 and December 31, 2013.
12/2012 12/2013Statutory tax rate.................................................................................................................................................................40.6% 37.9%
Expenses not qualifying for permanent deduction, e.g. entertainment expenses............................................................................................................................1.2 1.0
Nontaxable dividend income.................................................................................................................................................................(0.2) (0.7)Per capita inhabitants tax.......................................................................................................................................................0.4 0.3Increase/decrease in valuation allowance for deferred tax assets........................ 0.0 0.7Differences in tax rate between
foreign subsidiaries and the Company..................................................................................................(3.3) (2.6)Tax credits.................................................................................................................................................................................................(4.3) (4.2)Other.........................................................................................................................................................................................................(0.6) 1.4
Effective tax rate......................................................................................................................................................................................................................................................33.8% 33.8%
were as follows:Thousands of
Millions of yen U.S. dollars12/2012 12/2013 12/2013
Deferred tax assetsAccrued enterprise tax....................................................................................................................................................................¥162 ¥243 $2,305Loss on write-down of inventory....................................................................................................................................................................829 981 9,308Allowance for doubtful receivables....................................................................................................................................................................66 79 749Accrued bonuses....................................................................................................................................................................200 220 2,087Loss carryforwards....................................................................................................................................................................1,463 2,146 20,362Unrealized gains....................................................................................................................................................................999 1,379 13,084Employees' retirement benefits....................................................................................................................................................................608 641 6,082Depreciation....................................................................................................................................................................644 558 5,294Loss on valuation of investment securities....................................................................................................................................................................103 108 1,024Retirement benefits for directors and corporate auditors.................................................................................................................................................................................319 - -Loss on impairment of fixed assets....................................................................................................................................................................115 117 1,110Other....................................................................................................................................................................................................2,033 2,406 22,829
Total deferred tax assets....................................................................................................................................................................7,546 8,885 84,305Valuation allowance....................................................................................................................................................................(1,206) (1,807) (17,145)Net deferred tax assets....................................................................................................................................................................6,339 7,078 67,160
Deferred tax liabilitiesUnrealized losses....................................................................................................................................................................(390) (399) (3,785)Net unrealized holding gains on securities..................................................................................(463) (1,161) (11,016)Other......................................................................................................................................................................................................................................................(733) (1,326) (12,581)
Total deferred tax liabilities....................................................................................................................................................................(1,587) (2,888) (27,402)
Net deferred tax assets....................................................................................................................................................................¥4,751 ¥4,189 $39,747
Net deferred tax assets are included in the consolidated balance sheets as follows:Thousands of
Millions of yen U.S. dollars12/2012 12/2013 12/2013
Current assets..................................................................................................................................................................................................¥2,881 ¥3,186 $30,230Investments and other noncurrent assets......................................................................................................................................................................................................................2,030 1,750 16,604Current liabilities.....................................................................................................................................................................................................................(6) (87) (825)Long-term liabilities......................................................................................................................................................................................................................(153) (659) (6,252)
Net deferred tax assets....................................................................................................................................................................¥4,751 ¥4,189 $39,747
The Company is subject to a number of taxes based on income, which, in the aggregate, indicate a statutory income
The following table summarizes the significant differences between the statutory tax rate and HORIBA's effective tax
Significant components of HORIBA's deferred tax assets and liabilities at December 31, 2012 and December 31, 2013
tax rate in Japan of approximately 40.6% for the year ended December 31, 2012 and 37.9% for the year ended December
71
Financial data

16. Impairment loss
the following asset groups as other expenses for the year ended December 31, 2012.
Location Use Type Millions of yen
Montpellier, France Idle ¥104Neuhausen, Germany - Goodwill 21Kyoto, Japan Idle Land 8
(Background)
other expenses.
(Method used for grouping)
which are not expected to be used in the future are grouped on a property-by-property basis.
(Method used for calculating a recoverable amount)
the following asset groups as other expenses for the year ended December 31, 2013.
Location Use Type Millions of yen U.S. dollarsBeijing, China - ¥143 $1,356
Longjumeau, France Idle 32 303Montpellier, France Idle Machinery and equipment 10 94Kyoto, Japan Idle Land 4 37
(Background)
other expenses.
(Method used for grouping)
which are not expected to be used in the future are grouped on a property-by-property basis.
(Method used for calculating a recoverable amount)
The recoverable amount for idle assets was measured according to estimated net realizable value. As it is difficult to sell or
Machinery and equipmentOther equipment
In the case of idle assets, there was no concrete plan to use the assets for business. In the case of goodwill, income that
HORIBA had assumed in the business plan that it considered at the time of stock acquisition was no longer projected. Thus,
the book value of these assets was lowered to the recoverable value, and the resulting impairment loss was recognized as
HORIBA reviewed its long-lived assets for impairment, and, as a result, impairment losses were recognized by the Company for
In connection with the use of impairment accounting, business assets are grouped on a reporting segment basis. Idle assets
HORIBA reviewed its long-lived assets for impairment, and, as a result, impairment losses were recognized by the Company for
Goodwill
In the case of idle assets, there was no concrete plan to use the assets for business. In the case of goodwill, income that
HORIBA had assumed in the business plan that it considered at the time of stock acquisition was no longer projected. Thus,
divert machinery and equipment and other equipment elsewhere, the recoverable amount was estimated at zero, while the
recoverable amount for land was estimated based on publicly announced market values for land. Furthermore, in regard to
goodwill, the unamortized balance for which it was acknowledged that income was unlikely to be obtained in the future was
recognized as an impairment loss.
loss.
Buildings and structuresLand
the book value of these assets was lowered to the recoverable value, and the resulting impairment loss was recognized as
In connection with the use of impairment accounting, business assets are grouped on a reporting segment basis. Idle assets
The recoverable amount for idle assets was measured according to estimated net realizable value. As it is difficult to sell or
divert machinery and equipment elsewhere, the recoverable amount was estimated at zero, while the recoverable amount
for land was estimated based on publicly announced market values for land. Furthermore, in regard to goodwill, the unamortized
balance for which it was acknowledged that income was unlikely to be obtained in the future was recognized as an impairment
72HORIBA Report 2013 |

HORIBA, Ltd. and Consolidated Subsidiaries | Note to Consolidated Financial Statements
17. Asset retirement obligationsThe note for asset retirement obligations has been omitted as there were no significant amount of asset retirement obligations.
18. Investment and rental propertyThe note for investment and rental property has been omitted as there were no significant amount of investment or rental property.
19. Consolidated statement of comprehensive incomeComponents of other comprehensive income for the years ended December 31, 2012 and December 31 2013, consisted of the following
Millions of yen
Unrealized gains (losses) on available-for-sale securities: 2012 2013 2013Increase (decrease) during the year........................................................................................................................................................................................................................................................................................................................................................................................................¥413 ¥2,024 $19,204Reclassification adjustment............................................................................................................................................................................................................- (17) (161)Subtotal, before tax..................................................................................................................................................................................................................................................413 2,006 19,034Tax (expense) or benefit........................................................................................................................................................................................................................................(143) (698) (6,623)Subtotal, net tax..........................................................................................................................................................................................................................................................270 1,308 12,411
Deferred gains or losses on hedgesIncrease (decrease) during the year..............................................................................................................................................................................................................- 5 47Tax (expense) or benefit........................................................................................................................................................................................................................................- (2) (18)Subtotal, net tax..........................................................................................................................................................................................................................................................- 3 28
Foreign currency translation adjustmentsIncrease (decrease) during the year..............................................................................................................................................................................................................3,297 6,896 65,433
Share of other comprehensive income of associates accounted for using the equity methodIncrease (decrease) during the year...............................................................................................................................................................................................................(2) (8) (75)
Total other comprehensive income............................................................................................................................................................................................................¥3,565 ¥8,199 $77,796
20. Segment informationGeneral information regarding reportable segments(1) Calculation method for reportable segments
Major products of each segment are described below.
(2) Method of measurement regarding income (loss), assets and other material items by reportable segment
(d) Semiconductor Instruments & Systems
Test Systems, Brake Test Systems, Drive Recorders
Systems, Process & Environmental Instruments & Systems, Medical-Diagnostic Instruments & Systems, Semiconductor Instruments & Systems
(a) Automotive Test Systems
policies." Income for each reportable segment is the amount based on operating income.
regularly by the management in deciding how to allocate resources and in assessing performance.
(e) Scientific Instruments & SystemsScientific Analysis Instruments (pH Meters, Particle-Size Distribution Analyzers, X-Ray Fluorescence Analyzers, Raman, Spectrophotometers,
and Scientific Instruments & Systems comprise five reportable segments.
(b) Process & Environmental Instruments & Systems
plan for Japan and overseas markets for business development.
Equipment for Blood Sample Analysis (Hematology Analyzers, Equipment for Measuring Immunological Responses, Clinical Chemistry Analyzers,
Environmental Measuring Instruments (Stack Gas Analyzers, Water Quality Analysis and Examination Systems, Air Pollution Analyzers),
The accounting methods applied for reportable segments are identical with those stated in Note 2, "Summary of significant accounting
Thousands ofU.S. dollars
Environmental Radiation Monitors
HORIBA's reportable segments are components of the Company about which separate financial information is available and that are evaluated
Diffraction, Gratings)
The Company thus is composed of business segments by product and service that are determined at the head office. The Automotive Test
Blood Sugar Measurement Systems)
Emission Measurement Systems, In-Use Automotive Emissions Analyzers, On-Board Emission Measurement, Driveline Test Systems, Engine
(c) Medical-Diagnostic Instruments & Systems
Mass Flow Controllers, Chemical Concentration Monitors, Reticle/Mask Particle Detection Systems, Residual Gas Analyzers
The Company has established the segment strategy office for each product and service at its headquarters which draws a comprehensive
73
Financial data

(3) Information regarding income (loss), assets and other material items by reportable segment
12/2012
Medical-Diagnostic
SalesSales to outside customers..................................................................................¥43,230 ¥13,709 ¥22,400 ¥17,861 ¥20,406 - ¥117,609Intersegment sales and transfers..................................................................................- - - - - - -Total..........................................................................................43,230 13,709 22,400 17,861 20,406 - 117,609
Segment income (loss)...................................................................................¥4,412 ¥1,642 ¥2,478 ¥2,274 ¥943 - ¥11,751Segment assets..................................................................................¥37,755 ¥12,313 ¥18,277 ¥18,963 ¥17,661 ¥48,865 ¥153,836Other items:
Depreciation..................................................................................1,133 385 1,131 547 447 - 3,645Amortization of goodwill..................................................................................44 - - 37 16 - 98
2,031 720 1,486 1,855 1,788 - 7,882
12/2013
Medical-Diagnostic
SalesSales to outside customers..................................................................................¥49,524 ¥14,711 ¥26,832 ¥24,153 ¥22,913 - ¥138,136Intersegment sales and transfers..................................................................................- - - - - - -Total..........................................................................................49,524 14,711 26,832 24,153 22,913 - 138,136
Segment income (loss)..................................................................................¥4,287 ¥1,263 ¥2,429 ¥4,815 ¥937 - ¥13,733Segment assets..................................................................................¥43,148 ¥13,676 ¥23,931 ¥25,025 ¥21,710 ¥61,776 ¥189,269Other items:
Depreciation..................................................................................1,344 440 1,095 646 655 - 4,182Amortization of goodwill..................................................................................- - - 47 48 - 96
2,231 672 1,751 1,939 1,084 - 7,680
12/2013
Medical-Diagnostic
SalesSales to outside customers..................................................................................$469,911 $139,586 $254,597 $229,177 $217,411 - $1,310,712Intersegment sales and transfers..................................................................................- - - - - - -Total..........................................................................................469,911 139,586 254,597 229,177 217,411 - 1,310,712
Segment income (loss)..................................................................................$40,677 $11,984 $23,047 $45,687 $8,890 - $130,306Segment assets..................................................................................$409,412 $129,765 $227,070 $237,451 $205,996 $586,165 $1,795,891Other items:
Depreciation..................................................................................12,752 4,174 10,389 6,129 6,215 - 39,681Amortization of goodwill..................................................................................- - - 445 455 - 910
21,168 6,376 16,614 18,398 10,285 - 72,872
Note 1.
Note 2.
(1)Unallocated amounts to be included in the adjustment amount of segment profits was not generated.(2)The adjustment amounts of \48,865 million and \61,776 million ($586,165 thousand) of segment assets for the years ended
cash and cash equivalents, short-term investments, investment securities, idle land, etc. December 31, 2012 and December 31, 2013 represent corporate assets that are not allocated to each business segment. They include
Automotive
Depreciation and increases in tangible and intangible fixed assets include long-term prepaid expenses and the amount of amortizationassociated with the expenses.
Details of adjustment amounts are as follows:
Scientific
Increase in tangible and intangiblefixed assets................................................
Adjustment Consolidated
Increase in tangible and intangiblefixed assets................................................
Thousands of U.S. dollars
Adjustment Consolidated
Increase in tangible and intangiblefixed assets................................................
Millions of yen
AutomotiveProcess &
EnvironmentalSemiconductor
Process &Environmental
Semiconductor Scientific Adjustment Consolidated
Millions of yen
AutomotiveProcess &
EnvironmentalSemiconductor Scientific
74HORIBA Report 2013 |

HORIBA, Ltd. and Consolidated Subsidiaries | Note to Consolidated Financial Statements
<Related Information>
1. Information regarding geographic areas
(1) Net sales
Millions of yen
2012 2013 2013
Japan........................................................................................................................................................................................................................................¥45,777 ¥48,496 $460,157
United States........................................................................................................................................................................................................................................14,170 19,237 182,531
Europe...................................................................................................................................................................................................................................27,421 33,577 318,597
Asia.........................................................................................................................................................................................................................................26,270 30,985 294,003
Others...................................................................................................................................................................................................................................3,969 5,839 55,403
Total............................................................................................................................................................................................................................................................¥117,609 ¥138,136 $1,310,712
Note. Net sales are categorized by country or geographic area based on the location of the customer.
(2) Property, plant and equipment
Millions of yen
2012 2013 2013
Japan..........................................................................................................................................................................................................................................¥15,649 ¥16,096 $152,727
France...................................................................................................................................................................................................................................5,624 6,387 60,603
Others....................................................................................................................................................................................................................................6,904 10,842 102,875
Total..........................................................................................................................................................................................................................¥28,179 ¥33,326 $316,215
2. Information regarding major customers
There is no customer who represents more than 10% of the consolidated sales.
3. Information regarding loss on impairment of fixed assets by reporting segment
Millions of yen
2012 2013 2013
Automotive Test Systems..................................................................................................................................................................................¥21 - -
Medical-Diagnostic Instruments & Systems.................................................................................................................................................104 10 94
Semiconductor Instruments & Systems..................................................................................................................................................- 143 1,356
Scientific Instruments & Systems...............................................................................................................................................................- 32 303
Others.........................................................................................................................................................................................................................................8 4 37
Total..........................................................................................................................................................................................................................¥135 ¥190 $1,802
Note. The "Others" amount is that of the Company's idle assets.
4. Information regarding the amortized amount and unamortized balance of goodwill
Millions of yen
2012 2013 2013
Semiconductor Instruments & Systems.................................................................................................................................................¥164 - -
Scientific Instruments & Systems...............................................................................................................................................................154 314 2,979
Total..........................................................................................................................................................................................................................¥319 ¥314 $2,979
Note. Information regarding the "Amortized amount of goodwill" is omitted as similar information is disclosed in "Segment Information."
5. Information regarding gain on bargain purchase by reporting segment
The year ended December 31, 2012
Not applicable
The year ended December 31, 2013
HORIBA acquired the process analytical product line from the U.S. company Cameron, in the Process & Environmental Instruments & Systems Segment
and recorded gain on bargain purchase. In fiscal 2013, the amount of gain on bargain purchase was \64 million ($607 thousand).
Thousands ofU.S. dollars
Thousands ofU.S. dollars
Thousands ofU.S. dollars
Thousands ofU.S. dollars
75
Financial data

21. Related party transactions(1) Related party transactions with the Company Directors and major shareholders (individuals only) of the Company
The year ended December 31, 2012 The year ended December 31, 2013
Transactionamount
Consultingfee
(Note 2)\24 million
Transactionamount
Consultingfee
(Note 2)
\24 million($227
thousand)
Balance atDecember 31,
2012- -
Balance atDecember 31,
2013- -
Note 1.
Note 2.
of society-academia collaboration for innovation and participation in economic organizations.
Directors and major shareholders (individuals only) of the Company
The year ended December 31, 2012 The year ended December 31, 2013
Transactionamount
Consultingfee
(Note 2)\25 million
Transactionamount
Consultingfee
(Note 2)
\30 million($284
thousand)
Balance atDecember 31,
2012- -
Balance atDecember 31,
2013- -
Note 1.
Note 2.
of society-academia collaboration for innovation and participation in economic organizations.
22. Subsequent events(Special Dissolution of Employees’ Pension Fund)
for loss on dissolution of the employees’ pension fund” (Other expenses) for fiscal 2014.
subsidiary are members, resolved to adopt a policy to carry out a special dissolution at the representative assembly that took
The payment was determined on a negotiated basis.
(2) Related party transactions with consolidated subsidiaries of the Company that submitted consolidated financial statements
The above transaction amounts do not include consumption taxes, while the balance at December 31, 2012 andDecember 31, 2013 includes consumption taxes.
The consulting fee for Masao Horiba is compensation for management consulting services to the Company, activities
The payment was determined on a negotiated basis.
The above transaction amounts do not include consumption taxes, while the balance at December 31, 2012 andDecember 31, 2013 includes consumption taxes.
-
-
Advisor
2.8% (direct)Consulting contract
Account
Transaction conditions and policy on determining transaction conditions
2.8% (direct)Consulting contract
Transaction conditions and policy on determining transaction conditions
Transaction
Percentage of voting rights held
-
Business or occupation Advisor
Masao Horiba
Transaction
Account
Percentage of voting rights held
CategoryDirector's closefamily member
Transaction
Account
Relationship
3.0% (direct)Relationship Consulting contract
Percentage of voting rights heldRelationship
Amount of capital stock(millions of yen)
NameAddress
Amount of capital stock(millions of yen)
Business or occupation
Name
NameAddress
Amount of capital stock(millions of yen)
Business or occupation
Director's closefamily member
Category
The consulting fee for Masao Horiba is compensation for management consulting services to the Company, activities
-
-
Advisor
Consulting contract
Business or occupation Advisor
Percentage of voting rights held
CategoryDirector's closefamily member
CategoryDirector's closefamily member
Name Masao Horiba Masao Horiba
place on February 20, 2014.
Masao HoribaAddress -
Relationship
The Kyoto Machinery and Metal Employees’ Pension Fund (general type), of which the Company and a domestic consolidated
Address -
Amount of capital stock(millions of yen)
-
Transaction
Account
3.0% (direct)
Accordingly, HORIBA plans to post an approximately 2 billion yen estimated loss in association with the dissolution as “Provision
76HORIBA Report 2013 |

Financial data
77

HORIBA's corporate motto
“Joy and Fun”Originates from the bel ief that i f we take interest and pride in the work that occupies most of the active t ime in our l ives , in the place where we spend the large part of each day, then as a result our satisfaction with l i fe wil l increase, and we wil l be able to enjoy our l ives even more.
Taking interest and pride in our work leads us to “Joy and Fun.”
| Business Operations | We, at the HORIBA, apply
our most advanced analytical technologies to provide
highly original analytical and measuring products
and equipment in such fields as engine emissions,
scientific analysis, industrial and process control,
environment monitoring, semi-conductor process
control, medical and health-care, and biotechnology,
thereby contributing to the progress of science and
technology, improvement in the quality, development
and benefit of human health. We are engaging in the
new businesses for derivative and peripheral products
aim to develop scientific technology and improve
the life of the community, while at the same time
minimizing the impact on the environment.
We strictly abide by all environmental protection
laws and regulations in our business activities. In
addition, all HORIBA Group companies are required
to attain the highest levels of quality for establishing,
developing, and maintaining environmental systems,
including implementing internal control standards that
minimize the impact that our business activities have
on the environment.
We strive to deliver higher value-added
products and services in the shortest possible
time to customers all over the world, combining
the functions and specialties of development,
production, sales, and services from globally located
points throughout the world. Furthermore, we aim to
be the leader in the global market in the fields and
product segments in which we operate, to meet all
customers’ needs consistently, and to effectively
maximize our limited resources through a policy of
selective investment.
| Customer Responsiveness | We maintain a
philosophy of pursuing technology to the ultimate
degree in both the fundamental and applied
technology fields, supplying products that
continuously satisfy customers’ requirements. We
are committed to offering top-quality, highly reliable
products and services with a consistent level of
excellence throughout the world. We are obliged
to observe the highest standards for establishing,
developing, and maintaining quality control systems.
To provide products and services to customers in the
fastest delivery time possible, we have adopted the
slogan “Ultra-Quick Supplier” for all our activities. This
slogan encompasses not only production lead times
but also development, marketing and sales, service,
and control functions.
| Responsibility to Shareholders and Investors |Our basic policy is to calculate annual dividends
on an allocated rate of net income. Important
information regarding management and business
operations are fully disclosed on a regular basis
to shareholders and potential investors. A timely
responsive management control system should
be maintained by HORIBA Group companies to
ensure that company objectives are met, profit
generated and the information disclosed represents
the true performance of the company as well as its
management.
| Employees | We are proud of the entrepreneurial
spirit that led to the creation of HORIBA Group
companies. Each employee is made aware of this
heritage, and we actively encourage ideas and
innovations from individual employees. HORIBA
promotes an open and fair business environment
that allows all employees to achieve their individual
goals and maximize their potential. To further each
employee’s personal and professional growth, we
encourage thinking from a global perspective and
have established a global personnel development
program and performance evaluation system. We
value employees who challenge their personal
abilities and recognize their own accomplishments.
Corporate philosophy
78HORIBA Report 2013 |
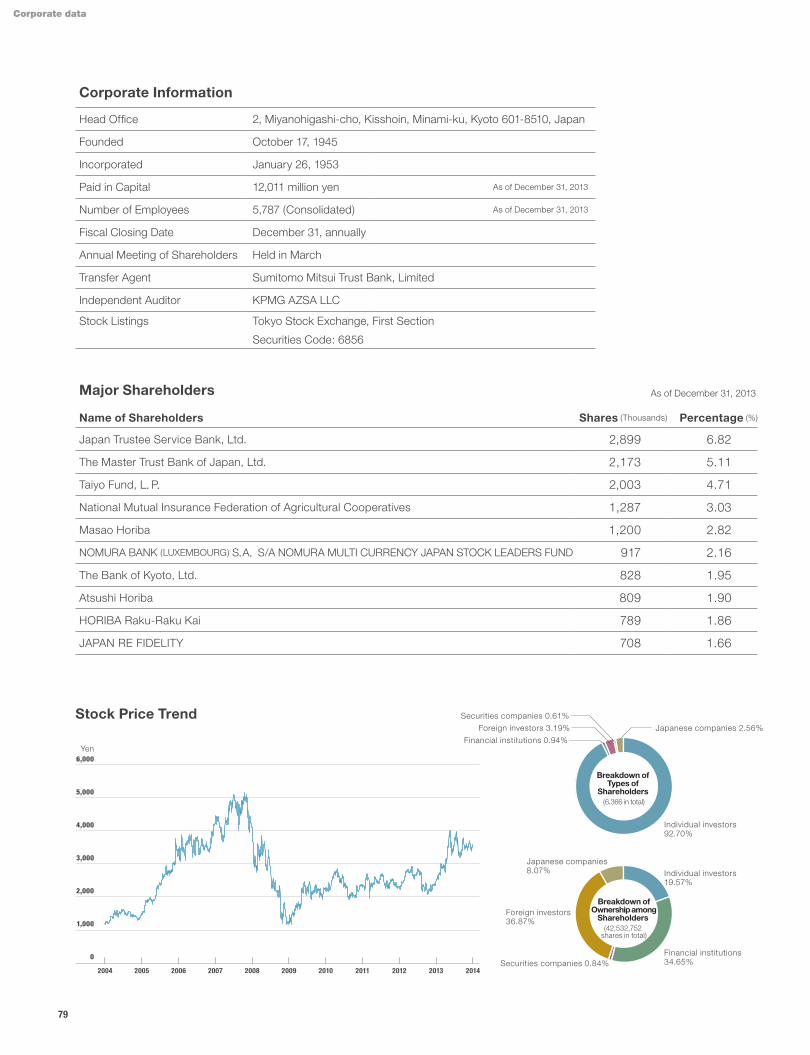
6,000
5,000
4,000
3,000
2,000
1,000
0
2004 2005 20072006 2008 2009 2010 2011 2012 2013
YenFinancial institutions 0.94%
Individual investors92.70%
Japanese companies 8.07% Individual investors
19.57%
Financial institutions34.65%Securities companies 0.84%
Foreign investors36.87%
Foreign investors 3.19% Japanese companies 2.56%
Securities companies 0.61%
2014
Breakdown of Types of
Shareholders (6,366 in total)
Breakdown of Ownership among
Shareholders (42,532,752
shares in total)
Stock Price Trend
Corporate Information
Head Office 2, Miyanohigashi-cho, Kisshoin, Minami-ku, Kyoto 601-8510, Japan
Founded October 17, 1945
Incorporated January 26, 1953
Paid in Capital 12,011 million yen As of December 31, 2013
Number of Employees 5,787 (Consolidated) As of December 31, 2013
Fiscal Closing Date December 31, annually
Annual Meeting of Shareholders Held in March
Transfer Agent Sumitomo Mitsui Trust Bank, Limited
Independent Auditor KPMG AZSA LLC
Stock Listings Tokyo Stock Exchange, First Section
Securities Code: 6856
Major Shareholders As of December 31, 2013
Name of Shareholders Shares (Thousands) Percentage (%)
Japan Trustee Service Bank, Ltd. 2,899 6.82
The Master Trust Bank of Japan, Ltd. 2,173 5.11
Taiyo Fund, L.P. 2,003 4.71
National Mutual Insurance Federation of Agricultural Cooperatives 1,287 3.03
Masao Horiba 1,200 2.82
NOMURA BANK (LUXEMBOURG) S.A. S/A NOMURA MULTI CURRENCY JAPAN STOCK LEADERS FUND 917 2.16
The Bank of Kyoto, Ltd. 828 1.95
Atsushi Horiba 809 1.90
HORIBA Raku-Raku Kai 789 1.86
JAPAN RE FIDELITY 708 1.66
79
Corporate data

HORIBA Report 2013
80HORIBA Report 2013 |
