financial documents 2007012015afr - thecb · john f. hernandez, chair 2008 nan mcraven, vice ......
TRANSCRIPT

Comprehensive Annual Financial Reportfor the fiscal year ended August 31, 2007
Austin Community College DistrictTexas

Austin Community College District Austin, Texas
COMPREHENSIVE ANNUAL FINANCIAL REPORT For the Fiscal Years Ended August 31, 2007 and 2006
Prepared by Business Services
Austin Community College District

Introductory Section
AUSTIN COMMUNITY COLLEGE DISTRICT Austin, Texas
TABLE OF CONTENTS
For The Fiscal Years Ended August 31, 2007 and 2006
i
PAGE EXHIBIT
INTRODUCTORY SECTION
Table of Contents...................................................................................... i-iii
Board of Trustees and Key Officers .......................................................... iv
Organizational Chart ................................................................................. v
Letter of Transmittal .................................................................................. vi-xii
Certificate of Achievement for Excellence in Financial Reporting............. xiii
FINANCIAL SECTION
Independent Auditors’ Report ................................................................... 1-2
Management’s Discussion and Analysis (Unaudited) ............................... 3-15
Basic Financial Statements
Statements of Net Assets ...................................................................... 16-17 1
Statements of Financial Position – ACC Foundation ............................. 18 1A
Statements of Revenues, Expenses and Changes in Net Assets ........ 19 2
Statements of Activities – ACC Foundation ........................................... 20 2A
Statements of Cash Flows ..................................................................... 21-22 3
Notes to the Basic Financial Statements .............................................. 23-51
SCHEDULES
Schedules Required by the Texas Higher Education Coordinating Board
Schedule of Operating Revenues .......................................................... 52 A
Schedule of Operating Expenses by Object .......................................... 53 B
Schedule of Non-Operating Revenues and Expenses........................... 54 C
Schedule of Net Assets by Source and Availability................................ 55 D
AUSTIN COMMUNITY COLLEGE DISTRICT Austin, Texas
TABLE OF CONTENTS
For The Fiscal Years Ended August 31, 2007 and 2006
ii
PAGE SCHEDULES
STATISTICAL SECTION (Unaudited)
Net Assets by Component ....................................................................... 57
Revenues by Source ................................................................................ 58
Program Expenses by Function ............................................................... 59
Tuition and Fees ...................................................................................... 60
State Appropriations per FTSE and Contact Hour ................................... 61
Assessed and Taxable Assessed Value of Property ............................... 62
Principal Tax Payers ................................................................................ 63-64
Property Tax Levies and Collections ........................................................ 65
Property Tax Rates – Direct and Overlapping .......................................... 66
Ratios of Outstanding Debt ....................................................................... 67
Ratios of Total Debt Service ..................................................................... 68
Legal Debt Margin Information.................................................................. 69
Direct and Overlapping Bonded Debt ....................................................... 70
Pledged Revenue Coverage .................................................................... 71
Demographic Economic Statistics ............................................................ 72
Principal Employers .................................................................................. 73
Faculty, Staff, and Administrators Statistics.............................................. 74
Enrollment Details ..................................................................................... 75-76
Student Profile .......................................................................................... 77-78
Transfers to Senior Institutions ................................................................ 79
Capital Asset Information ......................................................................... 80
AUSTIN COMMUNITY COLLEGE DISTRICT Austin, Texas
TABLE OF CONTENTS
For The Fiscal Years Ended August 31, 2007 and 2006
iii
PAGE SCHEDULES
FEDERAL AWARDS SECTION Independent Auditors’ Report on Internal Control over Financial Reporting and on Compliance and Other Matters Based on an Audit of Financial Statements Performed and In Accordance With Government Auditing Standards .................................................................................
81-82
Independent Auditors’ Report on Compliance with Requirements Applicable to Each Major Federal Program and on Internal Control over Compliance in Accordance With OMB Circular A-133 ...................
83-84
Schedule of Expenditures of Federal Awards........................................... 85-86 E
Notes to the Schedule of Expenditures of Federal Awards....................... 87-88
Schedule of Federal Findings and Questioned Costs............................... 89-90
STATE AWARDS SECTION
Independent Auditors Report on Compliance with Requirements Applicable to Each Major State Program and on Internal Control over Compliance in Accordance with State of Texas Single Audit Circular
91-92
Schedule of Expenditures of State Awards............................................... 93 F
Notes to the Schedule of Expenditures of State Awards .......................... 94
Schedule of State Findings and Questioned Costs................................... 95-96
AUSTIN COMMUNITY COLLEGE DISTRICT Austin, Texas
BOARD OF TRUSTEES AND KEY OFFICERS
For The Fiscal Years Ended August 31, 2007 and 2006
iv
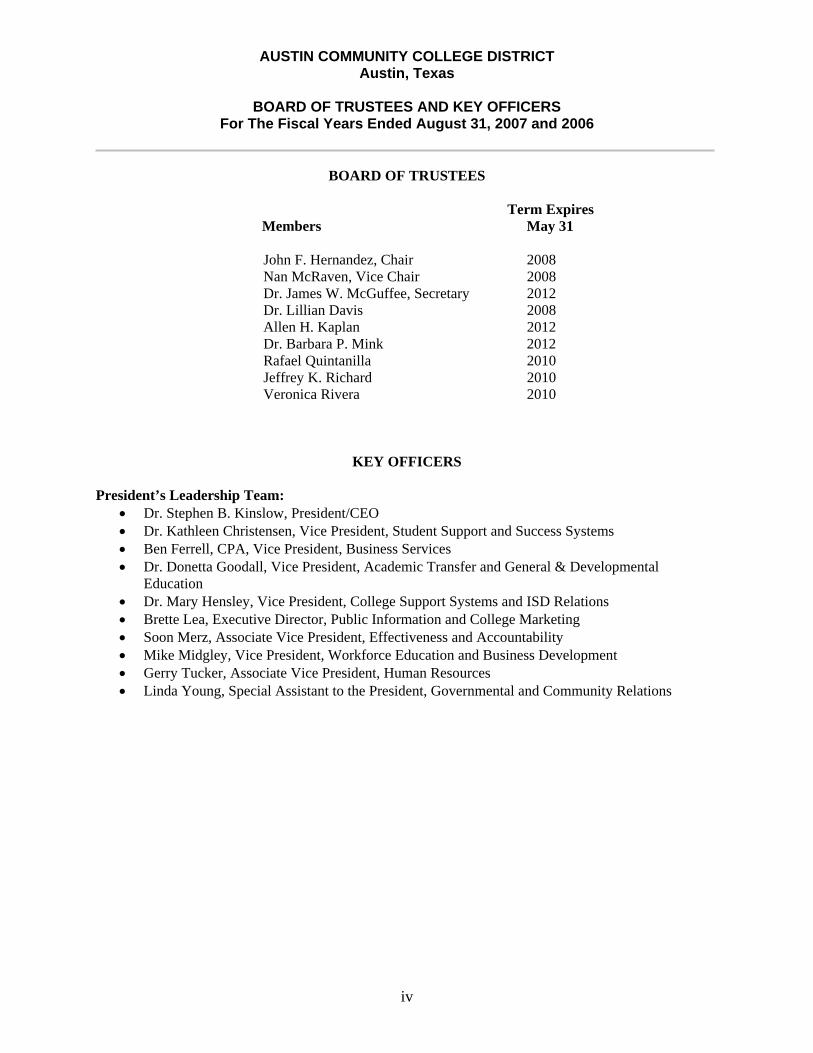
BOARD OF TRUSTEES
Term Expires Members May 31
John F. Hernandez, Chair 2008 Nan McRaven, Vice Chair 2008 Dr. James W. McGuffee, Secretary 2012 Dr. Lillian Davis 2008 Allen H. Kaplan 2012 Dr. Barbara P. Mink 2012 Rafael Quintanilla 2010 Jeffrey K. Richard 2010 Veronica Rivera 2010
KEY OFFICERS
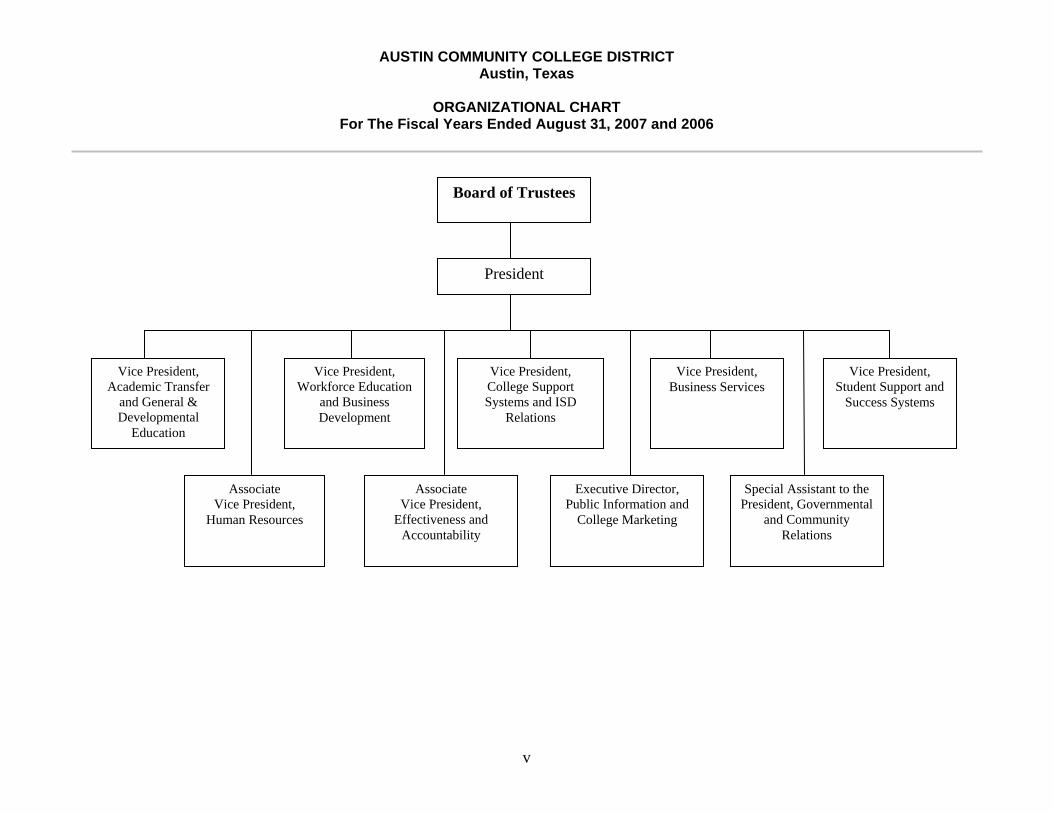
President’s Leadership Team: • Dr. Stephen B. Kinslow, President/CEO • Dr. Kathleen Christensen, Vice President, Student Support and Success Systems • Ben Ferrell, CPA, Vice President, Business Services • Dr. Donetta Goodall, Vice President, Academic Transfer and General & Developmental
Education • Dr. Mary Hensley, Vice President, College Support Systems and ISD Relations • Brette Lea, Executive Director, Public Information and College Marketing • Soon Merz, Associate Vice President, Effectiveness and Accountability • Mike Midgley, Vice President, Workforce Education and Business Development • Gerry Tucker, Associate Vice President, Human Resources • Linda Young, Special Assistant to the President, Governmental and Community Relations
AUSTIN COMMUNITY COLLEGE DISTRICT Austin, Texas
ORGANIZATIONAL CHART
For The Fiscal Years Ended August 31, 2007 and 2006
v
Board of Trustees
President
Vice President, Academic Transfer
and General & Developmental
Education
Vice President, Student Support and
Success Systems
Vice President, Business Services
Vice President, Workforce Education
and Business Development
Vice President, College Support Systems and ISD
Relations
Associate Vice President,
Human Resources
Associate Vice President,
Effectiveness and Accountability
Executive Director, Public Information and
College Marketing
Special Assistant to the President, Governmental
and Community Relations
vi
November 30, 2007 Honorable Chairman, Board of Trustees, and President The Citizens of the Austin Community College District Dear Board Members and President: The following comprehensive annual financial report of the Austin Community College District (“the College”) for the fiscal year ended August 31, 2007, is hereby submitted. Responsibility for the preparation and integrity of the financial information, and the completeness and fairness of the presentation, including all disclosures, rests with the College. The financial statements are prepared in accordance with Generally Accepted Accounting Principles (GAAP) as established by the Governmental Accounting Standards Board (GASB) and comply with Annual Financial Reporting Requirements for Texas Public Community and Junior Colleges as set forth by the Texas Higher Education Coordinating Board (THECB). The Notes to the Financial Statements are provided in the financial section and are considered essential to fair presentation and adequate disclosure for this financial report. The notes include the Summary of Significant Accounting Policies for the College and other necessary disclosures of important matters relating to the financial position of the College. The notes are treated as an integral part of the financial statements and should be read in conjunction with them. The College is reporting as a special purpose government engaged solely in business type activity (BTA). In accordance with GASB Statements 34 and 35, this presentation of financial reporting combines all fund groups into a single column, and resembles the format of the corporate presentation, thus facilitating comparison. To the best of our knowledge, the enclosed data are accurate in all material respects and are reported in a manner designed to present fairly the financial position and results of operations of the College. All disclosures necessary to enable the reader to gain an understanding of the District’s financial activities have been included. The College is required to undergo an annual federal single audit in conformity with the provisions of the Single Audit Act Amendments of 1996, and U.S. Office of Management and Budget Circular A-133, Audits of States, Local Governments and Non-Profit Organizations, and an annual state single audit in conformity with the Texas Governor’s Office of Budget and Planning Uniform Grant Management Standards Single Audit Circular. Information related to these single audits, including the schedule of federal expenditures of awards, schedule of state expenditures of awards, and auditors’ reports on compliance and on internal controls is included in the federal and state single audit sections of this report.
Dr. Steve Kinslow, President/CEO
5930 Middle Fiskville Road • Austin, Texas 78752-4390 • 512.223.7000
vii
Governmental Structure The Austin Community College District was established as a public community college in 1973. The College operates as a community college district under the Constitution of the State of Texas and the Texas Education Code. The College is governed by an elected nine-member, Board of Trustees (hereinafter called the “Board”). At each election, three Trustees are elected to serve in a six-year, at-large position. The Board holds regularly scheduled meetings on the first Monday of each month, and a work session on the third Monday of each month, unless otherwise announced. Board meetings are held in the Boardroom at the College’s administrative office building (Highland Business Center), unless otherwise provided in the notice of a meeting. The Board has the final authority to determine and interpret the policies that govern the College and has oversight responsibility of the College’s activities limited only by the state legislature, the courts, and the will of the people as expressed in Board of Trustee elections. Official Board action is taken only in meetings that comply with the Open Meetings Act. In general, the Board provides policy direction and sets goals for the College consistent with the College’s role and mission. Besides general Board business, trustees are charged with numerous statutory regulations, including appointing the tax assessor/collector, ordering elections, and issuing bonds. The Board is also responsible for appointing the President, setting the tax rate, and adopting the budget for the ensuing fiscal year. Mission and Values Austin Community College District, a comprehensive two-year institution established in 1973, is dedicated to providing quality education that exceeds the expectations of its service area as defined by Texas Education Code 130.166. This service area includes all of Bastrop, Hays, Gillespie, Caldwell, and Blanco counties, most of Travis county, and part of Williamson, Gonzales and Guadalupe counties. Accordingly, the vision statement is as follows: “As a team, we will provide access to educational excellence and serve our students and community with passion and commitment.” Furthermore, Austin Community College is committed to:
• Communication – belief in an environment that promotes an open and responsible exchange of ideas;
• Access – belief in providing educational opportunities for all members of the community; • Responsiveness – belief in targeting actions to address service area and internal needs
within available resources; • Excellence – belief in a commitment to integrity and exemplary standards in educational
programs and services to students, faculty, and staff; and • Stewardship – belief in personal and professional ownership that generates
accountability.
viii
Economic Condition and Outlook Travis and Williamson Counties, the primary counties in the College’s taxing district, are located in Central Texas, 150 miles inland from the Gulf of Mexico. According to the US Census Bureau, the population in 2006 of Travis and Williamson Counties was 1,274,836, an increase of 20% since 2000. Growth in these counties is expected to continue at this rate or faster in the future. Austin is the state capital, and consequently 16% of its workforce is employed with state and local government agencies. The remainder of the county’s economic base consists of manufacturing, computer technology, and trade and service industries. Travis County and the surrounding region are recovering well from an economic downturn which adversely impacted local employment in the high tech sector. According to the Texas Workforce Commission, the regional civilian workforce had increased 1.6% from 525,149 in 2006 to 533,396 in 2007. The unemployment rate in 2007 was 3.9%, which is slightly lower than the statewide unemployment rate of 4.8%. According to the 2000 census, residents of Travis County are typically well educated, with 40.6% of the workforce population over 25 possessing a bachelor’s degree or higher. As the high tech industries continue to rebound, there should once again prove to be a valuable resource of skilled professionals. The College is optimistic that Travis County and the surrounding areas will continue to prosper. During the past three years, the College experienced significant improvements in its financial condition, more than doubling unrestricted net assets in each of those three years. This is due to a commitment from the Board and administration to sound financial planning and budget performance. The College has increased its use of long-term planning and financial forecasting which has improved the decision making process. At the same time, the College has benefited from a strong local economy, record enrollments, and favorable annexations. State funding continues to be a concern, and while the College will benefit from a 12% increase in state funding for the upcoming 2008-2009 biennium; this amount will still be less per contact hour than the College was receiving in 2000. The College is committed to the legislative process, and will continue to work with State leaders to inform them of the crucial role of community colleges for the State’s economic and social well-being. Major Initiatives The College has devoted significant time and effort in planning for the future. During 2007 the College continued major construction and renovation projects as defined in its current facilities master plan in order to provide space for ten thousand additional students by 2010 to meet the state’s Closing the Gaps initiative of increasing participation in higher education. In 2007, the College clearly emerged as the regional leader in the Closing the Gaps effort to promote economic development through an educated workforce. Unique and innovative programs such as the College Connection, which automatically admits area graduating high school seniors to the College, helped increase enrollment, particularly among traditionally under-represented students. College Connection has received national recognition and is being emulated by other community colleges in Texas and other states. Other major initiatives that highlighted 2007 include:
• Opened the College’s seventh campus, the South Austin Campus, to serve the higher education needs of the growing South Austin community;
ix
• Opened a major addition to the Cypress Creek Campus, nearly doubling the campus’ enrollment capacity.
• Established Weekend College programs to enable students to earn degrees solely in weekend classes.
• Increased participation in summer bridge programs to provide intensive instruction to help new high school graduates become college ready;
• Expanded College Connection to reach more than 12,000 students in 22 school districts, and, in conjunction with the Texas Higher Education Coordinating Board, began training other Texas Community Colleges in establishing the program.
• Partnered with the University of Texas at Austin and Austin Area Research Organization to create the E3 Alliance – a collaborative to increase economic outcomes by aligning education systems;
• Expanded the Mobile Go Center program, a high-tech mobile recruiting facility that will travel the District’s service area, in conjunction with the state’s College for All Texans and Closing The Gaps initiatives, and with grants from AMD and the AT&T Foundation, to reach parents and middle school and high school students who might be unlikely to attend college; and,
• Increasing initiatives by the Austin Community College Foundation to enhance giving to the District for scholarships, endowments, and capital improvements.
The College is moving ahead with significant plans for expansion thanks to its community support, and expects to maintain its role as a major source of post-secondary education and economic development in the Central Texas region. For 2008, the College plans to further develop its strategic academic and facilities planning for the region, which will include vigorously pursuing expansion of its taxing district through annexation. Long-Term Financial Planning The College’s financial planning is comprised of three planning processes:
• Twenty Year Facilities Plan • Three Year Master Plan • Annual Budget, including 10 year projections
The College recently developed a 20 year regional facilities master plan designed specifically to address the College’s Closing the Gaps target, which calls for an additional 20,000 students by the year 2025. The plan includes six recommendations for meeting this demand, all of which were adopted by the Board:
1) Approve land acquisition for a campus in Round Rock; 2) Hire an A/E firm to begin the design of a campus in Round Rock; 3) Reaffirm master plan recommendation for a campus in San Marcos; 4) Form a Public Facilities Corporation (PFC) to finance new campuses; 5) Pursue land donations and/or purchases in strategic areas with future growth potential; 6) Develop individual master plans for expansion and renovations at existing campuses.
The recommendations along with the major instructional and operational initiatives are incorporated into a three year master plan, which is driven by strategic goals developed by the President and approved by the Board. This is a rolling three year plan that is updated annually
x
prior to the annual budget cycle. This master plan identifies the initiatives that the college will focus on for the next three years, and therefore drive the annual budget decisions. The annual budget is developed with a bottom-up approach with the approved master plan serving as a guide. During the budget development cycle, departments are asked to identify the funds needed in their departmental budgets in order to accomplish the goals laid out in the master plan. After this information is collected from the departments, it is compiled into a proposed college-wide budget. The budget is then presented to the Board, including budget projections for the next 10 years. These projections incorporate the proposed new initiatives and other operating increases in order to demonstrate the long-term impact of the current year funding decisions. It also projects future tuition rate increases. The combined use of these three planning devices allows the College to develop funding strategies to meet the future expenditure needs, and maintain a strong financial balance. Due to the College’s commitment to planning, in the last three years the College has met the demands of record enrollment increases, increased programs and service available to students, and all while increasing its net assets each year. Financial Information Internal Controls: College management is responsible for establishing and maintaining internal controls designed to ensure that the assets of the College are protected from loss, theft, or misuse and to ensure that adequate accounting data are compiled to allow for the preparation of financial statements in conformity with generally accepted accounting principles. The internal controls are designed to provide reasonable, but not absolute, assurance that these objectives are met. The concept of reasonable assurance recognizes that: (1) the cost of a control should not exceed the benefits likely to be derived; and (2) the valuation of costs and benefits requires estimates and judgments by management. Single Audit: As a recipient of federal, state, and local financial assistance, the College also is responsible for ensuring that adequate internal control is in place to ensure compliance with applicable laws and regulations related to those programs. This internal control is subject to periodic evaluation by management and the independent auditors of the College. As a part of the College’s single audits, described earlier, tests are made to determine the adequacy of the internal control, including that portion related to federal and state awards programs, as well as to determine that the College has complied with applicable laws and regulations. The results of the College’s single audits for the fiscal year ended August 31, 2007, provided no instances of material weaknesses in internal control. Budgeting Controls: The College continues to apply budgetary controls and accounting on a fund basis. The objective of these budgetary controls is to ensure compliance with legal provisions embodied in the annual appropriated budget approved by the College’s Board of Trustees. Activities of the unrestricted current fund, auxiliary enterprises fund, and retirement of indebtedness fund are included in the annual appropriated budget. The College also maintains an encumbrance accounting system as one technique of accomplishing budgetary control. Encumbered amounts roll over into the next year, but are generally not re-appropriated as part of the next year’s budget. Typically, departments will be expected to fund encumbrances that have rolled out of their next year’s budget. For this reason departments are encouraged plan their purchases so that items will be received, and therefore expensed, prior to the end of the fiscal year.
xi
As demonstrated by the statements and schedules included in the financial section of this report, the College continues to meet its responsibility for sound financial management. Please refer to the Management’s Discussion and Analysis for more information on the College’s financial activity and position. Cash Management The College uses an external investment management firm to invest College funds in accordance with the Texas Public Funds Investment Act. As of August 31, 2007 the College’s portfolio was comprised of 2.9% Bankers’ Acceptances, 4.1% Commercial Paper, 4.8% US Treasuries, 39.8% Federal Agencies, and 48.4% TexPool, a state sponsored money market fund. The College uses the Merrill Lynch 0-6 Month Treasury Bill Index as its yield benchmark. The College’s annualized return for 2007 was 5.66% compared to the benchmark of 5.20%. The College earned interest revenue of $4,886,869 on all investments for fiscal year 2007. The College’s investment policy, which is reviewed and updated annually, is designed to minimize credit and market risks while maintaining a competitive yield on the portfolio. Accordingly, bank deposits were either insured by federal depository insurance or collateralized throughout the year. Notes 3 and 4 to the Financial Statements provides details of the College’s investment portfolio and more fully describes the credit risk. Risk Management Risk Management is the ongoing process by which financial loss and exposure to risk is assessed and action is taken to minimize risk, to transfer risk, and to finance risk through various devices, including insurance. All areas of the College are reviewed for possible risk management and loss-control activities. The Vice President for Business Services is responsible for recommending to the President and the Board the amounts of insurance the College should carry and the amount of risk the College should assume through coinsurance and deductibles. Insurance coverage includes: Property; Crime; General Liability, Educators Liability, Employee Dishonesty Coverage, Police Liability, Automobile Liability, and Excess Liability; Student Travel; Student Accident; International Travel; Dental Clinical Liability and Medical Professional Liability; Accident Insurance for Children at Daycare Centers; Unemployment Compensation, and Workers’ Compensation. Additionally, all eligible employees are provided with paid medical, dental, life, and accidental and dismemberment insurance. Dependent coverage is available at group rates. For unemployment compensation, the College elects to participate in a program administered by the Texas Association of School Boards (TASB) rather than being a taxing employer with rates set by the Texas Employment Commission. Rates are factored according to the experience and size of the College. The program is a form of self-insurance with stop-loss coverage. The College participates in a workers’ compensation insurance program that is administered by Deep East Texas Self-Insurance Fund. The College pays a fixed premium for the losses, claims administration, and loss control activities.
xii
Independent Audit State statutes require an annual audit by independent certified public accountants. The College’s Board of Trustees selected the accounting firm of McConnell & Jones LLP. In addition to meeting the requirements set forth in state statutes, their audit also was designed to meet the requirements of the Federal Single Audit Act Amendments of 1996 and related OMB Circular A-133 and the state single audit related to the Uniform Grant Management Standards Single Audit Circular. The auditors’ reports related specifically to the Single Audits are included in the Single Audit Section. Awards The Government Finance Officers Association of the United States and Canada (GFOA) awarded a Certificate of Achievement for Excellence in Financial Reporting to Austin Community College District for its comprehensive annual financial report for the fiscal year ended August 31, 2006. This was the fourth consecutive year that the College has achieved this prestigious award. In order to be awarded a Certificate of Achievement, a government must publish an easily readable and efficiently organized comprehensive annual financial report. This report must satisfy both generally accepted accounting principles and applicable legal requirements. A certificate of Achievement is valid for a period of one year only. We believe that our current comprehensive annual financial report continues to meet the Certificate of Achievement Program’s requirements and we are submitting it to the GFOA to determine its eligibility for another certificate. Acknowledgements We are grateful to the Board of Trustees for its interest in planning and oversight of the financial operations of the College. We especially want to acknowledge the staff of Business Services for their hard work and dedicated service, for we could not have accomplished the preparation of this report without their diligent efforts. We would also like to thank the accounting firm of McConnell & Jones LLP for their assistance with the audit. Respectively submitted, ____________________________ ____________________________ Ben Ferrell, C.P.A. Neil Vickers, C.P.A. Vice President, Business Services Associate Vice President, Finance & Budget
xiii

Financial Section
MANAGEMENT’S DISCUSSION AND ANALYSIS
AUSTIN COMMUNITY COLLEGE DISTRICT Austin, Texas
MANAGEMENT’S DISCUSSION AND ANALYSIS
(UNAUDITED)
3
Financial Statement Analysis and Overview The following discussion and analysis of the Austin Community College District’s (“the College”) annual financial statements provides an overview of the College’s financial activities for the years ended August 31, 2007 (Fiscal Year 2007), 2006 (Fiscal Year 2006), and 2005 (Fiscal Year 2005), and identifies changes in its financial position for these years. In conformity with Government Accounting Standards Board (GASB) Statement No. 34, the discussion focuses on currently known facts, decisions, and conditions that have an impact on the financial activities of the College and is intended to assist the reader in the interpretation of the financial statements. The financial statements should be read in conjunction with the notes to the basic financial statements. The financial statements are prepared in accordance with the GASB Statement No. 34, Basic Financial Statements and Management's Discussion and Analysis for State and Local Governments and Statement No. 35, Basic Financial Statements and Management's Discussion and Analysis for Public Colleges and Universities. Three primary statements are required: the Statement of Net Assets; the Statement of Revenues, Expenses, and Changes in Net Assets; and the Statement of Cash Flows. Financial statements for the College’s component unit, Austin Community College Foundation (“the Foundation”), are issued independent of the College. The Foundation’s financial information for fiscal years 2007 and 2006 is shown on separate pages behind the College’s basic financial statements. Refer to Notes 1 and 23 in the Notes to Financial Statements for more detail on the Foundation. The following summary and management discussion and analysis of the results is intended to provide readers with an overview of the basic financial statements. Some of the financial highlights of fiscal year 2007 are as follows:
• Assets of the College exceeded liabilities at the close of the fiscal year ending on August 31, 2007 by $69.3 million. Of this amount, $19.8 million (unrestricted net assets) may be used to meet the College’s ongoing obligations.
• At the end of the current fiscal year, total college revenues exceeded total expenses by
$14.7 million, primarily as a result of increasing tax revenues along with more conservative fiscal management.
Statement of Net Assets The Statement of Net Assets presents all of the College’s assets and liabilities, and change in net assets as of the end of the fiscal year. The statement is prepared under the accrual basis of accounting, in which revenues and assets are recognized when earned, and expenses and liabilities are recognized when incurred regardless of when cash is received or paid. The difference between total assets and total liabilities – net assets – is one indicator of whether the overall financial condition has improved or deteriorated during the year when considered with

AUSTIN COMMUNITY COLLEGE DISTRICT Austin, Texas
MANAGEMENT’S DISCUSSION AND ANALYSIS
(UNAUDITED)
4
other factors such as enrollment, contact hours of instruction, student retention and other non-financial information. Finally, the Statement of Net Assets is useful in determining the assets available to continue operations as well as how much the College owes to vendors, bondholders, and other entities at the end of the year. The Statement of Net Assets includes assets and liabilities, both current and non-current, and net assets. Current assets are those assets that are available to satisfy current liabilities, or liabilities that are due within one year. Non-current assets include capital assets, long-term investments, and other assets not classified as current. Non-current liabilities include bonds payable and other long-term commitments. Net Assets are divided into three major categories. The first category, “Invested in Capital Assets Net of Related Debt,” represents the College’s equity in property, plant and equipment owned by the institution. The next category is “Restricted Net Assets” which is further divided into two categories: Nonexpendable and Expendable. Expendable restricted net assets are available for expenditures but must be spent in accordance with the restrictions of donors and other external entities. The final category, “Unrestricted Net Assets” is assets available to the institution for any lawful purpose of the College. Further detail regarding assets, liabilities, and net assets is presented in the Statement of Net Assets and notes to the financial statements.
CONDENSED FINANCIAL INFORMATION
Condensed Statement of Net Assets (in Millions)
2007 2006 20052006 to
20072005 to
2006AssetsCurrent Assets 67.7$ 49.1$ 36.9$ 18.6$ 12.2$ Capital Assets, Net of Accumulated Depreciation 157.4 148.0 124.7 9.4 23.3 Other Noncurrent Assets 42.4 57.5 82.9 (15.1) (25.4)
Total Assets 267.5 254.6 244.5 12.9 10.1
LiabilitiesCurrent Liabilities 46.5 45.3 36.5 1.2 8.8 Noncurrent Liabilities 151.7 154.7 157.2 (3.0) (2.5)
Total Liabilities 198.2 200.0 193.7 (1.8) 6.3
Net AssetsInvested in Capital Assets, Net of Related Debt 43.8 40.1 41.8 3.7 (1.7) Restricted: Expendable 5.6 5.7 4.9 (0.1) 0.8 Unrestricted 19.9 8.8 4.1 11.1 4.7
Total Net Assets 69.3$ 54.6$ 50.8$ 14.7$ 3.8$
August 31 Change

AUSTIN COMMUNITY COLLEGE DISTRICT Austin, Texas
MANAGEMENT’S DISCUSSION AND ANALYSIS
(UNAUDITED)
5
Total Assets increased by $12.9 million. The majority of the increase was due to the addition of unrestricted cash and cash equivalents in the amount of $14.8 million, which consisted of the $11.0 million increase in unrestricted net assets, plus an increase of $3 million in Fall 2007 tuition and fees which is offset by an increase in deferred revenues. Since 2005, the College has increased its overall total assets before considering liabilities by $23.0 million, most of which is from increases in unrestricted cash due to strong performance of the operating budget over the last 3 years. Total liabilities decreased by $1.8 million. The decrease in liabilities was a result of the bank overdraft decreasing by $2.1 million and bonds and notes payable decreasing by $1.5 million. This decrease was partially offset by an increase in deferred revenue of $2.2 million. Bank overdrafts are attributable to timing differences between recordings in the College’s general ledger compared to the bank for deposits and disbursements in transit. Bonds and notes payables decreased due to principal payment during the year. Deferred revenues increased by $2.2 million in the current year due to increases in enrollments and out-of-district tuition rates for Fall 2007. The College’s net assets (assets less liabilities) increased by $14.7 million from the previous year. Specifically, net assets were $69.3 million in 2007, $54.6 million in 2006 and $50.8 million in 2005. The increase in net assets is a result of revenues earned exceeding expenses incurred. We attribute the increase to the fact that enrollments, and therefore tuition revenue, exceeded projections by $2.3 million, property taxes exceeded projections by $3.4 million, investment income performed better than anticipated resulting in a $1.6 million increase, and a $2.8 million increase in other operating revenues. In addition, we were able to control expenses which finished the year $4.5 million under budget. Compared to the two previous years, the College performed better in 2007. In 2006, net assets increased by $3.8 million and decreased by $0.9 million in 2005. A more detailed discussion follows the Statement of Revenues, Expenses, and Changes in Net Assets. Statement of Revenues, Expenses, and Changes in Net Assets The Statement of Revenues, Expenses and Changes in Net Assets presents the College’s overall results of operations. The statement is divided into Operating Revenues and Expenses and Non-Operating Revenues and Expenses. The College is primarily dependent upon three sources of revenue: state appropriations; tuition and fees; and property taxes. Since state appropriations and property taxes are classified as Non-operating Revenues (per the GASB requirement), Texas community colleges will generally display an operating deficit before taking into account other support. Therefore, total revenues and total expenses should be considered in assessing the change in the College’s financial position.
AUSTIN COMMUNITY COLLEGE DISTRICT Austin, Texas
MANAGEMENT’S DISCUSSION AND ANALYSIS
(UNAUDITED)
6
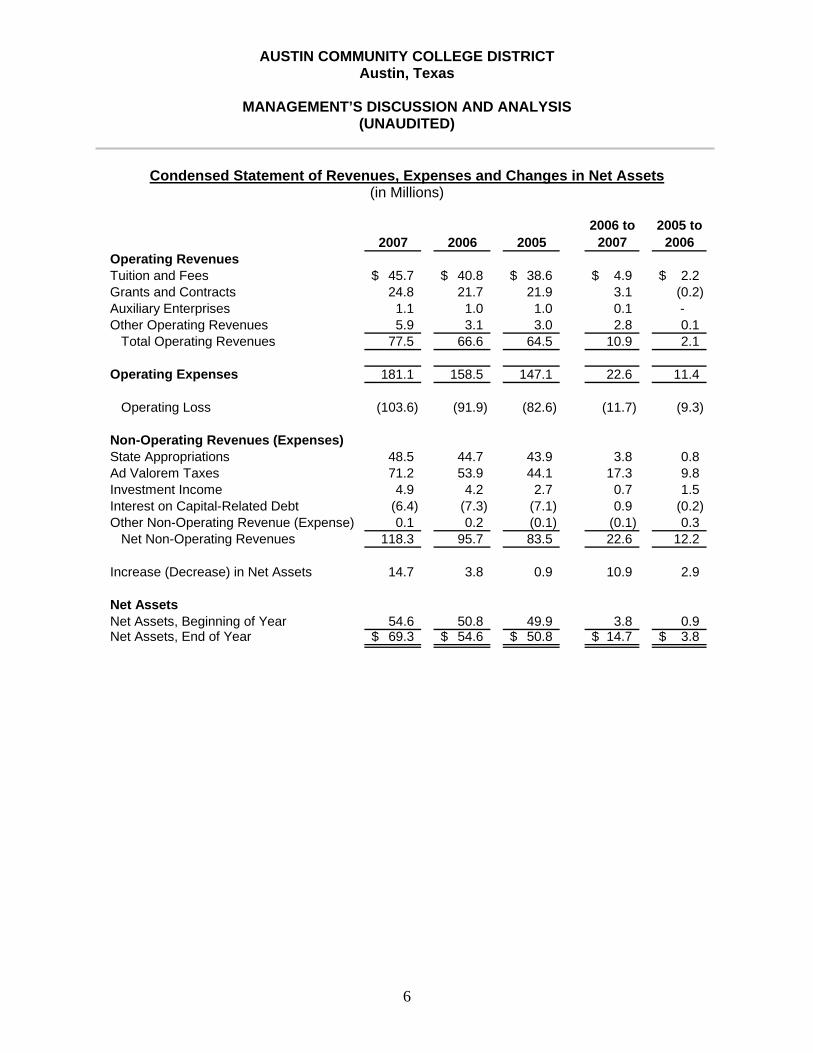
Condensed Statement of Revenues, Expenses and Changes in Net Assets (in Millions)
2007 2006 20052006 to
20072005 to
2006Operating RevenuesTuition and Fees 45.7$ 40.8$ 38.6$ 4.9$ 2.2$ Grants and Contracts 24.8 21.7 21.9 3.1 (0.2) Auxiliary Enterprises 1.1 1.0 1.0 0.1 - Other Operating Revenues 5.9 3.1 3.0 2.8 0.1
Total Operating Revenues 77.5 66.6 64.5 10.9 2.1
Operating Expenses 181.1 158.5 147.1 22.6 11.4
Operating Loss (103.6) (91.9) (82.6) (11.7) (9.3)
Non-Operating Revenues (Expenses)State Appropriations 48.5 44.7 43.9 3.8 0.8 Ad Valorem Taxes 71.2 53.9 44.1 17.3 9.8 Investment Income 4.9 4.2 2.7 0.7 1.5 Interest on Capital-Related Debt (6.4) (7.3) (7.1) 0.9 (0.2) Other Non-Operating Revenue (Expense) 0.1 0.2 (0.1) (0.1) 0.3
Net Non-Operating Revenues 118.3 95.7 83.5 22.6 12.2
Increase (Decrease) in Net Assets 14.7 3.8 0.9 10.9 2.9
Net AssetsNet Assets, Beginning of Year 54.6 50.8 49.9 3.8 0.9 Net Assets, End of Year 69.3$ 54.6$ 50.8$ 14.7$ 3.8$
AUSTIN COMMUNITY COLLEGE DISTRICT Austin, Texas
MANAGEMENT’S DISCUSSION AND ANALYSIS
(UNAUDITED)
7
Key Factors impacting total revenues:
• State appropriations increased to $48.5 million in fiscal year 2007 from $44.7 million in 2006. This increase is fully attributed to increases in the amount of State on-behalf payments for retirement and health benefits. State appropriations as a percent of total revenues have decreased over time as community colleges have become increasingly reliant on increases in tuition rates and property taxes to fund operations. State appropriations accounted for 24.0% of total revenue in 2007, compared to 26.4% of total revenue in 2006, and 28.2% in 2005.
• Tuition and fees were up $4.9 million as a result of enrollment increase of 4.0%, plus
tuition rate increases of $8 per hour for out-of-district and $62 per hour for out-of-state students. Tuition and Fees accounted for 22.6% of total revenue in the current year, compared to 24.1% in 2006 and 24.4% in 2005.
• Grants and Contracts revenue increased primarily as a result of increased funding for
Pell and other federal programs.
• Other Operating Revenue, which includes interest income, continuing education programs, miscellaneous fees, property rental, and testing fees, totaled $5.9 million in 2007, $3.1 million in 2006, and $3.0 million in 2005. The majority of the increase in 2007 was a result of a $1.8 million, one-time supplemental appropriation for State on-behalf health benefits in order to correct a misappropriation from the previous year.
• Property taxes, which are categorized as non-operating revenues, increased by $17.3
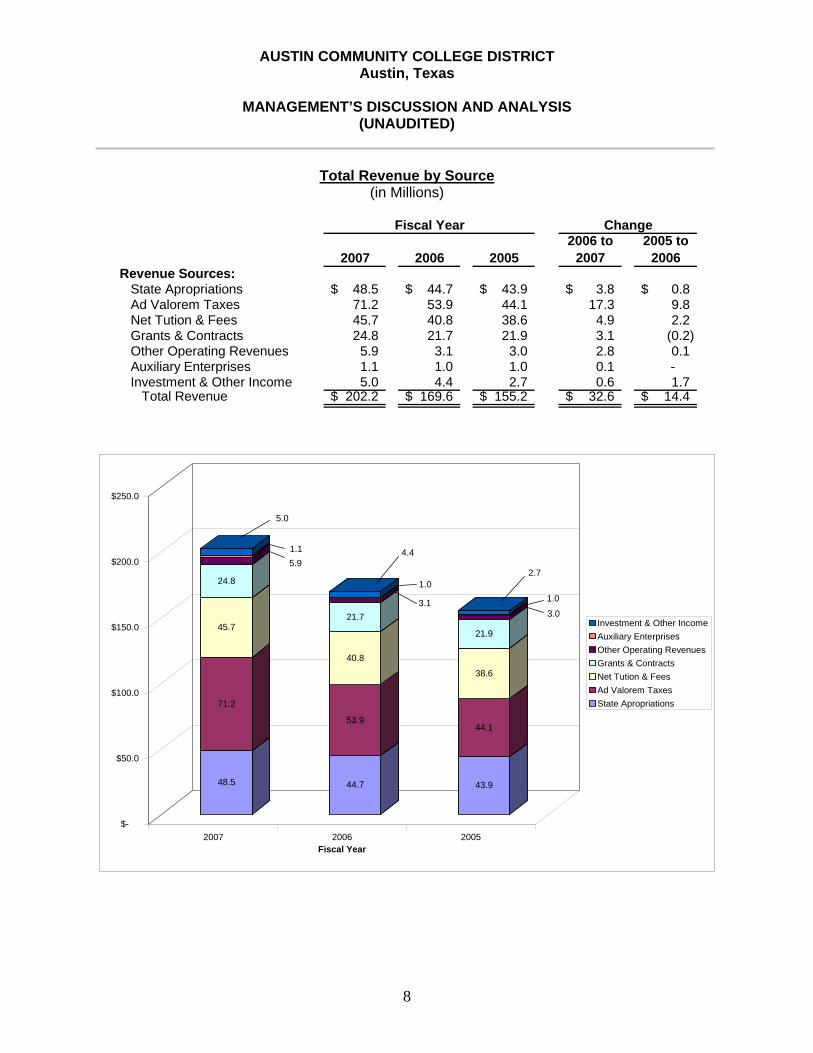
million in 2007, $9.8 million in 2006, and $7.0 million in 2005. Specifically, the College recognized $71.2 million of property tax revenue in 2007, $53.9 million in 2006, and $44.1 million in 2005. Property taxes were increased in 2007 as a consequence of the May 2005 special election in which the voters approved the annexation of the portions of the City of Austin that were not already in the College’s taxing district. This annexation added about $9 billion in taxable property values, which generated an additional $9 million in property tax revenues for 2007. The remainder of the increase in property tax revenues is attributed to the increase in appraised property values and new construction driven by a strong Austin economy. Property taxes in 2007 were 35.2% of total revenues compared to 31.8% of total revenues in 2006 and 28.3% of total revenues in 2005, respectively. See graphical illustration below.
AUSTIN COMMUNITY COLLEGE DISTRICT Austin, Texas
MANAGEMENT’S DISCUSSION AND ANALYSIS
(UNAUDITED)
8
Total Revenue by Source (in Millions)
2007 2006 20052006 to
20072005 to
2006Revenue Sources:
State Apropriations 48.5$ 44.7$ 43.9$ 3.8$ 0.8$ Ad Valorem Taxes 71.2 53.9 44.1 17.3 9.8 Net Tution & Fees 45.7 40.8 38.6 4.9 2.2 Grants & Contracts 24.8 21.7 21.9 3.1 (0.2) Other Operating Revenues 5.9 3.1 3.0 2.8 0.1 Auxiliary Enterprises 1.1 1.0 1.0 0.1 - Investment & Other Income 5.0 4.4 2.7 0.6 1.7
Total Revenue 202.2$ 169.6$ 155.2$ 32.6$ 14.4$
Fiscal Year Change
48.5
71.2
45.7
24.8
5.91.1
5.0
44.7
53.9
40.8
21.73.1
1.0
4.4
43.9
44.1
38.6
21.9
3.0
1.0
2.7
$-
$50.0
$100.0
$150.0
$200.0
$250.0
2007 2006 2005Fiscal Year
Investment & Other IncomeAuxiliary EnterprisesOther Operating RevenuesGrants & ContractsNet Tution & FeesAd Valorem TaxesState Apropriations
AUSTIN COMMUNITY COLLEGE DISTRICT Austin, Texas
MANAGEMENT’S DISCUSSION AND ANALYSIS
(UNAUDITED)
9
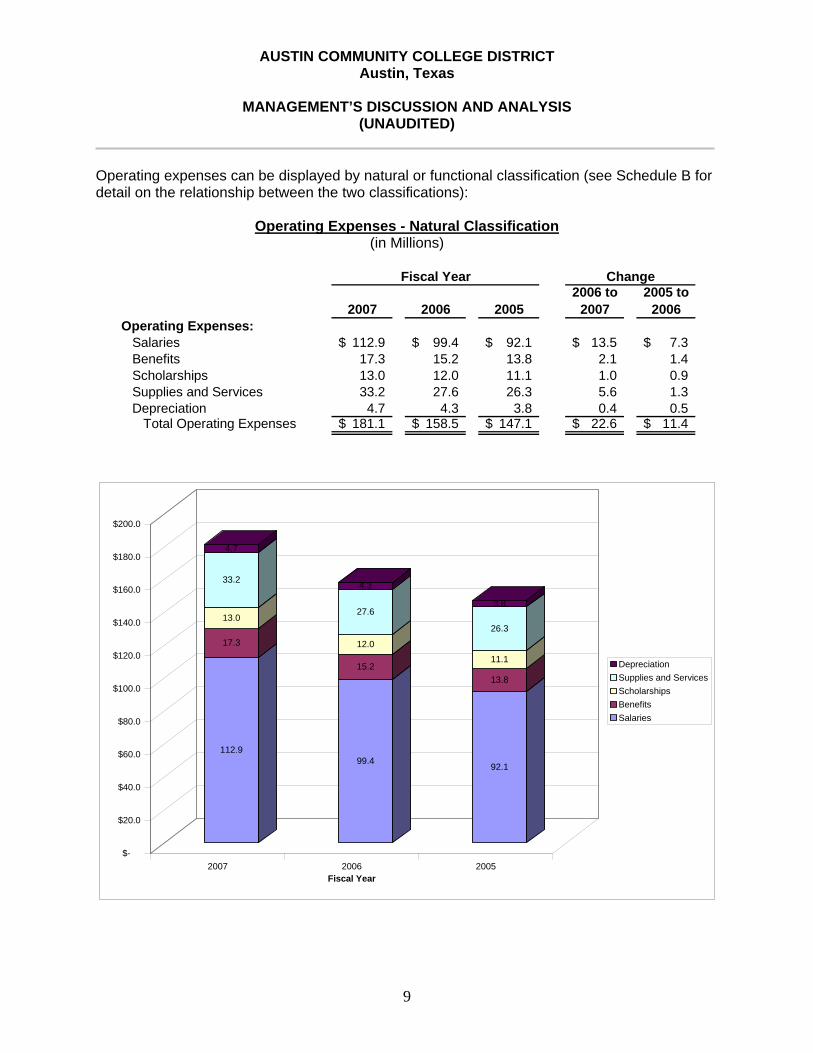
Operating expenses can be displayed by natural or functional classification (see Schedule B for detail on the relationship between the two classifications):
Operating Expenses - Natural Classification (in Millions)
2007 2006 20052006 to
20072005 to
2006Operating Expenses:
Salaries 112.9$ 99.4$ 92.1$ 13.5$ 7.3$ Benefits 17.3 15.2 13.8 2.1 1.4 Scholarships 13.0 12.0 11.1 1.0 0.9 Supplies and Services 33.2 27.6 26.3 5.6 1.3 Depreciation 4.7 4.3 3.8 0.4 0.5
Total Operating Expenses 181.1$ 158.5$ 147.1$ 22.6$ 11.4$
Fiscal Year Change
112.9
17.3
13.0
33.2
4.7
99.4
15.2
12.0
27.6
4.3
92.1
13.8
11.1
26.3
3.8
$-
$20.0
$40.0
$60.0
$80.0
$100.0
$120.0
$140.0
$160.0
$180.0
$200.0
2007 2006 2005Fiscal Year
DepreciationSupplies and ServicesScholarshipsBenefitsSalaries
AUSTIN COMMUNITY COLLEGE DISTRICT Austin, Texas
MANAGEMENT’S DISCUSSION AND ANALYSIS
(UNAUDITED)
10
Factors impacting operating expenses by natural classification include the following:
• Salary expense in 2007 increased by $13.5 million, a 13.6% increase over 2006. The increase was a result of employee salary increases of approximately $6.0 million, a $4.0 million increase in Adjunct Faculty salaries due to a 4.0% enrollment growth, and $3.5 million for newly created positions. Of the newly created positions, $1.5 million were F-T Faculty added to meet growing enrollment demands and the multi-year F-T Faculty Hiring Plan. The goal of this hiring plan is to reach and maintain an appropriate ratio of full-time to part-time faculty. The other $2.0 million in new positions were added to staff the College’s new South Austin Campus, the expansion of the Cypress Creek Campus, and the Weekend College initiative. Salary expense in 2006 increased by $7.3 million, a 7.9% increase over 2005. The increase was a result of employee salary increases of approximately $4.5 million, a $1.2 million increase in Adjunct Faculty salaries due to a 3.5% enrollment growth, and $1.6 million for newly created positions. Of the newly created positions, $0.8 million were F-T Faculty added to meet growing enrollment demands. The remaining $0.8 million in new positions were added to staff the College’s new South Austin Campus and the new Round Rock Higher Education Center. Salary expense in 2005 increased by $7.1 million, an 8.3% increase over 2004. The increase was a result of employee salary increases of approximately $5 million as well as $1.5 million in additional positions, and $0.6 million in faculty overloads and adjunct salaries due to a 1% growth in sections. Of the newly created positions, 16 were added to staff the College’s Health Science Center Phase II, while 20 positions were added college wide mostly to fill facility positions.
• Utility costs increased only slightly in 2007, well under projections. The College projected
an increase of $0.6 million, about 20%, due to the new South Austin Campus, expansion of the Cypress Creek Campus, and higher energy costs. These projected increases were largely defrayed by an unusually cool and wet summer. In both 2006 and 2005, utility costs increased by $0.3 million, or 13.0% and 15.0%, respectively. The increases were due to the opening of the Health Science Building Phase II which became operational in Summer 2005, as well as general increases in energy costs.
• Other operating expenses increased by $5.0 million in 2007. This increase was mainly
due to the equipping and operating the new South Austin Campus, expansion of the Cypress Creek Campus, and the new Weekend College initiative. In 2006 and 2005 the increase were $1.0 million, respectively. These increases are all attributed to higher enrollments, along with typical inflationary factors.
• Depreciation expense increased in 2007 by $0.4 million primarily due to the new South
Austin Campus. Depreciation expense increased by $0.5 million in 2006 due to the addition of the Health Science Building Phase II in Summer 2005.
• Total scholarship costs for 2007 were $13.0 million compared to $12.0 million in 2006
and $11.1 million in 2005. These increases are due to higher enrollments which increase the number of Federal Title IV awards. Scholarship allowances and discounts increased by $0.5 million which would be expected with higher enrollments and therefore higher
AUSTIN COMMUNITY COLLEGE DISTRICT Austin, Texas
MANAGEMENT’S DISCUSSION AND ANALYSIS
(UNAUDITED)
11
tuition revenue and scholarship expense. In 2006 and 2005, there was a decrease of $0.2 million and increase of $0.7 million, respectively.
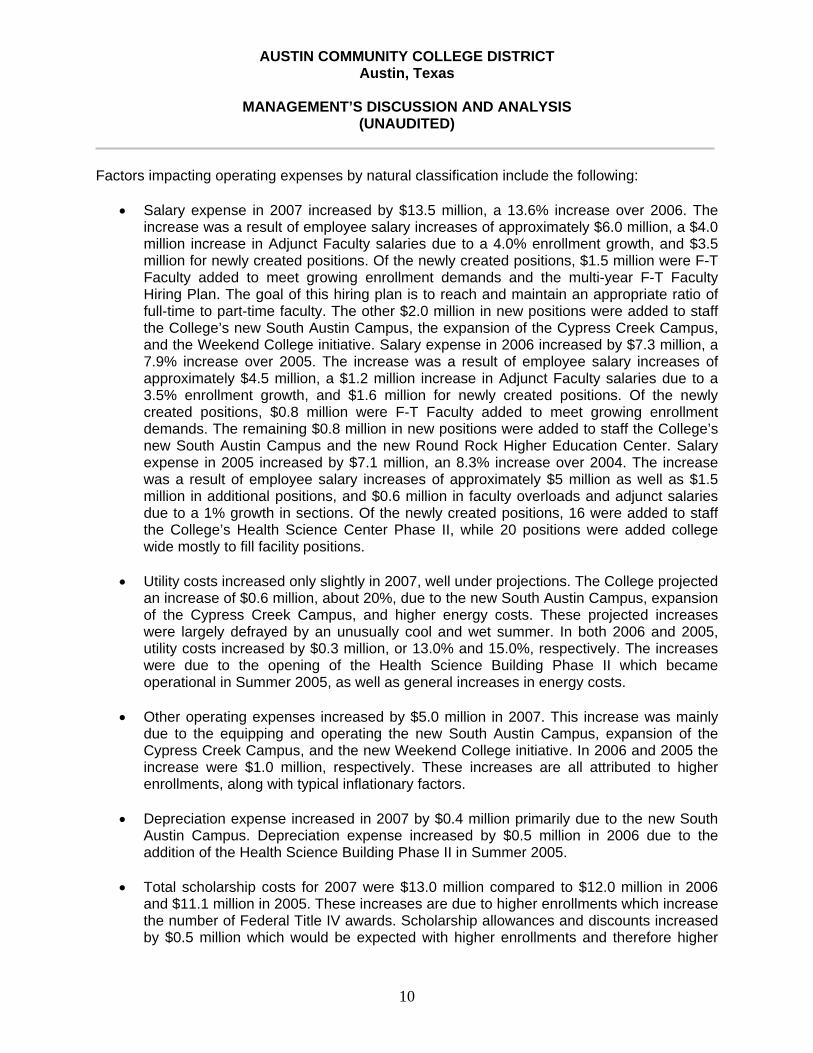
Operating Expenses - Functional Classification
(in Millions)
2007 2006 20052006 to
20072005 to
2006Operating Expenses:
Instruction 82.4$ 71.3$ 66.9$ 11.1$ 4.4$ Public Service 3.4 2.6 3.1 0.8 (0.5) Academic Support 18.2 16.2 15.0 2.0 1.2 Student Services 14.8 11.5 10.8 3.3 0.7 Institutional Support 26.6 25.2 22.2 1.4 3.0 Operation and Maintenance of Plant 16.9 13.7 12.7 3.2 1.0 Scholarships and Fellowships 13.0 12.0 11.1 1.0 0.9 Auxiliary Enterprises 1.1 1.7 1.5 (0.6) 0.2 Depreciation 4.7 4.3 3.8 0.4 0.5
Total Operating Expenses 181.1$ 158.5$ 147.1$ 22.6$ 11.4$
Fiscal Year Change
82.4
3.418.2
14.8
26.6
16.9
13.0
1.14.7
71.3
2.616.2
11.5
25.2
13.7
12.0
1.74.3
66.9
3.115.0
10.8
22.2
12.7
11.1
1.53.8
$-
$20.0
$40.0
$60.0
$80.0
$100.0
$120.0
$140.0
$160.0
$180.0
$200.0
2007 2006 2005Fiscal Year
DepreciationAuxiliary EnterprisesScholarships and FellowshipsOperation and Maintenance of PlantInstitutional SupportStudent ServicesAcademic SupportPublic ServiceInstruction
AUSTIN COMMUNITY COLLEGE DISTRICT Austin, Texas
MANAGEMENT’S DISCUSSION AND ANALYSIS
(UNAUDITED)
12
Factors impacting operating expenses by functional classification include the following:
• All of the functions, except Auxiliary, increased in 2007. The increases were fairly
consistent and proportional for the different functions. The increases were primarily due to increases in salaries and staffing for growing enrollments and new facilities.
• Instruction had the largest dollar increase of $11.1 million in 2007 and $4.4 million in
2006. This is an increase of 15.6% in 2006 and 6.6% in 2005.
• Operations and Maintenance of Plant had the largest percentage increase of 23.3% in 2007. This increase is due to the significant facility expansions and renovations caused by increased enrollment and new programs.
CAPITAL ASSET AND DEBT ADMINISTRATION
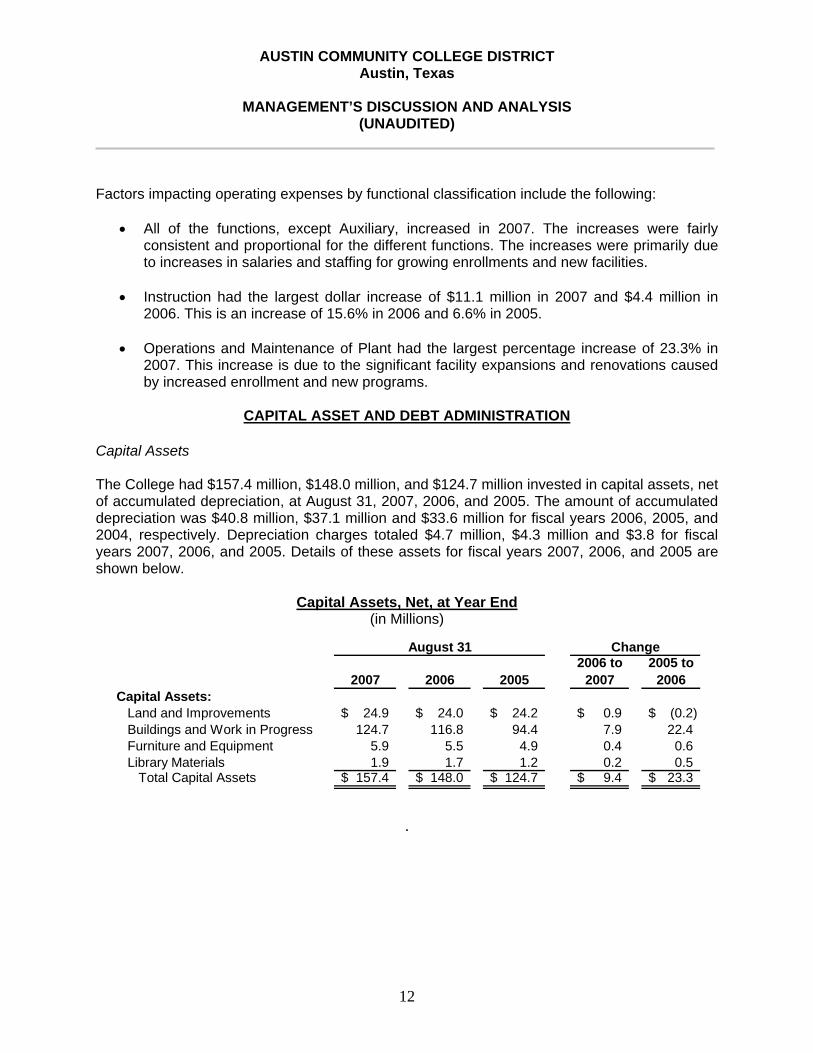
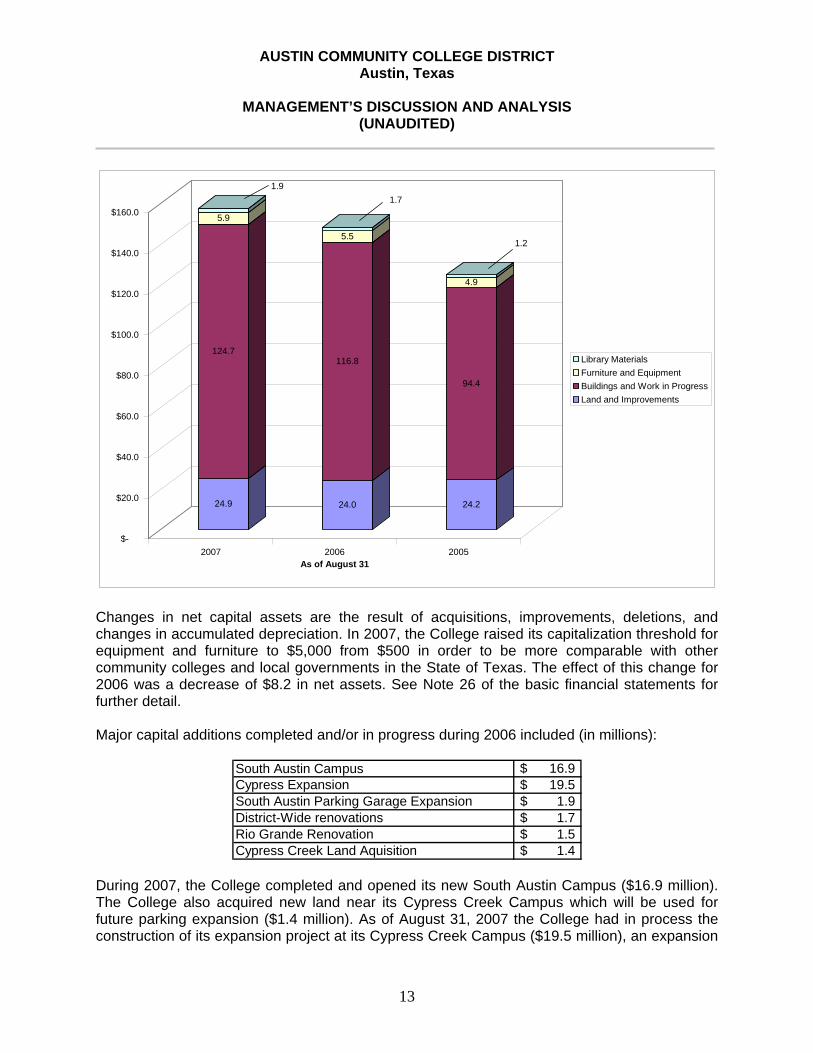
Capital Assets The College had $157.4 million, $148.0 million, and $124.7 million invested in capital assets, net of accumulated depreciation, at August 31, 2007, 2006, and 2005. The amount of accumulated depreciation was $40.8 million, $37.1 million and $33.6 million for fiscal years 2006, 2005, and 2004, respectively. Depreciation charges totaled $4.7 million, $4.3 million and $3.8 for fiscal years 2007, 2006, and 2005. Details of these assets for fiscal years 2007, 2006, and 2005 are shown below.
Capital Assets, Net, at Year End (in Millions)
2007 2006 20052006 to
20072005 to
2006Capital Assets:
Land and Improvements 24.9$ 24.0$ 24.2$ 0.9$ (0.2)$ Buildings and Work in Progress 124.7 116.8 94.4 7.9 22.4 Furniture and Equipment 5.9 5.5 4.9 0.4 0.6 Library Materials 1.9 1.7 1.2 0.2 0.5
Total Capital Assets 157.4$ 148.0$ 124.7$ 9.4$ 23.3$
August 31 Change
.
AUSTIN COMMUNITY COLLEGE DISTRICT Austin, Texas
MANAGEMENT’S DISCUSSION AND ANALYSIS
(UNAUDITED)
13
24.9
124.7
5.9
1.9
24.0
116.8
5.5
1.7
24.2
94.4
4.9
1.2
$-
$20.0
$40.0
$60.0
$80.0
$100.0
$120.0
$140.0
$160.0
2007 2006 2005As of August 31
Library MaterialsFurniture and EquipmentBuildings and Work in ProgressLand and Improvements
Changes in net capital assets are the result of acquisitions, improvements, deletions, and changes in accumulated depreciation. In 2007, the College raised its capitalization threshold for equipment and furniture to $5,000 from $500 in order to be more comparable with other community colleges and local governments in the State of Texas. The effect of this change for 2006 was a decrease of $8.2 in net assets. See Note 26 of the basic financial statements for further detail. Major capital additions completed and/or in progress during 2006 included (in millions):
South Austin Campus $ 16.9 Cypress Expansion $ 19.5 South Austin Parking Garage Expansion $ 1.9 District-Wide renovations $ 1.7 Rio Grande Renovation $ 1.5 Cypress Creek Land Aquisition $ 1.4
During 2007, the College completed and opened its new South Austin Campus ($16.9 million). The College also acquired new land near its Cypress Creek Campus which will be used for future parking expansion ($1.4 million). As of August 31, 2007 the College had in process the construction of its expansion project at its Cypress Creek Campus ($19.5 million), an expansion
AUSTIN COMMUNITY COLLEGE DISTRICT Austin, Texas
MANAGEMENT’S DISCUSSION AND ANALYSIS
(UNAUDITED)
14
of the South Austin Campus parking garage ($1.9 million), Rio Grande renovations ($1.5 million), and other district-wide renovation projects ($1.7 million). During 2005 and 2006, the College completed its Health Science Center Phase II ($14.0 million), the Eastview parking lot ($1.3 million), and renovation of the Northridge parking lot ($0.6 million). In accordance with GASB Statements No. 34 and 35, the College does not record the cost of its capital assets as an expense at the time of acquisition/completion of the asset, but rather shows the expense systematically over the expected life of the asset as depreciation expense. The amount shown in the accounting records for the value of the asset will decrease each year until the asset is fully depreciated or removed from service. As a result, the amount of capital assets shown in the Statement of Net Assets may decrease from one year to another even though new assets have been acquired during the year. Capital assets subject to depreciation include improvements to land (such as parking lots and signage), buildings, furniture and other equipment, and library books. Land is not depreciated. Debt At August 31, 2007 the College had approximately $153.7 million in outstanding debt, a decrease of $1.6 million from the previous year. In 2006, the College had $155.3 million in outstanding debt, a decrease of $2.2 million over 2005. Debt outstanding at fiscal year end 2005 was $155.5 million. The table below summarizes these amounts by type of debt.
Outstanding Debt at Year End
(in Millions)
2007 2006 20052006 to
20072005 to
2006Outstanding Debt:
Revenue Bonds 51.7$ 53.4$ 54.3$ (1.7)$ (0.9)$ General Obligation Bonds 98.7 98.3 98.9 0.4 (0.6) Notes Payable 3.3 3.5 3.7 (0.2) (0.2) Capital Leases - 0.1 0.6 (0.1) (0.5)
Total Outstanding Debt 153.7$ 155.3$ 157.5$ (1.6)$ (2.2)$
August 31 Change
The College’s revenue bonds are special obligations of the College that are payable solely from, and will be equally and ratably secured by, an irrevocable first lien on pledged revenues. The pledged revenues include, but are not limited to: general fees; pledged tuition, and investment income derived from any and all funds of the College. Capital lease obligations are paid from operating funds of the departments for which the equipment is provided. Notes payable will be paid from operating funds and are offset by energy savings. In November 2006, the College issued Limited Tax Refunding Bonds, Series 2006, to refund a portion of the Series 2003 and Series 2004 bonds. The par value of the refunding bonds was $17.6 million. The present value of the net refunding gain was $0.7 million. In April 2005, the College issued Combined Fee Revenue Refunding Bonds, Series 2005, in the amount of $25.2
AUSTIN COMMUNITY COLLEGE DISTRICT Austin, Texas
MANAGEMENT’S DISCUSSION AND ANALYSIS
(UNAUDITED)
15
million to refund a portion of the Series 1995 and Series 2000 bonds. The present value of the net refunding gain was $0.9 million. For 2007, the College’s bond ratings, assigned by Moody’s Investors Service and Standard and Poor’s Rating Services, are “Aa2” and “AA” for general obligation bonds and “A1” and “AA” for revenue bonds, respectively. The Moody’s ratings reflect upgrades in both the College’s general obligation bond rating and the revenue bonds rating from Aa3 and A2, respectively. Moody’s stated, “The upgrade reflects a rapidly growing tax base coupled with an increase in the ad valorem tax levy, strong Market position, and moderately low debt levels.” The College purchases financial guaranty insurance in order to get a higher rating on all the outstanding bond issues. More detailed information about the College’s long-term liabilities is presented in Notes 7, 8, and 9 of the basic financial statements.
Economic Factors That Will Affect the Future The economic position of the College is influenced in part by the economic position of the State of Texas and of Travis and Williamson counties. Educational and general state appropriations are expected to be $41.8 million for fiscal year 2008, in accordance with the funding awarded for the State’s 2008-2009 biennium. This represents an increase of $4.7 million or 12.7% over 2007. This is a reflection of the strong enrollment growth at the College over the last two years, plus a strong economy in the State of Texas.
Tax revenues in 2008 are projected to increase by $8.5 million or 11.9% to $79.7 million from $71.2 million in 2007, and $53.9 million in 2006. The increase in 2008 property tax revenues is due to taxable valuation growth of 10% which reflects the State’s strong economy, especially in the central Texas region. In May 2005, the voters of the College’s district approved the annexation of the portions of the City of Austin not already in the district. In May 2008, the College plans to call an election on the annexation of the Round Rock ISD. The petition process for the election has already been completed successfully. A successful election would annex over $12 billion in taxable property values generating over $11 million in new tax revenues for fiscal year 2010. These tax revenues will be partially offset by a reduction in tuition revenues of $3 million, since the newly annexed student will start paying the significantly lower in-district tuition rate. These new revenues will be used to fund the construction and operation of a new Round Rock Campus planned to be constructed after a successful election.
Tuition and fee revenue for 2008 is projected to increase to approximately $48 million, or 5%, more than was realized in 2007. The projected increase is due to an expected enrollment growth of at least 2%, plus the fact that the College increased both its out-of-district and out-of-state tuition rates by $8 and $25 per credit hour, respectively. The in-district, out-of-district, and out-of-state tuition rates for 2008 were approved by the Board at $39, $118, and $276 per credit hour, respectively.
The projected increases in revenue will be necessary to fund new or increased expenses in instructional and support functions as the College continues to achieve the State’s Closing the Gaps initiative. The College will face a growing challenge in the future to fund anticipated increases in demands for services provided by community colleges.

BASIC FINANCIAL STATEMENTS

Exhibit 1 AUSTIN COMMUNITY COLLEGE DISTRICT
Austin, Texas
STATEMENTS OF NET ASSETS August 31, 2007 and 2006
16
Restated2007 2006
ASSETSCurrent Assets:
Cash and Cash Equivalents 32,617,391$ 17,795,696$ Restricted Cash & Cash Equivalents 4,112,765 3,941,323 Investments 14,919,551 12,885,519 Accounts Receivable (Net) (See Note 15) 11,776,055 10,172,827 Deferred Charges 3,955,113 3,867,136 Notes Receivable 9,825 3,140 Prepaid Expenses 314,425 416,509
Total Current Assets 67,705,125 49,082,150
Noncurrent Assets:Restricted Cash and Cash Equivalents 7,016,389 7,521,845 Restricted Investments 31,654,031 46,730,208 Notes Receivable - 47,672 Deferred Charges 3,716,968 3,229,381 Capital Assets (Net) (See Note 6) 157,439,108 148,026,985
Total Noncurrent Assets 199,826,496 205,556,091 Total Assets 267,531,621 254,638,241
LIABILITIESCurrent Liabilities:
Bank Overdraft 483,814 2,628,965 Accounts Payable 5,836,956 6,452,907 Accrued Liabilities 5,656,421 5,864,343 Accr Comp Absences-Current Port 2,676,308 2,258,016 Funds Held for Others 810,596 170,078 Deferred Revenues 27,396,334 25,194,902 Capital Leases - Current Portion - 143,148 Notes Payable - Current Portion 254,063 240,978 Bonds Payable - Current Portion 3,378,262 2,356,260
Total Current Liabilities 46,492,754 45,309,597
Noncurrent Liabilities:Accrued Compensable Abscenses 629,067 1,000,906 Deferred Revenues 989,583 1,084,583 Notes Payable 3,006,392 3,260,455 Bonds Payable 147,106,820 149,394,056
Total Noncurrent Liabilities 151,731,862 154,740,000 Total Liabilities 198,224,616 200,049,597
The accompanying notes are an integral part of the financial statements.
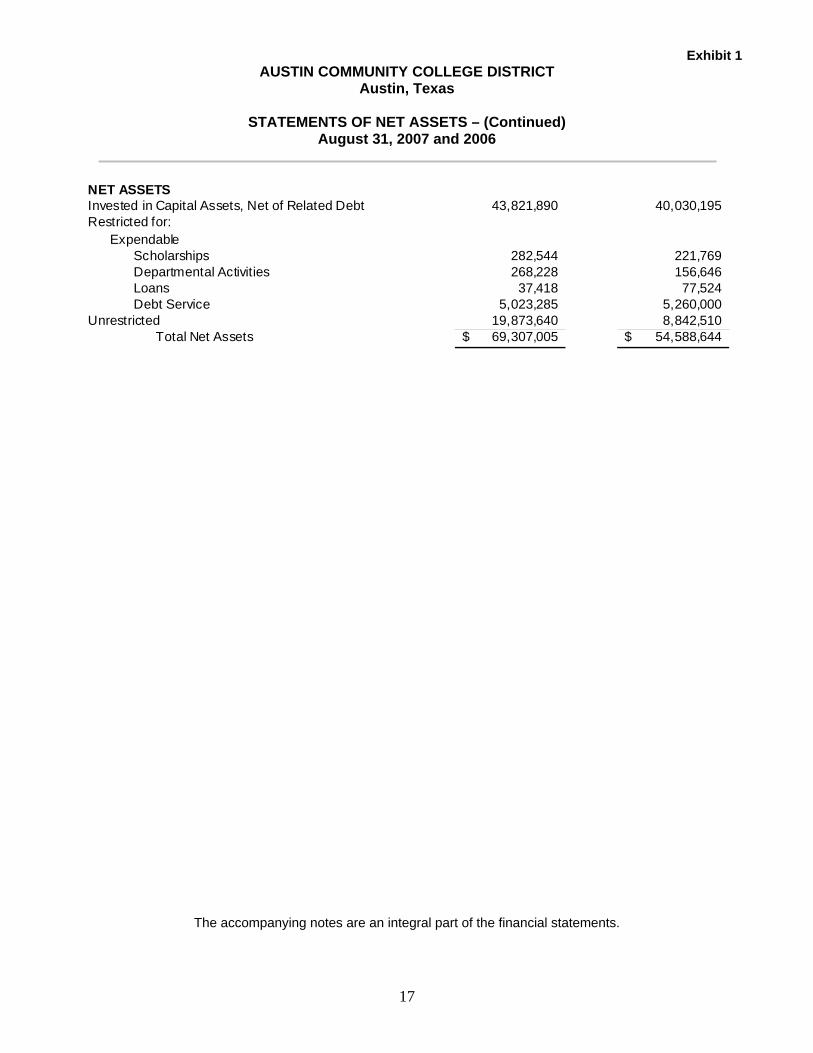
Exhibit 1 AUSTIN COMMUNITY COLLEGE DISTRICT
Austin, Texas
STATEMENTS OF NET ASSETS – (Continued) August 31, 2007 and 2006
17
NET ASSETSInvested in Capital Assets, Net of Related Debt 43,821,890 40,030,195 Restricted for:
ExpendableScholarships 282,544 221,769 Departmental Activities 268,228 156,646 Loans 37,418 77,524 Debt Service 5,023,285 5,260,000
Unrestricted 19,873,640 8,842,510 Total Net Assets 69,307,005$ 54,588,644$
The accompanying notes are an integral part of the financial statements.
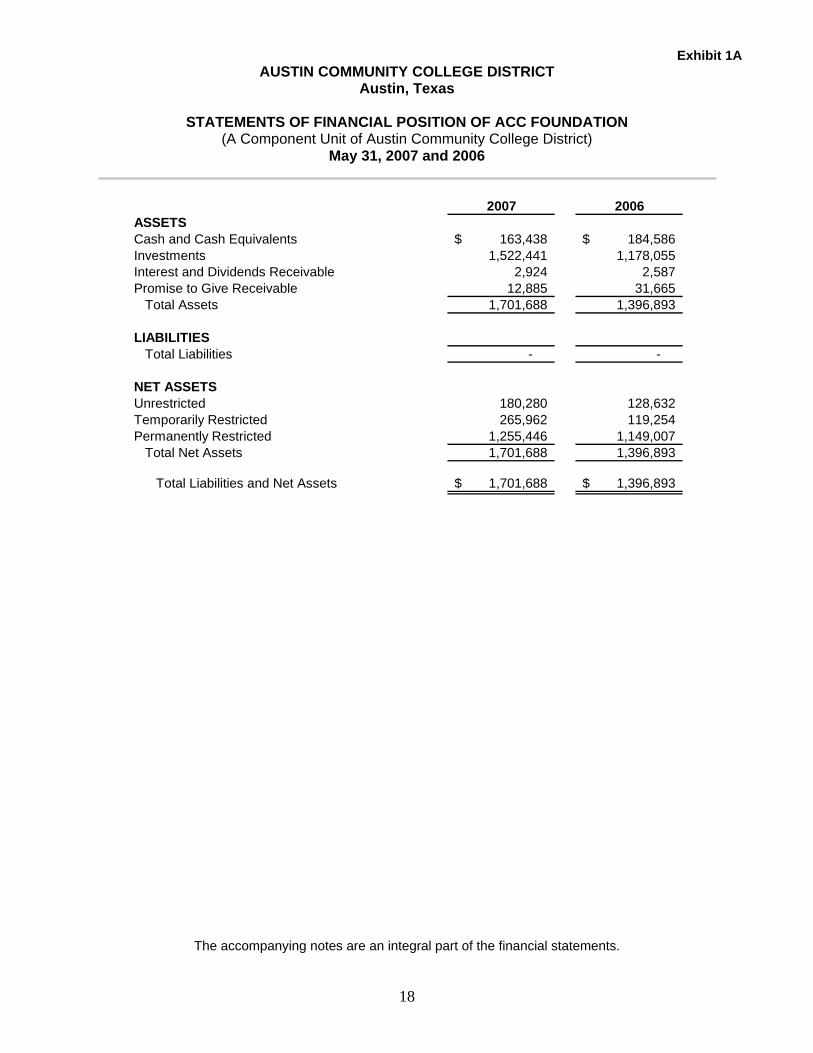
Exhibit 1A AUSTIN COMMUNITY COLLEGE DISTRICT
Austin, Texas
STATEMENTS OF FINANCIAL POSITION OF ACC FOUNDATION (A Component Unit of Austin Community College District)
May 31, 2007 and 2006
18
2007 2006ASSETSCash and Cash Equivalents 163,438$ 184,586$ Investments 1,522,441 1,178,055 Interest and Dividends Receivable 2,924 2,587 Promise to Give Receivable 12,885 31,665
Total Assets 1,701,688 1,396,893
LIABILITIESTotal Liabilities - -
NET ASSETSUnrestricted 180,280 128,632 Temporarily Restricted 265,962 119,254 Permanently Restricted 1,255,446 1,149,007
Total Net Assets 1,701,688 1,396,893
Total Liabilities and Net Assets 1,701,688$ 1,396,893$
The accompanying notes are an integral part of the financial statements.
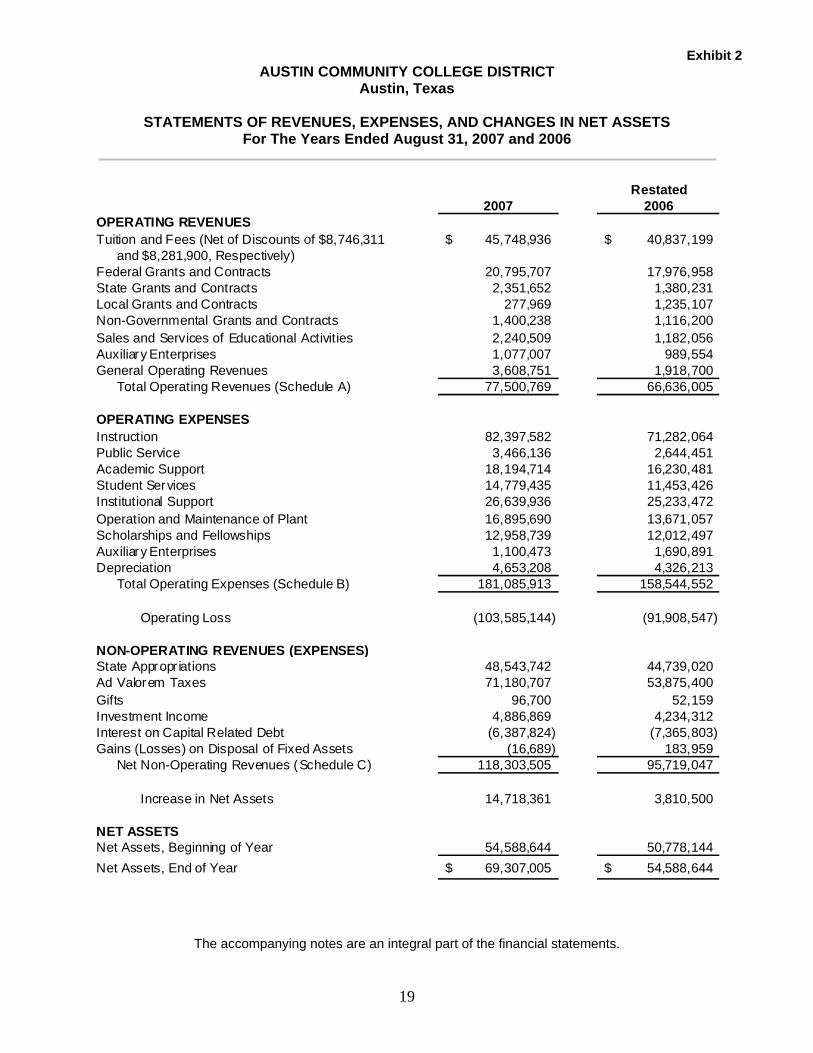
Exhibit 2 AUSTIN COMMUNITY COLLEGE DISTRICT
Austin, Texas
STATEMENTS OF REVENUES, EXPENSES, AND CHANGES IN NET ASSETS For The Years Ended August 31, 2007 and 2006
19
Restated2007 2006
OPERATING REVENUESTuition and Fees (Net of Discounts of $8,746,311 45,748,936$ 40,837,199$
and $8,281,900, Respectively)Federal Grants and Contracts 20,795,707 17,976,958 State Grants and Contracts 2,351,652 1,380,231 Local Grants and Contracts 277,969 1,235,107 Non-Governmental Grants and Contracts 1,400,238 1,116,200 Sales and Services of Educational Activities 2,240,509 1,182,056 Auxiliary Enterprises 1,077,007 989,554 General Operating Revenues 3,608,751 1,918,700
Total Operating Revenues (Schedule A) 77,500,769 66,636,005
OPERATING EXPENSESInstruction 82,397,582 71,282,064 Public Service 3,466,136 2,644,451 Academic Support 18,194,714 16,230,481 Student Services 14,779,435 11,453,426 Institutional Support 26,639,936 25,233,472 Operation and Maintenance of Plant 16,895,690 13,671,057 Scholarships and Fellowships 12,958,739 12,012,497 Auxiliary Enterprises 1,100,473 1,690,891 Depreciation 4,653,208 4,326,213
Total Operating Expenses (Schedule B) 181,085,913 158,544,552
Operating Loss (103,585,144) (91,908,547)
NON-OPERATING REVENUES (EXPENSES)State Appropr iations 48,543,742 44,739,020 Ad Valorem Taxes 71,180,707 53,875,400 Gifts 96,700 52,159 Investment Income 4,886,869 4,234,312 Interest on Capital Related Debt (6,387,824) (7,365,803) Gains (Losses) on Disposal of Fixed Assets (16,689) 183,959
Net Non-Operating Revenues (Schedule C) 118,303,505 95,719,047
Increase in Net Assets 14,718,361 3,810,500
NET ASSETSNet Assets, Beginning of Year 54,588,644 50,778,144 Net Assets, End of Year 69,307,005$ 54,588,644$
The accompanying notes are an integral part of the financial statements.
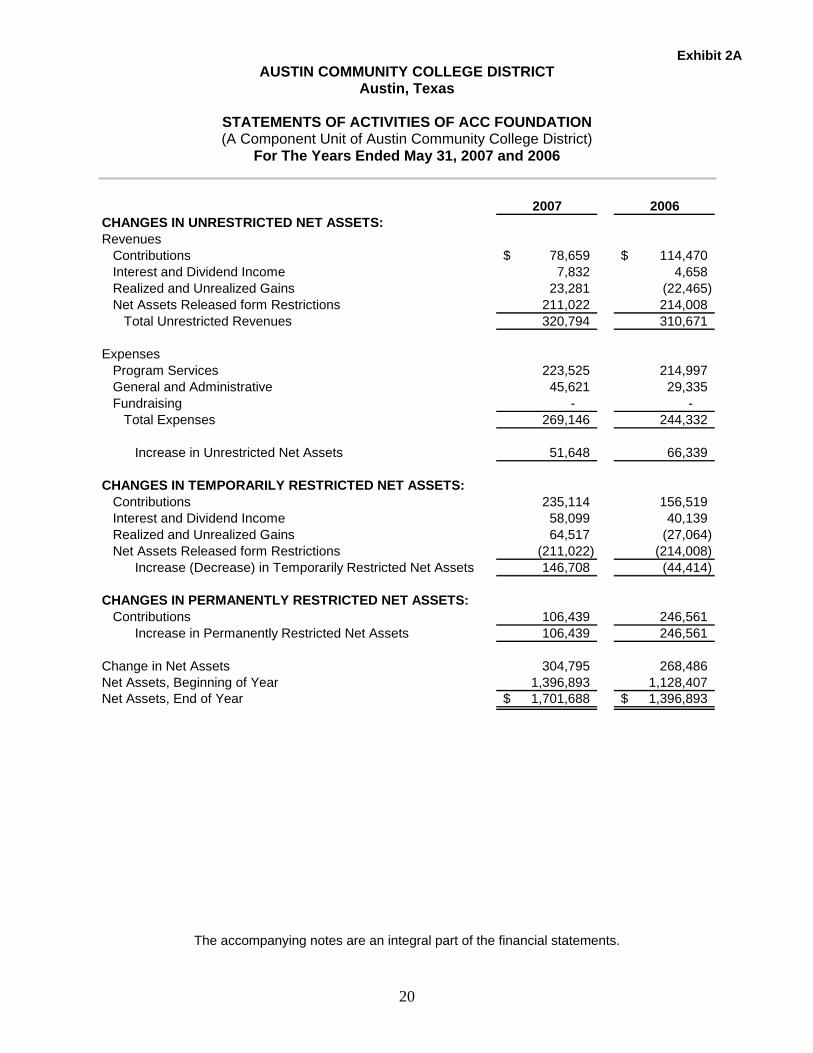
Exhibit 2A AUSTIN COMMUNITY COLLEGE DISTRICT
Austin, Texas
STATEMENTS OF ACTIVITIES OF ACC FOUNDATION (A Component Unit of Austin Community College District)
For The Years Ended May 31, 2007 and 2006
20
2007 2006CHANGES IN UNRESTRICTED NET ASSETS:Revenues
Contributions 78,659$ 114,470$ Interest and Dividend Income 7,832 4,658 Realized and Unrealized Gains 23,281 (22,465) Net Assets Released form Restrictions 211,022 214,008
Total Unrestricted Revenues 320,794 310,671
ExpensesProgram Services 223,525 214,997 General and Administrative 45,621 29,335 Fundraising - -
Total Expenses 269,146 244,332
Increase in Unrestricted Net Assets 51,648 66,339
CHANGES IN TEMPORARILY RESTRICTED NET ASSETS:Contributions 235,114 156,519 Interest and Dividend Income 58,099 40,139 Realized and Unrealized Gains 64,517 (27,064) Net Assets Released form Restrictions (211,022) (214,008)
Increase (Decrease) in Temporarily Restricted Net Assets 146,708 (44,414)
CHANGES IN PERMANENTLY RESTRICTED NET ASSETS:Contributions 106,439 246,561
Increase in Permanently Restricted Net Assets 106,439 246,561
Change in Net Assets 304,795 268,486 Net Assets, Beginning of Year 1,396,893 1,128,407 Net Assets, End of Year 1,701,688$ 1,396,893$
The accompanying notes are an integral part of the financial statements.
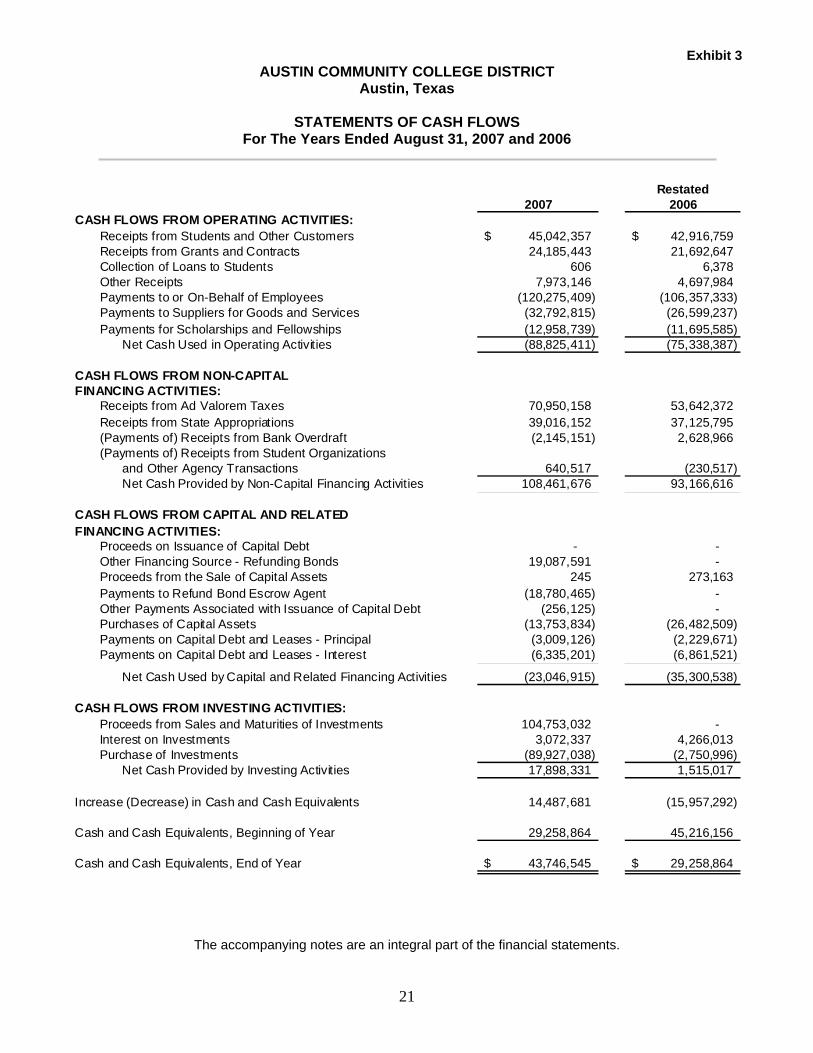
Exhibit 3 AUSTIN COMMUNITY COLLEGE DISTRICT
Austin, Texas
STATEMENTS OF CASH FLOWS For The Years Ended August 31, 2007 and 2006
21
Restated2007 2006
CASH FLOWS FROM OPERATING ACTIVITIES:Receipts from Students and Other Customers 45,042,357$ 42,916,759$ Receipts from Grants and Contracts 24,185,443 21,692,647 Collection of Loans to Students 606 6,378 Other Receipts 7,973,146 4,697,984 Payments to or On-Behalf of Employees (120,275,409) (106,357,333) Payments to Suppliers for Goods and Services (32,792,815) (26,599,237) Payments for Scholarships and Fellowships (12,958,739) (11,695,585)
Net Cash Used in Operating Activities (88,825,411) (75,338,387)
CASH FLOWS FROM NON-CAPITALFINANCING ACTIVITIES:
Receipts from Ad Valorem Taxes 70,950,158 53,642,372 Receipts from State Appropriations 39,016,152 37,125,795 (Payments of) Receipts from Bank Overdraft (2,145,151) 2,628,966 (Payments of) Receipts from Student Organizations
and Other Agency Transactions 640,517 (230,517) Net Cash Provided by Non-Capital Financing Activities 108,461,676 93,166,616
CASH FLOWS FROM CAPITAL AND RELATEDFINANCING ACTIVITIES:
Proceeds on Issuance of Capital Debt - - Other Financing Source - Refunding Bonds 19,087,591 - Proceeds from the Sale of Capital Assets 245 273,163 Payments to Refund Bond Escrow Agent (18,780,465) - Other Payments Associated with Issuance of Capital Debt (256,125) - Purchases of Capital Assets (13,753,834) (26,482,509) Payments on Capital Debt and Leases - Principal (3,009,126) (2,229,671) Payments on Capital Debt and Leases - Interest (6,335,201) (6,861,521)
Net Cash Used by Capital and Related Financing Activities (23,046,915) (35,300,538)
CASH FLOWS FROM INVESTING ACTIVITIES:Proceeds from Sales and Maturities of Investments 104,753,032 - Interest on Investments 3,072,337 4,266,013 Purchase of Investments (89,927,038) (2,750,996)
Net Cash Provided by Investing Activities 17,898,331 1,515,017
Increase (Decrease) in Cash and Cash Equivalents 14,487,681 (15,957,292)
Cash and Cash Equivalents, Beginning of Year 29,258,864 45,216,156
Cash and Cash Equivalents, End of Year 43,746,545$ 29,258,864$
The accompanying notes are an integral part of the financial statements.
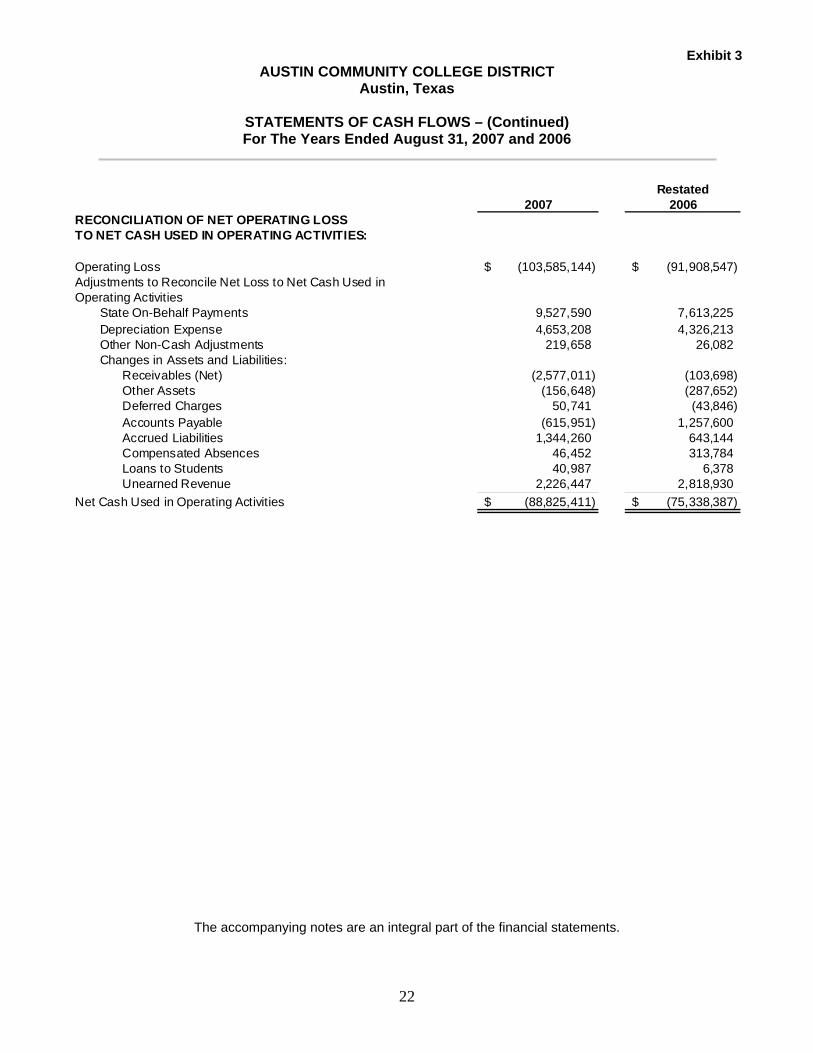
Exhibit 3 AUSTIN COMMUNITY COLLEGE DISTRICT
Austin, Texas
STATEMENTS OF CASH FLOWS – (Continued) For The Years Ended August 31, 2007 and 2006
22
Restated2007 2006
RECONCILIATION OF NET OPERATING LOSSTO NET CASH USED IN OPERATING ACTIVITIES:
Operating Loss (103,585,144)$ (91,908,547)$ Adjustments to Reconcile Net Loss to Net Cash Used inOperating Activities
State On-Behalf Payments 9,527,590 7,613,225 Depreciation Expense 4,653,208 4,326,213 Other Non-Cash Adjustments 219,658 26,082 Changes in Assets and Liabilities:
Receivables (Net) (2,577,011) (103,698) Other Assets (156,648) (287,652) Deferred Charges 50,741 (43,846) Accounts Payable (615,951) 1,257,600 Accrued Liabilities 1,344,260 643,144 Compensated Absences 46,452 313,784 Loans to Students 40,987 6,378 Unearned Revenue 2,226,447 2,818,930
Net Cash Used in Operating Activities (88,825,411)$ (75,338,387)$
The accompanying notes are an integral part of the financial statements.

AUSTIN COMMUNITY COLLEGE DISTRICT
Austin, Texas
NOTES TO THE BASIC FINANCIAL STATEMENTS For The Years Ended August 31, 2007 and 2006
23
NOTE 1. REPORTING ENTITY
The Austin Community College District (“the College”) was established in 1973, in accordance with the laws of the State of Texas, to serve the educational needs of Austin and the surrounding communities. The College is considered to be a special purpose, primary government according to the definition in Governmental Accounting Standards Board (GASB) Statement 14, The Financial Reporting Entity. While the College receives funding from local, state, and federal sources, and must comply with the spending, reporting, and record keeping requirements of these entities, it is not a component unit of any other governmental entity.
The College is a comprehensive, public, two-year institution offering academic, general, occupational, developmental, and continuing adult education programs through a network of campuses. The College is governed by a nine-member Board of Trustees (the “Board”), which has governance responsibilities over all activities related to the College.
GASB Statement No. 39, Determining Whether Certain Organizations are Component Units, an amendment to GASB Statement No. 14, provides additional guidance in determining whether certain organizations for which the College is not financially accountable should be reported as component units based on the nature and significance of their relationship with the primary government. It requires reporting as a component unit if the organization raises and holds economic resources for the direct benefit of the governmental unit and the component unit is significant compared to the primary government. GASB Statement No. 39 has been applied as required in the preparation of these financial statements and the component unit discussed in Note 23 is included with the College because of the significance of its operational and financial relationships with the College.
NOTE 2. SUMMARY OF SIGNIFICANT ACCOUNTING POLICIES
Reporting Guidelines
The significant accounting policies followed by the College in preparing these financial statements are in accordance with accounting principles generally accepted in the United States of America as prescribed by the Governmental Accounting Standards Board (GASB). Additionally, the College complies with Texas Higher Education Coordinating Board’s Annual Financial Reporting Requirements for Texas Public Community and Junior Colleges.
The College applies all applicable GASB pronouncements and it applies all applicable Financial Accounting Standard Board (FASB) statements and interpretations issued on or before November 30, 1989, unless they conflict or contradict GASB pronouncements. The College has elected not to apply FASB guidance issued subsequent to November 30, 1989, unless specifically adopted by the GASB. The College is reported as a special-purpose government engaged in business-type activities.

AUSTIN COMMUNITY COLLEGE DISTRICT
Austin, Texas
NOTES TO THE BASIC FINANCIAL STATEMENTS For The Years Ended August 31, 2007 and 2006
24
NOTE 2. SUMMARY OF SIGNIFICANT ACCOUNTING POLICIES (Continued)
Basis of Accounting
The financial statements of the College have been prepared on the accrual basis whereby all revenues are recorded when earned and all expenses are recorded when they have been reduced to a legal or contractual obligation to pay.
Tuition Discounting
Texas Public Education Grants: Certain tuition amounts are required to be set aside for use as scholarships by qualifying students. This set aside, called the Texas Public Education Grant (TPEG), is shown with tuition and fee revenue amounts as a separate set aside amount (Texas Education Code § 56.033). When the award is used by the student for tuition and fees, the amount is recorded as a tuition discount. If the amount is disbursed directly to the student, the amount is recorded as a scholarship expense.
Title IV, Higher Education Act Program Funds: Certain Title IV HEA Program funds are received by the College to pass through to the student. These funds are initially received by the College and recorded as revenue. When the award is used by the student for tuition and fees, the amount is recorded as a tuition discount. If the amount is disbursed directly to the student, the amount is recorded as a scholarship expense.
Other Tuition Discounts: The College awards tuition and fee scholarships from institutional funds to students who qualify. When these amounts are used for tuition and fees, the amount is recorded as a tuition discount. If the amount is disbursed directly to the student, the amount is recorded as a scholarship expense.
Budgetary Data
Each community college in Texas is required by law to prepare an annual operating budget of anticipated revenues and expenditures for the fiscal year beginning September 1. The College’s Board adopts the budget, which is prepared on the accrual basis of accounting. A copy of the approved budget and subsequent amendment must be filed with the Texas Higher Education Coordinating Board, Legislative Budget Board, Legislative Reference Library, and Governor’s Office of Budget and Planning by December 1.
Cash and Cash Equivalents
The College’s cash and cash equivalents are considered to be cash on hand, demand deposits, and short-term investments with original maturities of three months or less from the date of acquisition. Cash and cash equivalents that are externally restricted as to their use are classified as noncurrent assets in the Statement of Net Assets, unless they are considered to offset maturing debt that has been set up as a current liability, in that case they are presented
AUSTIN COMMUNITY COLLEGE DISTRICT
Austin, Texas
NOTES TO THE BASIC FINANCIAL STATEMENTS For The Years Ended August 31, 2007 and 2006
25
NOTE 2. SUMMARY OF SIGNIFICANT ACCOUNTING POLICIES (Continued)
as current assets in the Statement of Net Assets. The College has designated public funds investment pools to be cash equivalents.
Board policy requires the College to maintain a minimum unrestricted, unallocated cash level of 8% of budgeted total annual expenses plus total accounts payable. The College was in compliance with this policy as of August 31, 2007 and 2006.
Investments
In accordance with GASB 31, Accounting and Financial Reporting for Certain Investments and External Investment Pools, investments are reported at fair value. Fair values are based on published market rates. Short-term investments have an original maturity date greater than three months but less than one year at time of purchase. Long-term investments have an original maturity of greater than one year at the time of purchase.
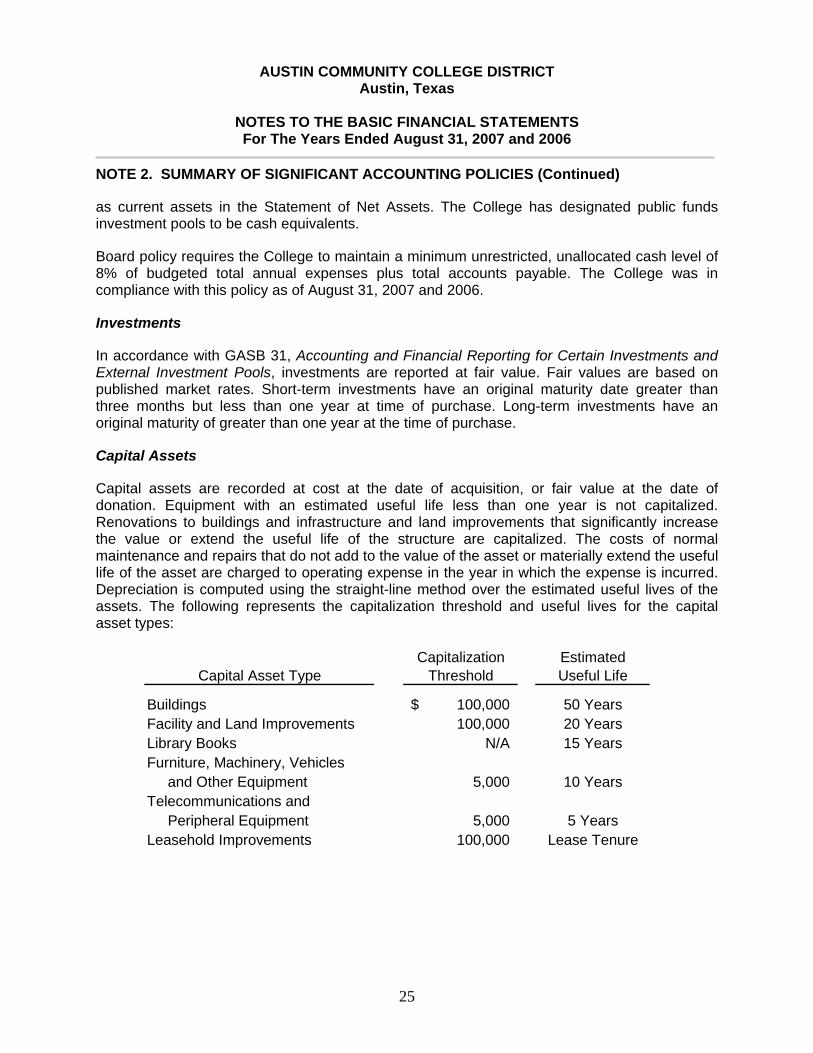
Capital Assets
Capital assets are recorded at cost at the date of acquisition, or fair value at the date of donation. Equipment with an estimated useful life less than one year is not capitalized. Renovations to buildings and infrastructure and land improvements that significantly increase the value or extend the useful life of the structure are capitalized. The costs of normal maintenance and repairs that do not add to the value of the asset or materially extend the useful life of the asset are charged to operating expense in the year in which the expense is incurred. Depreciation is computed using the straight-line method over the estimated useful lives of the assets. The following represents the capitalization threshold and useful lives for the capital asset types:
Capitalization EstimatedCapital Asset Type Threshold Useful Life
Buildings 100,000$ 50 YearsFacility and Land Improvements 100,000 20 YearsLibrary Books N/A 15 YearsFurniture, Machinery, Vehicles and Other Equipment 5,000 10 YearsTelecommunications and Peripheral Equipment 5,000 5 YearsLeasehold Improvements 100,000 Lease Tenure
AUSTIN COMMUNITY COLLEGE DISTRICT
Austin, Texas
NOTES TO THE BASIC FINANCIAL STATEMENTS For The Years Ended August 31, 2007 and 2006
26
NOTE 2. SUMMARY OF SIGNIFICANT ACCOUNTING POLICIES (Continued)
Net Assets
The College’s net assets are classified as follows:
Invested in Capital Assets, Net of Related Debt: This category represents the College’s total investment in capital assets, net of related outstanding debt and accumulated depreciation.
Restricted Net Assets, Nonexpendable: Net Assets, such as endowment and similar type funds, which are subject to externally imposed stipulations requiring that the funds be maintained permanently by the College.
Restricted Net Assets, Expendable: Net Assets for which the College is legally or contractually obligated to spend in accordance with external restrictions.
Unrestricted Net Assets: Unrestricted Net Assets are resources that are not subject to any external restrictions and may be used at the discretion of the governing board for any lawful purpose of the College.
When an expense is incurred that can be paid using either restricted or unrestricted resources, the College’s policy is to first apply the expense towards restricted resources and then towards unrestricted resources.
Deferred Revenues
Tuition, fees, and other revenues received and related to periods after August 31, 2007 or 2006, respectively, have been deferred to the subsequent fiscal year.
Estimates
The preparation of the financial statements in conformity with generally accepted accounting principles requires management to make estimates and assumptions that affect certain reported amounts and disclosures. Accordingly, actual results could differ from those estimates.
Operating and Non-Operating Revenue and Expense Policy
The College distinguishes operating revenues and expenses from non-operating items. Operating revenues and expenses generally result from providing services in connection with the College’s principal ongoing operations. The principal operating revenues are tuition and related fees and Federal grants and contracts. The major non-operating revenue sources are State appropriations and property tax collections. Operating expenses include the cost of sales and services, administrative expenses, and depreciation on capital assets. The major non-operating expenses include interest on capital related debt and losses on disposal of fixed assets.
AUSTIN COMMUNITY COLLEGE DISTRICT
Austin, Texas
NOTES TO THE BASIC FINANCIAL STATEMENTS For The Years Ended August 31, 2007 and 2006
27
NOTE 2. SUMMARY OF SIGNIFICANT ACCOUNTING POLICIES (Continued)
New Accounting Pronouncements
In July 2004, the GASB issued Statement No. 45, Accounting and Financial Reporting by Employers for Post-employment Benefit Other Than Pension Plans. Statement No. 45 establishes standards for the measurement, recognition, and display of other post-employment benefits expenses and related liabilities and assets, and other related disclosure requirements. The requirements of Statement No. 45 become effective for fiscal periods beginning after December 15, 2006. The College has not yet determined the effect on the financial statements for implementation of this statement.
In September 2006, the GASB issued Statement No. 48, Sales and Pledges of Receivable and Future Revenues and Intra-Entity Transfers of Assets and Future Revenues. This statement establishes criteria that governments will use to ascertain whether certain transactions should be regarded as sales or as collateralized borrowings resulting in a liability. The statement also includes disclosure requirements for future revenues that are pledged or sold. The requirements of Statement No. 48 become effective for fiscal periods beginning after December 15, 2006. The College does not expect this statement to have any impacts on the College’s financial statements.
In November 2006, the GASB issued Statement No. 49, Accounting and Financial Reporting for Pollution Remediation Obligations. This statement provided guidance on how to calculate and report the costs and obligations associated with pollution and cleanup efforts. The requirements of Statement No. 49 become effective for fiscal periods beginning after December 15, 2007. The College is not expected to participate in pollution remediation activities and, therefore, will not accrue a liability and/or capitalize pollution remediation costs.
Reclassification
Certain amounts have been reclassified for the prior year’s financial statements to conform to current year presentations.
Contributions – The Foundation
The Foundation records contributions using the guidance of SFAS No. 116, Accounting for Contributions Received and Contributions Made. Contributions received are recorded as unrestricted, temporarily restricted, or permanently restricted support depending on the existence or nature of any donor restrictions. As donor or time restrictions are satisfied, net assets are reclassified to unrestricted net assets. The Foundation’s policy is to report restricted support that is satisfied in the year of receipt as restricted and then released in the same year. Unconditional promises to give are recorded as revenues and receivables.
AUSTIN COMMUNITY COLLEGE DISTRICT
Austin, Texas
NOTES TO THE BASIC FINANCIAL STATEMENTS For The Years Ended August 31, 2007 and 2006
28
NOTE 2. SUMMARY OF SIGNIFICANT ACCOUNTING POLICIES (Continued)
Prior Year Restatement
On August 23, 2007, the Board approved to increase the College’s capitalization threshold for equipment and furniture from $500 to $5,000. Note 26, below, explains the effect on the financial statements as a result of the new capitalization threshold. The new capitalization rate is in agreement with the Texas Higher Education Coordinating Board’s capitalization rate.
NOTE 3. AUTHORIZED INVESTMENTS
The College is authorized to invest in obligations and instruments as defined in the Public Funds Investment Act (“PFIA”) (Sec. 2256.001 Texas Government Code). The Board has adopted a written investment policy regarding the investment of its funds as defined in the PFIA. Such investments include (1) obligations of the United States or its agencies, (2) direct obligations of the State of Texas or its agencies, (3) obligations of political subdivisions rated not less than “A” by a national investment rating firm, (4) certificates of deposit, and (5) other instruments and obligations authorized by statute. During the years ended August 31, 2007 and 2006 the College was in compliance with the Public Funds Investment Act.
NOTE 4. DEPOSITS AND INVESTMENTS
At August 31, 2007 and 2006, the College had demand deposits with the carrying amount of $45,105 and $46,063, respectively, and total bank balances equaled $4,246,433 and $2,152,753, respectively. Bank balances up to $100,000 were covered by the Federal Deposit Insurance Corporation and the remainder was covered by collateral pledged in the College's name. The College utilizes sweep agreements as a funding mechanism for its demand deposit accounts. Under this agreement the funds are maintained in a money market account, and then swept into the demand deposit account as needed to fund disbursements. Since the funds reside in a money market fund, custodial risk is kept to a minimum, and pledged collateral is typically not needed. The College does have a collateral agreement in place with its depositories in case it is needed, and requires a minimum pledge of 102% of the bank balance. The College is subject to custodial credit risk in the event of the bank's nonperformance under the collateral agreement.
Cash and Cash Equivalents
Cash and cash equivalents included on Exhibit 1, Statements of Net Assets, consist of the items reported below:
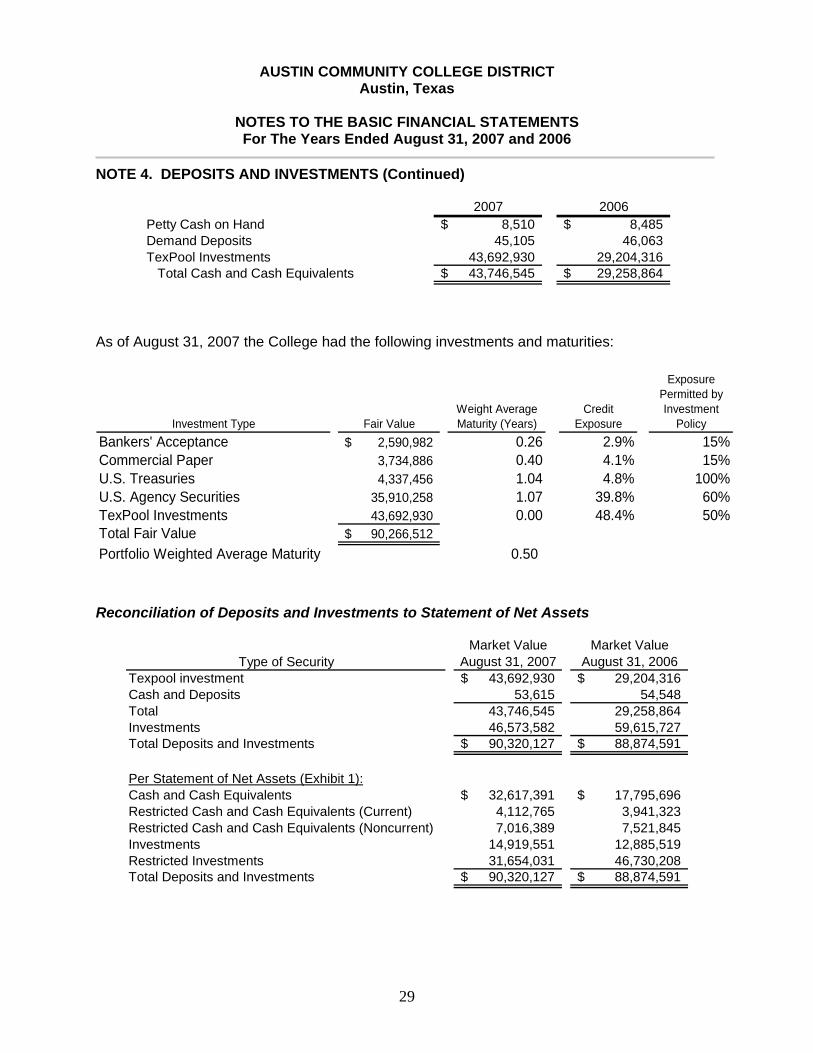
AUSTIN COMMUNITY COLLEGE DISTRICT
Austin, Texas
NOTES TO THE BASIC FINANCIAL STATEMENTS For The Years Ended August 31, 2007 and 2006
29
NOTE 4. DEPOSITS AND INVESTMENTS (Continued)
2007 2006Petty Cash on Hand 8,510$ 8,485$ Demand Deposits 45,105 46,063 TexPool Investments 43,692,930 29,204,316
Total Cash and Cash Equivalents 43,746,545$ 29,258,864$
As of August 31, 2007 the College had the following investments and maturities:
Investment Type Fair ValueWeight AverageMaturity (Years)
Credit Exposure
Exposure Permitted by Investment
PolicyBankers' Acceptance 2,590,982$ 0.26 2.9% 15%Commercial Paper 3,734,886 0.40 4.1% 15%U.S. Treasuries 4,337,456 1.04 4.8% 100%U.S. Agency Securities 35,910,258 1.07 39.8% 60%TexPool Investments 43,692,930 0.00 48.4% 50%Total Fair Value 90,266,512$ Portfolio Weighted Average Maturity 0.50
Reconciliation of Deposits and Investments to Statement of Net Assets
Type of SecurityMarket Value
August 31, 2007Market Value
August 31, 2006Texpool investment 43,692,930$ 29,204,316$ Cash and Deposits 53,615 54,548 Total 43,746,545 29,258,864 Investments 46,573,582 59,615,727 Total Deposits and Investments 90,320,127$ 88,874,591$
Per Statement of Net Assets (Exhibit 1):Cash and Cash Equivalents 32,617,391$ 17,795,696$ Restricted Cash and Cash Equivalents (Current) 4,112,765 3,941,323 Restricted Cash and Cash Equivalents (Noncurrent) 7,016,389 7,521,845 Investments 14,919,551 12,885,519 Restricted Investments 31,654,031 46,730,208 Total Deposits and Investments 90,320,127$ 88,874,591$
AUSTIN COMMUNITY COLLEGE DISTRICT
Austin, Texas
NOTES TO THE BASIC FINANCIAL STATEMENTS For The Years Ended August 31, 2007 and 2006
30
NOTE 4. DEPOSITS AND INVESTMENTS (Continued)
Interest Rate Risk - In accordance with state law and College’s policy, the College does not purchase any investments with maturities greater than five years. The College manages its exposure to declines in fair value by limiting the weighted average maturity of its investment portfolio to a maximum of one and one-half years. Credit Risk and Concentration of Credit Risk - In accordance with state law and the College’s investment policy, investments in mutual funds and investment pools must be rated at least “AAA” or “AAA-m”, commercial paper must be rated at least “A-1” or “P-1”, and investments in obligations from other states, municipalities, counties, etc. must be rated at least “A”. The College does not limit the amount it may invest in any one issuer. The State Comptroller of Public Accounts exercises oversight responsibility over TexPool, the Texas Local Government Investment Pool. Oversight includes the ability to significantly influence operations, designation of management and accountability for fiscal matters. Additionally, the State Comptroller has established an advisory board composed of both participants in TexPool and other persons who do not have a business relationship with TexPool. The Advisory Board members review the investment policy and management fee structure. TexPool invests in securities that meet the requirements of Texas Public Funds Investment Act. Finally, Standard & Poor rates TexPool AAA-m. As a requirement to maintain the rating, weekly portfolio information must be submitted to Standard & Poor, as well as to the Office of Comptroller of Public Accounts, for review. As of August 31, 2007 and 2006, the College has an investment of $43,692,930 and $29,204,316, respectively, in TexPool, the Texas Local Government Investment Pool.
TexPool operates in a manner consistent with the SEC’s Rule 2a-7 of the Investment Act of 1940. TexPool uses amortized cost rather than market value to report net assets to compute share prices. Accordingly, the fair value of the position in TexPool is the same as the value of TexPool shares. The College reports investments in TexPool as cash and cash equivalents.
NOTE 5. DERIVATIVES
Derivatives are investment products that may be a security or contract that derives its value from another security, currency, commodity, or index, regardless of the source of funds used.
At August 31, 2007 and 2006, the College had not engaged in any derivate transactions either for investment purposes or as a risk management strategy.

AUSTIN COMMUNITY COLLEGE DISTRICT
Austin, Texas
NOTES TO THE BASIC FINANCIAL STATEMENTS For The Years Ended August 31, 2007 and 2006
31
NOTE 6. CAPITAL ASSETS
Capital assets activity for the year ended August 31, 2007, was as follows:
Balance September 1,
2006 Additions Retirements TransfersBalance August
31, 2007Not Depreciated Land 17,324,702$ 1,399,777$ -$ -$ 18,724,479$ Construction in Progress 32,649,572 10,600,165 (219,658) (18,392,003) 24,638,076 Subtotal 49,974,274 11,999,942 (219,658) (18,392,003) 43,362,555
Other Capital Assets Buildings 100,468,313 - - 18,277,405 118,745,718 Infrastructure 2,913,746 - - - 2,913,746 Land Improvements 9,433,867 94,448 - 114,598 9,642,913 Library Books 3,568,895 311,897 (212,195) - 3,668,597 Equipment 18,790,311 1,895,636 (732,739) - 19,953,208 Subtotal 135,175,132 2,301,981 (944,934) 18,392,003 154,924,182
Accumulated Depreciation Buildings 16,288,880 2,280,100 - - 18,568,980 Infrastructure 971,249 97,125 - - 1,068,374 Land Improvements 4,730,670 555,717 - - 5,286,387 Library Books 1,856,327 187,941 (212,195) - 1,832,073 Equipment 13,275,295 1,532,325 (715,805) - 14,091,815 Subtotal 37,122,421 4,653,208 (928,000) - 40,847,629
Net Other Capital Assets 98,052,711 (2,351,227) (16,934) 18,392,003 114,076,553
Net Capital Assets 148,026,985$ 9,648,715$ (236,592)$ -$ 157,439,108$
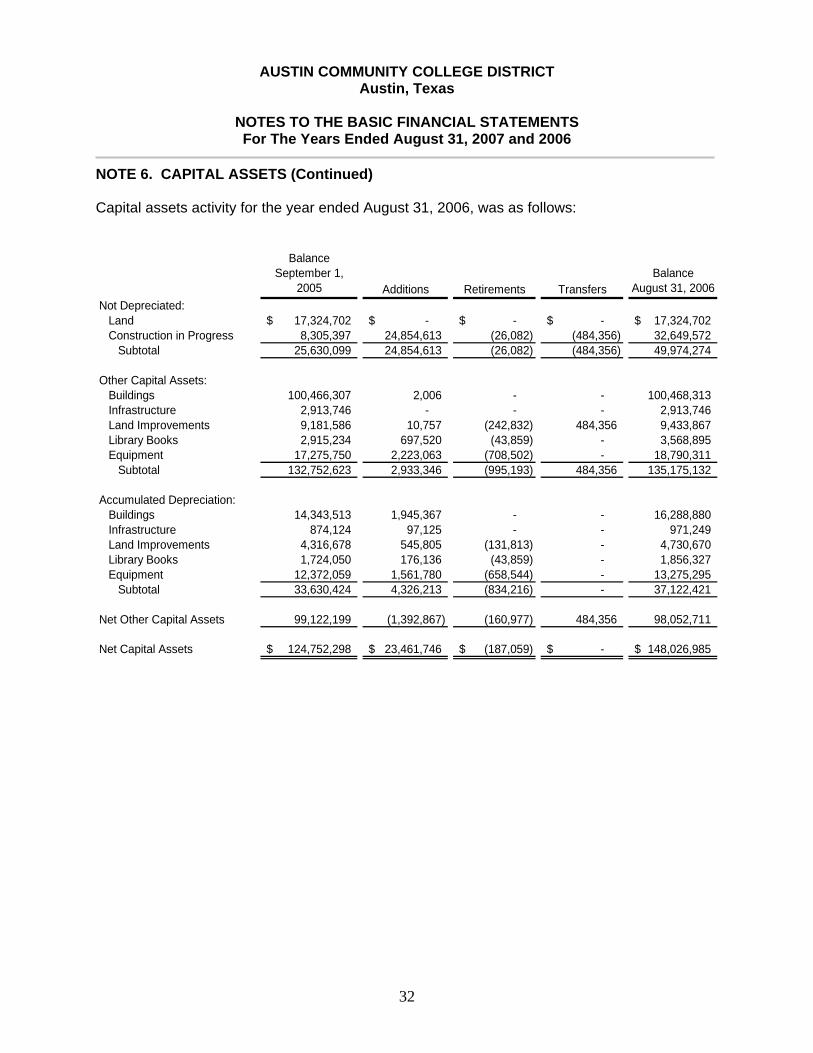
AUSTIN COMMUNITY COLLEGE DISTRICT
Austin, Texas
NOTES TO THE BASIC FINANCIAL STATEMENTS For The Years Ended August 31, 2007 and 2006
32
NOTE 6. CAPITAL ASSETS (Continued) Capital assets activity for the year ended August 31, 2006, was as follows:
Balance September 1,
2005 Additions Retirements TransfersBalance
August 31, 2006Not Depreciated: Land 17,324,702$ -$ -$ -$ 17,324,702$ Construction in Progress 8,305,397 24,854,613 (26,082) (484,356) 32,649,572 Subtotal 25,630,099 24,854,613 (26,082) (484,356) 49,974,274
Other Capital Assets: Buildings 100,466,307 2,006 - - 100,468,313 Infrastructure 2,913,746 - - - 2,913,746 Land Improvements 9,181,586 10,757 (242,832) 484,356 9,433,867 Library Books 2,915,234 697,520 (43,859) - 3,568,895 Equipment 17,275,750 2,223,063 (708,502) - 18,790,311 Subtotal 132,752,623 2,933,346 (995,193) 484,356 135,175,132
Accumulated Depreciation: Buildings 14,343,513 1,945,367 - - 16,288,880 Infrastructure 874,124 97,125 - - 971,249 Land Improvements 4,316,678 545,805 (131,813) - 4,730,670 Library Books 1,724,050 176,136 (43,859) - 1,856,327 Equipment 12,372,059 1,561,780 (658,544) - 13,275,295 Subtotal 33,630,424 4,326,213 (834,216) - 37,122,421
Net Other Capital Assets 99,122,199 (1,392,867) (160,977) 484,356 98,052,711
Net Capital Assets 124,752,298$ 23,461,746$ (187,059)$ -$ 148,026,985$
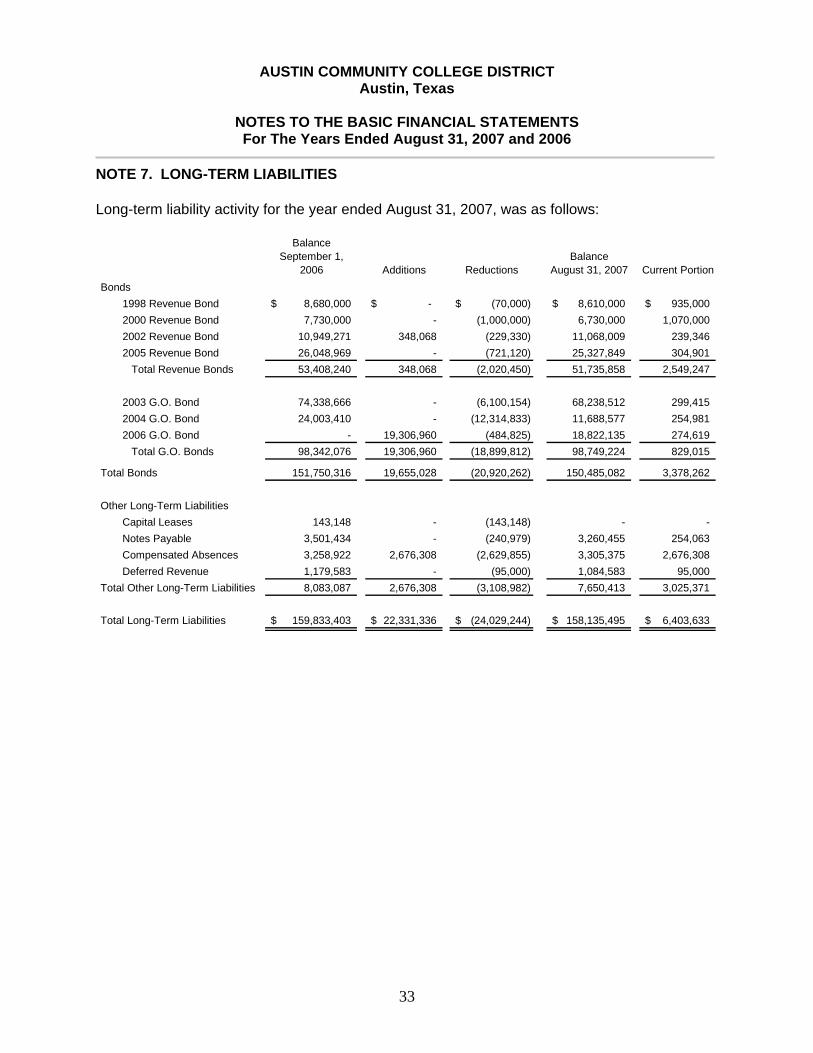
AUSTIN COMMUNITY COLLEGE DISTRICT
Austin, Texas
NOTES TO THE BASIC FINANCIAL STATEMENTS For The Years Ended August 31, 2007 and 2006
33
NOTE 7. LONG-TERM LIABILITIES Long-term liability activity for the year ended August 31, 2007, was as follows:
Balance September 1,
2006 Additions ReductionsBalance
August 31, 2007 Current PortionBonds
1998 Revenue Bond 8,680,000$ $ - (70,000)$ 8,610,000$ 935,000$ 2000 Revenue Bond 7,730,000 - (1,000,000) 6,730,000 1,070,000 2002 Revenue Bond 10,949,271 348,068 (229,330) 11,068,009 239,346 2005 Revenue Bond 26,048,969 - (721,120) 25,327,849 304,901 Total Revenue Bonds 53,408,240 348,068 (2,020,450) 51,735,858 2,549,247
2003 G.O. Bond 74,338,666 - (6,100,154) 68,238,512 299,415 2004 G.O. Bond 24,003,410 - (12,314,833) 11,688,577 254,981 2006 G.O. Bond - 19,306,960 (484,825) 18,822,135 274,619 Total G.O. Bonds 98,342,076 19,306,960 (18,899,812) 98,749,224 829,015
Total Bonds 151,750,316 19,655,028 (20,920,262) 150,485,082 3,378,262
Other Long-Term LiabilitiesCapital Leases 143,148 - (143,148) - - Notes Payable 3,501,434 - (240,979) 3,260,455 254,063 Compensated Absences 3,258,922 2,676,308 (2,629,855) 3,305,375 2,676,308 Deferred Revenue 1,179,583 - (95,000) 1,084,583 95,000
Total Other Long-Term Liabilities 8,083,087 2,676,308 (3,108,982) 7,650,413 3,025,371
Total Long-Term Liabilities 159,833,403$ 22,331,336$ (24,029,244)$ 158,135,495$ 6,403,633$
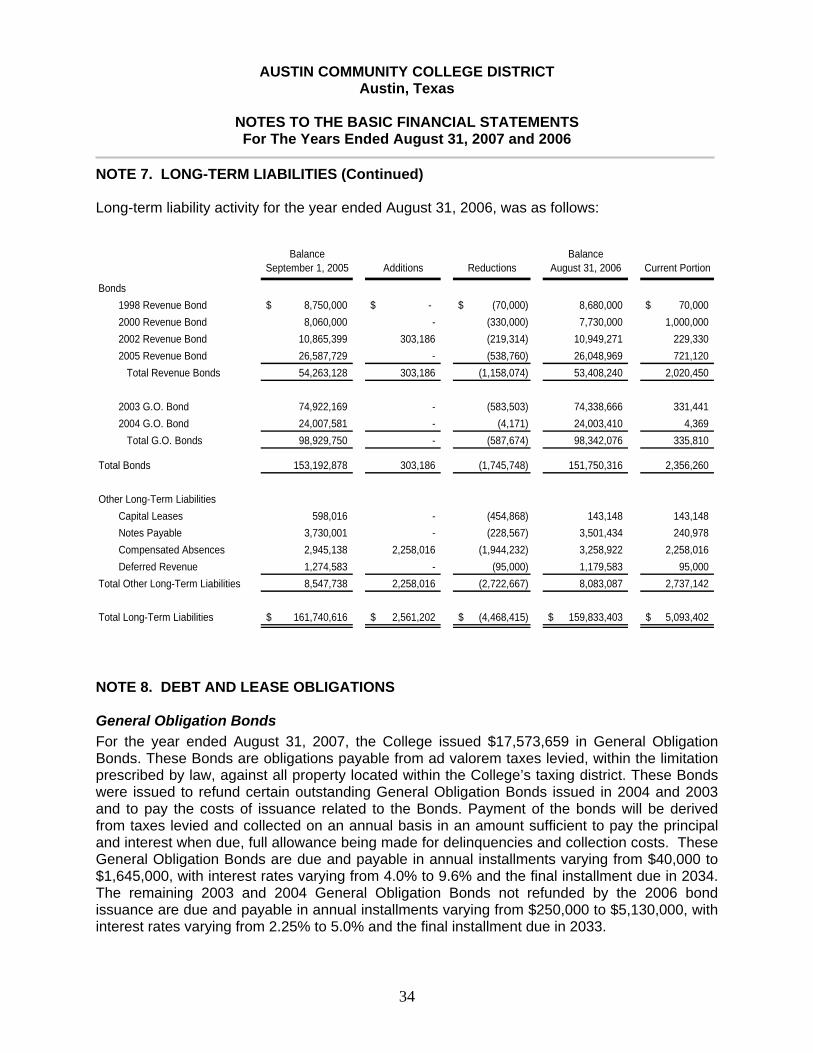
AUSTIN COMMUNITY COLLEGE DISTRICT
Austin, Texas
NOTES TO THE BASIC FINANCIAL STATEMENTS For The Years Ended August 31, 2007 and 2006
34
NOTE 7. LONG-TERM LIABILITIES (Continued) Long-term liability activity for the year ended August 31, 2006, was as follows:
Balance September 1, 2005 Additions Reductions
Balance August 31, 2006 Current Portion
Bonds1998 Revenue Bond 8,750,000$ $ - (70,000)$ 8,680,000 70,000$ 2000 Revenue Bond 8,060,000 - (330,000) 7,730,000 1,000,000 2002 Revenue Bond 10,865,399 303,186 (219,314) 10,949,271 229,330 2005 Revenue Bond 26,587,729 - (538,760) 26,048,969 721,120 Total Revenue Bonds 54,263,128 303,186 (1,158,074) 53,408,240 2,020,450
2003 G.O. Bond 74,922,169 - (583,503) 74,338,666 331,441 2004 G.O. Bond 24,007,581 - (4,171) 24,003,410 4,369 Total G.O. Bonds 98,929,750 - (587,674) 98,342,076 335,810
Total Bonds 153,192,878 303,186 (1,745,748) 151,750,316 2,356,260
Other Long-Term LiabilitiesCapital Leases 598,016 - (454,868) 143,148 143,148 Notes Payable 3,730,001 - (228,567) 3,501,434 240,978 Compensated Absences 2,945,138 2,258,016 (1,944,232) 3,258,922 2,258,016 Deferred Revenue 1,274,583 - (95,000) 1,179,583 95,000
Total Other Long-Term Liabilities 8,547,738 2,258,016 (2,722,667) 8,083,087 2,737,142
Total Long-Term Liabilities 161,740,616$ 2,561,202$ (4,468,415)$ 159,833,403$ 5,093,402$
NOTE 8. DEBT AND LEASE OBLIGATIONS General Obligation Bonds For the year ended August 31, 2007, the College issued $17,573,659 in General Obligation Bonds. These Bonds are obligations payable from ad valorem taxes levied, within the limitation prescribed by law, against all property located within the College’s taxing district. These Bonds were issued to refund certain outstanding General Obligation Bonds issued in 2004 and 2003 and to pay the costs of issuance related to the Bonds. Payment of the bonds will be derived from taxes levied and collected on an annual basis in an amount sufficient to pay the principal and interest when due, full allowance being made for delinquencies and collection costs. These General Obligation Bonds are due and payable in annual installments varying from $40,000 to $1,645,000, with interest rates varying from 4.0% to 9.6% and the final installment due in 2034. The remaining 2003 and 2004 General Obligation Bonds not refunded by the 2006 bond issuance are due and payable in annual installments varying from $250,000 to $5,130,000, with interest rates varying from 2.25% to 5.0% and the final installment due in 2033.
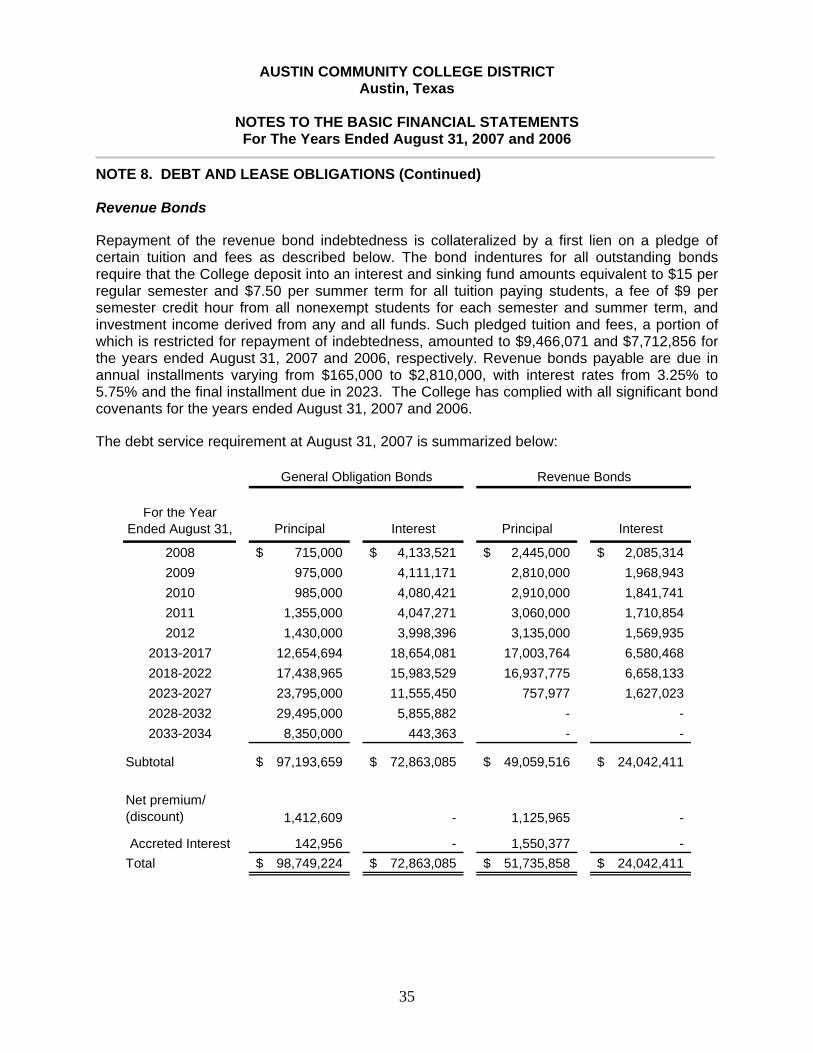
AUSTIN COMMUNITY COLLEGE DISTRICT
Austin, Texas
NOTES TO THE BASIC FINANCIAL STATEMENTS For The Years Ended August 31, 2007 and 2006
35
NOTE 8. DEBT AND LEASE OBLIGATIONS (Continued) Revenue Bonds
Repayment of the revenue bond indebtedness is collateralized by a first lien on a pledge of certain tuition and fees as described below. The bond indentures for all outstanding bonds require that the College deposit into an interest and sinking fund amounts equivalent to $15 per regular semester and $7.50 per summer term for all tuition paying students, a fee of $9 per semester credit hour from all nonexempt students for each semester and summer term, and investment income derived from any and all funds. Such pledged tuition and fees, a portion of which is restricted for repayment of indebtedness, amounted to $9,466,071 and $7,712,856 for the years ended August 31, 2007 and 2006, respectively. Revenue bonds payable are due in annual installments varying from $165,000 to $2,810,000, with interest rates from 3.25% to 5.75% and the final installment due in 2023. The College has complied with all significant bond covenants for the years ended August 31, 2007 and 2006.
The debt service requirement at August 31, 2007 is summarized below:
For the Year Ended August 31, Principal Interest Principal Interest
2008 715,000$ 4,133,521$ 2,445,000$ 2,085,314$ 2009 975,000 4,111,171 2,810,000 1,968,943 2010 985,000 4,080,421 2,910,000 1,841,741 2011 1,355,000 4,047,271 3,060,000 1,710,854 2012 1,430,000 3,998,396 3,135,000 1,569,935
2013-2017 12,654,694 18,654,081 17,003,764 6,580,468 2018-2022 17,438,965 15,983,529 16,937,775 6,658,133 2023-2027 23,795,000 11,555,450 757,977 1,627,023 2028-2032 29,495,000 5,855,882 - - 2033-2034 8,350,000 443,363 - -
Subtotal 97,193,659$ 72,863,085$ 49,059,516$ 24,042,411$
Net premium/ (discount) 1,412,609 - 1,125,965 -
Accreted Interest 142,956 - 1,550,377 - Total 98,749,224$ 72,863,085$ 51,735,858$ 24,042,411$
General Obligation Bonds Revenue Bonds
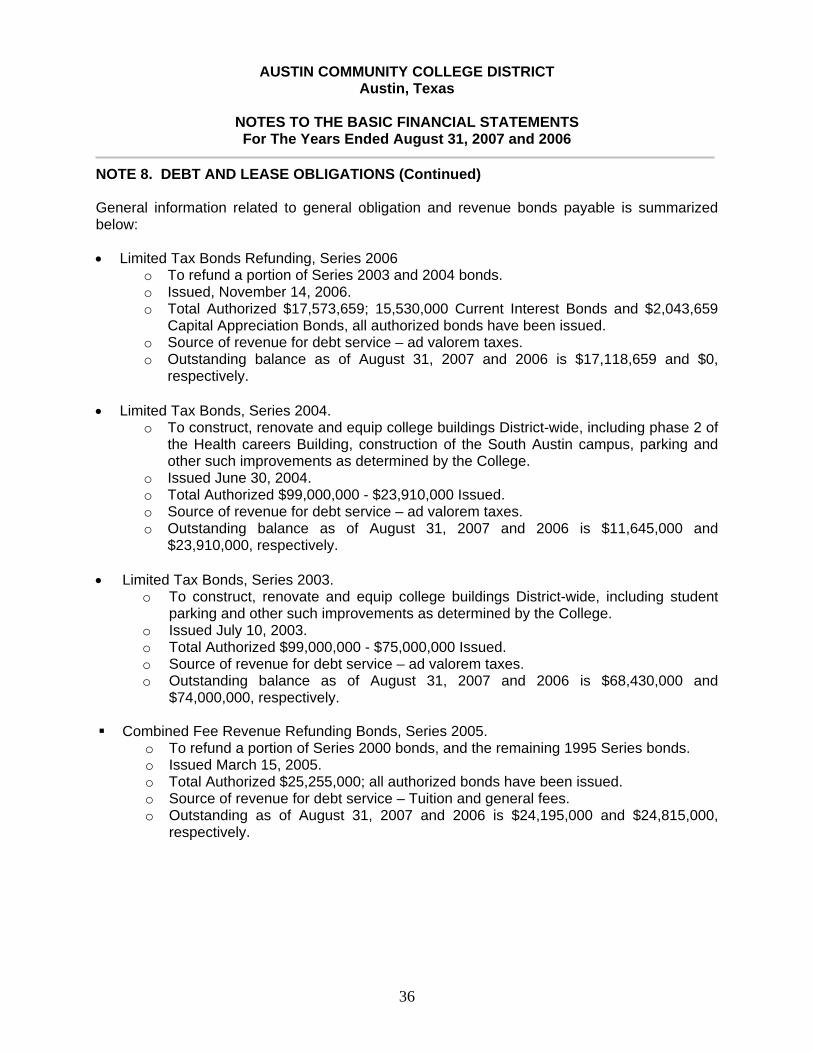
AUSTIN COMMUNITY COLLEGE DISTRICT
Austin, Texas
NOTES TO THE BASIC FINANCIAL STATEMENTS For The Years Ended August 31, 2007 and 2006
36
NOTE 8. DEBT AND LEASE OBLIGATIONS (Continued) General information related to general obligation and revenue bonds payable is summarized below:
• Limited Tax Bonds Refunding, Series 2006 o To refund a portion of Series 2003 and 2004 bonds. o Issued, November 14, 2006. o Total Authorized $17,573,659; 15,530,000 Current Interest Bonds and $2,043,659
Capital Appreciation Bonds, all authorized bonds have been issued. o Source of revenue for debt service – ad valorem taxes. o Outstanding balance as of August 31, 2007 and 2006 is $17,118,659 and $0,
respectively.
• Limited Tax Bonds, Series 2004. o To construct, renovate and equip college buildings District-wide, including phase 2 of
the Health careers Building, construction of the South Austin campus, parking and other such improvements as determined by the College.
o Issued June 30, 2004. o Total Authorized $99,000,000 - $23,910,000 Issued. o Source of revenue for debt service – ad valorem taxes. o Outstanding balance as of August 31, 2007 and 2006 is $11,645,000 and
$23,910,000, respectively.
• Limited Tax Bonds, Series 2003. o To construct, renovate and equip college buildings District-wide, including student
parking and other such improvements as determined by the College. o Issued July 10, 2003. o Total Authorized $99,000,000 - $75,000,000 Issued. o Source of revenue for debt service – ad valorem taxes. o Outstanding balance as of August 31, 2007 and 2006 is $68,430,000 and
$74,000,000, respectively.
Combined Fee Revenue Refunding Bonds, Series 2005. o To refund a portion of Series 2000 bonds, and the remaining 1995 Series bonds. o Issued March 15, 2005. o Total Authorized $25,255,000; all authorized bonds have been issued. o Source of revenue for debt service – Tuition and general fees. o Outstanding as of August 31, 2007 and 2006 is $24,195,000 and $24,815,000,
respectively.

AUSTIN COMMUNITY COLLEGE DISTRICT
Austin, Texas
NOTES TO THE BASIC FINANCIAL STATEMENTS For The Years Ended August 31, 2007 and 2006
37
NOTE 8. DEBT AND LEASE OBLIGATIONS (Continued)
Combined Fee Revenue Refunding Bonds, Series 2002. o To purchase, acquire, renovate, construct and equip certain district facilities and to
refund the remaining 1992 Series bonds. o Issued March 4, 2002. o Total Authorized $10,389,516 - $5,805,000 Current Interest Bonds and $4,584,516
capital Appreciation Bonds, all authorized bonds have been issued. o Source of revenue for debt service – Tuition and general fees. o Outstanding as of August 31, 2007 and 2006 is $9,524,516 and $9,754,516,
respectively.
Combined Fee Revenue Refunding Bonds, Series 2000. o To purchase, acquire, renovate, enlarge, construct and equip certain facilities of the
College; to refund a portion of the College’s currently outstanding Series 1995 Bonds.
o Issued October 1, 2000. o Total authorized of $31,365,000; all authorized bonds have been issued. o Source of revenue for debt service – Tuition and general fees. o Outstanding as of August 31, 2007 and 2006 is $6,730,000 and $7,730,000,
respectively.
Combined Fee Revenue Refunding Bonds, Series 1998. o To refund a portion of Series 1995 bonds. o Issued April 1, 1998. o Total authorized of $9,160,000; all authorized bonds have been issued. o Source of revenue for debt service – Tuition fees and general fees. o Outstanding as of August 31, 2007 and 2006 is $8,610,000 and $8,680,000,
respectively. Arbitrage
The Tax Reform Act of 1986 instituted certain arbitrage restrictions with respect to the issuance of tax-exempt bonds after August 31, 1986. Arbitrage regulations deal with the investment of all tax-exempt bond proceeds at an interest yield greater than the interest yield paid to bondholders. Generally, all interest paid to bondholders can be retroactively rendered taxable if applicable rebates are not reported and paid to the Internal Revenue Service (IRS) at least every five years. During the current year, the College performed calculations of excess investment earnings on various bonds and financings and at August 31, 2007 does not expect to incur a liability.
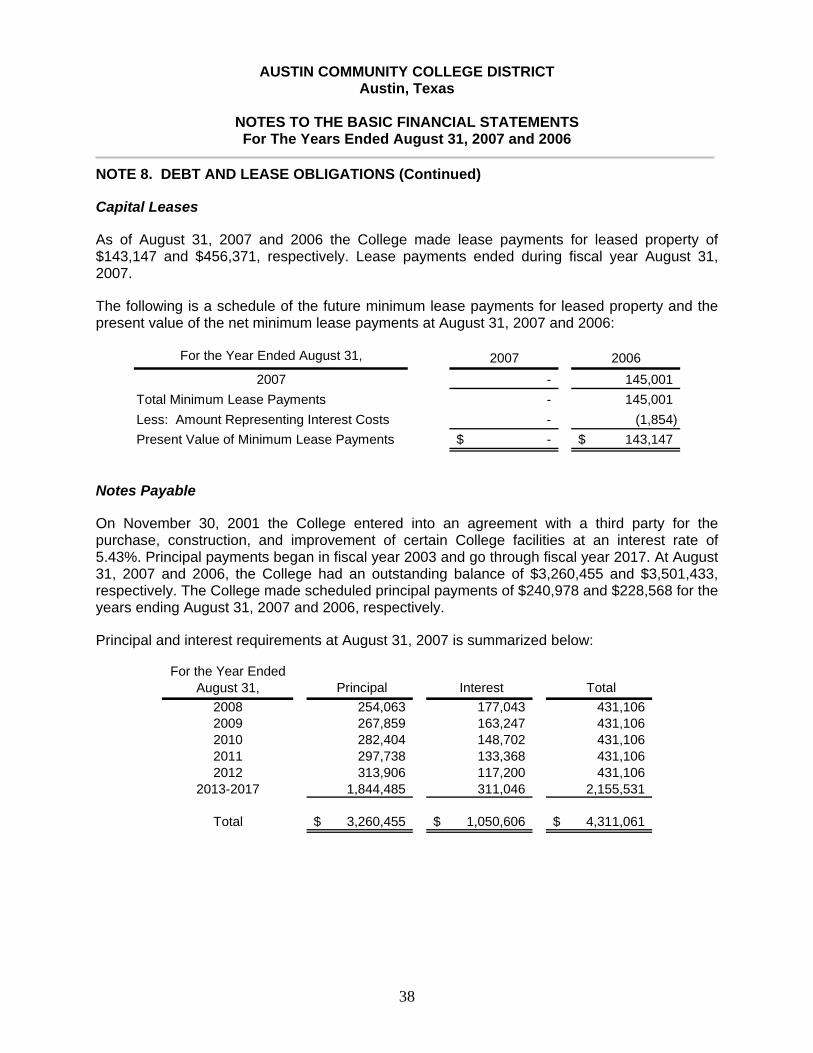
AUSTIN COMMUNITY COLLEGE DISTRICT
Austin, Texas
NOTES TO THE BASIC FINANCIAL STATEMENTS For The Years Ended August 31, 2007 and 2006
38
NOTE 8. DEBT AND LEASE OBLIGATIONS (Continued)
Capital Leases
As of August 31, 2007 and 2006 the College made lease payments for leased property of $143,147 and $456,371, respectively. Lease payments ended during fiscal year August 31, 2007.
The following is a schedule of the future minimum lease payments for leased property and the present value of the net minimum lease payments at August 31, 2007 and 2006:
For the Year Ended August 31, 2007 20062007 - 145,001
Total Minimum Lease Payments - 145,001 Less: Amount Representing Interest Costs - (1,854) Present Value of Minimum Lease Payments -$ 143,147$
Notes Payable
On November 30, 2001 the College entered into an agreement with a third party for the purchase, construction, and improvement of certain College facilities at an interest rate of 5.43%. Principal payments began in fiscal year 2003 and go through fiscal year 2017. At August 31, 2007 and 2006, the College had an outstanding balance of $3,260,455 and $3,501,433, respectively. The College made scheduled principal payments of $240,978 and $228,568 for the years ending August 31, 2007 and 2006, respectively.
Principal and interest requirements at August 31, 2007 is summarized below:
For the Year Ended August 31, Principal Interest Total
2008 254,063 177,043 431,106 2009 267,859 163,247 431,106 2010 282,404 148,702 431,106 2011 297,738 133,368 431,106 2012 313,906 117,200 431,106
2013-2017 1,844,485 311,046 2,155,531
Total 3,260,455$ 1,050,606$ 4,311,061$

AUSTIN COMMUNITY COLLEGE DISTRICT
Austin, Texas
NOTES TO THE BASIC FINANCIAL STATEMENTS For The Years Ended August 31, 2007 and 2006
39
NOTE 9. DEFEASED BONDS OUTSTANDING
The liability for the bonds below does not appear on the College’s financial statements as these bonds are considered legally defeased as of August 31, 2007 and 2006:
Year Refunded
2007 Par Value
Outstanding
2006 Par Value
Outstanding
Limited Tax Bonds, Series 2004 2006 12,265,000$ -$
Limited Tax Bonds, Series 2003 2006 5,320,000 -
Combined Fee Revenue andRefunding Bonds, Series 2000 2005 22,165,000 22,165,000
Combined Fee Revenue Buildingand Refunding Bonds, Series 1995 2005 1,345,000 2,445,000
Combined Fee Revenue Buildingand Refunding Bonds, Series 1995 1998 8,345,000 8,345,000
Combined Fee Revenue Bonds, Series 1991 1995 1,505,000 1,815,000
50,945,000$ 34,770,000$
Bond Issued
On November 14, 2006, the College issued Limited Tax Refunding Bonds, Series 2006, to refund a portion of the Series 2003 and Series 2004 bonds. The par value of the refunding bonds was $17,573,659. The present value of the net refunding gain was $671,953. The total cash flows required to service the refunded bonds and cash flows required to service the refunding bonds as of the effective date of the refunding were $36,553,525 and $35,496,322, respectively.
NOTE 10. OPERATING LEASE COMMITMENTS AND RENTAL AGREEMENTS
The College leases various classrooms, offices, parking lots, and equipment under Rental Agreements. These agreements have clauses which allow the College to terminate the agreement if funding becomes unavailable or the Board does not approve funding. Rental payments during the fiscal year ended August 31, 2007 and 2006 were $1,392,490 and $1,501,007, respectively.
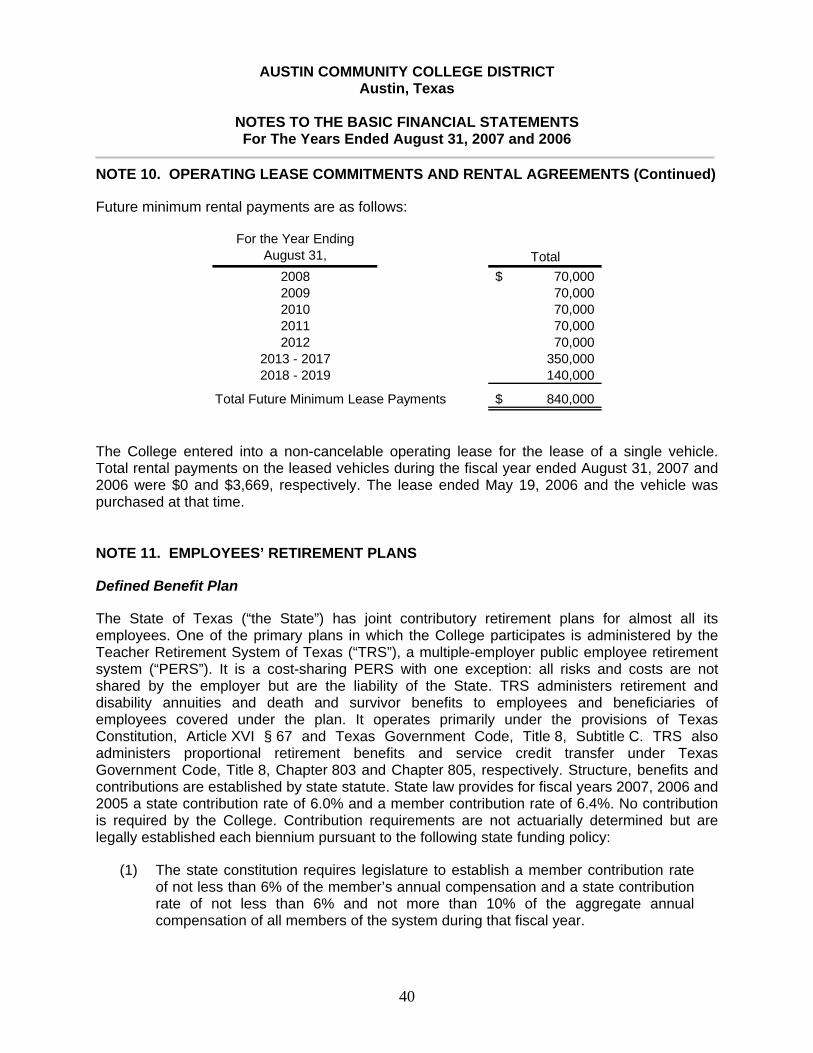
AUSTIN COMMUNITY COLLEGE DISTRICT
Austin, Texas
NOTES TO THE BASIC FINANCIAL STATEMENTS For The Years Ended August 31, 2007 and 2006
40
NOTE 10. OPERATING LEASE COMMITMENTS AND RENTAL AGREEMENTS (Continued)
Future minimum rental payments are as follows:
For the Year Ending August 31, Total
2008 70,000$ 2009 70,000 2010 70,000 2011 70,000 2012 70,000
2013 - 2017 350,000 2018 - 2019 140,000
Total Future Minimum Lease Payments 840,000$
The College entered into a non-cancelable operating lease for the lease of a single vehicle. Total rental payments on the leased vehicles during the fiscal year ended August 31, 2007 and 2006 were $0 and $3,669, respectively. The lease ended May 19, 2006 and the vehicle was purchased at that time.
NOTE 11. EMPLOYEES’ RETIREMENT PLANS
Defined Benefit Plan
The State of Texas (“the State”) has joint contributory retirement plans for almost all its employees. One of the primary plans in which the College participates is administered by the Teacher Retirement System of Texas (“TRS”), a multiple-employer public employee retirement system (“PERS”). It is a cost-sharing PERS with one exception: all risks and costs are not shared by the employer but are the liability of the State. TRS administers retirement and disability annuities and death and survivor benefits to employees and beneficiaries of employees covered under the plan. It operates primarily under the provisions of Texas Constitution, Article XVI § 67 and Texas Government Code, Title 8, Subtitle C. TRS also administers proportional retirement benefits and service credit transfer under Texas Government Code, Title 8, Chapter 803 and Chapter 805, respectively. Structure, benefits and contributions are established by state statute. State law provides for fiscal years 2007, 2006 and 2005 a state contribution rate of 6.0% and a member contribution rate of 6.4%. No contribution is required by the College. Contribution requirements are not actuarially determined but are legally established each biennium pursuant to the following state funding policy:
(1) The state constitution requires legislature to establish a member contribution rate of not less than 6% of the member’s annual compensation and a state contribution rate of not less than 6% and not more than 10% of the aggregate annual compensation of all members of the system during that fiscal year.
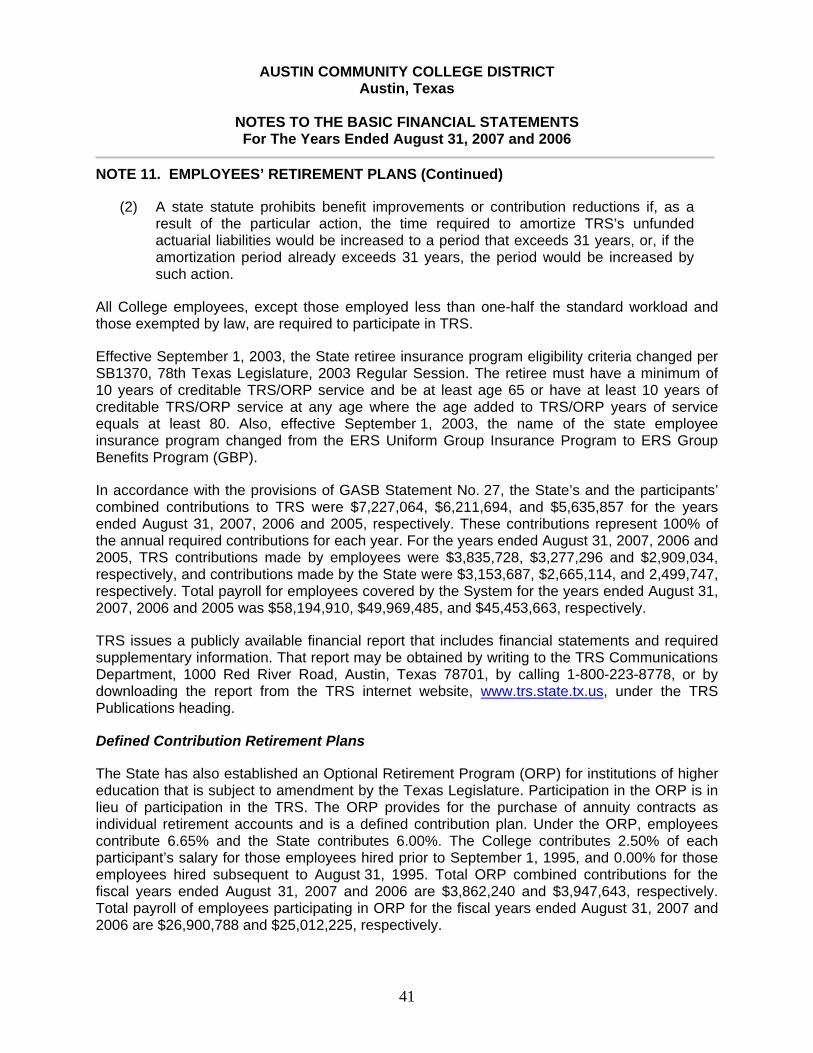
AUSTIN COMMUNITY COLLEGE DISTRICT
Austin, Texas
NOTES TO THE BASIC FINANCIAL STATEMENTS For The Years Ended August 31, 2007 and 2006
41
NOTE 11. EMPLOYEES’ RETIREMENT PLANS (Continued)
(2) A state statute prohibits benefit improvements or contribution reductions if, as a result of the particular action, the time required to amortize TRS’s unfunded actuarial liabilities would be increased to a period that exceeds 31 years, or, if the amortization period already exceeds 31 years, the period would be increased by such action.
All College employees, except those employed less than one-half the standard workload and those exempted by law, are required to participate in TRS.
Effective September 1, 2003, the State retiree insurance program eligibility criteria changed per SB1370, 78th Texas Legislature, 2003 Regular Session. The retiree must have a minimum of 10 years of creditable TRS/ORP service and be at least age 65 or have at least 10 years of creditable TRS/ORP service at any age where the age added to TRS/ORP years of service equals at least 80. Also, effective September 1, 2003, the name of the state employee insurance program changed from the ERS Uniform Group Insurance Program to ERS Group Benefits Program (GBP).
In accordance with the provisions of GASB Statement No. 27, the State’s and the participants’ combined contributions to TRS were $7,227,064, $6,211,694, and $5,635,857 for the years ended August 31, 2007, 2006 and 2005, respectively. These contributions represent 100% of the annual required contributions for each year. For the years ended August 31, 2007, 2006 and 2005, TRS contributions made by employees were $3,835,728, $3,277,296 and $2,909,034, respectively, and contributions made by the State were $3,153,687, $2,665,114, and 2,499,747, respectively. Total payroll for employees covered by the System for the years ended August 31, 2007, 2006 and 2005 was $58,194,910, $49,969,485, and $45,453,663, respectively.
TRS issues a publicly available financial report that includes financial statements and required supplementary information. That report may be obtained by writing to the TRS Communications Department, 1000 Red River Road, Austin, Texas 78701, by calling 1-800-223-8778, or by downloading the report from the TRS internet website, www.trs.state.tx.us, under the TRS Publications heading.
Defined Contribution Retirement Plans
The State has also established an Optional Retirement Program (ORP) for institutions of higher education that is subject to amendment by the Texas Legislature. Participation in the ORP is in lieu of participation in the TRS. The ORP provides for the purchase of annuity contracts as individual retirement accounts and is a defined contribution plan. Under the ORP, employees contribute 6.65% and the State contributes 6.00%. The College contributes 2.50% of each participant’s salary for those employees hired prior to September 1, 1995, and 0.00% for those employees hired subsequent to August 31, 1995. Total ORP combined contributions for the fiscal years ended August 31, 2007 and 2006 are $3,862,240 and $3,947,643, respectively. Total payroll of employees participating in ORP for the fiscal years ended August 31, 2007 and 2006 are $26,900,788 and $25,012,225, respectively.
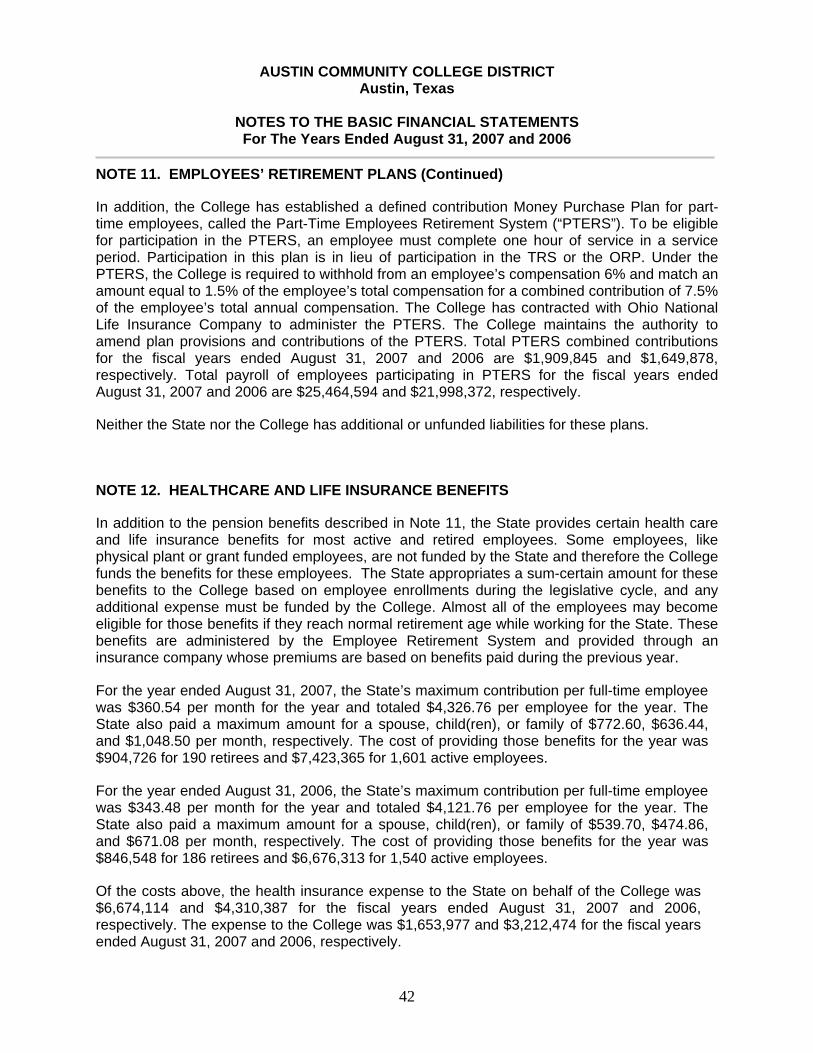
AUSTIN COMMUNITY COLLEGE DISTRICT
Austin, Texas
NOTES TO THE BASIC FINANCIAL STATEMENTS For The Years Ended August 31, 2007 and 2006
42
NOTE 11. EMPLOYEES’ RETIREMENT PLANS (Continued)
In addition, the College has established a defined contribution Money Purchase Plan for part-time employees, called the Part-Time Employees Retirement System (“PTERS”). To be eligible for participation in the PTERS, an employee must complete one hour of service in a service period. Participation in this plan is in lieu of participation in the TRS or the ORP. Under the PTERS, the College is required to withhold from an employee’s compensation 6% and match an amount equal to 1.5% of the employee’s total compensation for a combined contribution of 7.5% of the employee’s total annual compensation. The College has contracted with Ohio National Life Insurance Company to administer the PTERS. The College maintains the authority to amend plan provisions and contributions of the PTERS. Total PTERS combined contributions for the fiscal years ended August 31, 2007 and 2006 are $1,909,845 and $1,649,878, respectively. Total payroll of employees participating in PTERS for the fiscal years ended August 31, 2007 and 2006 are $25,464,594 and $21,998,372, respectively.
Neither the State nor the College has additional or unfunded liabilities for these plans.
NOTE 12. HEALTHCARE AND LIFE INSURANCE BENEFITS
In addition to the pension benefits described in Note 11, the State provides certain health care and life insurance benefits for most active and retired employees. Some employees, like physical plant or grant funded employees, are not funded by the State and therefore the College funds the benefits for these employees. The State appropriates a sum-certain amount for these benefits to the College based on employee enrollments during the legislative cycle, and any additional expense must be funded by the College. Almost all of the employees may become eligible for those benefits if they reach normal retirement age while working for the State. These benefits are administered by the Employee Retirement System and provided through an insurance company whose premiums are based on benefits paid during the previous year.
For the year ended August 31, 2007, the State’s maximum contribution per full-time employee was $360.54 per month for the year and totaled $4,326.76 per employee for the year. The State also paid a maximum amount for a spouse, child(ren), or family of $772.60, $636.44, and $1,048.50 per month, respectively. The cost of providing those benefits for the year was $904,726 for 190 retirees and $7,423,365 for 1,601 active employees.
For the year ended August 31, 2006, the State’s maximum contribution per full-time employee was $343.48 per month for the year and totaled $4,121.76 per employee for the year. The State also paid a maximum amount for a spouse, child(ren), or family of $539.70, $474.86, and $671.08 per month, respectively. The cost of providing those benefits for the year was $846,548 for 186 retirees and $6,676,313 for 1,540 active employees.
Of the costs above, the health insurance expense to the State on behalf of the College was $6,674,114 and $4,310,387 for the fiscal years ended August 31, 2007 and 2006, respectively. The expense to the College was $1,653,977 and $3,212,474 for the fiscal years ended August 31, 2007 and 2006, respectively.
AUSTIN COMMUNITY COLLEGE DISTRICT
Austin, Texas
NOTES TO THE BASIC FINANCIAL STATEMENTS For The Years Ended August 31, 2007 and 2006
43
NOTE 12. HEALTHCARE AND LIFE INSURANCE BENEFITS (Continued)
The Governmental Accounting Standards Board Statement No. 45, Accounting and Financial Reporting by Employers for Post Employment Benefits Other than Pensions, has been issued and will be effective for the fiscal year ending August 31, 2008. The College has not yet determined the effect on the financial statements for implementation of the new standard. NOTE 13. ON-BEHALF PAYMENTS
For the fiscal years ended August 31, 2007 and 2006 the College recorded State on-behalf contributions for the Teacher’s Retirement System of $3,153,687 and $2,659,576, respectively, and contributions for the Optional Retirement Program of $1,590,145 and $1,489,295, respectively, and contributions for health insurance of $6,674,114 and $4,310,387, respectively. The State’s total on-behalf contributions for the fiscal years ended August 31, 2007 and 2006 of $11,417,946 and $8,459,258, respectively, were recorded as revenues and expenses in the accompanying basic financial statements. NOTE 14. COMPENSATED ABSENCES
Full-time employees earn annual leave from 10 to 13.34 hours per month depending on the number of years employed with the College. The College’s policy is that classified, professional-technical or administrative employees may accrue up to 240 hours of annual leave.
Sick leave, which is limited to a maximum of 1,200 hours, is earned at the rate of eight (8) hours per month. The maximum sick leave that may be paid to an employee when he retires or otherwise terminates employment is one-half of the employee’s accumulated entitlement in excess of 960 hours. The College’s policy is to recognize the cost of sick leave when earned, which provides for the College’s maximum vested liability.
For the fiscal years ended August 31, 2007 and 2006 the College recognized $3,305,375 and $3,258,922, respectively, as an accrued liability for the unpaid annual and sick leave. The College’s reporting of accrued liabilities for compensated absences is in accordance with Governmental Accounting Standards Board (GASB) Statement No. 16, Accounting for Compensated Absences. The total amount accrued at August 31, 2007, of $3,305,375 is allocated $788,724 to sick leave and $2,516,651 to annual leave. The total amount accrued at August 31, 2006 of $3,258,922 is allocated $755,378 to sick leave and $2,503,544 to annual leave.

AUSTIN COMMUNITY COLLEGE DISTRICT
Austin, Texas
NOTES TO THE BASIC FINANCIAL STATEMENTS For The Years Ended August 31, 2007 and 2006
44
NOTE 15. PENDING LAWSUITS AND CLAIMS
On August 31, 2007 and 2006, various lawsuits and claims involving the College were pending. While the ultimate liability with respect to litigation and other claims asserted against the College cannot be reasonably estimated at this time, this liability, to the extent not provided for by insurance or otherwise, is not likely to have a material effect on the College.
The College receives federal, state and local grants that are subject to review and audit by the grantor agencies. Such audits could lead to requests for reimbursement to the grantor agency for expenditures disallowed under terms of the grant. The College’s management believes such disallowances, if any, will not have a material effect on the basic financial statements.
NOTE 16. DISAGGREGATION OF RECEIVABLES AND PAYABLES BALANCES
Receivables
Accounts Receivable at August 31, 2007 and 2006 were as follows:
2007 2006Tuition and Fees Receivable (net of allowance for doubtful accounts of $1,798,153 and $1,366,165) 5,749,546$ 5,855,582$ Taxes Receivable 1,743,644 1,513,095 Contracts and Grants Receivable 3,894,041 2,475,266 Investment Income Receivable 186,009 155,325 Other Receivable 202,815 173,559 Total Receivables 11,776,055$ 10,172,827$
Payables
Payable balances at August 31, 2007 and 2006 were as follows:
2007 2006Payable to Vendors 5,836,956$ 6,452,907$ Salaries and Benefits Payable 3,007,747 2,523,816 Payable to Students 1,113,741 1,340,204 Accrued Interest Payable 522,779 551,028 Construction Retainage 1,012,154 1,301,072 Workers Compensation Estimated Claims - 148,223 Total Payables 11,493,377$ 12,317,250$
AUSTIN COMMUNITY COLLEGE DISTRICT
Austin, Texas
NOTES TO THE BASIC FINANCIAL STATEMENTS For The Years Ended August 31, 2007 and 2006
45
NOTE 17. DEFERRED LEASE – CITY OF AUSTIN
In 1997, the College and the City of Austin (“the City”) desired to jointly develop a “One Stop Career Center” to more efficiently coordinate the training and employment of individuals needing specialized vocational job training and educational opportunities. In order to accomplish and develop the Center, the College and the City executed several lease agreements on June 27, 1997, that allow the City to provide money to the College for the construction of the One Stop Career Center as part of the College’s development of its Eastview Campus.
The College entered into a long-term lease for twenty years with the City for the lease of a portion of the facilities. Immediately following execution of this lease, the College and the City entered into a sublease agreement in connection with the lease-back of the premises to the College. The sublease is effective the date of the prime lease and is subject to the condition that the College will enter into a second sublease with the Capital Area Workforce Development Board for the ultimate purpose of providing work space for the One Stop Career Center.
The City funded this lease with funds received from the United States Department of Housing and Urban Development, and it discounted the cost of the rent payment under the Sublease Agreement with the College as a grant to enable the College to reduce the cost of its sublease to the Development Board for the Career Center project.
The College and the City agreed that the City would begin paying an annual base rent of $95,000 once the building was completed, or by May 31, 2000. As a result of the prime lease, the City prepaid the entire twenty year annual base rent of $1,900,000 to the College. For the years ended August 31, 2007 and 2006, the College has recognized $95,000 each year as lease payments. The remaining liability is recorded as an unearned revenue for the fiscal years ended August 31, 2007 and 2006 in the amounts of $1,084,583 and $1,179,583, respectively.
NOTE 18. FUNDS HELD FOR OTHERS
The College holds funds for certain student organizations and other agencies. These amounts are reflected in the basic financial statements as funds held for others in the amount of $810,596 and $170,078 for the fiscal years ended August 31, 2007 and 2006, respectively.
AUSTIN COMMUNITY COLLEGE DISTRICT
Austin, Texas
NOTES TO THE BASIC FINANCIAL STATEMENTS For The Years Ended August 31, 2007 and 2006
46
NOTE 19. CONTRACT AND GRANT AWARDS
Contract and grant awards are accounted for in accordance with accounting principles generally accepted in the United States of America. Revenues are recognized on Statements of Revenues, Expenses and Changes in Net Assets (Exhibit 2) and Schedule of Operating Revenues (Schedule A). Contract and grant awards for which funds are expended but not yet collected are included in Accounts Receivable in the Statement of Net Assets (See Contracts and Grants Receivable, Note 16). Contract and grant awards that are not yet funded or expended are not included in the financial statements. Contract and grant awards funds already committed, e.g., multi-year awards, or funds awarded during fiscal years ended August 31, 2007 and 2006 for which no expenses have been incurred totaled $7,279,992 and $8,393,338, respectively.
These amounts are comprised of the following:
2007 2006
Federal Contracts and Grant Awards 5,199,420$ 7,167,383$ State Contracts and Grant Awards 890,343 1,048,166
Local Contracts and Grant Awards 53,554 46,001Private Contracts and Grant Awards 1,136,675 131,788
Total 7,279,992$ 8,393,338$
NOTE 20. SELF-INSURED PLANS
As of December 31, 1999, the College ended its Self-Insurance program (which had been in effect since 1992) and became fully insured for workers compensation. All open claims initiated under the Self-Insurance Program are now fully covered under the College’s new workers compensation insurance policy. Therefore, the College no longer records a liability related to the Self-Insurance Program. NOTE 21. PROPERTY TAXES
The College's ad valorem property tax is levied each October 1 on the assessed value listed as of the prior January 1 for all real and business personal property located in the College's taxing jurisdiction. The College’s Taxable Assessed Values for the years ended August 31, 2007 and 2006 are as follows:

AUSTIN COMMUNITY COLLEGE DISTRICT
Austin, Texas
NOTES TO THE BASIC FINANCIAL STATEMENTS For The Years Ended August 31, 2007 and 2006
47
NOTE 21. PROPERTY TAXES (Continued)
2007 2006Assessed Valuation 84,941,603,275$ 64,377,924,692$ Less: Exemptions (13,819,387,700) (10,508,012,501) Less: Abatements - - Net Assessed Valuation 71,122,215,575$ 53,869,912,191$
Tax rates for the years ended August 31, 2007 and 2006, are as follows:
Fiscal Year 2007:Current
OperationsDebt
Service TotalAuthorized Tax Rate per $100 Valuation 0.0900$ 0.0100$ 0.1000$ Assessed Tax Rate per $100 Valuation 0.0900$ 0.0065$ 0.0965$
Fiscal Year 2006:Current
OperationsDebt
Service TotalAuthorized Tax Rate per $100 Valuation 0.0900$ 0.0100$ 0.1000$ Assessed Tax Rate per $100 Valuation 0.0900$ 0.0091$ 0.0991$
Taxes levied for the years ended August 31, 2007 and 2006 are $70,835,872 and $53,567,418, respectively (which includes any penalty and interest assessed, if applicable). Taxes are due on receipt of the tax bill and are delinquent if not paid before February 1st of the year following the year in which imposed. On January 1 of each year a tax lien attaches to property to secure payment of all taxes, penalties, and interest.
Taxes collected for the years ended August 31, 2007 and 2006, are as follows:
Fiscal Year 2007:Current
OperationsDebt
Service TotalCurrent Taxes Collected 65,578,244$ 4,618,495$ 70,196,739$ Delinquent Taxes Collected 334,707 23,572 358,279 Penalties & Interest Collected 338,405 23,833 362,238 Total Collections 66,251,356$ 4,665,900$ 70,917,256$
AUSTIN COMMUNITY COLLEGE DISTRICT
Austin, Texas
NOTES TO THE BASIC FINANCIAL STATEMENTS For The Years Ended August 31, 2007 and 2006
48
NOTE 21. PROPERTY TAXES (Continued)
Fiscal Year 2006:Current
OperationsDebt
Service TotalCurrent Taxes Collected 48,191,860$ 4,845,592$ 53,037,452$ Delinquent Taxes Collected 275,525 27,703 303,228 Penalties & Interest Collected 274,128 27,563 301,691 Total Collections 48,741,513$ 4,900,858$ 53,642,371$
Tax collections for the years ended August 31, 2007 and 2006 are 98.97% and 98.85%, respectively, of the current tax levy. The College does not record an allowance for uncollectibles against property taxes since the allowance would not be material to the basic financial statements. The use of tax proceeds is restricted to maintenance and operations and debt service.
NOTE 22. INCOME TAXES
The College is exempt from income taxes under Internal Revenue Code Section 115, Income of States, Municipalities, Etc., although unrelated business income may be subject to income taxes under Internal Revenue Code Section 511(a)(2)(B), Imposition of Tax on Unrelated Business Income of Charitable, etc., Organizations. During the fiscal year ended August 31, 2007 and 2006, the College has approximately $1,600 and $1,373, respectively, of unrelated business income tax expense, with no tax liability as of August 31, 2007 and 2006.
NOTE 23. DISCRETE COMPONENT UNIT– AUSTIN COMMUNITY COLLEGE FOUNDATION
Austin Community College Foundation (“the Foundation”) is a Texas nonprofit corporation chartered in 1991 to provide supplemental financial resources to advance the institutional goals and expand the educational services of the College. It is the intention of the Foundation to support educational initiatives which will enhance the quality of facilities and instruction, increase and diversify educational services, and improve accessibility to educational opportunities for students, faculty, staff, and residents of the geographic areas served by the College. The Foundation is accounted for separately in the Basic Financial Statements of the College and has a May 31 fiscal year end.
Complete financial statements of Austin Community College Foundation can be obtained from the administrative office of the Austin Community College District.
AUSTIN COMMUNITY COLLEGE DISTRICT
Austin, Texas
NOTES TO THE BASIC FINANCIAL STATEMENTS For The Years Ended August 31, 2007 and 2006
49
NOTE 23. DISCRETE COMPONENT UNIT– AUSTIN COMMUNITY COLLEGE FOUNDATION (Continued) College/Foundation Transactions The purpose of the Foundation is to support funding initiatives of the College, including remitting proceeds of funding initiatives of the College. For the years ended May 31, 2007 and 2006, the Foundation remitted $223,525 and $214,997, respectively, to the College for scholarships and programs. At May 31, 2007 and 2006, the Foundation had accounts payable balances of $0 and $0, respectively, due to the College for restricted funds received during the years then ended which had not been remitted as of May 31, 2007 and 2006, respectively. The Foundation’s operation and fundraising expenses are paid for by the College. No accruals have been made in the Foundation’s financial statements to provide for these revenues and expenses for the year ended May 31, 2007 and 2006.
Income Tax Status
The Foundation, a nonprofit corporation operating under 501(c)(3) of the Internal Revenue Code, is generally exempt from federal income taxes and, accordingly, no provision for income taxes is included in the financial statements.
NOTE 24. JOINTLY GOVERNED ORGANIZATION
The College entered into a telecommunications network interlocal agreement with the Austin Independent School District, Travis County, the State of Texas, the University of Texas System, and the City of Austin (“the Participants”) to provide a governmental communications network linking each of the Participants’ facilities. The Participants formed the Greater Austin Area Telecommunications Network Interlocal Agency to manage the network. No compensation is paid to any entity for use of the network. Instead, the cost of the construction of the network and use of the network is allocated among the owners on the basis of their respective interests in the network.
NOTE 25. CONSTRUCTION COMMITMENT
The College has entered into construction commitments for various projects including the renovation of facilities and the construction of buildings. At August 31, 2007 and 2006, the outstanding commitment under construction contracts for facilities and other projects are approximately $1,809,774 and $7,050,486, respectively.
AUSTIN COMMUNITY COLLEGE DISTRICT
Austin, Texas
NOTES TO THE BASIC FINANCIAL STATEMENTS For The Years Ended August 31, 2007 and 2006
50
NOTE 26. RESTATEMENTS
On August 23, 2007, the Board approved to increase the College’s capitalization threshold for equipment and furniture from $500 to $5,000. The new Capitalization and Depreciation policy states that all assets with useful lives of more than one year and cost of $5,000 or more will be capitalized. This capitalization policy is in agreement with the Texas Higher Education Coordinating Board’s capitalization rate, which was established in fiscal year 2002 upon the conversion of all Texas community colleges to the then new GASB 34 reporting requirements. The College had opted for a $500 capitalization threshold at that time because the College was in the process of developing a fixed asset inventory system. Subsequent experience has shown the $500 to be an excessively low rate requiring too much staff time, auditing time, and ultimately not useful results of the efforts.
As a result of this capitalization threshold restatement, fiscal year 2006 revenues and expenses were (overstated) or understated as follows:
2006Operating Revenues:General Operating Revenues Understated 94,456$
Operating Expenses:Instruction Understated 640,653 Public Service Understated 12,256 Academic Support Understated 306,812 Student Services Understated 37,936 Institutional Support Understated 1,273,814 Operation and Maintenance of Plant Understated 1,596,523 Depreciation Overstated (2,525,738)
Non-Operating Revenues (Expenses):Losses on disposal of fixed assets Overstated (245,112)
Net Change in Net Assets Overstated (1,002,688)$
The net assets as of September 1, 2005 have been adjusted to reflect the effects of the restatement on prior years resulting from the new capitalization threshold, to conform to accounting principles generally accepted in the United States of America.
AUSTIN COMMUNITY COLLEGE DISTRICT
Austin, Texas
NOTES TO THE BASIC FINANCIAL STATEMENTS For The Years Ended August 31, 2007 and 2006
51
NOTE 26. RESTATEMENTS (Continued)
The adjustments to net assets as of September 1, 2006 and 2005 to account for the new capitalization threshold are:
2006 2005
Beginning Net Assets at September 1, as presented in the fiscal year 2006/2005 financial statements $ 63,784,171 $ 58,970,983
Adjustments:
Effect of unrecorded expense on assets over $500 and less than $5,000 (9,195,527) (8,192,839)
Restated Beginning Net Assets at September 1 $ 54,588,644 $ 50,778,144
SCHEDULES REQUIRED BY
THE TEXAS HIGHER EDUCATION COORDINATING BOARD
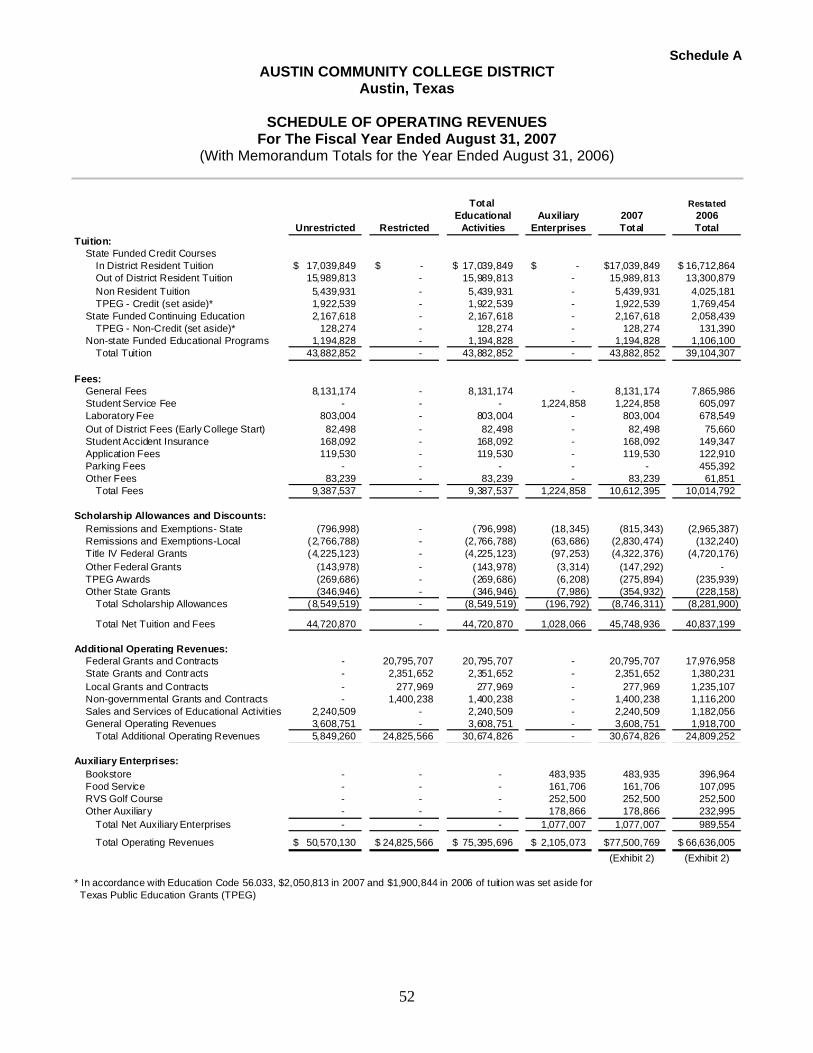
Schedule A AUSTIN COMMUNITY COLLEGE DISTRICT
Austin, Texas
SCHEDULE OF OPERATING REVENUES For The Fiscal Year Ended August 31, 2007
(With Memorandum Totals for the Year Ended August 31, 2006)
52
Total RestatedEducational Auxiliary 2007 2006
Unrestricted Restricted Activities Enterprises Total TotalTuition:
State Funded Credit CoursesIn District Resident Tuition 17,039,849$ $ - 17,039,849$ $ - 17,039,849$ 16,712,864$ Out of District Resident Tuition 15,989,813 - 15,989,813 - 15,989,813 13,300,879 Non Resident Tuition 5,439,931 - 5,439,931 - 5,439,931 4,025,181 TPEG - Credit (set aside)* 1,922,539 - 1,922,539 - 1,922,539 1,769,454
State Funded Continuing Education 2,167,618 - 2,167,618 - 2,167,618 2,058,439 TPEG - Non-Credit (set aside)* 128,274 - 128,274 - 128,274 131,390
Non-state Funded Educational Programs 1,194,828 - 1,194,828 - 1,194,828 1,106,100 Total Tuition 43,882,852 - 43,882,852 - 43,882,852 39,104,307
Fees:General Fees 8,131,174 - 8,131,174 - 8,131,174 7,865,986 Student Service Fee - - - 1,224,858 1,224,858 605,097 Laboratory Fee 803,004 - 803,004 - 803,004 678,549 Out of District Fees (Early College Start) 82,498 - 82,498 - 82,498 75,660 Student Accident Insurance 168,092 - 168,092 - 168,092 149,347 Application Fees 119,530 - 119,530 - 119,530 122,910 Parking Fees - - - - - 455,392 Other Fees 83,239 - 83,239 - 83,239 61,851
Total Fees 9,387,537 - 9,387,537 1,224,858 10,612,395 10,014,792
Scholarship Allowances and Discounts:Remissions and Exemptions- State (796,998) - (796,998) (18,345) (815,343) (2,965,387) Remissions and Exemptions-Local (2,766,788) - (2,766,788) (63,686) (2,830,474) (132,240) Title IV Federal Grants (4,225,123) - (4,225,123) (97,253) (4,322,376) (4,720,176) Other Federal Grants (143,978) - (143,978) (3,314) (147,292) - TPEG Awards (269,686) - (269,686) (6,208) (275,894) (235,939) Other State Grants (346,946) - (346,946) (7,986) (354,932) (228,158)
Total Scholarship Allowances (8,549,519) - (8,549,519) (196,792) (8,746,311) (8,281,900)
Total Net Tuition and Fees 44,720,870 - 44,720,870 1,028,066 45,748,936 40,837,199
Additional Operating Revenues:Federal Grants and Contracts - 20,795,707 20,795,707 - 20,795,707 17,976,958 State Grants and Contracts - 2,351,652 2,351,652 - 2,351,652 1,380,231 Local Grants and Contracts - 277,969 277,969 - 277,969 1,235,107 Non-governmental Grants and Contracts - 1,400,238 1,400,238 - 1,400,238 1,116,200 Sales and Services of Educational Activities 2,240,509 - 2,240,509 - 2,240,509 1,182,056 General Operating Revenues 3,608,751 - 3,608,751 - 3,608,751 1,918,700
Total Additional Operating Revenues 5,849,260 24,825,566 30,674,826 - 30,674,826 24,809,252
Auxiliary Enterprises:Bookstore - - - 483,935 483,935 396,964 Food Service - - - 161,706 161,706 107,095 RVS Golf Course - - - 252,500 252,500 252,500 Other Auxiliary - - - 178,866 178,866 232,995
Total Net Auxiliary Enterprises - - - 1,077,007 1,077,007 989,554
Total Operating Revenues 50,570,130$ 24,825,566$ 75,395,696$ 2,105,073$ 77,500,769$ 66,636,005$ (Exhibit 2) (Exhibit 2)
* In accordance with Education Code 56.033, $2,050,813 in 2007 and $1,900,844 in 2006 of tuition was set aside for Texas Public Education Grants (TPEG)

Schedule B AUSTIN COMMUNITY COLLEGE DISTRICT
Austin, Texas
SCHEDULE OF OPERATING EXPENSES BY OBJECT For The Fiscal Year Ended August 31, 2007
(With Memorandum Totals for the Year Ended August 31, 2006)
53
RestatedSalaries Other 2007 2006
and Wages State Local Expenses Total Total
Unrestricted - Educational ActivitiesInstruction 65,216,310$ $ - 1,625,939$ 3,335,070$ 70,177,319$ 63,358,722$ Public Service 1,155,058 - 29,116 671,059 1,855,233 1,388,718 Academic Support 13,793,051 - 354,541 2,144,495 16,292,087 15,033,709 Student Services 11,706,913 - 286,997 1,080,875 13,074,785 10,263,095 Institutional Support 12,122,992 - 3,057,720 9,378,251 24,558,963 23,566,143 Operation and Maintenance of Plant 4,845,212 - 129,724 11,917,766 16,892,702 13,667,872 Scholarships and Fellowships - - - - - (8,281,900)
Total Unrestricted - Educational Activities 108,839,536 5,484,037 28,527,516 142,851,089 118,996,359
Restricted - Educational ActivitiesInstruction 2,088,322 7,240,778 167,988 2,723,175 12,220,263 7,923,342Public Service 703,143 - 96,571 811,189 1,610,903 1,255,733Academic Support 235,267 1,531,402 25,216 110,742 1,902,627 1,196,772Student Services 206,729 1,299,785 42,062 156,074 1,704,650 1,190,331Institutional Support 732,335 1,345,981 - 2,657 2,080,973 1,667,329Operation and Maintenance of Plant - - - 2,988 2,988 3,185Scholarship and Fellowships - - - 12,958,739 12,958,739 20,294,397
Total Restricted - Educational Activities 3,965,796 11,417,946 331,837 16,765,564 32,481,143 33,531,089
Total Educational Activities 112,805,332 11,417,946 5,815,874 45,293,080 175,332,232 152,527,448
Auxiliary Enterprises 142,609 - 16,402 941,462 1,100,473 1,690,891
Depreciation Expense - Buildings and OtherReal Estate Improvements - - - 2,932,942 2,932,942 2,588,297
Depreciation Expense - Equipment andLibrary Books - - - 1,720,266 1,720,266 1,737,916 Total Operating Expenses 112,947,941$ 11,417,946$ 5,832,276$ 50,887,750$ 181,085,913$ 158,544,552$
(Exhibit 2) (Exhibit 2)
Benefits
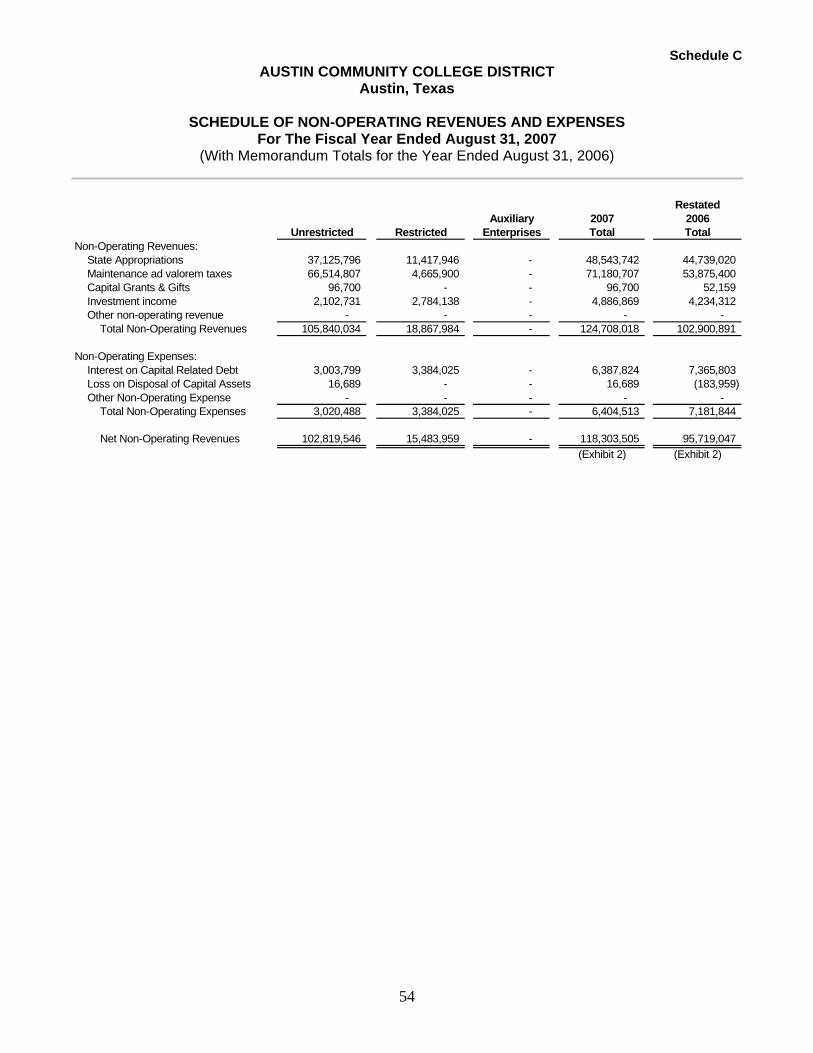
Schedule C AUSTIN COMMUNITY COLLEGE DISTRICT
Austin, Texas
SCHEDULE OF NON-OPERATING REVENUES AND EXPENSES For The Fiscal Year Ended August 31, 2007
(With Memorandum Totals for the Year Ended August 31, 2006)
54
RestatedAuxiliary 2007 2006
Unrestricted Restricted Enterprises Total TotalNon-Operating Revenues:
State Appropriations 37,125,796 11,417,946 - 48,543,742 44,739,020 Maintenance ad valorem taxes 66,514,807 4,665,900 - 71,180,707 53,875,400 Capital Grants & Gifts 96,700 - - 96,700 52,159 Investment income 2,102,731 2,784,138 - 4,886,869 4,234,312 Other non-operating revenue - - - - -
Total Non-Operating Revenues 105,840,034 18,867,984 - 124,708,018 102,900,891
Non-Operating Expenses:Interest on Capital Related Debt 3,003,799 3,384,025 - 6,387,824 7,365,803 Loss on Disposal of Capital Assets 16,689 - - 16,689 (183,959) Other Non-Operating Expense - - - - -
Total Non-Operating Expenses 3,020,488 3,384,025 - 6,404,513 7,181,844
Net Non-Operating Revenues 102,819,546 15,483,959 - 118,303,505 95,719,047 (Exhibit 2) (Exhibit 2)
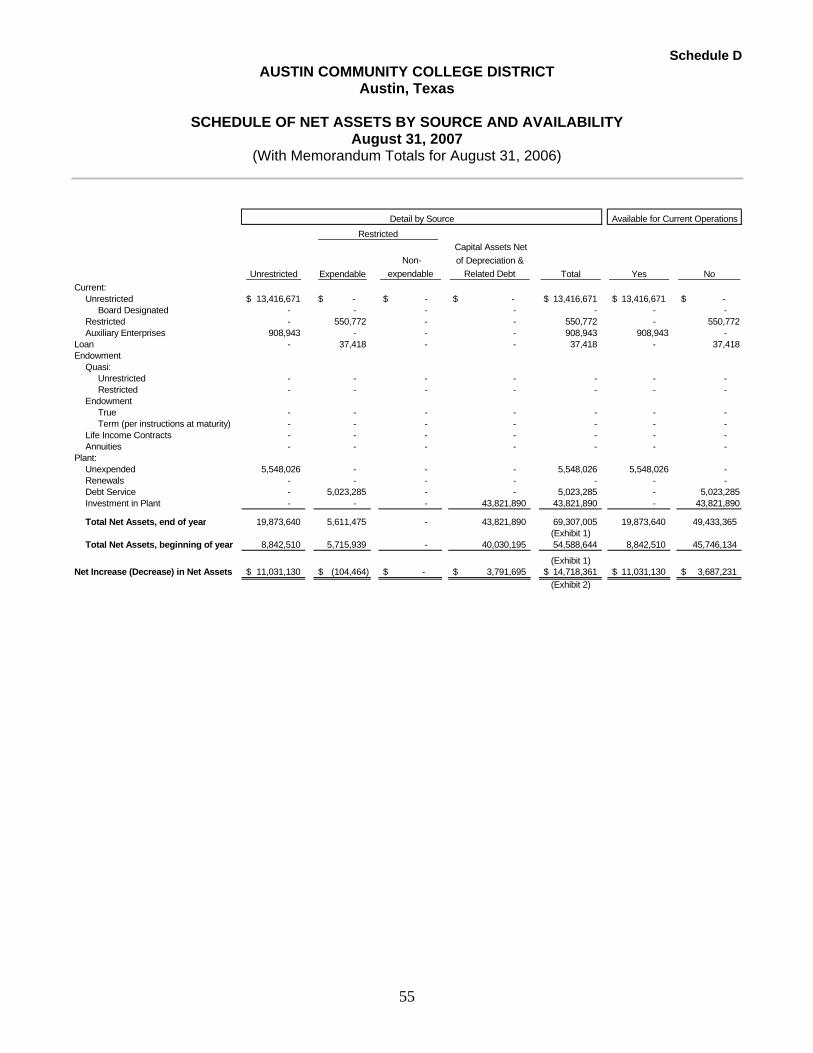
Schedule D AUSTIN COMMUNITY COLLEGE DISTRICT
Austin, Texas
SCHEDULE OF NET ASSETS BY SOURCE AND AVAILABILITY August 31, 2007
(With Memorandum Totals for August 31, 2006)
55
Unrestricted Expendable Non-
expendable
Capital Assets Net of Depreciation &
Related Debt Total Yes NoCurrent:
Unrestricted 13,416,671$ $ - $ - $ - 13,416,671$ 13,416,671$ $ -Board Designated - - - - - - -
Restricted - 550,772 - - 550,772 - 550,772Auxiliary Enterprises 908,943 - - - 908,943 908,943 -
Loan - 37,418 - - 37,418 - 37,418Endowment
Quasi:Unrestricted - - - - - - - Restricted - - - - - - -
EndowmentTrue - - - - - - - Term (per instructions at maturity) - - - - - - -
Life Income Contracts - - - - - - - Annuities - - - - - - -
Plant:Unexpended 5,548,026 - - - 5,548,026 5,548,026 - Renewals - - - - - - - Debt Service - 5,023,285 - - 5,023,285 - 5,023,285Investment in Plant - - - 43,821,890 43,821,890 - 43,821,890
Total Net Assets, end of year 19,873,640 5,611,475 - 43,821,890 69,307,005 19,873,640 49,433,365 (Exhibit 1)
Total Net Assets, beginning of year 8,842,510 5,715,939 - 40,030,195 54,588,644 8,842,510 45,746,134
(Exhibit 1)Net Increase (Decrease) in Net Assets 11,031,130$ (104,464)$ $ - 3,791,695$ 14,718,361$ 11,031,130$ 3,687,231$
(Exhibit 2)
Available for Current OperationsDetail by SourceRestricted

Statistical Section
AUSTIN COMMUNITY COLLEGE DISTRICT Austin, Texas
STATISTICAL SECTION
(UNAUDITED)
56
This part of Austin Community College District’s comprehensive annual financial report presents detailed information as a context for understanding what the information in the financial statements, note disclosures, and required supplementary information says about the College’s overall financial health. The information contained within this section is being presented to provide the reader with a better understanding of five objectives:
Financial Trends – Showing how the College’s financial position has changed over time.
Revenue Capacity – Assessing the College’s ability to generate revenue by examining its major revenue sources.
Debt Capacity – Assessing the affordability of the College’s current levels of outstanding debt and the
College’s ability to issue additional debt in the future.
Demographic and Economic Information – Providing demographic and economic indicators to help in understanding the environment within which the College’s financial activities take place.
Operating Information – Providing information about how the College’s financial report relates to the
services it provides and the activities it performs. Sources: Unless otherwise noted, the information in these schedules is derived from the annual financial reports for the relevant year.

AUSTIN COMMUNITY COLLEGE DISTRICT Austin, Texas
STATISTICAL SECTION
(UNAUDITED)
57
2007 2006 2005 2004 2003 2002Net Assets:
Invested in Capital Assets, Net of Related Debt 43,822$ 40,030$ 49,902$ 48,199$ 48,008$ 53,331$ Restricted - Expendable 5,611 5,716 4,947 5,001 4,839 4,927 Restricted - Nonexpendable - - - - - - Unrestricted 19,874 8,843 4,122 3,657 4,428 4,680
Total Net Assets 69,307$ 54,589$ 58,971$ 56,857$ 57,275$ 62,938$
Note:Due to reporting format and definition changes prescribed by GASB Statement 34, only fiscal years 2002-2007 are available.
(in Thousands)
Net Assets by ComponentLast Six Fiscal Years
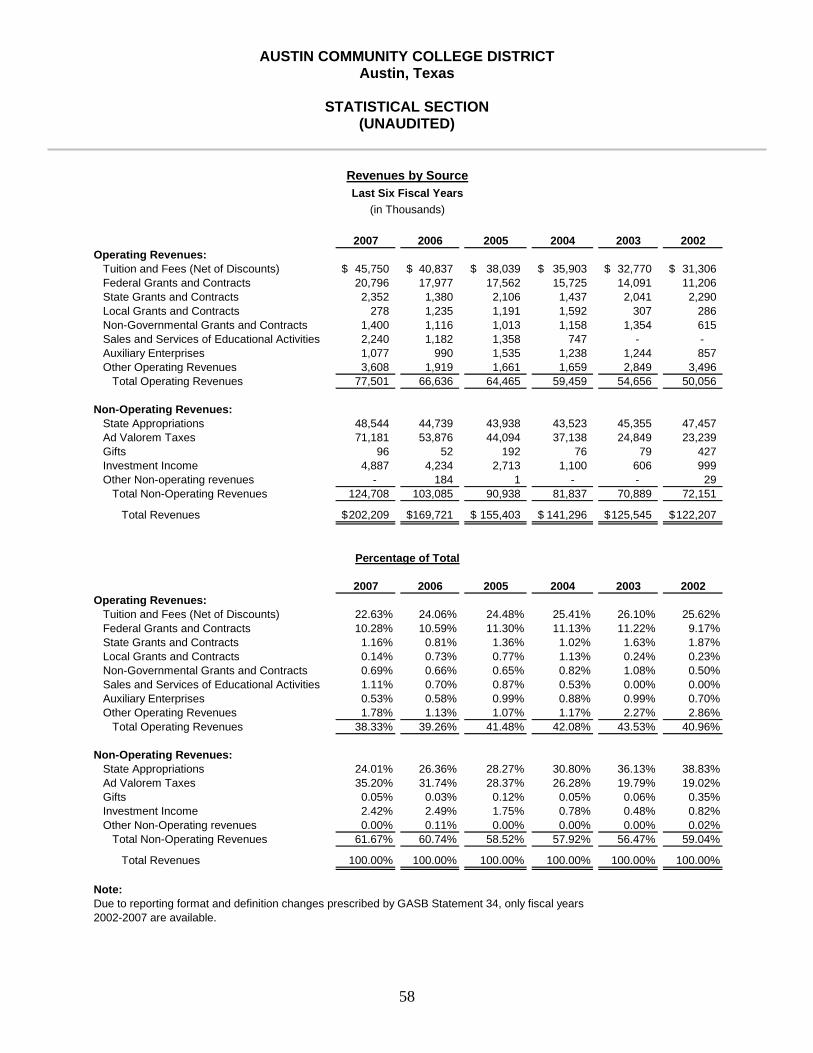
AUSTIN COMMUNITY COLLEGE DISTRICT Austin, Texas
STATISTICAL SECTION
(UNAUDITED)
58
2007 2006 2005 2004 2003 2002Operating Revenues:
Tuition and Fees (Net of Discounts) 45,750$ 40,837$ 38,039$ 35,903$ 32,770$ 31,306$ Federal Grants and Contracts 20,796 17,977 17,562 15,725 14,091 11,206 State Grants and Contracts 2,352 1,380 2,106 1,437 2,041 2,290 Local Grants and Contracts 278 1,235 1,191 1,592 307 286 Non-Governmental Grants and Contracts 1,400 1,116 1,013 1,158 1,354 615 Sales and Services of Educational Activities 2,240 1,182 1,358 747 - - Auxiliary Enterprises 1,077 990 1,535 1,238 1,244 857 Other Operating Revenues 3,608 1,919 1,661 1,659 2,849 3,496
Total Operating Revenues 77,501 66,636 64,465 59,459 54,656 50,056
Non-Operating Revenues:State Appropriations 48,544 44,739 43,938 43,523 45,355 47,457 Ad Valorem Taxes 71,181 53,876 44,094 37,138 24,849 23,239 Gifts 96 52 192 76 79 427 Investment Income 4,887 4,234 2,713 1,100 606 999 Other Non-operating revenues - 184 1 - - 29
Total Non-Operating Revenues 124,708 103,085 90,938 81,837 70,889 72,151
Total Revenues 202,209$ 169,721$ 155,403$ 141,296$ 125,545$ 122,207$
2007 2006 2005 2004 2003 2002Operating Revenues:
Tuition and Fees (Net of Discounts) 22.63% 24.06% 24.48% 25.41% 26.10% 25.62%Federal Grants and Contracts 10.28% 10.59% 11.30% 11.13% 11.22% 9.17%State Grants and Contracts 1.16% 0.81% 1.36% 1.02% 1.63% 1.87%Local Grants and Contracts 0.14% 0.73% 0.77% 1.13% 0.24% 0.23%Non-Governmental Grants and Contracts 0.69% 0.66% 0.65% 0.82% 1.08% 0.50%Sales and Services of Educational Activities 1.11% 0.70% 0.87% 0.53% 0.00% 0.00%Auxiliary Enterprises 0.53% 0.58% 0.99% 0.88% 0.99% 0.70%Other Operating Revenues 1.78% 1.13% 1.07% 1.17% 2.27% 2.86%
Total Operating Revenues 38.33% 39.26% 41.48% 42.08% 43.53% 40.96%
Non-Operating Revenues:State Appropriations 24.01% 26.36% 28.27% 30.80% 36.13% 38.83%Ad Valorem Taxes 35.20% 31.74% 28.37% 26.28% 19.79% 19.02%Gifts 0.05% 0.03% 0.12% 0.05% 0.06% 0.35%Investment Income 2.42% 2.49% 1.75% 0.78% 0.48% 0.82%Other Non-Operating revenues 0.00% 0.11% 0.00% 0.00% 0.00% 0.02%
Total Non-Operating Revenues 61.67% 60.74% 58.52% 57.92% 56.47% 59.04%
Total Revenues 100.00% 100.00% 100.00% 100.00% 100.00% 100.00%
Note:
2002-2007 are available.
Percentage of Total
Revenues by SourceLast Six Fiscal Years
(in Thousands)
Due to reporting format and definition changes prescribed by GASB Statement 34, only fiscal years
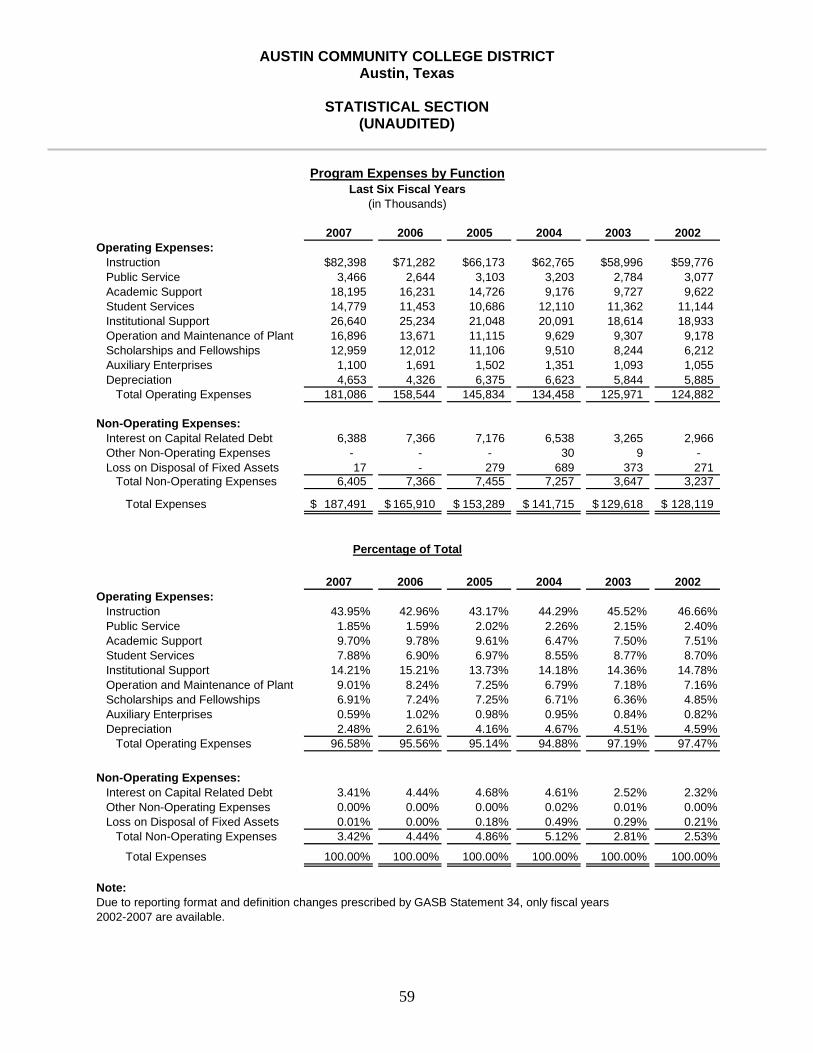
AUSTIN COMMUNITY COLLEGE DISTRICT Austin, Texas
STATISTICAL SECTION
(UNAUDITED)
59
2007 2006 2005 2004 2003 2002Operating Expenses:
Instruction $82,398 $71,282 $66,173 $62,765 $58,996 $59,776Public Service 3,466 2,644 3,103 3,203 2,784 3,077 Academic Support 18,195 16,231 14,726 9,176 9,727 9,622 Student Services 14,779 11,453 10,686 12,110 11,362 11,144 Institutional Support 26,640 25,234 21,048 20,091 18,614 18,933 Operation and Maintenance of Plant 16,896 13,671 11,115 9,629 9,307 9,178 Scholarships and Fellowships 12,959 12,012 11,106 9,510 8,244 6,212 Auxiliary Enterprises 1,100 1,691 1,502 1,351 1,093 1,055 Depreciation 4,653 4,326 6,375 6,623 5,844 5,885
Total Operating Expenses 181,086 158,544 145,834 134,458 125,971 124,882
Non-Operating Expenses:Interest on Capital Related Debt 6,388 7,366 7,176 6,538 3,265 2,966 Other Non-Operating Expenses - - - 30 9 - Loss on Disposal of Fixed Assets 17 - 279 689 373 271
Total Non-Operating Expenses 6,405 7,366 7,455 7,257 3,647 3,237
Total Expenses 187,491$ 165,910$ 153,289$ 141,715$ 129,618$ 128,119$
2007 2006 2005 2004 2003 2002Operating Expenses:
Instruction 43.95% 42.96% 43.17% 44.29% 45.52% 46.66%Public Service 1.85% 1.59% 2.02% 2.26% 2.15% 2.40%Academic Support 9.70% 9.78% 9.61% 6.47% 7.50% 7.51%Student Services 7.88% 6.90% 6.97% 8.55% 8.77% 8.70%Institutional Support 14.21% 15.21% 13.73% 14.18% 14.36% 14.78%Operation and Maintenance of Plant 9.01% 8.24% 7.25% 6.79% 7.18% 7.16%Scholarships and Fellowships 6.91% 7.24% 7.25% 6.71% 6.36% 4.85%Auxiliary Enterprises 0.59% 1.02% 0.98% 0.95% 0.84% 0.82%Depreciation 2.48% 2.61% 4.16% 4.67% 4.51% 4.59%
Total Operating Expenses 96.58% 95.56% 95.14% 94.88% 97.19% 97.47%
Non-Operating Expenses:Interest on Capital Related Debt 3.41% 4.44% 4.68% 4.61% 2.52% 2.32%Other Non-Operating Expenses 0.00% 0.00% 0.00% 0.02% 0.01% 0.00%Loss on Disposal of Fixed Assets 0.01% 0.00% 0.18% 0.49% 0.29% 0.21%
Total Non-Operating Expenses 3.42% 4.44% 4.86% 5.12% 2.81% 2.53%
Total Expenses 100.00% 100.00% 100.00% 100.00% 100.00% 100.00%
Note:Due to reporting format and definition changes prescribed by GASB Statement 34, only fiscal years2002-2007 are available.
Percentage of Total
Program Expenses by FunctionLast Six Fiscal Years
(in Thousands)
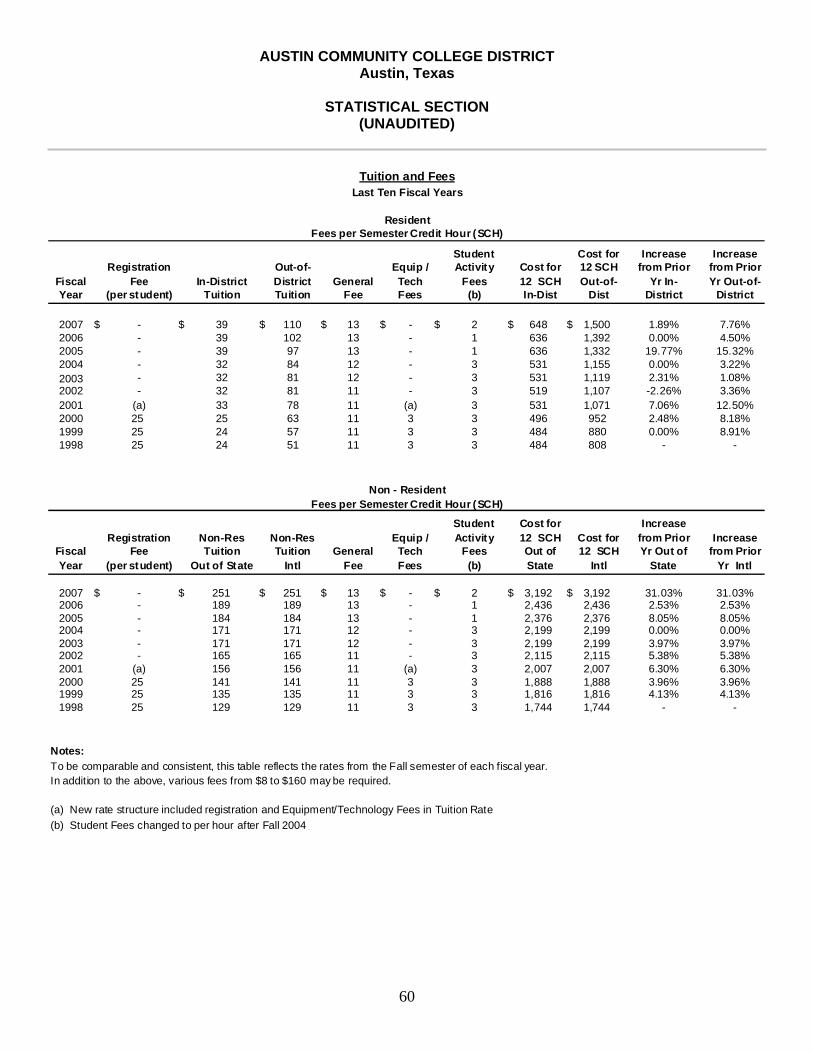
AUSTIN COMMUNITY COLLEGE DISTRICT Austin, Texas
STATISTICAL SECTION
(UNAUDITED)
60
Fiscal Year
Registration Fee
(per student)In-District
Tuition
Out-of-District Tuition
General Fee
Equip / Tech Fees
Student Activity
Fees (b)
Cost for 12 SCH In-Dist
Cost for 12 SCH Out-of-
Dist
Increase from Prior
Yr In-District
Increase from Prior Yr Out-of-
District
2007 $ - $ 39 $ 110 $ 13 $ - $ 2 $ 648 $ 1,500 1.89% 7.76%2006 - 39 102 13 - 1 636 1,392 0.00% 4.50%2005 - 39 97 13 - 1 636 1,332 19.77% 15.32%2004 - 32 84 12 - 3 531 1,155 0.00% 3.22%2003 - 32 81 12 - 3 531 1,119 2.31% 1.08%2002 - 32 81 11 - 3 519 1,107 -2.26% 3.36%2001 (a) 33 78 11 (a) 3 531 1,071 7.06% 12.50%2000 25 25 63 11 3 3 496 952 2.48% 8.18%1999 25 24 57 11 3 3 484 880 0.00% 8.91%1998 25 24 51 11 3 3 484 808 - -
Fiscal Year
Registration Fee
(per student)
Non-Res Tuition
Out of State
Non-Res Tuition
IntlGeneral
Fee
Equip / Tech Fees
Student Activity
Fees (b)
Cost for 12 SCH Out of State
Cost for 12 SCH
Intl
Increase from Prior Yr Out of
State
Increase from Prior
Yr Intl
2007 $ - $ 251 $ 251 $ 13 $ - $ 2 $ 3,192 $ 3,192 31.03% 31.03%2006 - 189 189 13 - 1 2,436 2,436 2.53% 2.53%2005 - 184 184 13 - 1 2,376 2,376 8.05% 8.05%2004 - 171 171 12 - 3 2,199 2,199 0.00% 0.00%2003 - 171 171 12 - 3 2,199 2,199 3.97% 3.97%2002 - 165 165 11 - 3 2,115 2,115 5.38% 5.38%2001 (a) 156 156 11 (a) 3 2,007 2,007 6.30% 6.30%2000 25 141 141 11 3 3 1,888 1,888 3.96% 3.96%1999 25 135 135 11 3 3 1,816 1,816 4.13% 4.13%1998 25 129 129 11 3 3 1,744 1,744 - -
Notes: To be comparable and consistent, this table reflects the rates from the Fall semester of each fiscal year. In addition to the above, various fees from $8 to $160 may be required.
(a) New rate structure included registration and Equipment/Technology Fees in Tuition Rate (b) Student Fees changed to per hour after Fall 2004
Tuition and Fees
Fees per Semester Credit Hour (SCH)Non - Resident
ResidentFees per Semester Credit Hour (SCH)
Last Ten Fiscal Years
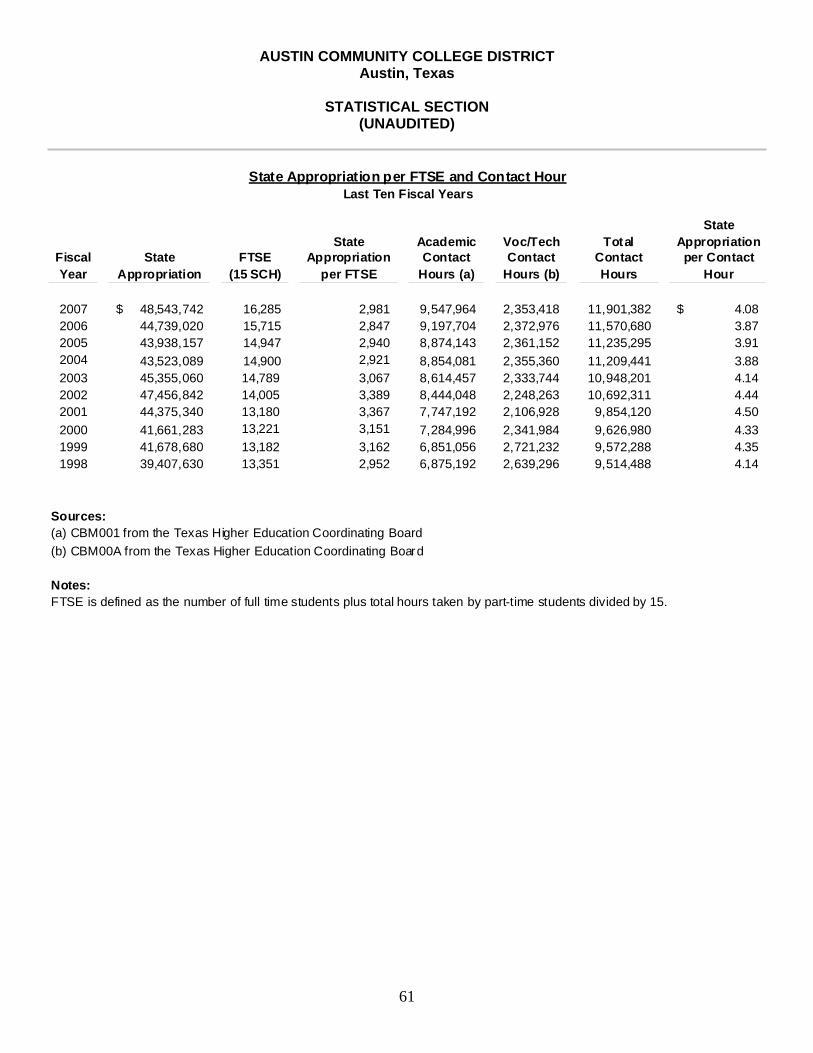
AUSTIN COMMUNITY COLLEGE DISTRICT Austin, Texas
STATISTICAL SECTION
(UNAUDITED)
61
Fiscal Year
State Appropriation
FTSE (15 SCH)
State Appropriation
per FTSE
Academic Contact
Hours (a)
Voc/Tech Contact
Hours (b)
Total Contact Hours
State Appropriation per Contact
Hour
2007 48,543,742$ 16,285 2,981 9,547,964 2,353,418 11,901,382 4.08$ 2006 44,739,020 15,715 2,847 9,197,704 2,372,976 11,570,680 3.87 2005 43,938,157 14,947 2,940 8,874,143 2,361,152 11,235,295 3.91 2004 43,523,089 14,900 2,921 8,854,081 2,355,360 11,209,441 3.88 2003 45,355,060 14,789 3,067 8,614,457 2,333,744 10,948,201 4.14 2002 47,456,842 14,005 3,389 8,444,048 2,248,263 10,692,311 4.44 2001 44,375,340 13,180 3,367 7,747,192 2,106,928 9,854,120 4.50 2000 41,661,283 13,221 3,151 7,284,996 2,341,984 9,626,980 4.33 1999 41,678,680 13,182 3,162 6,851,056 2,721,232 9,572,288 4.35 1998 39,407,630 13,351 2,952 6,875,192 2,639,296 9,514,488 4.14
Sources:(a) CBM001 from the Texas Higher Education Coordinating Board(b) CBM00A from the Texas Higher Education Coordinating Board
Notes:FTSE is defined as the number of full time students plus total hours taken by part-time students divided by 15.
State Appropriation per FTSE and Contact HourLast Ten Fiscal Years
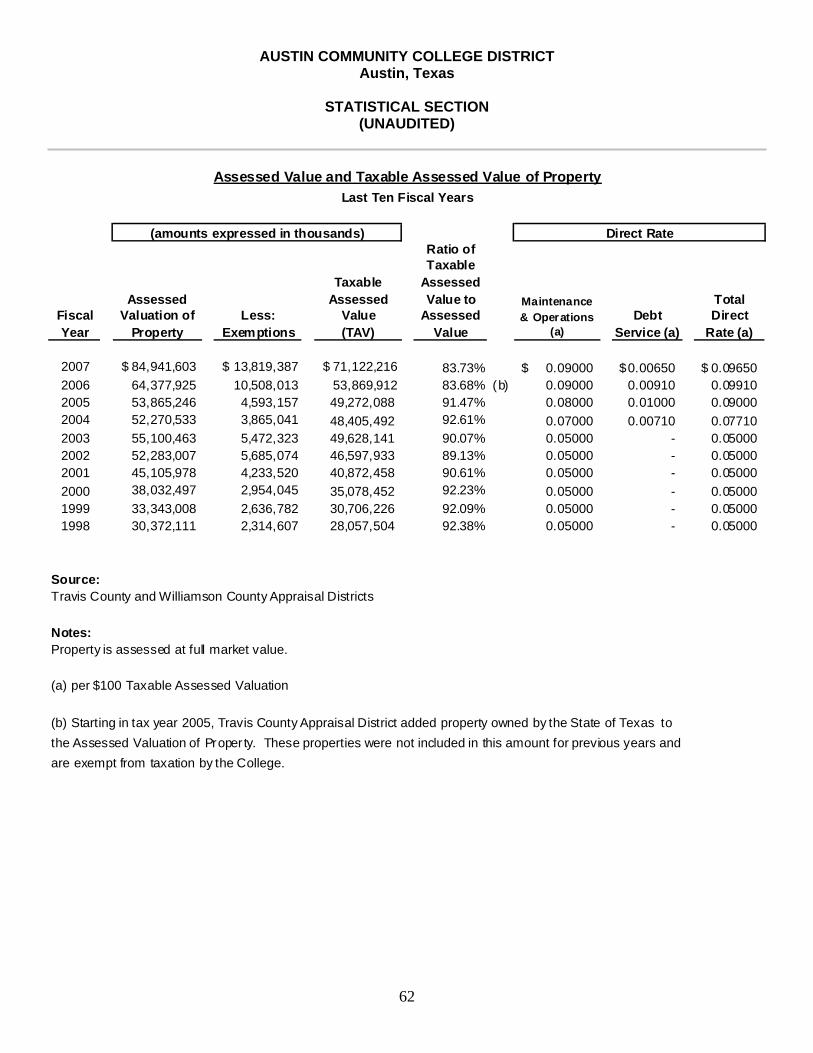
AUSTIN COMMUNITY COLLEGE DISTRICT Austin, Texas
STATISTICAL SECTION
(UNAUDITED)
62
Fiscal Year
Assessed Valuation of
PropertyLess:
Exemptions
Taxable Assessed
Value (TAV)
Ratio of Taxable
Assessed Value to
Assessed Value
Maintenance & Operations
(a)Debt
Service (a)
Total Direct
Rate (a)
2007 $ 84,941,603 $ 13,819,387 $ 71,122,216 83.73% 0.09000$ 0.00650$ 0.09650$ 2006 64,377,925 10,508,013 53,869,912 83.68% (b) 0.09000 0.00910 0.09910 2005 53,865,246 4,593,157 49,272,088 91.47% 0.08000 0.01000 0.09000 2004 52,270,533 3,865,041 48,405,492 92.61% 0.07000 0.00710 0.07710 2003 55,100,463 5,472,323 49,628,141 90.07% 0.05000 - 0.05000 2002 52,283,007 5,685,074 46,597,933 89.13% 0.05000 - 0.05000 2001 45,105,978 4,233,520 40,872,458 90.61% 0.05000 - 0.05000 2000 38,032,497 2,954,045 35,078,452 92.23% 0.05000 - 0.05000 1999 33,343,008 2,636,782 30,706,226 92.09% 0.05000 - 0.05000 1998 30,372,111 2,314,607 28,057,504 92.38% 0.05000 - 0.05000
Source:
Notes:
Assessed Value and Taxable Assessed Value of PropertyLast Ten Fiscal Years
are exempt from taxation by the College.
(a) per $100 Taxable Assessed Valuation
Property is assessed at full market value.
Direct Rate
(b) Starting in tax year 2005, Travis County Appraisal District added property owned by the State of Texas to the Assessed Valuation of Proper ty. These properties were not included in this amount for previous years and
(amounts expressed in thousands)
Travis County and Williamson County Appraisal Districts
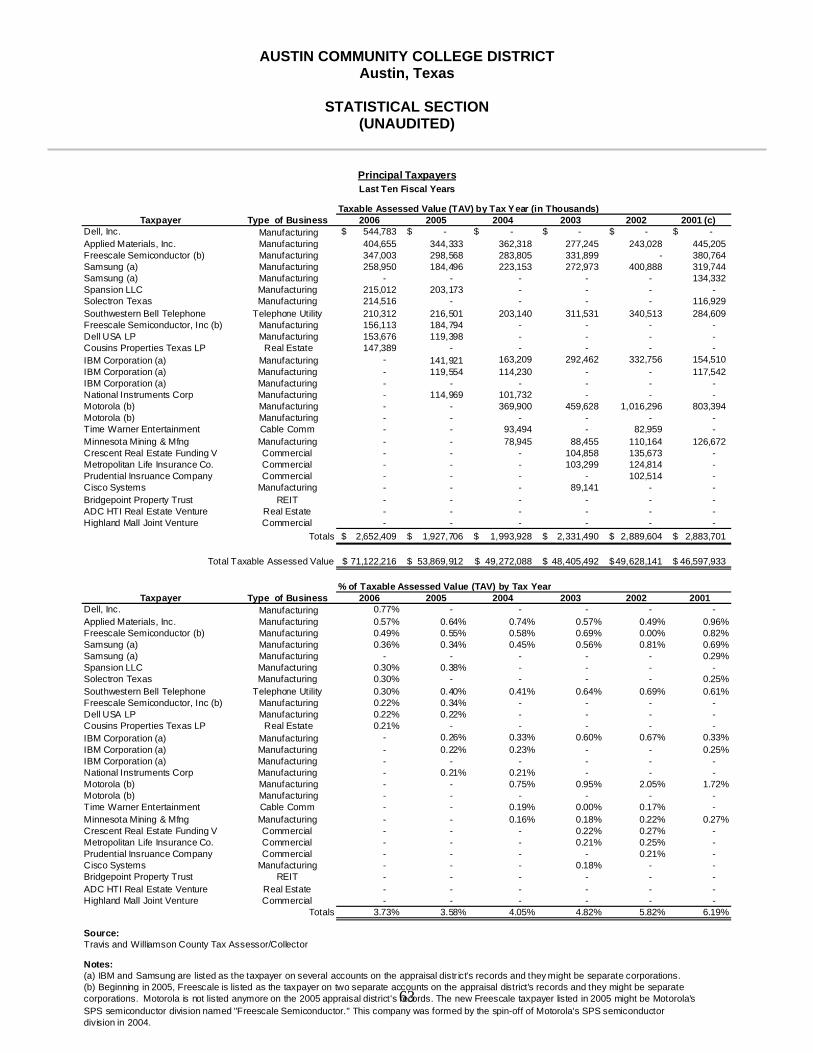
AUSTIN COMMUNITY COLLEGE DISTRICT Austin, Texas
STATISTICAL SECTION
(UNAUDITED)
63
Taxable Assessed Value (TAV) by Tax Year (in Thousands)Taxpayer Type of Business 2006 2005 2004 2003 2002 2001 (c)
Dell, Inc. Manufacturing 544,783$ $ - $ - $ - $ - $ -Applied Materials, Inc. Manufacturing 404,655 344,333 362,318 277,245 243,028 445,205 Freescale Semiconductor (b) Manufacturing 347,003 298,568 283,805 331,899 - 380,764 Samsung (a) Manufacturing 258,950 184,496 223,153 272,973 400,888 319,744 Samsung (a) Manufacturing - - - - - 134,332 Spansion LLC Manufacturing 215,012 203,173 - - - - Solectron Texas Manufacturing 214,516 - - - - 116,929 Southwestern Bell Telephone Telephone Utility 210,312 216,501 203,140 311,531 340,513 284,609 Freescale Semiconductor, Inc (b) Manufacturing 156,113 184,794 - - - - Dell USA LP Manufacturing 153,676 119,398 - - - - Cousins Properties Texas LP Real Estate 147,389 - - - - - IBM Corporation (a) Manufacturing - 141,921 163,209 292,462 332,756 154,510 IBM Corporation (a) Manufacturing - 119,554 114,230 - - 117,542 IBM Corporation (a) Manufacturing - - - - - - National Instruments Corp Manufacturing - 114,969 101,732 - - - Motorola (b) Manufacturing - - 369,900 459,628 1,016,296 803,394 Motorola (b) Manufacturing - - - - - - Time Warner Entertainment Cable Comm - - 93,494 - 82,959 - Minnesota Mining & Mfng Manufacturing - - 78,945 88,455 110,164 126,672 Crescent Real Estate Funding V Commercial - - - 104,858 135,673 - Metropolitan Life Insurance Co. Commercial - - - 103,299 124,814 - Prudential Insruance Company Commercial - - - - 102,514 - Cisco Systems Manufacturing - - - 89,141 - - Bridgepoint Property Trust REIT - - - - - - ADC HTI Real Estate Venture Real Estate - - - - - - Highland Mall Joint Venture Commercial - - - - - -
Totals 2,652,409$ 1,927,706$ 1,993,928$ 2,331,490$ 2,889,604$ 2,883,701$
71,122,216$ 53,869,912$ 49,272,088$ 48,405,492$ 49,628,141$ 46,597,933$
% of Taxable Assessed Value (TAV) by Tax YearTaxpayer Type of Business 2006 2005 2004 2003 2002 2001
Dell, Inc. Manufacturing 0.77% - - - - - Applied Materials, Inc. Manufacturing 0.57% 0.64% 0.74% 0.57% 0.49% 0.96%Freescale Semiconductor (b) Manufacturing 0.49% 0.55% 0.58% 0.69% 0.00% 0.82%Samsung (a) Manufacturing 0.36% 0.34% 0.45% 0.56% 0.81% 0.69%Samsung (a) Manufacturing - - - - - 0.29%Spansion LLC Manufacturing 0.30% 0.38% - - - - Solectron Texas Manufacturing 0.30% - - - - 0.25%Southwestern Bell Telephone Telephone Utility 0.30% 0.40% 0.41% 0.64% 0.69% 0.61%Freescale Semiconductor, Inc (b) Manufacturing 0.22% 0.34% - - - - Dell USA LP Manufacturing 0.22% 0.22% - - - - Cousins Properties Texas LP Real Estate 0.21% - - - - - IBM Corporation (a) Manufacturing - 0.26% 0.33% 0.60% 0.67% 0.33%IBM Corporation (a) Manufacturing - 0.22% 0.23% - - 0.25%IBM Corporation (a) Manufacturing - - - - - - National Instruments Corp Manufacturing - 0.21% 0.21% - - - Motorola (b) Manufacturing - - 0.75% 0.95% 2.05% 1.72%Motorola (b) Manufacturing - - - - - - Time Warner Entertainment Cable Comm - - 0.19% 0.00% 0.17% - Minnesota Mining & Mfng Manufacturing - - 0.16% 0.18% 0.22% 0.27%Crescent Real Estate Funding V Commercial - - - 0.22% 0.27% - Metropolitan Life Insurance Co. Commercial - - - 0.21% 0.25% - Prudential Insruance Company Commercial - - - - 0.21% - Cisco Systems Manufacturing - - - 0.18% - - Bridgepoint Property Trust REIT - - - - - - ADC HTI Real Estate Venture Real Estate - - - - - - Highland Mall Joint Venture Commercial - - - - - -
Totals 3.73% 3.58% 4.05% 4.82% 5.82% 6.19%
Source:
Notes:(a) IBM and Samsung are listed as the taxpayer on several accounts on the appraisal distr ict's records and they might be separate corporations.(b) Beginning in 2005, Freescale is listed as the taxpayer on two separate accounts on the appraisal district's records and they might be separate corporations. Motorola is not listed anymore on the 2005 appraisal district's records. The new Freescale taxpayer listed in 2005 might be Motorola'sSPS semiconductor division named "Freescale Semiconductor." This company was formed by the spin-off of Motorola's SPS semiconductor division in 2004.
Principal TaxpayersLast Ten Fiscal Years
Total Taxable Assessed Value
Travis and Williamson County Tax Assessor/Collector

AUSTIN COMMUNITY COLLEGE DISTRICT Austin, Texas
STATISTICAL SECTION
(UNAUDITED)
64
2000 (c) 1999 (c) 1998 (c) 1997 (c) $ - $ - $ - $ -
348,268 150,500 - - 433,234 433,325 458,243.95 421,773.73 420,694 388,247 - - 152,297 268,249 - -
- - - - - - - -
270,988 253,743 262,083 267,795 - - - - - - - - - - - -
117,542 144,640 180,759 430,595 114,657 100,199 100,199 95,931
- - - 92,199 - - - -
595,328 635,202 568,561 645,270 234,428 260,086 358,451 422,342
- - - - 142,138 87,061 85,238 85,023
- - 73,000 - - - - - - - - - - - - - - - 75,250 - - - 74,033 68,945 - - - 63,467
2,829,574$ 2,721,251$ 2,235,817$ 2,593,342$
40,872,458$ 35,078,452$ 30,706,226$ 28,057,504$
2000 1999 1998 1997- - - -
0.85% 0.43% - - 1.06% 1.24% 1.49% 1.50%1.03% 1.11% - - 0.37% 0.76% - -
- - - - - - - -
0.66% 0.72% 0.85% 0.95%- - - - - - - - - - - -
0.29% 0.41% 0.59% 1.53%0.28% 0.29% 0.33% 0.34%
- - - 0.33%- - - -
1.46% 1.81% 1.85% 2.30%0.57% 0.74% 1.17% 1.51%
- - - - 0.35% 0.25% 0.28% 0.30%
- - 0.24% - - - - - - - - - - - - - - - 0.25% - - - 0.24% 0.25%- - - 0.23%
6.92% 7.76% 7.28% 9.24%
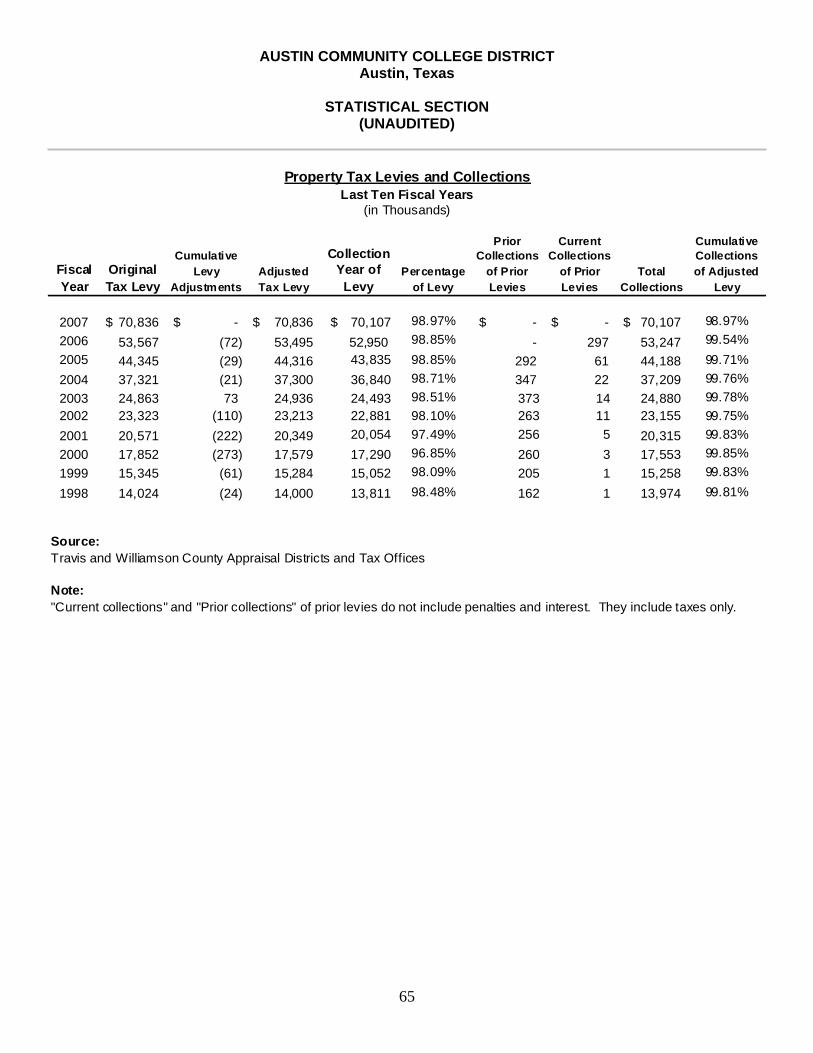
AUSTIN COMMUNITY COLLEGE DISTRICT Austin, Texas
STATISTICAL SECTION
(UNAUDITED)
65
Fiscal Year
Original Tax Levy
Cumulative Levy
AdjustmentsAdjusted Tax Levy
Collection Year of Levy
Percentage of Levy
Prior Collections
of Prior Levies
Current Collections
of Prior Levies
Total Collections
Cumulative Collections of Adjusted
Levy
2007 70,836$ -$ 70,836$ $ 70,107 98.97% -$ -$ 70,107$ 98.97%2006 53,567 (72) 53,495 52,950 98.85% - 297 53,247 99.54%2005 44,345 (29) 44,316 43,835 98.85% 292 61 44,188 99.71%2004 37,321 (21) 37,300 36,840 98.71% 347 22 37,209 99.76%2003 24,863 73 24,936 24,493 98.51% 373 14 24,880 99.78%2002 23,323 (110) 23,213 22,881 98.10% 263 11 23,155 99.75%2001 20,571 (222) 20,349 20,054 97.49% 256 5 20,315 99.83%2000 17,852 (273) 17,579 17,290 96.85% 260 3 17,553 99.85%1999 15,345 (61) 15,284 15,052 98.09% 205 1 15,258 99.83%
1998 14,024 (24) 14,000 13,811 98.48% 162 1 13,974 99.81%
Source:Travis and Williamson County Appraisal Districts and Tax Offices
Note: "Current collections" and "Prior collections" of prior levies do not include penalties and interest. They include taxes only.
(in Thousands)
Property Tax Levies and CollectionsLast Ten Fiscal Years
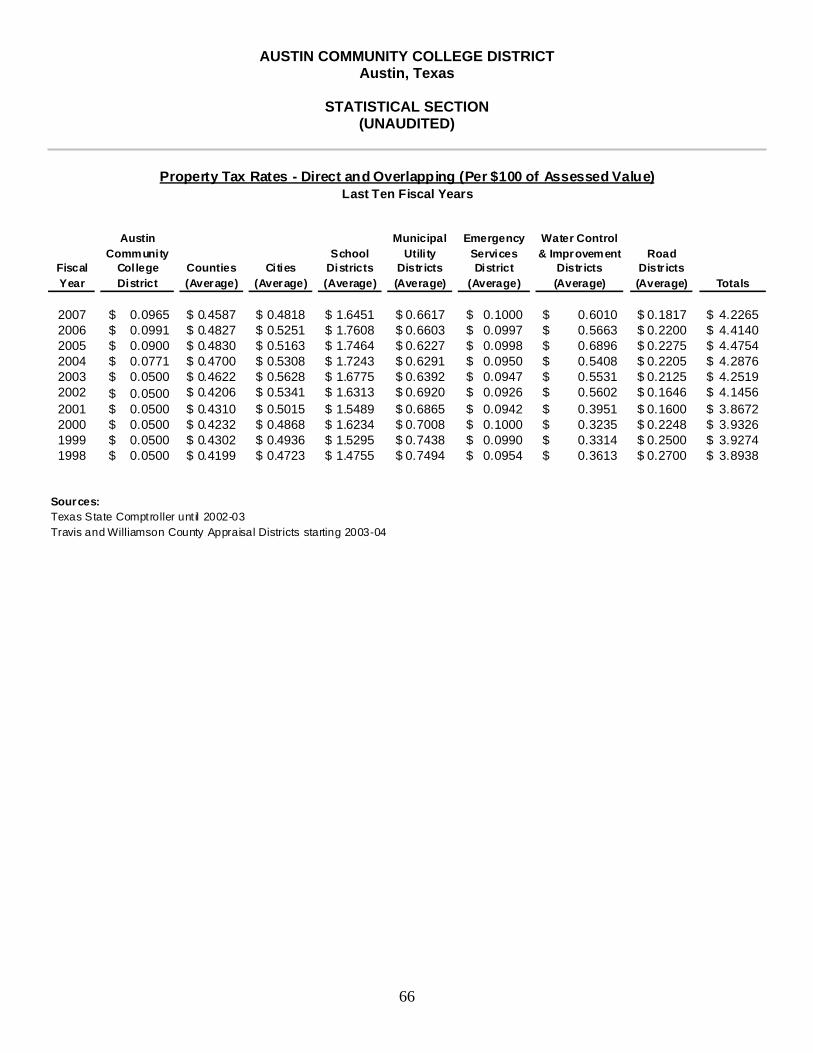
AUSTIN COMMUNITY COLLEGE DISTRICT Austin, Texas
STATISTICAL SECTION
(UNAUDITED)
66
Fiscal Year
Austin Community
College District
Counties (Average)
Cities (Average)
School Districts (Average)
Municipal Utili ty
Distr icts (Average)
Emergency Services District
(Average)
Water Control & Improvement
Distr icts (Average)
Road Distr icts (Average) Totals
2007 $ 0.0965 0.4587$ 0.4818$ 1.6451$ 0.6617$ 0.1000$ 0.6010$ 0.1817$ 4.2265$ 2006 $ 0.0991 0.4827$ 0.5251$ 1.7608$ 0.6603$ 0.0997$ 0.5663$ 0.2200$ 4.4140$ 2005 $ 0.0900 0.4830$ 0.5163$ 1.7464$ 0.6227$ 0.0998$ 0.6896$ 0.2275$ 4.4754$ 2004 $ 0.0771 0.4700$ 0.5308$ 1.7243$ 0.6291$ 0.0950$ 0.5408$ 0.2205$ 4.2876$ 2003 $ 0.0500 0.4622$ 0.5628$ 1.6775$ 0.6392$ 0.0947$ 0.5531$ 0.2125$ 4.2519$ 2002 $ 0.0500 0.4206$ 0.5341$ 1.6313$ 0.6920$ 0.0926$ 0.5602$ 0.1646$ 4.1456$ 2001 $ 0.0500 0.4310$ 0.5015$ 1.5489$ 0.6865$ 0.0942$ 0.3951$ 0.1600$ 3.8672$ 2000 $ 0.0500 0.4232$ 0.4868$ 1.6234$ 0.7008$ 0.1000$ 0.3235$ 0.2248$ 3.9326$ 1999 $ 0.0500 0.4302$ 0.4936$ 1.5295$ 0.7438$ 0.0990$ 0.3314$ 0.2500$ 3.9274$ 1998 $ 0.0500 0.4199$ 0.4723$ 1.4755$ 0.7494$ 0.0954$ 0.3613$ 0.2700$ 3.8938$
Sources:Texas State Comptroller unt il 2002-03Travis and Williamson County Appraisal Districts starting 2003-04
Property Tax Rates - Direct and Overlapping (Per $100 of Assessed Value)Last Ten Fiscal Years
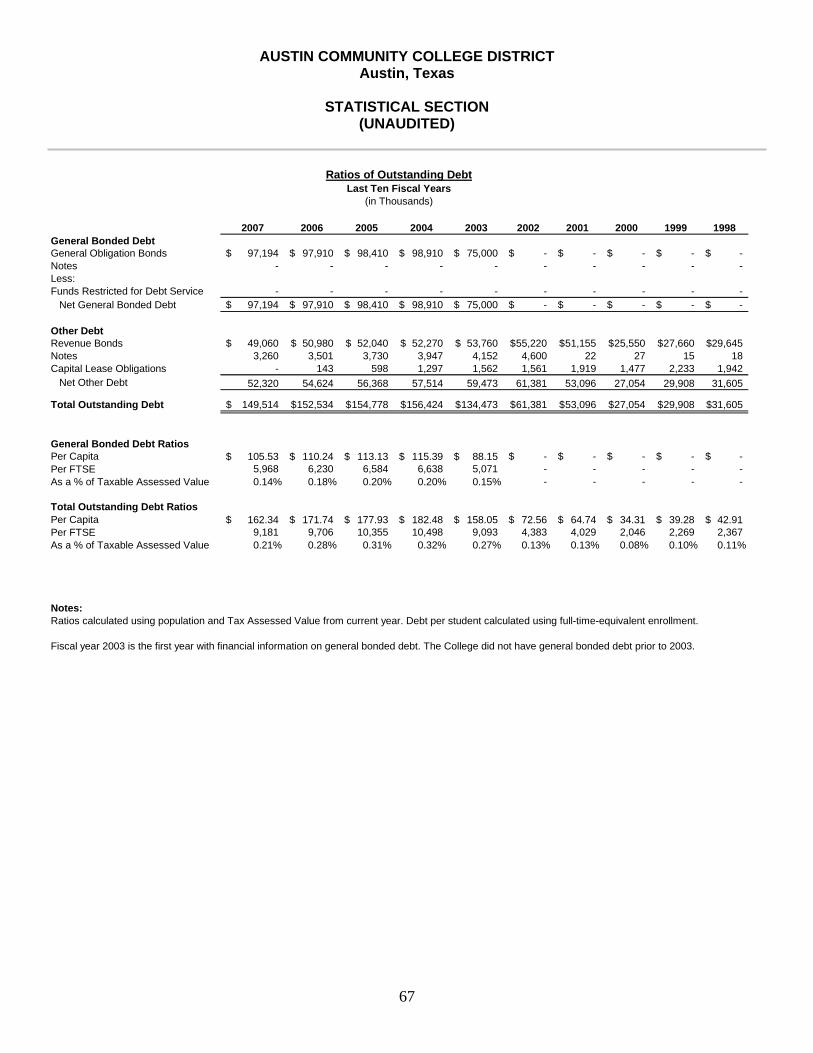
AUSTIN COMMUNITY COLLEGE DISTRICT Austin, Texas
STATISTICAL SECTION
(UNAUDITED)
67
2007 2006 2005 2004 2003 2002 2001 2000 1999 1998General Bonded DebtGeneral Obligation Bonds 97,194$ 97,910$ 98,410$ 98,910$ 75,000$ -$ -$ -$ -$ -$ Notes - - - - - - - - - - Less:Funds Restricted for Debt Service - - - - - - - - - -
Net General Bonded Debt 97,194$ 97,910$ 98,410$ 98,910$ 75,000$ -$ -$ -$ -$ -$
Other DebtRevenue Bonds 49,060$ 50,980$ 52,040$ 52,270$ 53,760$ 55,220$ 51,155$ 25,550$ 27,660$ 29,645$ Notes 3,260 3,501 3,730 3,947 4,152 4,600 22 27 15 18 Capital Lease Obligations - 143 598 1,297 1,562 1,561 1,919 1,477 2,233 1,942
Net Other Debt 52,320 54,624 56,368 57,514 59,473 61,381 53,096 27,054 29,908 31,605
Total Outstanding Debt 149,514$ 152,534$ 154,778$ 156,424$ 134,473$ 61,381$ 53,096$ 27,054$ 29,908$ 31,605$
General Bonded Debt RatiosPer Capita 105.53$ 110.24$ 113.13$ 115.39$ 88.15$ -$ -$ -$ -$ -$ Per FTSE 5,968 6,230 6,584 6,638 5,071 - - - - - As a % of Taxable Assessed Value 0.14% 0.18% 0.20% 0.20% 0.15% - - - - -
Total Outstanding Debt RatiosPer Capita 162.34$ 171.74$ 177.93$ 182.48$ 158.05$ 72.56$ 64.74$ 34.31$ 39.28$ 42.91$ Per FTSE 9,181 9,706 10,355 10,498 9,093 4,383 4,029 2,046 2,269 2,367 As a % of Taxable Assessed Value 0.21% 0.28% 0.31% 0.32% 0.27% 0.13% 0.13% 0.08% 0.10% 0.11%
Notes:
Fiscal year 2003 is the first year with financial information on general bonded debt. The College did not have general bonded debt prior to 2003.
Ratios calculated using population and Tax Assessed Value from current year. Debt per student calculated using full-time-equivalent enrollment.
Ratios of Outstanding DebtLast Ten Fiscal Years
(in Thousands)
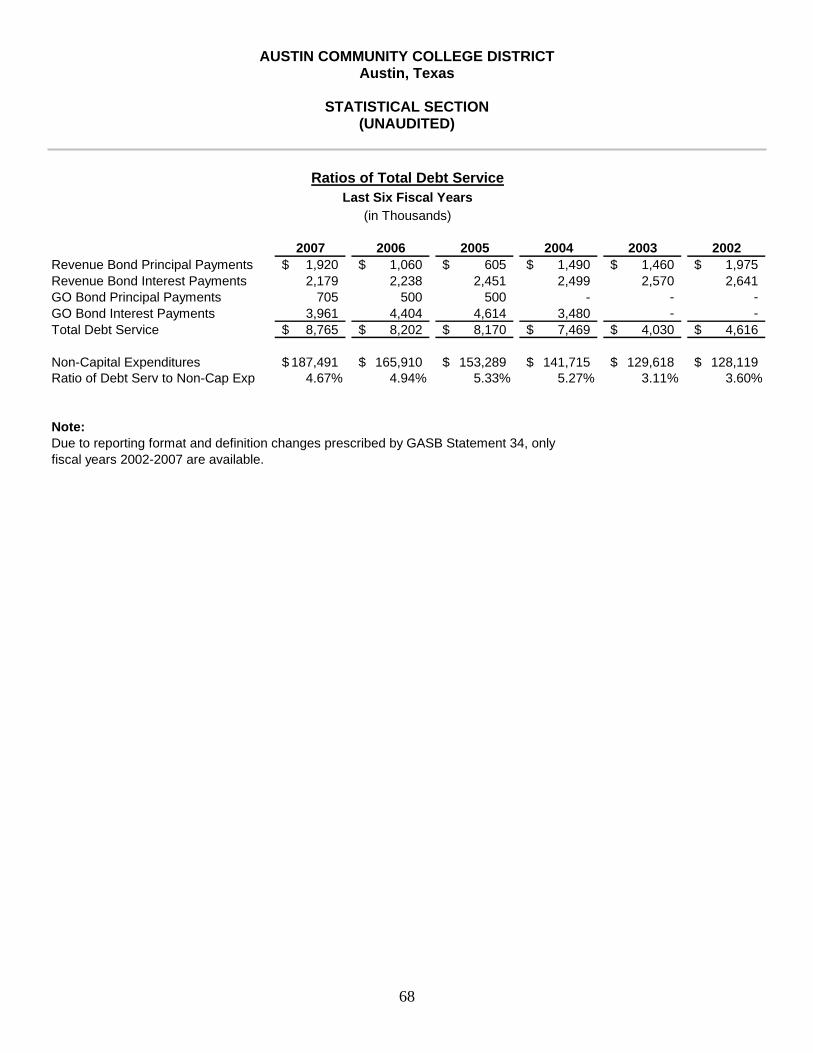
AUSTIN COMMUNITY COLLEGE DISTRICT Austin, Texas
STATISTICAL SECTION
(UNAUDITED)
68
2007 2006 2005 2004 2003 2002Revenue Bond Principal Payments 1,920$ 1,060$ 605$ 1,490$ 1,460$ 1,975$ Revenue Bond Interest Payments 2,179 2,238 2,451 2,499 2,570 2,641 GO Bond Principal Payments 705 500 500 - - - GO Bond Interest Payments 3,961 4,404 4,614 3,480 - - Total Debt Service 8,765$ 8,202$ 8,170$ 7,469$ 4,030$ 4,616$
Non-Capital Expenditures 187,491$ 165,910$ 153,289$ 141,715$ 129,618$ 128,119$ Ratio of Debt Serv to Non-Cap Exp 4.67% 4.94% 5.33% 5.27% 3.11% 3.60%
Note:
fiscal years 2002-2007 are available.
Ratios of Total Debt ServiceLast Six Fiscal Years
(in Thousands)
Due to reporting format and definition changes prescribed by GASB Statement 34, only
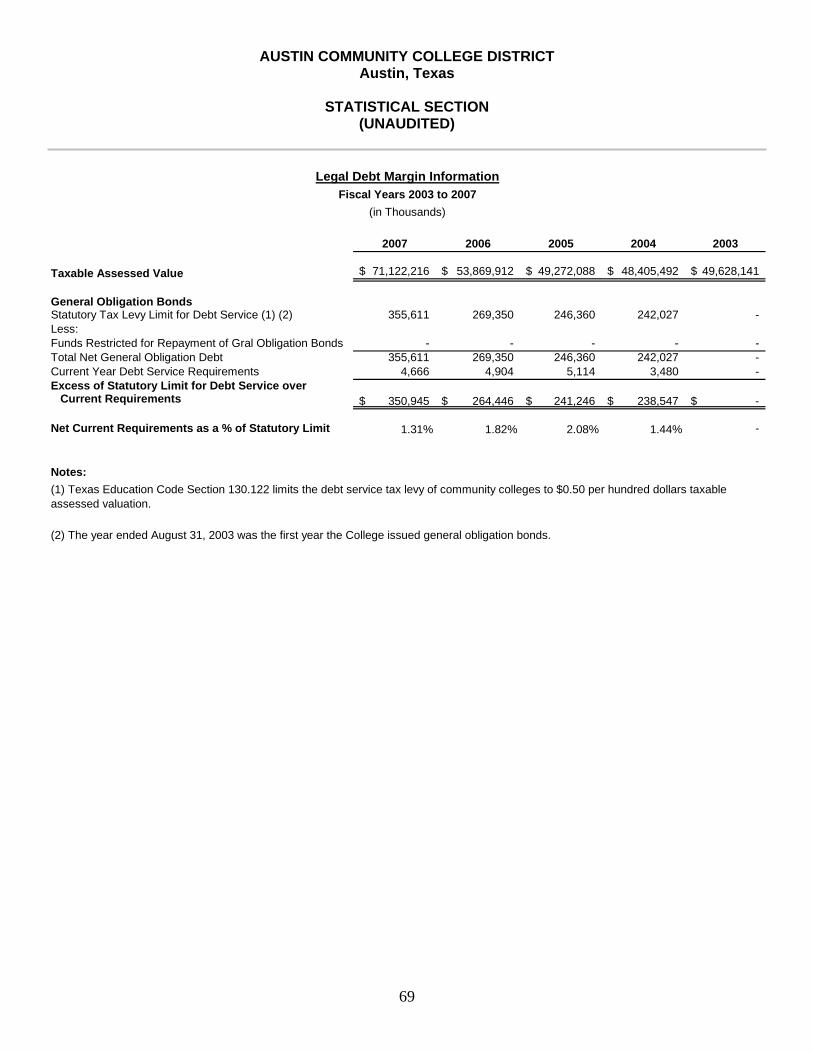
AUSTIN COMMUNITY COLLEGE DISTRICT Austin, Texas
STATISTICAL SECTION
(UNAUDITED)
69
2007 2006 2005 2004 2003
Taxable Assessed Value 71,122,216$ 53,869,912$ 49,272,088$ 48,405,492$ 49,628,141$
General Obligation BondsStatutory Tax Levy Limit for Debt Service (1) (2) 355,611 269,350 246,360 242,027 - Less:Funds Restricted for Repayment of Gral Obligation Bonds - - - - - Total Net General Obligation Debt 355,611 269,350 246,360 242,027 - Current Year Debt Service Requirements 4,666 4,904 5,114 3,480 - Excess of Statutory Limit for Debt Service over
Current Requirements 350,945$ 264,446$ 241,246$ 238,547$ -$
Net Current Requirements as a % of Statutory Limit 1.31% 1.82% 2.08% 1.44% -
Notes:
(2) The year ended August 31, 2003 was the first year the College issued general obligation bonds.
(in Thousands)
(1) Texas Education Code Section 130.122 limits the debt service tax levy of community colleges to $0.50 per hundred dollars taxable assessed valuation.
Legal Debt Margin InformationFiscal Years 2003 to 2007

AUSTIN COMMUNITY COLLEGE DISTRICT Austin, Texas
STATISTICAL SECTION
(UNAUDITED)
70
JurisdictionNet Bonded Debt
OutstandingPercentage of
Overlapping Debt
Amount Applicable to
College
District:Austin Community College District $ 97,193,659 100.00% $ 97,193,659
Overlapping:Travis & Williamson Counties 1,026,397,382$ 52.83% 542,263,827$ Cities in ACC District 906,141,238 99.46% 901,208,905 School Districts in ACC District (1) 2,156,316,840 74.60% 1,608,658,095 Municipal Utility Districts 105,819,767 100.00% 105,819,767 Emergency Services Districts 6,780,000 74.37% 5,042,100 Water Control & Improvement Districts 97,180,001 100.00% 97,180,001 Road Districts 20,194,383 100.00% 20,194,383 Other Water & Utility Districts 10,249,105 97.10% 9,951,614
Total Overlapping Debt 4,329,078,716$ 3,290,318,692$
Total Direct and Overlapping Debt 4,426,272,375$ 3,387,512,351$
Sources:Texas Municipal Reports, April 25, 2007, Austin CCD (General Obligation Debt)Pflugerville ISD 2007-08 Financial FactsRound Rock ISD Notice of Public Meeting to Discuss Budget and Proposed Tax Rate, June 26, 2007Eanes ISD Notice of Public Meeting to Discuss Budget and Proposed Tax Rate, September 18, 2006
Notes:Overlapping tax districts are those that coincide, at least in part, with the geographic boundaries of the College.
(1) There were three Independent School Districts (ISD) added to the geographic boundaries of the College. These ISD are: Pflugerville ISD, Round Rock ISD and Eanes ISD.
Direct and Overlapping Bonded DebtAs of August 31, 2007
This schedule estimates the total outstanding debt that Austin Community College District's property tax payers are expected to repay.
The amount of debt applicable to the College's taxing district is computed by (1) determining the percentage of
presentation purposes.
the taxable assessed property value of the overlapping jurisdiction that lies within the limits of the College's taxing district and (2) applying those percentages to each jurisdiction's gross general obligation debt to calculate the amount of debt that is applicable to the College. Because there are 38 taxing jurisdictions thatoverlap the College's taxing district, the applicable debt amounts were aggregated by jurisdiction type for

AUSTIN COMMUNITY COLLEGE DISTRICT Austin, Texas
STATISTICAL SECTION
(UNAUDITED)
71
General Interest CoverageFiscal Year Tuition Fees Income Total Principal Interest Total Ratio
2007 1,156$ 5,629$ 2,681$ 9,466$ 1,920$ 2,179$ 4,099$ 2.312006 1,104 5,446 1,163 7,713 1,060 2,238 3,298 2.342005 1,188 5,274 113 6,576 605 2,451 3,056 2.152004 1,073 5,225 66 6,363 1,490 2,499 3,989 1.602003 1,110 5,140 208 6,458 1,460 2,570 4,030 1.602002 1,065 4,629 - 5,694 1,975 2,641 4,616 1.232001 1,025 4,049 - 5,074 1,905 2,464 4,369 1.162000 1,027 4,048 - 5,076 2,110 1,355 3,465 1.461999 997 3,907 - 4,904 1,985 1,474 3,459 1.421998 953 3,935 50 4,938 1,835 1,538 3,373 1.46
Pledged Revenue CoverageLast Ten Fiscal Years
(in Thousands)
Pledged Revenues Debt Service RequirementsRevenue Bonds
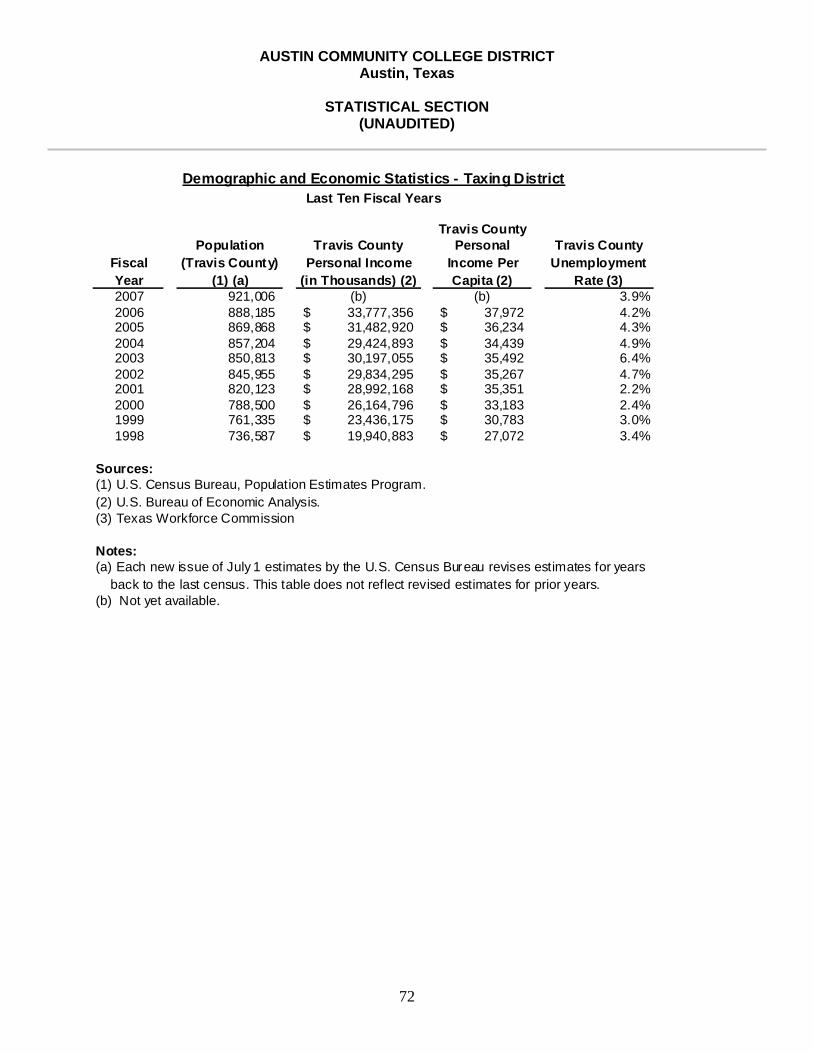
AUSTIN COMMUNITY COLLEGE DISTRICT Austin, Texas
STATISTICAL SECTION
(UNAUDITED)
72
Fiscal Year
Population (Travis County)
(1) (a)
Travis County Personal Income
(in Thousands) (2)
Travis County Personal
Income Per Capita (2)
Travis County Unemployment
Rate (3)2007 921,006 (b) (b) 3.9%2006 888,185 33,777,356$ 37,972$ 4.2%2005 869,868 31,482,920$ 36,234$ 4.3%2004 857,204 29,424,893$ 34,439$ 4.9%2003 850,813 30,197,055$ 35,492$ 6.4%2002 845,955 29,834,295$ 35,267$ 4.7%2001 820,123 28,992,168$ 35,351$ 2.2%2000 788,500 26,164,796$ 33,183$ 2.4%1999 761,335 23,436,175$ 30,783$ 3.0%1998 736,587 19,940,883$ 27,072$ 3.4%
Sources:(1) U.S. Census Bureau, Population Estimates Program. (2) U.S. Bureau of Economic Analysis.(3) Texas Workforce Commission
Notes:(a) Each new issue of July 1 estimates by the U.S. Census Bureau revises estimates for years back to the last census. This table does not reflect revised estimates for prior years.(b) Not yet available.
Demographic and Economic Statistics - Taxing DistrictLast Ten Fiscal Years

AUSTIN COMMUNITY COLLEGE DISTRICT Austin, Texas
STATISTICAL SECTION
(UNAUDITED)
73
EmployerNumber of Employees
% of Total Employment
Number of Employees
% of Total Employment
Local Government 67,659 9.35% 70,294 10.14%State Government 63,332 8.75% 69,436 10.02%Dell Inc. 17,000 2.35% 24,600 3.55%University of Texas at Austin 16,500 2.28% 16,298 2.35%Federal Government 9,911 1.37% 10,170 1.47%Seton Healthcare Network 7,538 1.04% 7,393 1.07%IBM Corporation 6,300 0.87% 6,200 0.89%St. David's Healthcare Partnership 5,712 0.79% 5,000 0.72%Wal-Mart Stores, Inc. 5,648 0.78% 5,027 0.73%Freescale Semiconductor, Inc. 5,400 0.75% 5,600 0.81%Total 205,000 28.33% 220,018 31.73%
Sources:Austin Business Journal, Book of Lists 2007, Employees as of March 2006American Statesman, Monday, July 17, 2006Austin Business Journal 2006 Greater Austin Chamber of Commerce, June 2005
Note:The College presented this schedule starting fiscal year 2006 and chose to implement prospectively.
20062007
Principal EmployersLast Two Fiscal Years
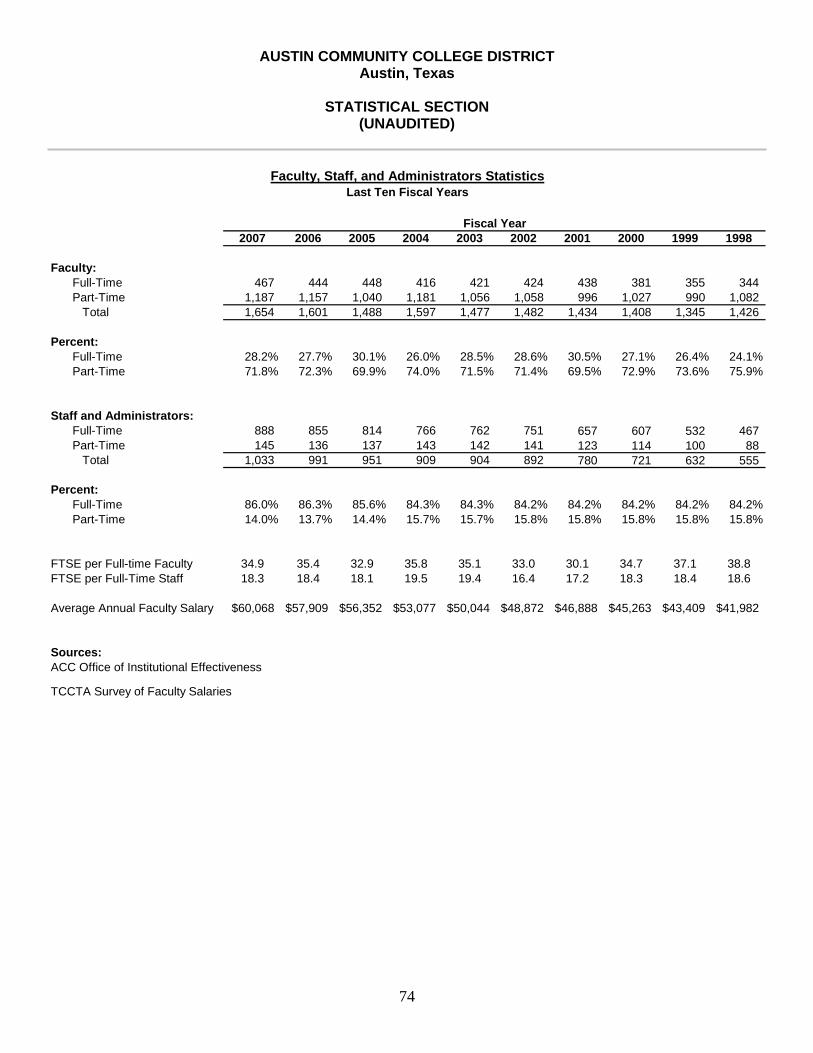
AUSTIN COMMUNITY COLLEGE DISTRICT Austin, Texas
STATISTICAL SECTION
(UNAUDITED)
74
2007 2006 2005 2004 2003 2002 2001 2000 1999 1998
Faculty:Full-Time 467 444 448 416 421 424 438 381 355 344Part-Time 1,187 1,157 1,040 1,181 1,056 1,058 996 1,027 990 1,082
Total 1,654 1,601 1,488 1,597 1,477 1,482 1,434 1,408 1,345 1,426
Percent:Full-Time 28.2% 27.7% 30.1% 26.0% 28.5% 28.6% 30.5% 27.1% 26.4% 24.1%Part-Time 71.8% 72.3% 69.9% 74.0% 71.5% 71.4% 69.5% 72.9% 73.6% 75.9%
Staff and Administrators:Full-Time 888 855 814 766 762 751 657 607 532 467Part-Time 145 136 137 143 142 141 123 114 100 88
Total 1,033 991 951 909 904 892 780 721 632 555
Percent:Full-Time 86.0% 86.3% 85.6% 84.3% 84.3% 84.2% 84.2% 84.2% 84.2% 84.2%Part-Time 14.0% 13.7% 14.4% 15.7% 15.7% 15.8% 15.8% 15.8% 15.8% 15.8%
FTSE per Full-time Faculty 34.9 35.4 32.9 35.8 35.1 33.0 30.1 34.7 37.1 38.8FTSE per Full-Time Staff 18.3 18.4 18.1 19.5 19.4 16.4 17.2 18.3 18.4 18.6
Average Annual Faculty Salary $60,068 $57,909 $56,352 $53,077 $50,044 $48,872 $46,888 $45,263 $43,409 $41,982
Sources:ACC Office of Institutional Effectiveness
TCCTA Survey of Faculty Salaries
Faculty, Staff, and Administrators StatisticsLast Ten Fiscal Years
Fiscal Year
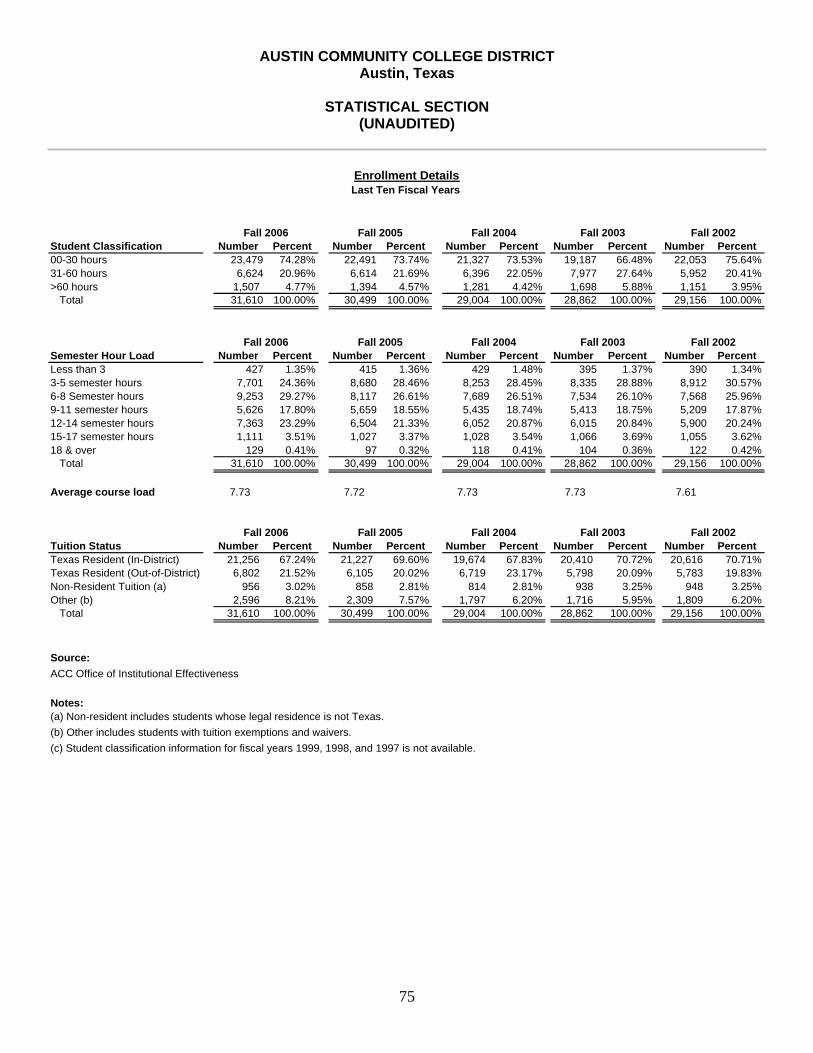
AUSTIN COMMUNITY COLLEGE DISTRICT Austin, Texas
STATISTICAL SECTION
(UNAUDITED)
75
Student Classification Number Percent Number Percent Number Percent Number Percent Number Percent00-30 hours 23,479 74.28% 22,491 73.74% 21,327 73.53% 19,187 66.48% 22,053 75.64%31-60 hours 6,624 20.96% 6,614 21.69% 6,396 22.05% 7,977 27.64% 5,952 20.41%>60 hours 1,507 4.77% 1,394 4.57% 1,281 4.42% 1,698 5.88% 1,151 3.95%
Total 31,610 100.00% 30,499 100.00% 29,004 100.00% 28,862 100.00% 29,156 100.00%
Semester Hour Load Number Percent Number Percent Number Percent Number Percent Number PercentLess than 3 427 1.35% 415 1.36% 429 1.48% 395 1.37% 390 1.34%3-5 semester hours 7,701 24.36% 8,680 28.46% 8,253 28.45% 8,335 28.88% 8,912 30.57%6-8 Semester hours 9,253 29.27% 8,117 26.61% 7,689 26.51% 7,534 26.10% 7,568 25.96%9-11 semester hours 5,626 17.80% 5,659 18.55% 5,435 18.74% 5,413 18.75% 5,209 17.87%12-14 semester hours 7,363 23.29% 6,504 21.33% 6,052 20.87% 6,015 20.84% 5,900 20.24%15-17 semester hours 1,111 3.51% 1,027 3.37% 1,028 3.54% 1,066 3.69% 1,055 3.62%18 & over 129 0.41% 97 0.32% 118 0.41% 104 0.36% 122 0.42%
Total 31,610 100.00% 30,499 100.00% 29,004 100.00% 28,862 100.00% 29,156 100.00%
Average course load 7.73 7.72 7.73 7.73 7.61
Tuition Status Number Percent Number Percent Number Percent Number Percent Number PercentTexas Resident (In-District) 21,256 67.24% 21,227 69.60% 19,674 67.83% 20,410 70.72% 20,616 70.71%Texas Resident (Out-of-District) 6,802 21.52% 6,105 20.02% 6,719 23.17% 5,798 20.09% 5,783 19.83%Non-Resident Tuition (a) 956 3.02% 858 2.81% 814 2.81% 938 3.25% 948 3.25%Other (b) 2,596 8.21% 2,309 7.57% 1,797 6.20% 1,716 5.95% 1,809 6.20%
Total 31,610 100.00% 30,499 100.00% 29,004 100.00% 28,862 100.00% 29,156 100.00%
Source: ACC Office of Institutional Effectiveness
Notes: (a) Non-resident includes students whose legal residence is not Texas.(b) Other includes students with tuition exemptions and waivers.(c) Student classification information for fiscal years 1999, 1998, and 1997 is not available.
Fall 2006 Fall 2005 Fall 2004 Fall 2003 Fall 2002
Fall 2003 Fall 2002Fall 2006
Fall 2006
Enrollment DetailsLast Ten Fiscal Years
Fall 2005
Fall 2005 Fall 2004 Fall 2003 Fall 2002
Fall 2004
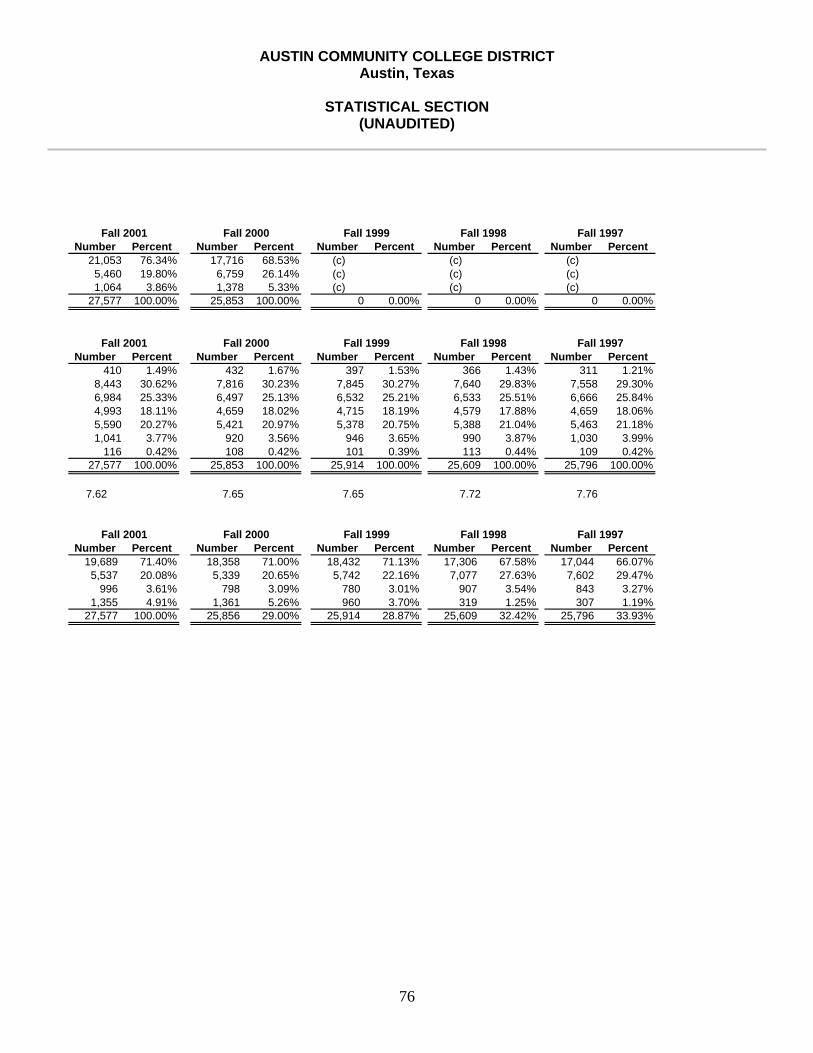
AUSTIN COMMUNITY COLLEGE DISTRICT Austin, Texas
STATISTICAL SECTION
(UNAUDITED)
76
Number Percent Number Percent Number Percent Number Percent Number Percent21,053 76.34% 17,716 68.53% (c) (c) (c)5,460 19.80% 6,759 26.14% (c) (c) (c)1,064 3.86% 1,378 5.33% (c) (c) (c)
27,577 100.00% 25,853 100.00% 0 0.00% 0 0.00% 0 0.00%
Number Percent Number Percent Number Percent Number Percent Number Percent410 1.49% 432 1.67% 397 1.53% 366 1.43% 311 1.21%
8,443 30.62% 7,816 30.23% 7,845 30.27% 7,640 29.83% 7,558 29.30%6,984 25.33% 6,497 25.13% 6,532 25.21% 6,533 25.51% 6,666 25.84%4,993 18.11% 4,659 18.02% 4,715 18.19% 4,579 17.88% 4,659 18.06%5,590 20.27% 5,421 20.97% 5,378 20.75% 5,388 21.04% 5,463 21.18%1,041 3.77% 920 3.56% 946 3.65% 990 3.87% 1,030 3.99%
116 0.42% 108 0.42% 101 0.39% 113 0.44% 109 0.42%27,577 100.00% 25,853 100.00% 25,914 100.00% 25,609 100.00% 25,796 100.00%
7.62 7.65 7.65 7.72 7.76
Number Percent Number Percent Number Percent Number Percent Number Percent19,689 71.40% 18,358 71.00% 18,432 71.13% 17,306 67.58% 17,044 66.07%5,537 20.08% 5,339 20.65% 5,742 22.16% 7,077 27.63% 7,602 29.47%
996 3.61% 798 3.09% 780 3.01% 907 3.54% 843 3.27%1,355 4.91% 1,361 5.26% 960 3.70% 319 1.25% 307 1.19%
27,577 100.00% 25,856 29.00% 25,914 28.87% 25,609 32.42% 25,796 33.93%
Fall 2001
Fall 2001
Fall 2001 Fall 2000 Fall 1999 Fall 1998 Fall 1997
Fall 2000 Fall 1999 Fall 1998 Fall 1997
Fall 2000 Fall 1999 Fall 1998 Fall 1997
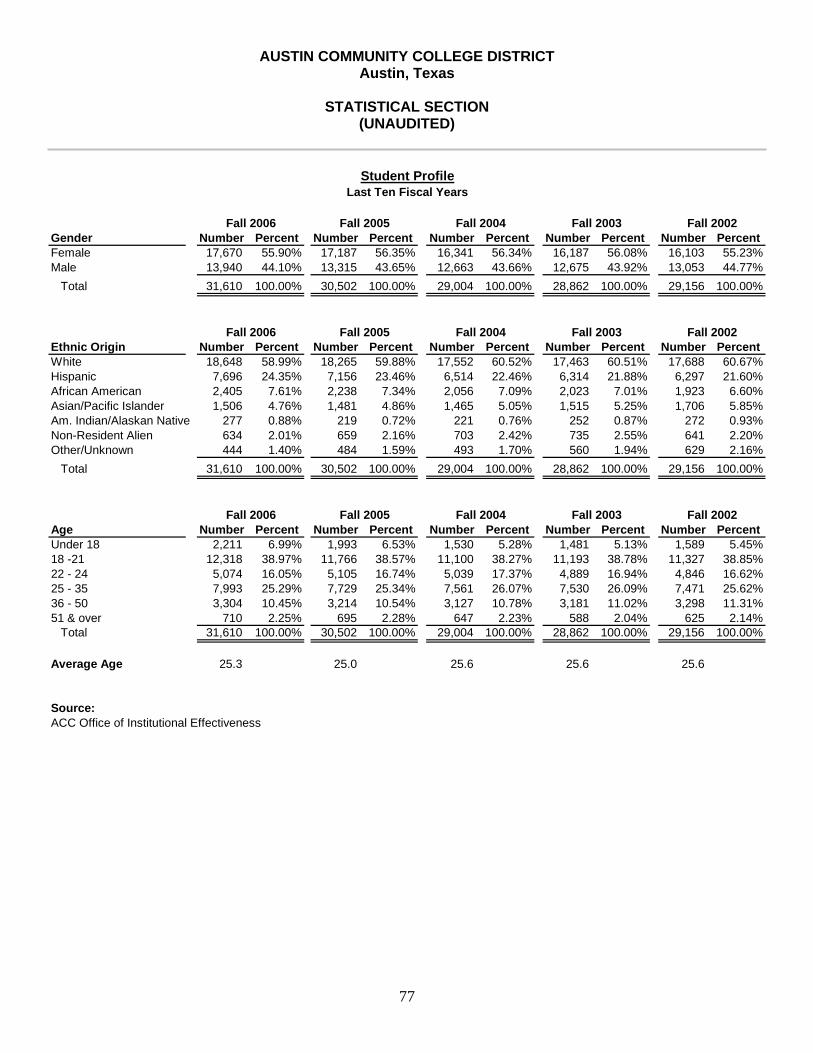
AUSTIN COMMUNITY COLLEGE DISTRICT Austin, Texas
STATISTICAL SECTION
(UNAUDITED)
77
Gender Number Percent Number Percent Number Percent Number Percent Number PercentFemale 17,670 55.90% 17,187 56.35% 16,341 56.34% 16,187 56.08% 16,103 55.23%Male 13,940 44.10% 13,315 43.65% 12,663 43.66% 12,675 43.92% 13,053 44.77%
Total 31,610 100.00% 30,502 100.00% 29,004 100.00% 28,862 100.00% 29,156 100.00%
Ethnic Origin Number Percent Number Percent Number Percent Number Percent Number PercentWhite 18,648 58.99% 18,265 59.88% 17,552 60.52% 17,463 60.51% 17,688 60.67%Hispanic 7,696 24.35% 7,156 23.46% 6,514 22.46% 6,314 21.88% 6,297 21.60%African American 2,405 7.61% 2,238 7.34% 2,056 7.09% 2,023 7.01% 1,923 6.60%Asian/Pacific Islander 1,506 4.76% 1,481 4.86% 1,465 5.05% 1,515 5.25% 1,706 5.85%Am. Indian/Alaskan Native 277 0.88% 219 0.72% 221 0.76% 252 0.87% 272 0.93%Non-Resident Alien 634 2.01% 659 2.16% 703 2.42% 735 2.55% 641 2.20%Other/Unknown 444 1.40% 484 1.59% 493 1.70% 560 1.94% 629 2.16%
Total 31,610 100.00% 30,502 100.00% 29,004 100.00% 28,862 100.00% 29,156 100.00%
Age Number Percent Number Percent Number Percent Number Percent Number PercentUnder 18 2,211 6.99% 1,993 6.53% 1,530 5.28% 1,481 5.13% 1,589 5.45%18 -21 12,318 38.97% 11,766 38.57% 11,100 38.27% 11,193 38.78% 11,327 38.85%22 - 24 5,074 16.05% 5,105 16.74% 5,039 17.37% 4,889 16.94% 4,846 16.62%25 - 35 7,993 25.29% 7,729 25.34% 7,561 26.07% 7,530 26.09% 7,471 25.62%36 - 50 3,304 10.45% 3,214 10.54% 3,127 10.78% 3,181 11.02% 3,298 11.31%51 & over 710 2.25% 695 2.28% 647 2.23% 588 2.04% 625 2.14%
Total 31,610 100.00% 30,502 100.00% 29,004 100.00% 28,862 100.00% 29,156 100.00%
Average Age 25.3 25.0 25.6 25.6 25.6
Source:ACC Office of Institutional Effectiveness
Fall 2006
Fall 2006
Fall 2006
Fall 2004 Fall 2003
Fall 2005 Fall 2004 Fall 2003 Fall 2002
Student ProfileLast Ten Fiscal Years
Fall 2002
Fall 2005 Fall 2004 Fall 2003 Fall 2002
Fall 2005
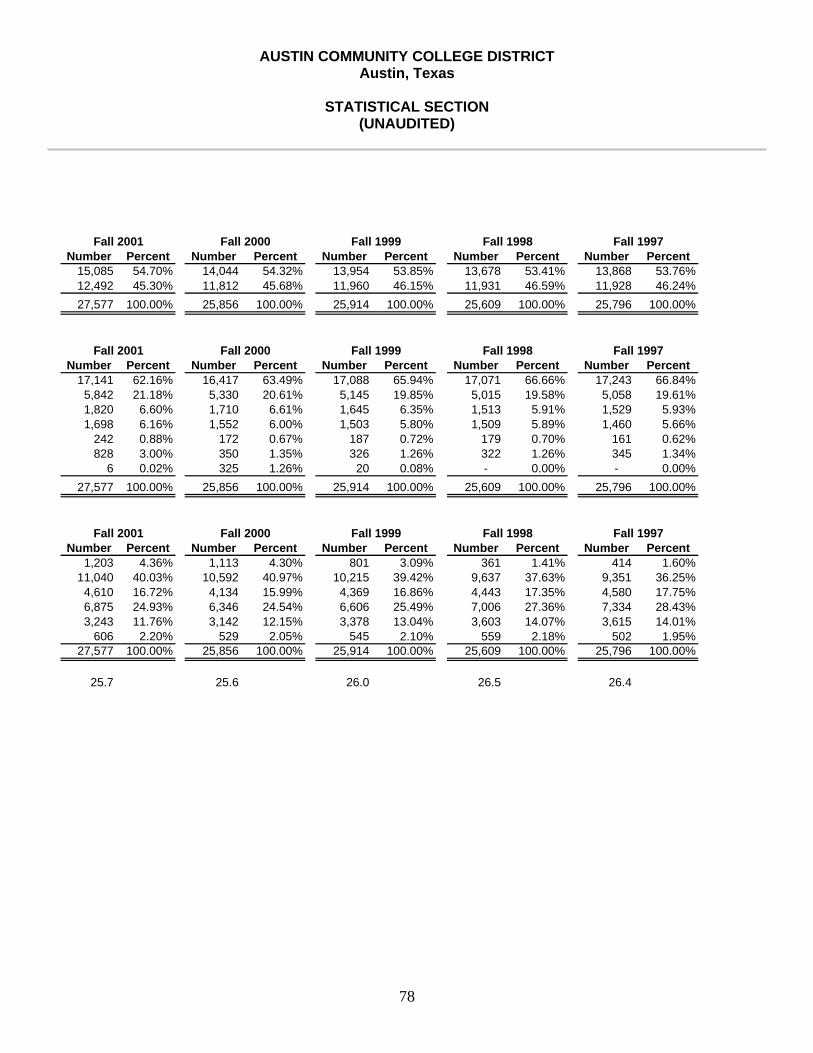
AUSTIN COMMUNITY COLLEGE DISTRICT Austin, Texas
STATISTICAL SECTION
(UNAUDITED)
78
Number Percent Number Percent Number Percent Number Percent Number Percent15,085 54.70% 14,044 54.32% 13,954 53.85% 13,678 53.41% 13,868 53.76%12,492 45.30% 11,812 45.68% 11,960 46.15% 11,931 46.59% 11,928 46.24%27,577 100.00% 25,856 100.00% 25,914 100.00% 25,609 100.00% 25,796 100.00%
Number Percent Number Percent Number Percent Number Percent Number Percent17,141 62.16% 16,417 63.49% 17,088 65.94% 17,071 66.66% 17,243 66.84%
5,842 21.18% 5,330 20.61% 5,145 19.85% 5,015 19.58% 5,058 19.61%1,820 6.60% 1,710 6.61% 1,645 6.35% 1,513 5.91% 1,529 5.93%1,698 6.16% 1,552 6.00% 1,503 5.80% 1,509 5.89% 1,460 5.66%
242 0.88% 172 0.67% 187 0.72% 179 0.70% 161 0.62%828 3.00% 350 1.35% 326 1.26% 322 1.26% 345 1.34%
6 0.02% 325 1.26% 20 0.08% - 0.00% - 0.00%27,577 100.00% 25,856 100.00% 25,914 100.00% 25,609 100.00% 25,796 100.00%
Number Percent Number Percent Number Percent Number Percent Number Percent1,203 4.36% 1,113 4.30% 801 3.09% 361 1.41% 414 1.60%
11,040 40.03% 10,592 40.97% 10,215 39.42% 9,637 37.63% 9,351 36.25%4,610 16.72% 4,134 15.99% 4,369 16.86% 4,443 17.35% 4,580 17.75%6,875 24.93% 6,346 24.54% 6,606 25.49% 7,006 27.36% 7,334 28.43%3,243 11.76% 3,142 12.15% 3,378 13.04% 3,603 14.07% 3,615 14.01%
606 2.20% 529 2.05% 545 2.10% 559 2.18% 502 1.95%27,577 100.00% 25,856 100.00% 25,914 100.00% 25,609 100.00% 25,796 100.00%
25.7 25.6 26.0 26.5 26.4
Fall 2000 Fall 1999 Fall 1998 Fall 1997
Fall 2000 Fall 1999 Fall 1998 Fall 1997
Fall 2000 Fall 1999 Fall 1998 Fall 1997
Fall 2001
Fall 2001
Fall 2001

AUSTIN COMMUNITY COLLEGE DISTRICT Austin, Texas
STATISTICAL SECTION
(UNAUDITED)
79
Transfer Transfer Transfer Total of % of Student Student Student all ACC all ACCCount Count Count Transfer Transfer
Academic Technical Tech-Prep Students Students
1 The University of Texas at Austin 3,864 1,070 354 5,288 54.27%2 Texas State University - San Marcos 1,839 433 189 2,461 25.26%3 Texas A&M University 360 83 37 480 4.93%4 The University of Texas at San Antonio 203 45 21 269 2.76%5 Texas Tech University 204 47 14 265 2.72%6 University of North Texas 122 29 4 155 1.59%7 University of Houston 86 17 6 109 1.12%8 The University of Texas at Arlington 43 18 6 67 0.69%9 Angelo State University 44 18 2 64 0.66%10 Tarleton State University 39 12 13 64 0.66%11 Stephen F. Austin State University 40 15 5 60 0.62%12 Sam Houston State University 35 8 10 53 0.54%13 Texas A&M University-Corpus Chr isti 43 5 2 50 0.51%14 Texas Woman's University 29 6 0 35 0.36%15 The University of Texas at Dallas 25 7 2 34 0.35%16 The University of Texas Health Science Ctr at San Antonio 20 11 1 32 0.33%17 Lamar University 13 6 2 21 0.22%18 The University of Texas-Pan American 16 4 1 21 0.22%19 Prairie View A&M University 10 7 4 21 0.22%20 The University of Texas Medical Branch at Galveston 13 5 0 18 0.18%21 The University of Texas at El Paso 15 2 0 17 0.17%22 Midwestern State University 7 6 3 16 0.16%23 Texas A&M University at Galveston 12 2 1 15 0.15%24 Texas A&M University-Kingsville 11 2 2 15 0.15%25 University of Houston-Downtown 11 2 2 15 0.15%26 West Texas A&M University 7 5 0 12 0.12%27 The University of Texas at Tyler 8 3 0 11 0.11%28 Texas Tech University Health Sciences Center 8 3 0 11 0.11%29 Sul Ross State University 9 1 0 10 0.10%30 Texas Southern University 7 2 1 10 0.10%31 Texas A&M University-Commerce 4 4 0 8 0.08%32 The University of Texas Health Science Ctr at Houston 5 1 0 6 0.06%33 The University of Texas Southwes tern Med Ctr at Dallas 6 0 0 6 0.06%34 Texas A&M International University 4 0 1 5 0.05%35 University of Houston-Clear Lake 2 3 0 5 0.05%36 University of Houston-Victoria 2 1 1 4 0.04%37 The University of Texas of the Permian Basin 3 0 0 3 0.03%38 The Texas A&M University System Health Science Ctr 1 2 0 3 0.03%39 The University of Texas M. D. Anderson 1 1 0 2 0.02%40 Sul Ross State University Rio Grande College 1 0 0 1 0.01%41 The University of Texas at Brownsville 1 0 0 1 0.01%42 University of North Texas Health Science Ctr at Fort Worth 1 0 0 1 0.01%
Totals 7,174 1,886 684 9,744 100.00%
Source:Texas Higher Education Coordinating Board's Automated Student and Adult Learner Follow-Up System
(Includes only public senior colleges in Texas)
Transfers to Senior Institutions2003-2004 Students as of Fall 2004
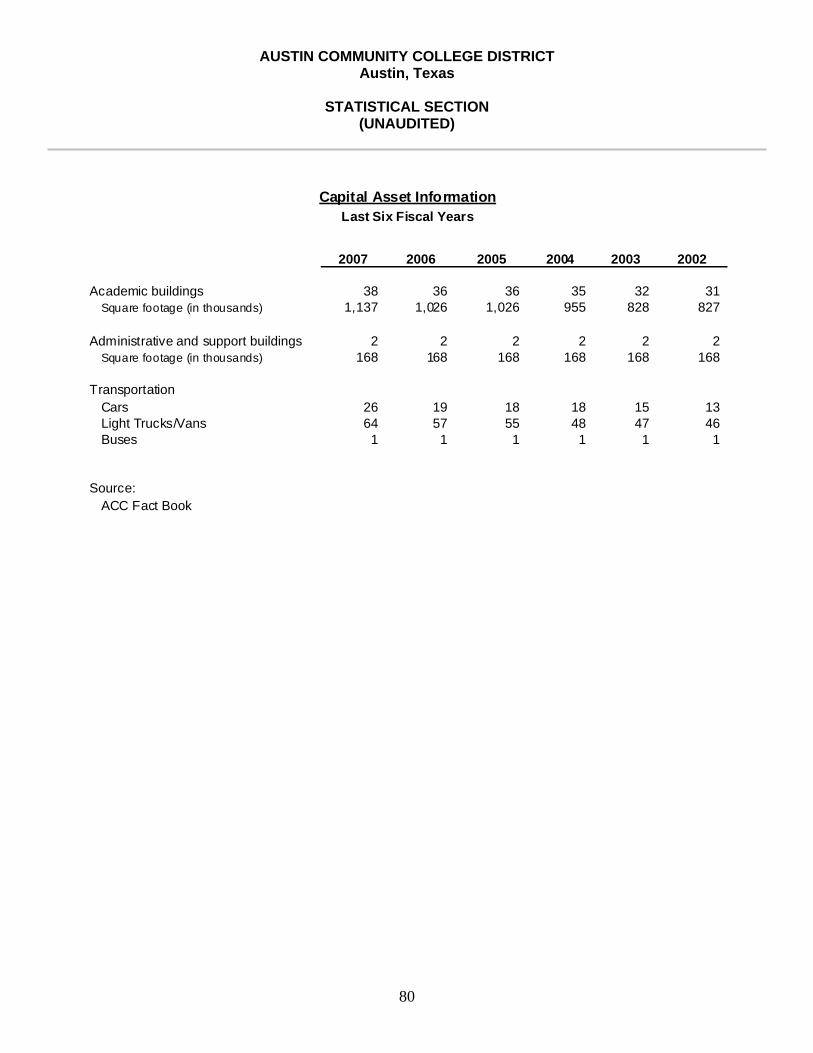
AUSTIN COMMUNITY COLLEGE DISTRICT Austin, Texas
STATISTICAL SECTION
(UNAUDITED)
80
2007 2006 2005 2004 2003 2002
Academic buildings 38 36 36 35 32 31 Square footage (in thousands) 1,137 1,026 1,026 955 828 827
Administrative and support buildings 2 2 2 2 2 2 Square footage (in thousands) 168 168 168 168 168 168
TransportationCars 26 19 18 18 15 13 Light Trucks/Vans 64 57 55 48 47 46 Buses 1 1 1 1 1 1
Source:ACC Fact Book
Capital Asset InformationLast Six Fiscal Years

Federal Single Audit Section


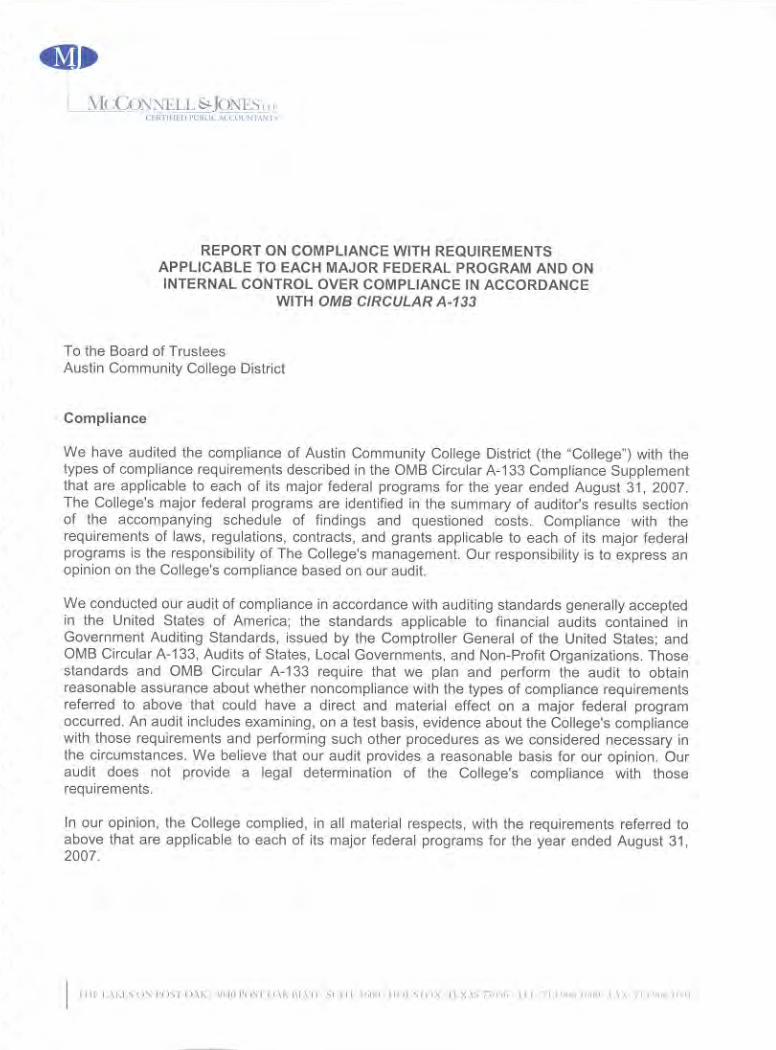
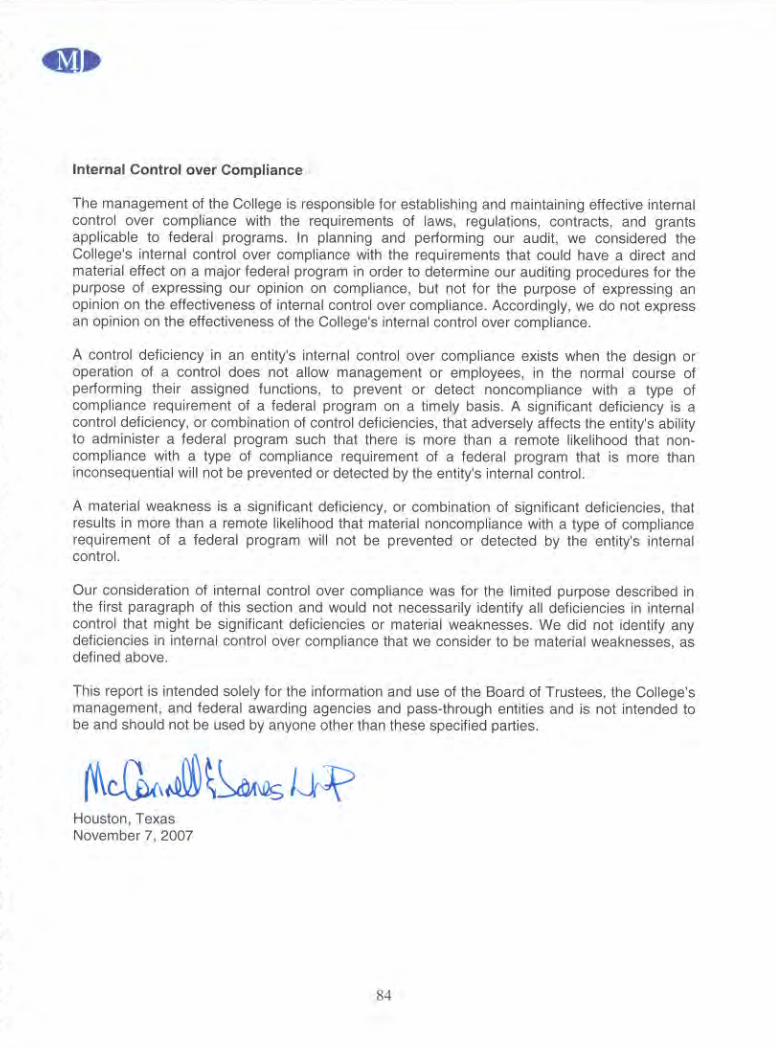
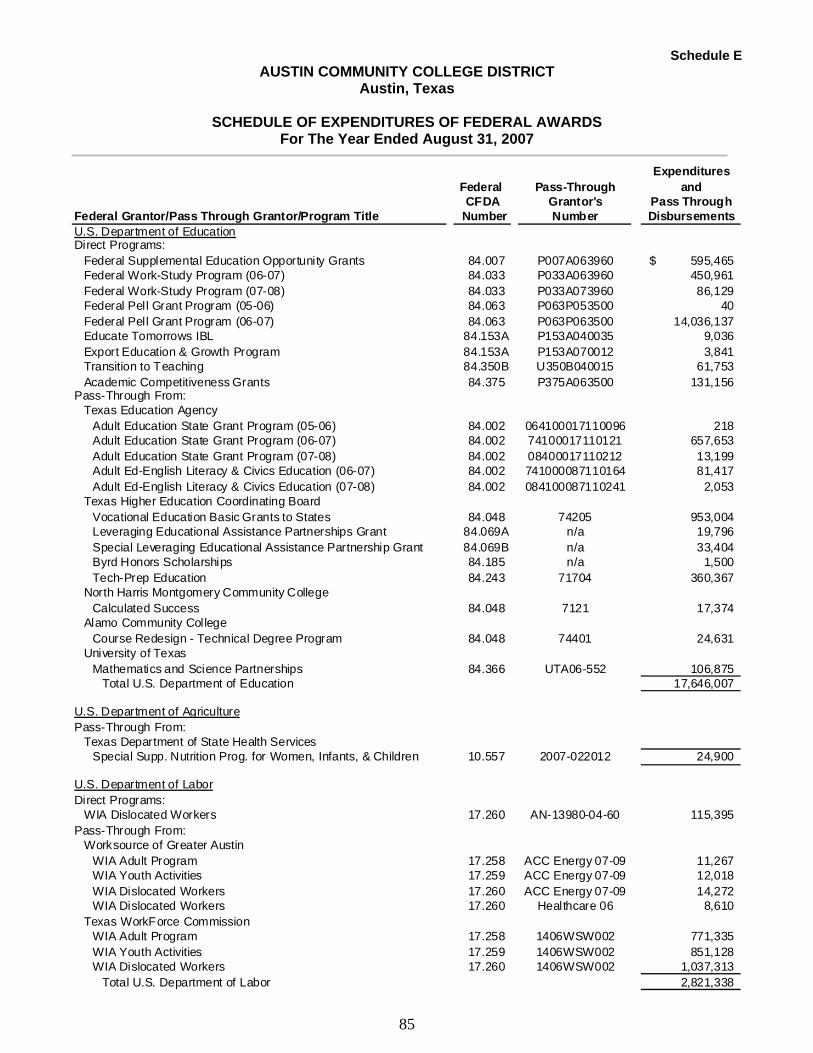
Schedule E AUSTIN COMMUNITY COLLEGE DISTRICT
Austin, Texas
SCHEDULE OF EXPENDITURES OF FEDERAL AWARDS For The Year Ended August 31, 2007
85
ExpendituresFederal Pass-Through andCFDA Grantor's Pass Through
Federal Grantor/Pass Through Grantor/Program Title Number Number DisbursementsU.S. Department of EducationDirect Programs:
Federal Supplemental Education Opportunity Grants 84.007 P007A063960 595,465$ Federal Work-Study Program (06-07) 84.033 P033A063960 450,961Federal Work-Study Program (07-08) 84.033 P033A073960 86,129Federal Pell Grant Program (05-06) 84.063 P063P053500 40Federal Pell Grant Program (06-07) 84.063 P063P063500 14,036,137Educate Tomorrows IBL 84.153A P153A040035 9,036Export Education & Growth Program 84.153A P153A070012 3,841Transition to Teaching 84.350B U350B040015 61,753Academic Competitiveness Grants 84.375 P375A063500 131,156
Pass-Through From:Texas Education Agency
Adult Education State Grant Program (05-06) 84.002 064100017110096 218Adult Education State Grant Program (06-07) 84.002 74100017110121 657,653Adult Education State Grant Program (07-08) 84.002 08400017110212 13,199Adult Ed-English Literacy & Civics Education (06-07) 84.002 741000087110164 81,417Adult Ed-English Literacy & Civics Education (07-08) 84.002 084100087110241 2,053
Texas Higher Education Coordinating BoardVocational Education Basic Grants to States 84.048 74205 953,004Leveraging Educational Assistance Partnerships Grant 84.069A n/a 19,796Special Leveraging Educational Assistance Partnership Grant 84.069B n/a 33,404Byrd Honors Scholarships 84.185 n/a 1,500Tech-Prep Education 84.243 71704 360,367
North Harris Montgomery Community CollegeCalculated Success 84.048 7121 17,374
Alamo Community CollegeCourse Redesign - Technical Degree Program 84.048 74401 24,631
University of TexasMathematics and Science Partnerships 84.366 UTA06-552 106,875
Total U.S. Department of Education 17,646,007
U.S. Department of AgriculturePass-Through From:
Texas Department of State Health ServicesSpecial Supp. Nutrition Prog. for Women, Infants, & Children 10.557 2007-022012 24,900
U.S. Department of LaborDirect Programs:
WIA Dislocated Workers 17.260 AN-13980-04-60 115,395Pass-Through From:
Worksource of Greater AustinWIA Adult Program 17.258 ACC Energy 07-09 11,267WIA Youth Activities 17.259 ACC Energy 07-09 12,018WIA Dislocated Workers 17.260 ACC Energy 07-09 14,272WIA Dislocated Workers 17.260 Healthcare 06 8,610
Texas WorkForce CommissionWIA Adult Program 17.258 1406WSW002 771,335WIA Youth Activities 17.259 1406WSW002 851,128WIA Dislocated Workers 17.260 1406WSW002 1,037,313
Total U.S. Department of Labor 2,821,338
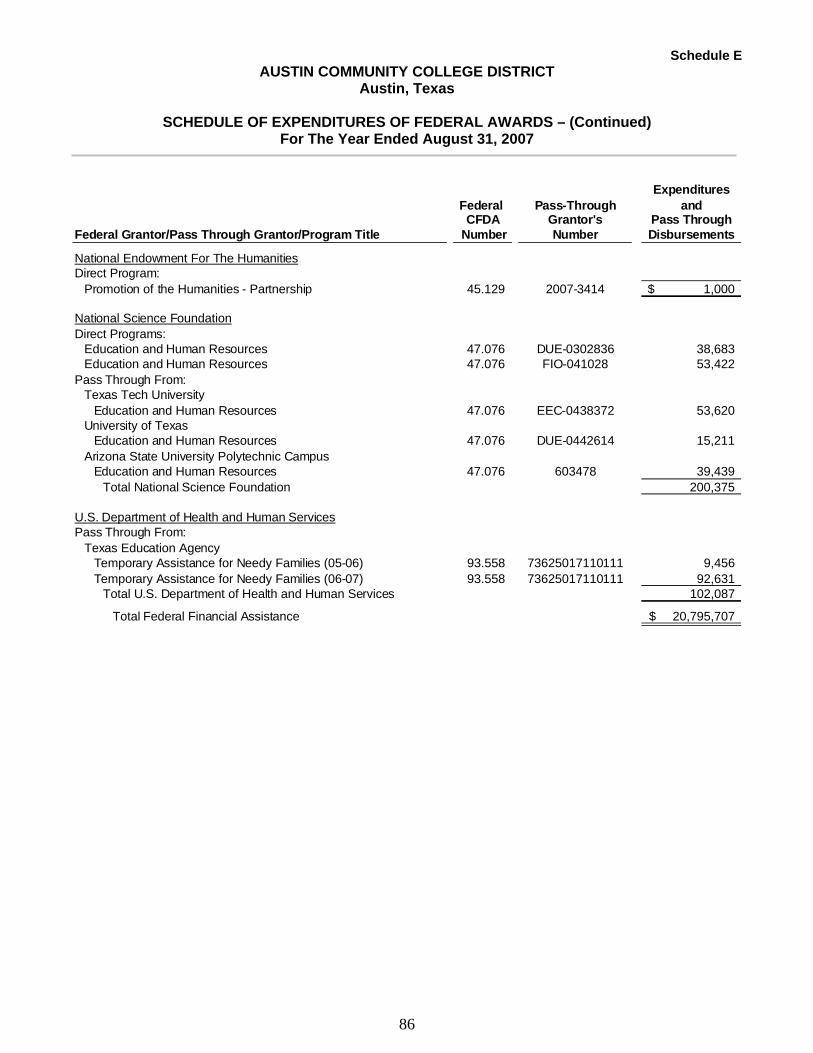
Schedule E AUSTIN COMMUNITY COLLEGE DISTRICT
Austin, Texas
SCHEDULE OF EXPENDITURES OF FEDERAL AWARDS – (Continued) For The Year Ended August 31, 2007
86
ExpendituresFederal Pass-Through andCFDA Grantor's Pass Through
Federal Grantor/Pass Through Grantor/Program Title Number Number Disbursements
National Endowment For The HumanitiesDirect Program:
Promotion of the Humanities - Partnership 45.129 2007-3414 1,000$
National Science FoundationDirect Programs:
Education and Human Resources 47.076 DUE-0302836 38,683Education and Human Resources 47.076 FIO-041028 53,422
Pass Through From:Texas Tech University
Education and Human Resources 47.076 EEC-0438372 53,620University of Texas
Education and Human Resources 47.076 DUE-0442614 15,211Arizona State University Polytechnic Campus
Education and Human Resources 47.076 603478 39,439Total National Science Foundation 200,375
U.S. Department of Health and Human ServicesPass Through From:
Texas Education AgencyTemporary Assistance for Needy Families (05-06) 93.558 73625017110111 9,456Temporary Assistance for Needy Families (06-07) 93.558 73625017110111 92,631
Total U.S. Department of Health and Human Services 102,087
Total Federal Financial Assistance 20,795,707$
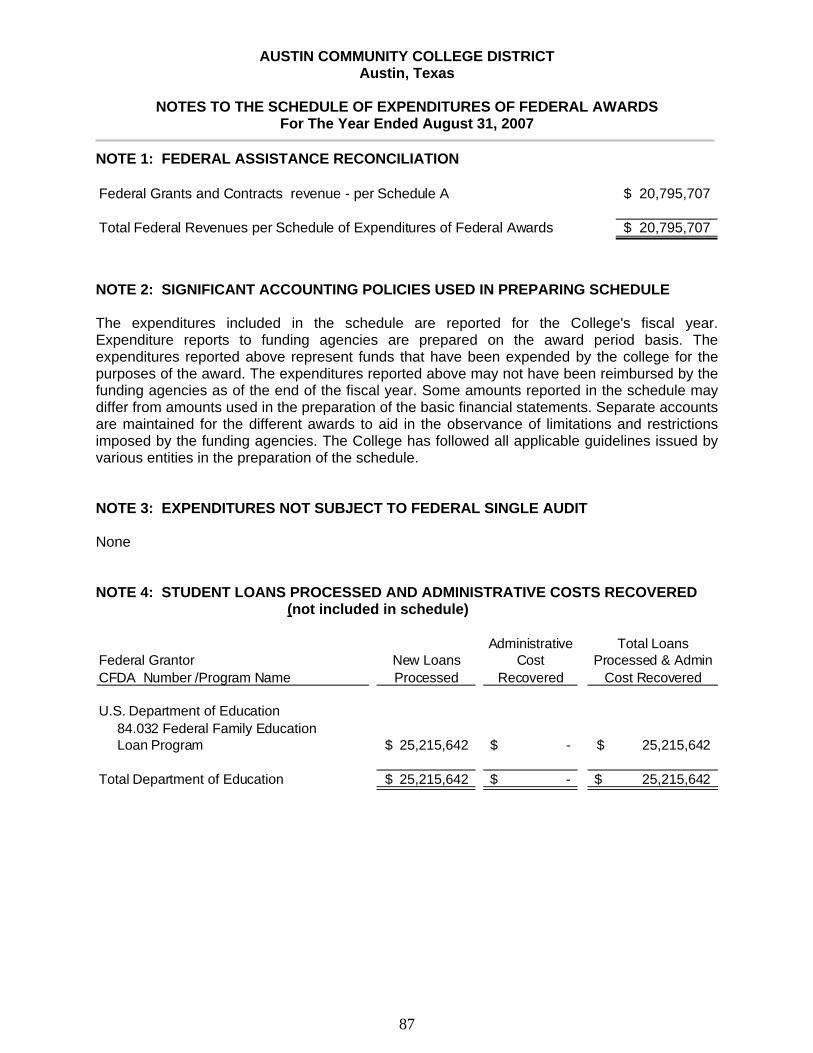
AUSTIN COMMUNITY COLLEGE DISTRICT Austin, Texas
NOTES TO THE SCHEDULE OF EXPENDITURES OF FEDERAL AWARDS
For The Year Ended August 31, 2007
87
NOTE 1: FEDERAL ASSISTANCE RECONCILIATION
Federal Grants and Contracts revenue - per Schedule A 20,795,707$
Total Federal Revenues per Schedule of Expenditures of Federal Awards 20,795,707$
NOTE 2: SIGNIFICANT ACCOUNTING POLICIES USED IN PREPARING SCHEDULE The expenditures included in the schedule are reported for the College's fiscal year. Expenditure reports to funding agencies are prepared on the award period basis. The expenditures reported above represent funds that have been expended by the college for the purposes of the award. The expenditures reported above may not have been reimbursed by the funding agencies as of the end of the fiscal year. Some amounts reported in the schedule may differ from amounts used in the preparation of the basic financial statements. Separate accounts are maintained for the different awards to aid in the observance of limitations and restrictions imposed by the funding agencies. The College has followed all applicable guidelines issued by various entities in the preparation of the schedule. NOTE 3: EXPENDITURES NOT SUBJECT TO FEDERAL SINGLE AUDIT None NOTE 4: STUDENT LOANS PROCESSED AND ADMINISTRATIVE COSTS RECOVERED
(not included in schedule)
Administrative Total LoansFederal Grantor New Loans Cost Processed & AdminCFDA Number /Program Name Processed Recovered Cost Recovered
U.S. Department of Education84.032 Federal Family EducationLoan Program 25,215,642$ -$ 25,215,642$
Total Department of Education 25,215,642$ -$ 25,215,642$
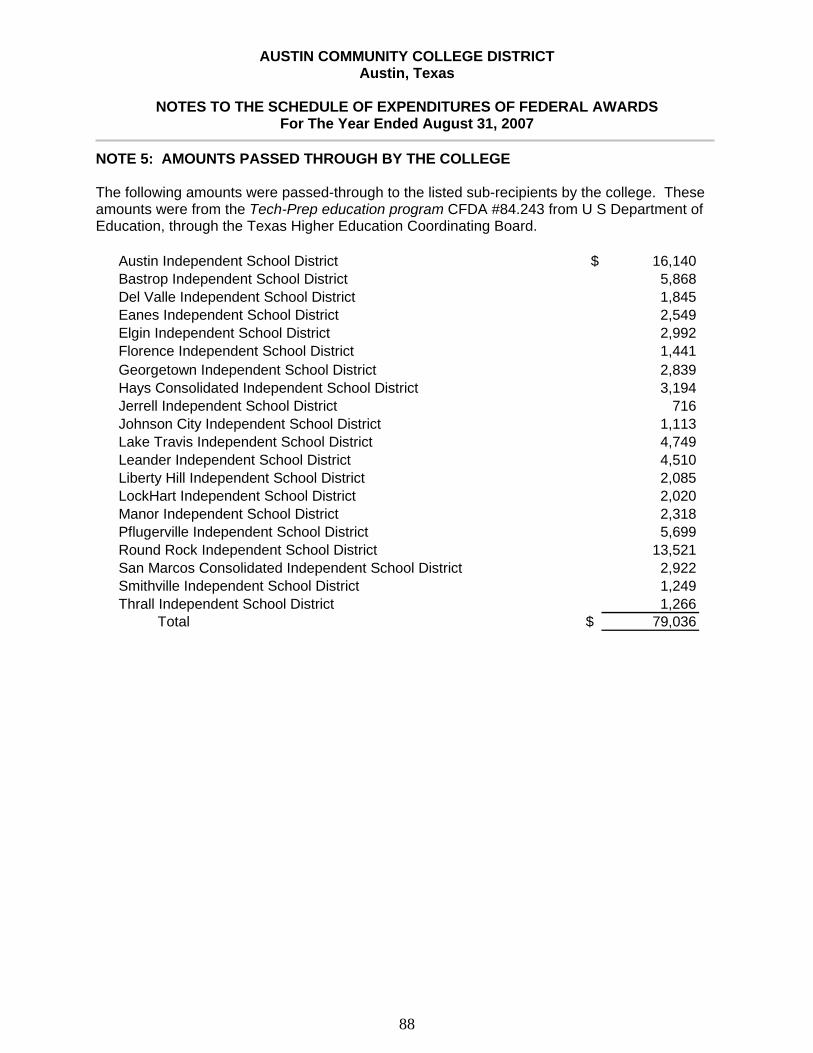
AUSTIN COMMUNITY COLLEGE DISTRICT Austin, Texas
NOTES TO THE SCHEDULE OF EXPENDITURES OF FEDERAL AWARDS
For The Year Ended August 31, 2007
88
NOTE 5: AMOUNTS PASSED THROUGH BY THE COLLEGE The following amounts were passed-through to the listed sub-recipients by the college. These amounts were from the Tech-Prep education program CFDA #84.243 from U S Department of Education, through the Texas Higher Education Coordinating Board.
Austin Independent School District $ 16,140Bastrop Independent School District 5,868Del Valle Independent School District 1,845Eanes Independent School District 2,549Elgin Independent School District 2,992Florence Independent School District 1,441Georgetown Independent School District 2,839Hays Consolidated Independent School District 3,194Jerrell Independent School District 716Johnson City Independent School District 1,113Lake Travis Independent School District 4,749Leander Independent School District 4,510Liberty Hill Independent School District 2,085LockHart Independent School District 2,020Manor Independent School District 2,318Pflugerville Independent School District 5,699Round Rock Independent School District 13,521San Marcos Consolidated Independent School District 2,922Smithville Independent School District 1,249Thrall Independent School District 1,266
Total $ 79,036
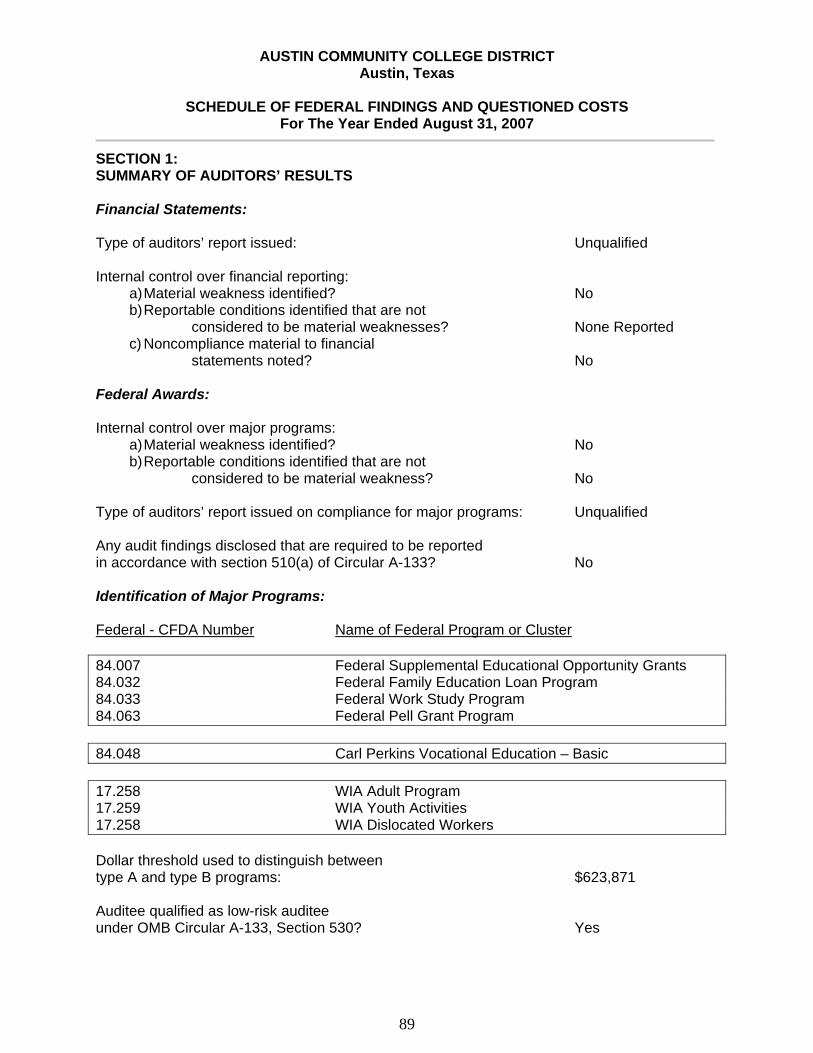
AUSTIN COMMUNITY COLLEGE DISTRICT Austin, Texas
SCHEDULE OF FEDERAL FINDINGS AND QUESTIONED COSTS
For The Year Ended August 31, 2007
89
SECTION 1: SUMMARY OF AUDITORS’ RESULTS Financial Statements: Type of auditors’ report issued: Unqualified Internal control over financial reporting:
a) Material weakness identified? No b) Reportable conditions identified that are not
considered to be material weaknesses? None Reported c) Noncompliance material to financial
statements noted? No Federal Awards: Internal control over major programs:
a) Material weakness identified? No b) Reportable conditions identified that are not
considered to be material weakness? No Type of auditors’ report issued on compliance for major programs: Unqualified Any audit findings disclosed that are required to be reported in accordance with section 510(a) of Circular A-133? No Identification of Major Programs:
Federal - CFDA Number Name of Federal Program or Cluster 84.007 Federal Supplemental Educational Opportunity Grants 84.032 Federal Family Education Loan Program 84.033 Federal Work Study Program 84.063 Federal Pell Grant Program 84.048 Carl Perkins Vocational Education – Basic 17.258 WIA Adult Program 17.259 WIA Youth Activities 17.258 WIA Dislocated Workers Dollar threshold used to distinguish between type A and type B programs: $623,871 Auditee qualified as low-risk auditee under OMB Circular A-133, Section 530? Yes
AUSTIN COMMUNITY COLLEGE DISTRICT Austin, Texas
SCHEDULE OF FEDERAL FINDINGS AND QUESTIONED COSTS
For The Year Ended August 31, 2007
90
SECTION 2: FINDINGS - FINANCIAL STATEMENT AUDIT None reported. SECTION 3: FINDINGS AND QUESTIONED COSTS - MAJOR FEDERAL AWARD PROGRAMS None reported. SECTION 4: PRIOR YEAR FINDINGS Finding 2006-01: Corrected

State Single Audit Section
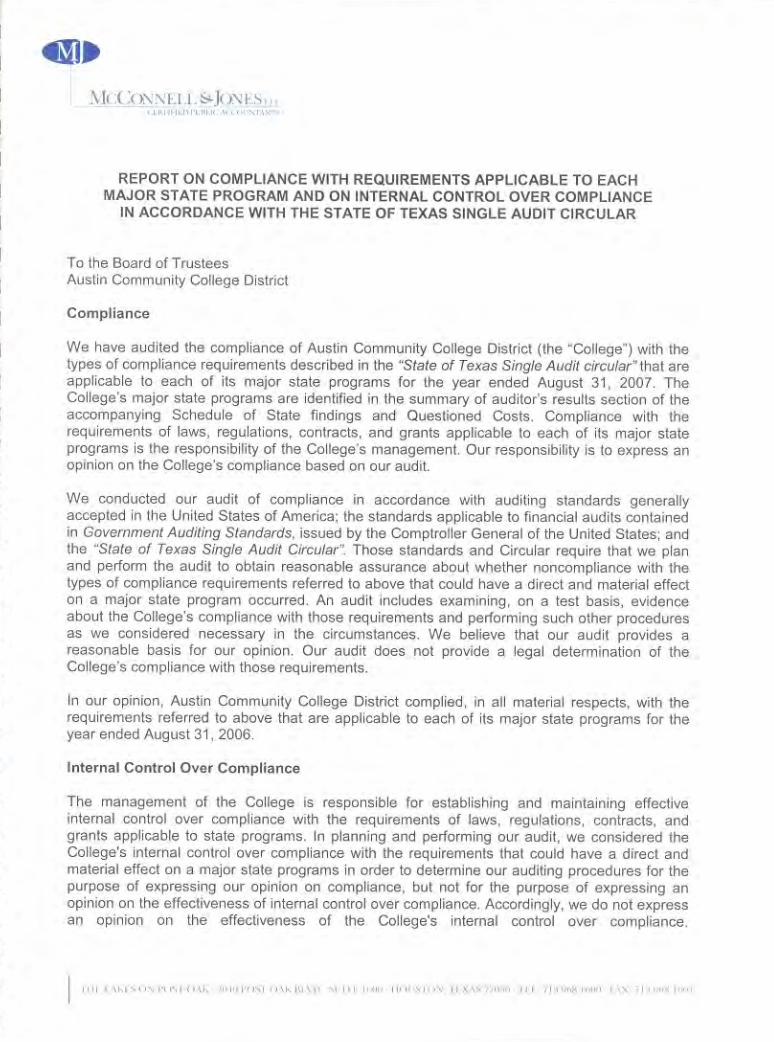

Schedule F AUSTIN COMMUNITY COLLEGE DISTRICT
Austin, Texas
SCHEDULE OF EXPENDITURES OF STATE AWARDS For The Year Ended August 31, 2007
93
Grantor Agency/Program TitleGrant Contract
Number Expenditures Pass
Through To Total
Expenditures
Texas Higher Education Coordinating BoardVirtual College of Texas - 244,272$ 333,838$ 578,110$ TACC - Real Estate Mathematics - 3,088 3,088 Texas Grant Fund 07 - 514,500 - 514,500 Texas Grant I 07 - 131,565 - 131,565 Texas College Work Study 07 - 58,077 - 58,077 Texas College Work Study 08 - 127 - 127 Nursing Shortage - 53,195 - 53,195 Course Redesign - Computer Programming 71408 32,852 - 32,852 Professional Nursing Scholarship - 12,135 - 12,135 Course Redesign - Spanish - 17,448 - 17,448 Vocational Nursing Scholarship - 1,078 - 1,078
Total of Texas Higher Education Coordinating Board 1,068,338 333,838 1,402,176
Texas Education AgencyE3 Alliance 071045117110001 106,388 - 106,388 Adult Education 06 060100017110096 299 - 299 Adult Education 07 070100017110121 137,804 - 137,804 Temporary Assistance for Needy Families/State 06 060110017110088 74 - 74 Temporary Assistance for Needy Families/State 07 070110017110111 40,349 - 40,349 Temporary Assistance for Needy Families/State 08 080110017110197 263 - 263
Total of Texas Education Agency 285,177 - 285,177
Texas LEOSELaw Enforcement Ed - 2,988 - 2,988
Texas Workforce CommissionManufacture Consortium 1507SDF000 93,675 - 93,675 Skill Development - Nursing 1405SDF000 23,778 277,964 301,742
Total Texas Workforce Commission 117,453 277,964 395,417
WorkSource Wireless Technology - 23,157 - 23,157 STEAG Hama Tech - 18,178 - 18,178 Medical Terminology - 24,000 - 24,000 E3 Nursing E3ACC07 33,544 - 33,544 Biotech BIO-06-07 161,363 - 161,363
Total WorkSource 260,241 260,241
State Energy Conservation OfficeState Energy Conservation Office-PV Installer CM615 5,653 - 5,653
Total Expenditures of State Awards 1,739,850$ 611,803$ 2,351,652$
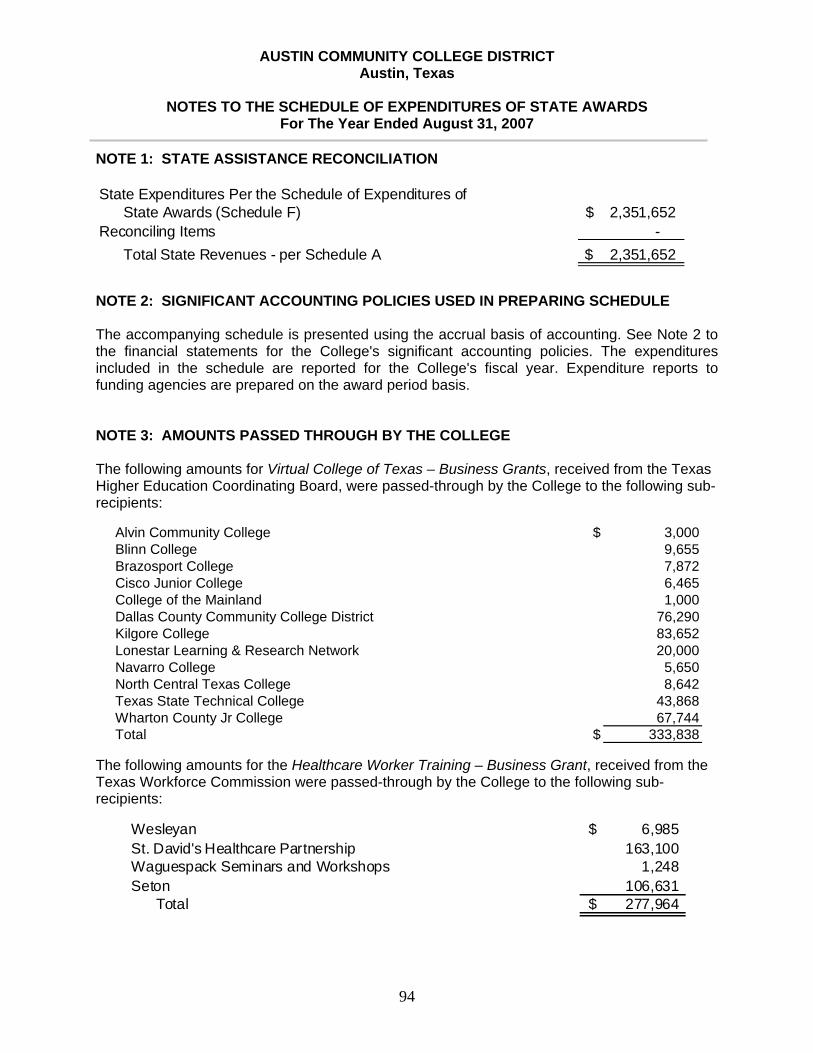
AUSTIN COMMUNITY COLLEGE DISTRICT Austin, Texas
NOTES TO THE SCHEDULE OF EXPENDITURES OF STATE AWARDS
For The Year Ended August 31, 2007
94
NOTE 1: STATE ASSISTANCE RECONCILIATION State Expenditures Per the Schedule of Expenditures of
State Awards (Schedule F) 2,351,652$ Reconciling Items -
Total State Revenues - per Schedule A 2,351,652$
NOTE 2: SIGNIFICANT ACCOUNTING POLICIES USED IN PREPARING SCHEDULE The accompanying schedule is presented using the accrual basis of accounting. See Note 2 to the financial statements for the College's significant accounting policies. The expenditures included in the schedule are reported for the College's fiscal year. Expenditure reports to funding agencies are prepared on the award period basis. NOTE 3: AMOUNTS PASSED THROUGH BY THE COLLEGE The following amounts for Virtual College of Texas – Business Grants, received from the Texas Higher Education Coordinating Board, were passed-through by the College to the following sub-recipients:
Alvin Community College $ 3,000Blinn College 9,655Brazosport College 7,872Cisco Junior College 6,465College of the Mainland 1,000Dallas County Community College District 76,290Kilgore College 83,652Lonestar Learning & Research Network 20,000Navarro College 5,650North Central Texas College 8,642Texas State Technical College 43,868Wharton County Jr College 67,744Total $ 333,838
The following amounts for the Healthcare Worker Training – Business Grant, received from the Texas Workforce Commission were passed-through by the College to the following sub-recipients:
Wesleyan 6,985$ St. David's Healthcare Partnership 163,100 Waguespack Seminars and Workshops 1,248 Seton 106,631
Total 277,964$
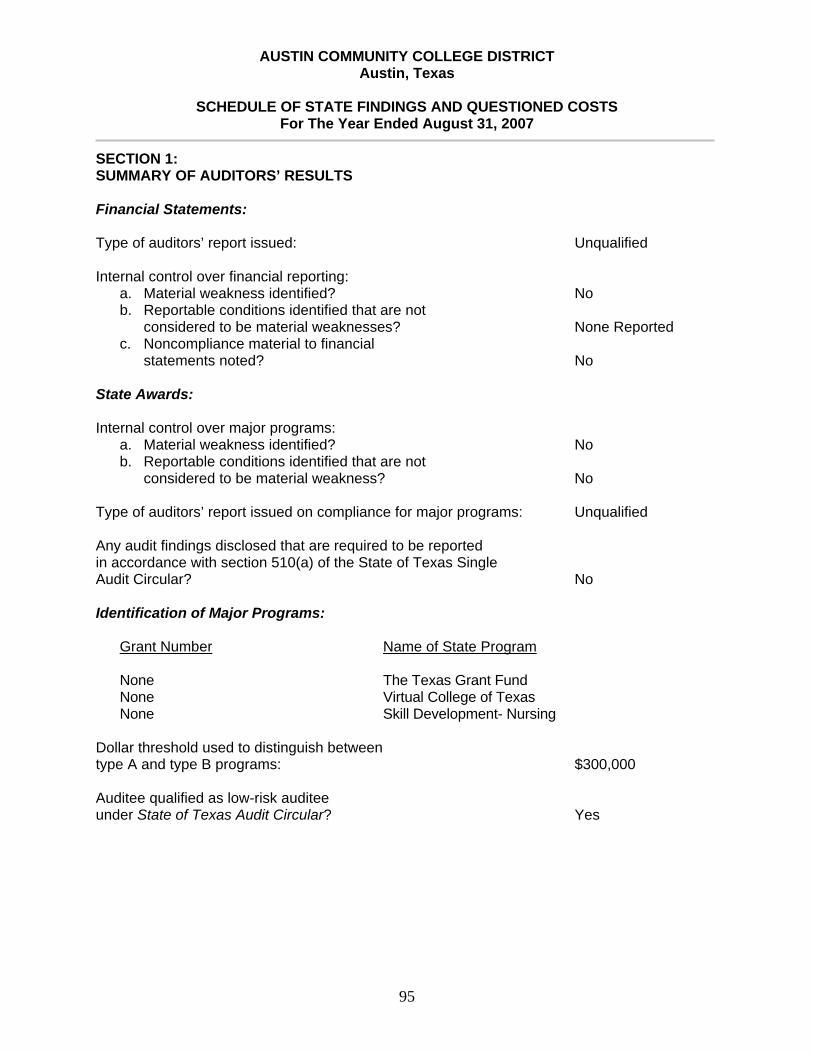
AUSTIN COMMUNITY COLLEGE DISTRICT Austin, Texas
SCHEDULE OF STATE FINDINGS AND QUESTIONED COSTS
For The Year Ended August 31, 2007
95
SECTION 1: SUMMARY OF AUDITORS’ RESULTS Financial Statements: Type of auditors’ report issued: Unqualified Internal control over financial reporting:
a. Material weakness identified? No b. Reportable conditions identified that are not
considered to be material weaknesses? None Reported c. Noncompliance material to financial
statements noted? No State Awards: Internal control over major programs:
a. Material weakness identified? No b. Reportable conditions identified that are not considered to be material weakness? No
Type of auditors’ report issued on compliance for major programs: Unqualified Any audit findings disclosed that are required to be reported in accordance with section 510(a) of the State of Texas Single Audit Circular? No Identification of Major Programs:
Grant Number Name of State Program None The Texas Grant Fund None Virtual College of Texas None Skill Development- Nursing Dollar threshold used to distinguish between type A and type B programs: $300,000 Auditee qualified as low-risk auditee under State of Texas Audit Circular? Yes
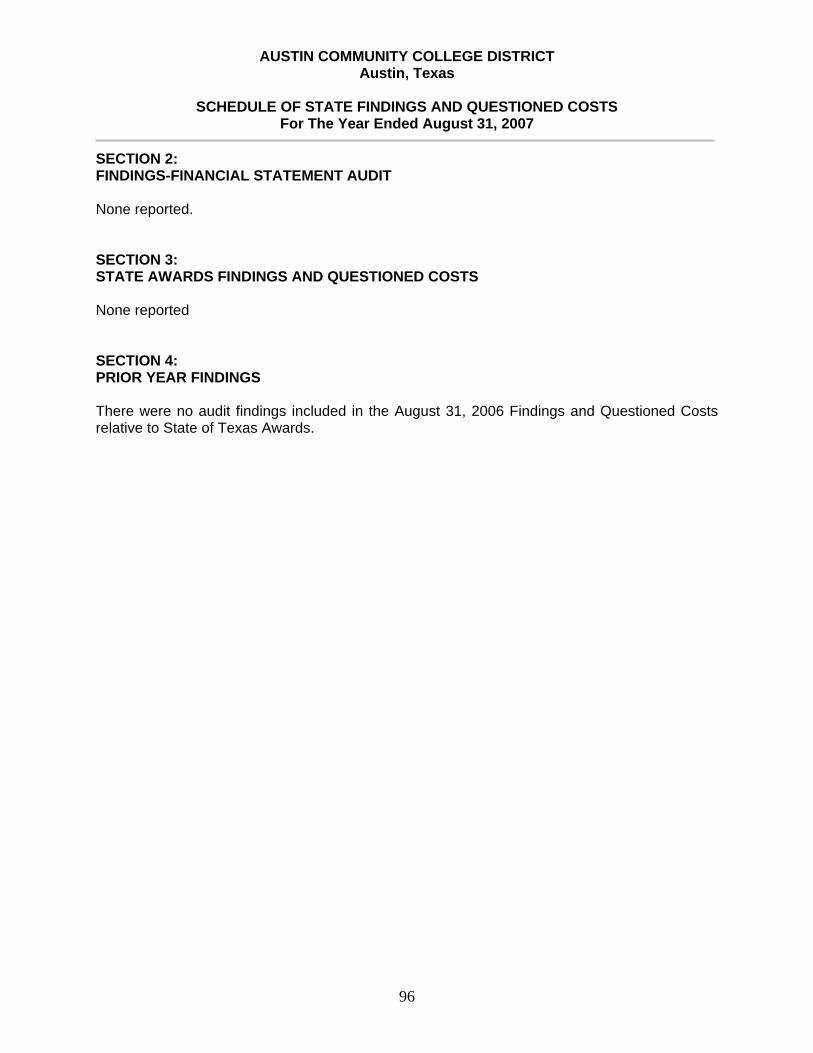
AUSTIN COMMUNITY COLLEGE DISTRICT Austin, Texas
SCHEDULE OF STATE FINDINGS AND QUESTIONED COSTS
For The Year Ended August 31, 2007
96
SECTION 2: FINDINGS-FINANCIAL STATEMENT AUDIT None reported. SECTION 3: STATE AWARDS FINDINGS AND QUESTIONED COSTS None reported SECTION 4: PRIOR YEAR FINDINGS There were no audit findings included in the August 31, 2006 Findings and Questioned Costs relative to State of Texas Awards.

Austin Community College DistrictBusiness Services
5930 Middle Fiskville RoadAustin, Texas 78752