financial asset holdings of households in the united ... · financial asset holdings of households...
TRANSCRIPT

Financial Asset Holdings of Households in the United States
in 2013
January 21, 2016 Constantijn W.A. Panis, PhD Advanced Analytical Consulting Group, Inc. 213-784-6400 [email protected]
Michael J. Brien, PhD Deloitte Transactions and Business Analytics LLP 202-378-5096 [email protected]

i
ABSTRACT
This report aims to support the U.S. Department of Labor (DOL) with tabulations of asset holdings and investment patterns of households in the United States. It is organized in two parts. Part I contains a summary of publicly available data sources with measures of holdings of 401(k) and other defined contribution (DC) plans, individual retirement accounts (IRAs), and after-tax investment accounts. The primary focus is on the Survey of Consumer Finances and the Survey of Income and Program Participation. Part II contains tabulations and analyses based on the Survey of Consumer Finances of 2013. It documents differences among owners of IRAs, 401(k) and other DC plans, and after-tax investment accounts.

ii
CONTENTS
Abstract ......................................................................................................... i
Part I. Summary of Available Data ............................................................ 1
I.1. Introduction ...................................................................................... 2 I.2. Survey of Consumer Finances .............................................................. 3
Overview ................................................................................................ 3 Survey Design and Weights ...................................................................... 4 Imputation ............................................................................................. 4 Survey Content ....................................................................................... 5 Summary Statistics .................................................................................. 7
I.3. Survey of Income and Program Participation ......................................... 10 Overview ............................................................................................... 10 Survey Design and Weights ..................................................................... 10 Topical Modules ...................................................................................... 11 Summary Statistics ................................................................................. 14
I.4. Other Data Sources ........................................................................... 16 Health and Retirement Study ................................................................... 16 Panel Study of Income Dynamics .............................................................. 16 Employee Benefit Research Institute Data .................................................. 17 The Center for Research in Security Prices Data .......................................... 17 Financial Research Corporation Data ......................................................... 18 E-filings of SEC Form N-SAR .................................................................... 19 FINRA BrokerCheck Reports ..................................................................... 19 SEC Form ADV ....................................................................................... 20 State Financial Regulators ....................................................................... 22
I.5. Bibliography ..................................................................................... 23
Part II. Statistical Analysis ....................................................................... 24
II.1. Introduction .................................................................................. 25 II.2. Tabulations and Analyses ................................................................ 26
Appendix 1 .................................................................................................. 60
Availability of Data on IRA and DC Account Age .......................................... 60
Appendix 2 .................................................................................................. 61
Calculations for Table 26: IRAs, IRA assets, and Median Household Income of IRA Holders, by Type of Institution Holding IRAs ......................................... 61
Disclaimer ................................................................................................... 62

iii
TABLES
Table 1: SCF Data Availability .......................................................................... 4 Table 2: IRA/Keogh Accounts ........................................................................... 5 Table 3: Pensions from Current Main Job ........................................................... 6 Table 4: Pensions from Past Jobs ..................................................................... 6 Table 5. Asset Allocation of First DC Plan from Respondent’s Current Job ............... 7 Table 6. Asset Allocation of Respondent’s First IRA/Keogh Account ........................ 7 Table 7. First Institution where Respondent’s IRAs Are Held ................................. 8 Table 8. Sources of Investment/Savings Advice .................................................. 8 Table 9. Demographic Characteristics ................................................................ 9 Table 10. Topical Modules Related to Retirement and Assets ............................... 11 Table 11. Topical Modules in the 2008 Panel ..................................................... 13 Table 12. Asset Types Reported in IRAs (2008 Panel, Wave 5) ............................. 14 Table 13. Asset Types Reported in DC Plans (2008 Panel, Wave 5) ....................... 14 Table 14. Demographic Characteristics (2008 Panel, Wave 3) .............................. 15 Table 15 . Categories of Households by Ownership and Value of Account ............... 26Table 16. Categories of Households by Ownership and Value of Accounts (including
all retail investments and savings) .................................................... 27 Table 17. Taxable Asset Holders and Holdings by Asset Type ............................... 28 Table 18. Income Distribution for All Households and for Those with IRAs, DC Plans,
or Taxable Accounts ....................................................................... 29 Table 19. Income Distribution of Asset Holdings for Households with IRAs, DC Plans,
or Taxable Accounts ....................................................................... 31 Table 20. Income Summary Statistics for Households with IRAs, DC Plans, or Taxable
Accounts ($ thousands) ................................................................... 32 Table 21. Account-Balance Summary Statistics for IRAs, DC Plans, and Taxable
Accounts ($ thousands) ................................................................... 32 Table 22. Stock-Fraction Summary Statistics for IRAs, DC Plans, and Taxable
Accounts ....................................................................................... 32 Table 23. Distribution of Demographic Characteristics of the Heads of All Households
and of Those with IRAs, DC Plans, or Taxable Accounts ........................ 33 Table 24. Asset-Weighted Distribution of Demographic Characteristics of the Heads
of Households with IRAs, DC Plans, or Taxable Accounts ...................... 34 Table 25. Margin Loan Statistics ...................................................................... 34 Table 26: IRAs, IRA assets, and Median Household Income of IRA Holders, by Type
of Institution Holding IRAs ............................................................... 35 Table 27. Distribution of Asset Holdings By Household Income ............................. 36 Table 28. Distribution of Households, IRA Accounts, and IRA Assets by Total
Household IRA Assets ..................................................................... 39 Table 29. Distribution of Number of IRA Accounts per Household Member by Total
Household IRA Assets ..................................................................... 40 Table 30. Household Account Types by Source of Financial Advice ........................ 41
iv
Table 31. Sources of Financial Advice by Household Account Types ...................... 42 Table 32. Sources of Financial Advice for Households with an IRA, by Household IRA
Assets .......................................................................................... 43 Table 33. Sources of Financial Advice for Households with an IRA, by Household IRA
Assets .......................................................................................... 44 Table 34. IRA Assets of Households That Consulted a Financial Planner, Banker,
Broker, Accountant, or Lawyer ......................................................... 45 Table 35. IRA Assets of Households That Consulted a Broker ............................... 46 Table 36. Median Household Income, by IRA Ownership and Professional Advice .... 47 Table 37. Sources of Financial Advice by Household Income ................................ 48 Table 38. Sources of Financial Advice by Head of Household Demographics ........... 49 Table 39. Sources of Financial Advice by Financial Institution(s) that Hold
Households’ IRAs ........................................................................... 50 Table 40. Households’ IRA-holding Financial Institution(s) by Total Household IRA
Assets .......................................................................................... 51 Table 41. Households’ IRA-holding Financial Institution(s) by Total Household Income
................................................................................................... 52 Table 42. Households’ IRA-holding Financial Institution(s) by Head of Household
Demographics ................................................................................ 53 Table 43. Households' IRA-holding Financial Institution(s) by Total Household Wealth
Quintiles and Top Percentiles ........................................................... 54 Table 44. Distribution of Asset Holdings by Total Household Wealth Quintiles ......... 55 Table 45. Distribution of Asset Holdings Overall and by Total Household Wealth Top
Percentiles .................................................................................... 57 Table 46. Distribution of Asset Holdings among IRA Holders by Total IRA-holding
Household Wealth Quintiles ............................................................. 58 Table 47. Distribution of Asset Holdings among IRA Holders Overall and by Total IRA-
holding Household Wealth Top Percentiles .......................................... 59

v
FIGURES
Figure 1. Income Distribution for All Households and for Those with IRAs, DC Plans, or Taxable Accounts ....................................................................... 30
Figure 2. Household Income Distribution of Asset Holdings for Households with IRAs, DC Plans, or Taxable Accounts ......................................................... 31
Figure 3. Household Asset Holdings, Income < $10K .......................................... 37 Figure 4. Household Asset Holdings, Income $10K-20K ...................................... 37 Figure 5. Household Asset Holdings, Income $20K-50K ...................................... 37 Figure 6. Household Asset Holdings, Income $50K-100K ..................................... 37 Figure 7. Household Asset Holdings, Income $100K-200K ................................... 38 Figure 8. Household Asset Holdings, Income $200K-500K ................................... 38 Figure 9. Household Asset Holdings, Income $500K+ ......................................... 38 Figure 10. Household Asset Holdings, Total Population ....................................... 38

1
PART I. SUMMARY OF AVAILABLE DATA

I.1. Introduction 2
I.1. INTRODUCTION
Part I of this report summarizes data that are available to measure holdings of 401(k) and other defined contribution (DC) plans, individual retirement accounts (IRAs), and after-tax investment accounts. The emphasis is on data sources which may be particularly useful in supporting an analysis of the potential reach of proposed changes in the definition of a fiduciary. The main data sources of interest are the Survey of Consumer Finances (SCF) and the Survey of Income and Program Participation (SIPP). The SCF is a repeated cross-section of household-level data, collected every three years. It combines a geographically and socio-economically representative sample with an oversample of wealthy households. See Section I.2 for a description of the SCF, including its survey design, sample weighting scheme, availability, and key questions about investments. The SIPP is a repeated panel survey. About every three years, a new multi-stage stratified sample is drawn, and respondents are interviewed approximately every four months for about four years. Section I.3 discusses the SIPP, including its survey design, core and modular topics, availability, and key questions about investments. Section I.4 discusses other datasets that are potentially of interest. The Health and Retirement Study (HRS) is a panel survey of Americans over age 50 interviewed every other year. Every six years, the sample is augmented with respondents from younger cohorts. The Panel Study of Income Dynamics (PSID) is a panel survey which dates back to 1968. Respondents were interviewed annually through 1997 and every other year since 1999. The PSID attempts to follow not just original respondents but also others who split off from the respondent’s household. Employee Benefit Research Institute (EBRI) data are compiled from surveys of IRA plan administrators as well as of the Investment Company Institute. Center for Research in Security Prices (CRSP) data give daily stock prices, dividends and rates of return since 1926. Financial Research Corporation (FRC) data and Securities and Exchange Commission (SEC) filings of Semi-Annual Reports for Registered Investment Companies (Form N-SAR) are also briefly discussed.

I.2. Survey of Consumer Finances 3
I.2. SURVEY OF CONSUMER FINANCES
Website: http://www.federalreserve.gov/pubs/oss/oss2/about.html
Overview
The SCF is conducted every three years and gathers information on various financial and demographic characteristics of families in the United States. The study is sponsored by the Federal Reserve Board (FRB) in cooperation with the Department of the Treasury, and data are collected by the National Organization for Research at the University of Chicago (NORC). SCF data are intended to represent the “primary economic unit” (PEU). The PEU is defined as a single individual or couple (married or living as partners) and all individuals who are financially dependent on that individual or couple.1
In most instances, the PEU and the household are identical.
The last three survey years for which data are currently publicly available are 2007, 2010, and 2013. About 4,500 households were sampled in 2007, 6,500 in 2010, and 6,000 in 2013. The SCF includes some respondents who qualify for the Forbes Magazine list of the 400 richest Americans, but these respondents are excluded from the public data set. In order to examine the effect of the recent financial crisis and ensuing recession, a special SCF was fielded in 2009 that attempted to re-interview respondents to the 2007 SCF.2
The 2009 follow-up SCF included fewer questions than the 2007 survey and focused on topic areas most helpful for understanding the financial crisis’ impact on families in the United States (Bricker et al., 2011; e-mail communication with FRB staff). Specifically, the highest-level questions on different components of wealth were retained; but, in most instances, fewer detailed questions were asked.
Data for the 1983-2013 waves of the SCF along with the 2007-2009 panel survey are publicly available online. Table 1 summarizes SCF data availability beginning with the 2001 survey.
1 For example, in a household that consists of a married couple, two dependent children, and the financially independent parent of one of the spouses, the PEU would consist of only the married couple and two children.

I.2. Survey of Consumer Finances 4
Table 1: SCF Data Availability
The SCF utilizes computer-assisted personal interviewing (CAPI). Interviews are conducted in person or over the phone and in English or in Spanish. In 2013, about 34 percent of the interviews were conducted over the phone, and the vast majority were conducted in English.
Survey Design and Weights
The SCF employs a dual-frame sample design that is made up of a national multi-stage area probability (AP) sample and a list sample that oversamples wealthy households. The purpose of the dual-frame design is to ensure that information is collected both on attributes that are broadly distributed throughout the population and on those that are narrowly focused towards the wealthy. In 2013, approximately four-fifths of respondents originate from the AP sample and one-fifth from the list sample. The AP sample focuses on characteristics that are broadly distributed in the population, such as credit card debt. The sample is selected in several stages of clustering and stratification. First the U.S. is divided into geographic groups. Then some areas are selected as Primary Sampling Units (PSUs) with probability one, while others are drawn randomly from geographically based strata. Further stratification defines sub-areas within PSUs, and from the smallest of these (roughly “block” level) households are sampled. The list sample is selected from the Individual Tax File (ITF), an annual probability sample drawn from the complete set of tax returns by the Statistics of Income Division of the Internal Revenue Service. The list sample oversamples wealthy households, boosting sample coverage of variables that are largely concentrated among wealthy households, such as ownership of corporate stock. The dual-frame sampling procedure, along with several instances of clustering and stratifying, require analysis weights to be computed for the SCF data. The SCF computes a single analysis weight for the complete sample of households. For details see Kennickell and Woodburn (1997) or Kennickell (1999, 2000).
Imputation
Most missing data items have values imputed. The imputation process does not correct for certain hierarchical inconsistencies. For example, total income in the
Survey year Date availableNumber of respondents
(publicly available)2001 currently available 4,4422004 currently available 4,5192007 currently available 4,418
2007-2009 Panel currently available 3,8572010 currently available 6,4822013 currently available 6,015
Sources: http://www.federalreserve.gov/econresdata/scf/scfindex.htmSCF Codebook (2001, 2004, 2007, 2007-2009 Panel, 2010, 2013)

I.2. Survey of Consumer Finances 5
observed data is sometimes not equal to the sum of the individual components, and imputed data may likewise exhibit such an inconsistency. The imputations are stored as five replicates of the data, based on five different imputation assumptions. In other words, the number of observations in the public file is five times as large as the number of respondents, and non-missing data have equal values (that is, the observed value) in all five replicates. Data items that are imputed are flagged as such. A detailed description of the algorithm used for imputations can be found in Kennickell (1998).
Survey Content
The SCF asks questions on DC pensions and IRAs separately. The following tables list the paraphrasing of questions that may be of interest for analysis, and their availability in the 2007, 2010 and 2013 surveys.
Table 2: IRA/Keogh Accounts
Survey Year Question 2007 2010 2013
How many IRA and Keogh accounts do you have? (up to 5 recorded)
x x x
Are these accounts: Roth IRAs rolled over from other pension accounts? regular IRAs? Keoghs?
x x x
How much is in your: Roth IRAs rolled over from other pension accounts? regular IRAs? Keoghs?
x x x
How is the money in this account invested? stocks interest-earning assets split something else
x x x
Where are these accounts held? commercial bank savings and loan/savings bank credit union brokerage other
x x x

I.2. Survey of Consumer Finances 6
Table 3: Pensions from Current Main Job
Survey Year
Question 2007 2010 2013 Are you included in any pension, retirement, or tax-deferred savings plans connected with your current main job? (detailed information on up to 6 plans, summary information on all other plans)
x x x
Is the plan the type in which money accumulates in an account designated for the worker and the worker or employer may make contributions to the account?
x x x
Or, is the plan a traditional pension plan that provides regular benefits at retirement based on years of work and pay?
x x x
Do you have a choice about how these funds are invested? x x x How is the money in this account invested? stocks interest-earning assets split something else
x x x
What percent of this account is invested in stocks? x x x Is any of this stock in the company where you work? x x x What percent of your pay do you contribute to the plan? x x x What percent of your pay does your employer contribute to the plan?
x x x
Table 4: Pensions from Past Jobs
Survey Year Question 2007 2010 2013
Do you have any accounts from a previous employer that you will receive or draw on in the future? (detailed information on up to 6 accounts, summary information on all others)
x x x
About this benefit, is it a type of plan that has an account balance, is it a plan that will pay out a regular income for life after retirement, or is it a mixture of the two types?
x x x
How much is in the account now? x x x How is the money in this account invested? stocks interest-earning assets split something else
x x x
What percent of this account is invested in stocks? x x x Is any invested in the stock of the company where you worked? x x x
Independent from any type of account, the SCF further inquires about the sources of advice on savings or investments which respondents use.

I.2. Survey of Consumer Finances 7
Summary Statistics
This section presents illustrative summary statistics on demographics, asset allocation, institutions in which IRAs are held, and investment advice. All tabulations are based on the 2013 SCF. Table 5 tabulates the asset allocation of the respondent’s first DC plan. Similarly, Table 6 tabulates the asset allocation of the respondent’s first IRA or Keogh account.
Table 5. Asset Allocation of First DC Plan from Respondent’s Current Job
Table 6. Asset Allocation of Respondent’s First IRA/Keogh Account
Freq. PercentWeighted Percent
Other 5 0.1% 0.0%All in stocks 2,245 26.4% 23.6%All in interest earning assets 962 11.3% 12.0%Split 5,303 62.3% 64.4%Total 8,515 100.0% 100.0%Source: 2013 SCF.
Freq. PercentWeighted Percent
Other 75 0.8% 0.7%All in stocks 3,284 34.3% 33.0%All in interest earning assets 1,210 12.6% 14.9%Split 5,019 52.3% 51.4%Total 9,588 100.0% 100.0%Source: 2013 SCF.

I.2. Survey of Consumer Finances 8
Table 7 tabulates the first institution mentioned by the respondent.
Table 7. First Institution where Respondent’s IRAs Are Held
Table 8 tabulates what sources of information respondents (and their family) use to make decisions about saving and investments.
Table 8. Sources of Investment/Savings Advice
Freq. PercentWeighted Percent
Commercial Bank 4,377 45.7% 45.2%Savings Loan/Bank 198 2.1% 3.0%Credit Union 432 4.5% 7.2%Finance/Loan Company 132 1.4% 1.4%Brokerage 4,143 43.2% 39.9%Insurance Company 143 1.5% 1.6%Mortgage Company 25 0.3% 0.3%Accountant 20 0.2% 0.2%Current or Former Employer 5 0.1% 0.1%Individual Formal Lender 10 0.1% 0.1%Pension Administrator 10 0.1% 0.1%Internet-based Business 5 0.1% 0.0%Self/Spouse/Partner 6 0.1% 0.1%Fraternal Organization 5 0.1% 0.1%Other Member Org 5 0.1% 0.1%Investment/Management Company 72 0.8% 0.7%Total 9,588 100.0% 100.0%Source: 2013 SCF.
Source Freq. PercentWeighted Percent
Call around 3,881 12.9% 13.2%Magazines/Newspapers/Books 4,086 13.6% 11.0%Material in the mail 1,809 6.0% 6.4%Television/Radio 2,402 8.0% 8.0%Internet/Online services 11,269 37.5% 35.3%Advertisements 1,783 5.9% 6.2%Friends/Relatives 11,565 38.5% 40.1%Lawyers 1,574 5.2% 3.8%Accountants 4,086 13.6% 10.2%Bankers 10,082 33.5% 33.0%Brokers 3,829 12.7% 8.6%Financial planners 9,034 30.0% 25.5%Self 2,438 8.1% 6.8%Source: 2013 SCF.Note: Percentages do not add to 100% because multiple answers were allowed.

I.2. Survey of Consumer Finances 9
Table 9 reports summary statistics on various demographic characteristics in the 2013 SCF.
Table 9. Demographic Characteristics
Freq. PercentWeighted Percent
Marital statusMarried 16,430 54.6% 48.1%Separated 1,005 3.3% 3.5%Divorced 4,602 15.3% 16.6%Widowed 2,230 7.4% 9.6%Never married 5,808 19.3% 22.1%
EducationHigh school or less 2,720 9.0% 11.0%High school or equivalency 8,006 26.6% 31.3%Some college 5,139 17.1% 18.9%Associate's degree 1,847 6.1% 6.6%Bachelor's degree 6,730 22.4% 19.7%Master's degree 3,631 12.1% 9.3%Professional degree/Doctorate 2,002 6.7% 3.2%
EthnicityHispanic/Latino origin 3,562 11.8% 13.3%
RaceWhite 22,123 73.6% 70.1%Black 3,731 12.4% 14.6%Hispanic 2,781 9.2% 10.6%Other 1,440 4.8% 4.7%
SexMale 22,960 76.3% 71.6%Female 7,115 23.7% 28.4%
Age18-25 1,440 4.8% 6.2%26-35 4,140 13.8% 16.2%36-45 5,325 17.7% 17.5%46-55 6,710 22.3% 19.7%56-65 6,295 20.9% 18.6%66-75 3,795 12.6% 12.2%76-85 1,805 6.0% 7.5%>85 565 1.9% 2.3%
Source: 2013 SCF.

I.3. Survey of Income and Program Participation 10
I.3. SURVEY OF INCOME AND PROGRAM PARTICIPATION
Website: http://www.census.gov/sipp
Overview
Collected by the U.S. Census Bureau, the SIPP collects data on income, labor-force status, and welfare program participation and eligibility, along with general demographic characteristics. This facilitates measuring the effectiveness of existing federal, state, and local programs; estimating future costs and coverage for government programs, such as food stamps; and providing improved statistics on the distribution of income and on measures of economic well-being (U.S. Census Bureau, 2009). Low-income households are oversampled in the SIPP. All of this report’s SIPP-related facts, statements, and tabulations are current as of September 30, 2011.
Survey Design and Weights
The survey is a continuous series of national panels with a target sample size of 37,000 households. Each panel lasts from 2½ years to 4 years, during which respondents are interviewed approximately every four months. The most recent three panels started interviews in 2001, 2004, and 2008; the 2008 panel is currently active. The SIPP is a multi-stage stratified sample of the U.S. civilian non-institutionalized population. It attempts to interview every household member age 15 or older. Core questions address labor force participation, program participation and income designed to measure a household’s economic situation. These questions are repeated in every wave to monitor the distribution of cash and assets within the United States. Both telephone interviews and personal visits are used to complete the interview. The SIPP also contains a series of topical modules with questions on a variety of targeted topics, including on Income & Retirement Accounts, Retirement & Pension Plans, and Assets & Liabilities. These questions are assigned to particular interview waves of the survey. In addition to retirement topics, topical modules cover personal history, child care, program eligibility, child support, utilization and cost of health care, disability, school enrollment, taxes, and annual income (U.S. Census Bureau, 2009; Westat et al., 2001). Table 10 lists modules of particular interest, along with the number of respondents, in the 2001, 2004, and 2008 SIPP panels. Note that questions on various types of assets tend to be administered several times to every panel, at three-wave (one-year) intervals. Under suitable assumptions, this may permit calculations of rates of return on account assets.

I.3. Survey of Income and Program Participation 11
Table 10. Topical Modules Related to Retirement and Assets
Panel Wave Interview
period Module Respondents 2001 3 Oct 2001-Jan 2002 Assets, Liabilities 71,280
4 Feb-May 2002 Income, Retirement Accts 70,595 6 Oct 2002-Jan 2003 Assets, Liabilities 69,143 7 Feb-May 2003 Income, Retirement Accts 68,694 7 Feb-May 2003 Retirement, Pension Plans 68,694 9 Oct 2003-Jan 2004 Assets, Liabilities 65,901
2004 3 Oct 2004-Jan 2005 Assets, Liabilities 99,978 4 Feb-May 2005 Income, Retirement Accts 98,098 6 Oct 2005-Jan 2006 Assets, Liabilities 94,617 7 Feb-May 2006 Income, Retirement Accts 92,802 7 Feb-May 2006 Retirement, Pension Plans 92,802
2008 3 May-Aug 2009 Retirement, Pension Plans 95,252 4 Sep-Dec 2009 Assets, Liabilities 91,219 5 Jan-Apr 2010 Income, Retirement Accts 90,477 7 Sep-Dec 2010 Assets, Liabilities TBD* 8 Jan-Apr 2011 Income, Retirement Accts TBD* 10 Sep-Dec 2011 Assets, Liabilities TBD* 11 Jan-Apr 2012 Retirement, Pension Plans TBD*
*To be determined. Data are expected to be released approximately nine months after the end of the interview period.
The SIPP survey wave files contain an analysis weight variable. For details on the construction of weights, see Westat et al. (2001).
Topical Modules
Annual Income and Retirement Accounts
The Annual Income and Retirement Accounts module collects information on IRA/Keogh accounts and DC plans, among other accounts. For IRA/Keogh accounts, the survey asks about contributions and withdrawals made during the prior year (as applied to the tax return which is due around the time of the interview). It also asks about account earnings. For example, “Including all IRA accounts in [the respondent’s] own name, how much did [his] IRA accounts earn during 2009?” Finally, it asks which types of assets the account holds, distinguishing the following types:
(1) Certificates of deposit or other savings certificates (2) Money market funds (3) U.S. Government securities (4) Municipal or corporate bonds (5) U.S. Savings Bonds (6) Stocks or mutual fund shares (7) Other assets

I.3. Survey of Income and Program Participation 12
The respondent may report multiple asset types but is not asked about the relative size of each type in the account. Similar questions are asked about the respondent’s DC plan(s), where the following asset types are distinguished:
(1) Money market funds (2) U.S. Government securities (3) Municipal or corporate bonds (4) Stocks or mutual fund shares (5) Other assets
Retirement and Pension Plan Coverage
Generally, the Retirement and Pension Plan Coverage module obtains information about the respondent’s employer’s pension-plan coverage and the receipt of retirement benefits from any former job. Additionally, the module includes questions about pension coverage, vesting, reasons for participation or lack thereof, amount of money in account and how invested; and it includes questions on the pension payments, expected pension payments, loans against retirement and welfare assistance. The module collects information on plan balances and their asset composition, distinguishing:
(1) Company stock (2) Stock funds (3) Corporate bonds or bond funds (4) Long term interest bearing securities (5) Diversified stock and bond funds (6) Government securities (7) Money market funds (8) Other investments
There is no question on relative allocations of the account balance, although the respondent is asked a follow-up question about the asset type in which the largest share of current contributions are being invested. Respondents are questioned about as many as three DC plans.
Assets and Liabilities
The Assets and Liabilities module also asks about IRA/Keogh accounts and DC plan accounts, but its questions are less detailed than those in the above-discussed modules. Total balances and asset allocations are asked for all IRAs combined, any Keogh accounts, and all DC plans combined. No questions are asked about contributions or withdrawals from retirement accounts. This module proceeds to ask more detailed questions about the value of various types of after-tax assets, including checking accounts, savings accounts, money market accounts, certificates of deposit, municipal or corporate bonds, U.S. government securities, and stocks or mutual funds (and debt or margin accounts). There are no questions on the institutions which hold the reported assets.

I.3. Survey of Income and Program Participation 13
Other Modules
Table 11 lists all topical modules in the 2008 panel.
Table 11. Topical Modules in the 2008 Panel
Wave Topical modules Available 1 Recipiency History YES Employment History Tax Rebates 2 Work Disability History YES Education and Training History Marital History Migration History Fertility History Household Relationships Tax Rebates 3 Welfare Reform Retirement and Pension Plan Coverage 4 Assets and Liabilities YES Real Estate, Dependent Care, and Vehicles Int Accts, Stocks, Mortg, Val of Bus, Rental, Other Medical Expenses/Utilization of Health Care - Adults and Children Poverty (Work-related Expenses/Child Support Paid) Child Well-Being Economic Stimulus Questions 5 Annual Income and Retirement Accounts YES Taxes Child Care Work Schedule 6 Adult Well-being YES Child Support Agreements Support for Non-household Members Functional Limitations and Disability - Adults Functional Limitations and Disability - Children Employer-Provided Health Benefits 7 Assets and Liabilities Sep 2011 Real Estate, Dependent Care, and Vehicles Int Accts, Stocks, Mortgage, Val of Bus, Rental, Other Medical Expenses/Utilization of Health Care - Adults and Children Poverty (Worked-related Expenses/Child Support Paid) 8 Annual Income and Retirement Accounts Jan 2012 Taxes Child Care Work Schedule 9 Informal Care-giving May 2012 Adult Well-being
10 Assets and Liabilities Sep 2012 Real Estate, Dependent Care, and Vehicles Int Accts, Stocks, Mortg, Val of Bus, Rental, Other Medical Expenses/Utilization of Health Care - Adults and Children Poverty (Worked-related Expenses/Child Support Paid)

I.3. Survey of Income and Program Participation 14
Wave Topical modules Available Child Well-Being
11 Retirement and Pension Plan Coverage Jan 2013 Source: U.S. Census Bureau, Demographics Survey Division, SIPP branch 2009
Summary Statistics
Tables 12 and 13 tabulate the asset types that were reported for IRAs and DC plans, respectively, in Wave 5 of the 2008 Panel. As explained above respondents may report multiple asset types, but they are not asked for the relative distribution. The figures in the tables therefore do not sum to 100%.
Table 12. Asset Types Reported in IRAs (2008 Panel, Wave 5)
Table 13. Asset Types Reported in DC Plans (2008 Panel, Wave 5)
Asset typePercent of
respondentsWeighted percent
Certificates of deposit 14.6% 14.5%Money market 18.4% 18.6%U.S. gov't securities 5.8% 6.0%Municipal/corporate bonds 9.9% 9.9%U.S Savings Bonds 5.5% 5.7%Stocks, mutual funds 58.2% 58.2%Other 7.8% 7.8%Note: Percentages do not sum to 100% because multiple asset types could be reported.
Asset typePercent of
respondentsWeighted percent
Money market 19.5% 19.8%U.S. gov't securities 9.2% 9.2%Municipal/corporate bonds 13.1% 13.3%Stocks, mutual funds 59.2% 59.4%Other 9.1% 9.0%Note: Percentages do not sum to 100% because multiple asset types could be reported.

I.3. Survey of Income and Program Participation 15
Table 14 tabulates demographic characteristics in Wave 3 of the 2008 panel.
Table 14. Demographic Characteristics (2008 Panel, Wave 3)
Freq. PercentWeighted percent
Marital StatusMarried 39,623 41.6% 41.5%Widowed 4,767 5.0% 4.6%Divorced 7,830 8.2% 8.1%Separated 1,452 1.5% 1.5%Never married 41,580 43.7% 44.3%
EducationN/A 19,884 20.9% 20.4%High school or less 11,456 12.0% 11.6%High school graduate 21,252 22.3% 21.9%Some college 10,589 11.1% 11.6%Trade/vocational school 7,946 8.3% 8.2%Associate's degree 5,734 6.0% 6.2%Bachelor's degree 11,895 12.5% 13.0%Master's degree 4,742 5.0% 5.1%Professional (MD,DDS,JD) 995 1.0% 1.1%Doctorate 759 0.8% 0.8%
EthinicityHispanic origin 12,492 13.1% 15.8%
RaceWhite 75,360 79.1% 79.8%Black 11,937 12.5% 12.6%Asian 3,942 4.1% 3.9%Other 4,013 4.2% 3.7%
SexMale 45,791 48.1% 49.0%Female 49,461 51.9% 51.0%
Age<18 24,120 25.3% 24.6%18-25 8,457 8.9% 9.6%25-35 11,629 12.2% 13.4%35-45 12,444 13.1% 13.6%45-55 14,105 14.8% 14.7%55-65 11,513 12.1% 11.5%65-75 7,059 7.4% 6.8%75-85 5,786 6.1% 5.7%>85 139 0.1% 0.2%

I.4. Other Data Sources 16
I.4. OTHER DATA SOURCES
This section’s facts, statements, and tabulations are current as of September 30, 2011.
Health and Retirement Study
Website: http://hrsonline.isr.umich.edu Collected by the University of Michigan, the HRS is a panel survey of individuals over age 50 and their spouses, regardless of age. It attempts to re-interview respondents every other year. The survey started in 1992. Its sample was augmented in 1998, 2004, and 2010 with individuals from younger cohorts who had become age-eligible. The sample size in the 2010 wave, which is currently available as an early release file, was 15,372 respondents in 10,754 households. In total, about 31,000 respondents have been interviewed. The HRS asks questions about employment, assets and income, and expectations and risk tolerance, along with a wide range of such other subjects as demographics, health, health care utilization, cognition, marital status, and housing. The survey has been linked to administrative records on Social Security and Medicare. Respondents who are employed are asked about their participation in a DC plan, their contributions, their account balance, and their asset allocation (percentage in stocks, percentage in employer stock). This information is collected on up to three DC plans for the respondent’s current job. Similar information is collected on DC plans sponsored by prior employers. The HRS requests that respondents provide a copy of the Summary Plan Description. Respondents are also asked about account balance and asset allocation (percentage in stocks or mutual funds) of up to three IRAs or Keogh accounts. In addition, they are asked about contributions to and withdrawals from these accounts since the previous survey interview. Finally, the HRS asks about after-tax financial instruments. It collects information on the aggregate account balance of and dividend or interest income from (1) stocks or stock mutual funds, (2) bonds or bond mutual funds, (3) checking accounts, savings accounts, or money market accounts, and (4) certificates of deposit, government savings bonds, or Treasury Bills. Given the limited age range of HRS respondents, the HRS may not be well-suited to derive statistics on asset holdings by the U.S. population as a whole.
Panel Study of Income Dynamics
Website: http://psidonline.isr.umich.edu

I.4. Other Data Sources 17
Collected by the University of Michigan, the PSID is a panel study which began in 1968. It has been collected annually through 1997 and every other year thereafter. The PSID attempts to re-interview its respondents and also interview former household members who split off to form their own household. The 1968 sample of 5,000 households has grown to about 9,000 households in recent waves. The PSID collects information on a wide range of topics. The core questionnaires ask about demographic information, family structure, health, employment, and income. Since 1999, questions are also asked about aggregate account balances of DC plans, “private annuities and IRAs”, and broad categories of after-tax investments. For DC plans, limited information is asked about asset allocation: mostly stocks, mostly in bonds or annuities, or split. Similarly, for private annuities and IRAs, limited information is asked about asset allocation: mostly stocks, mostly interest-earning, or split. Respondents are also asked about regular contributions to their DC plans, possibly as a percentage of pay.
Employee Benefit Research Institute Data
Website: http://www.ebri.org EBRI is an independent, non-profit and non-partisan organization that focuses on employee benefit data and research. It has several sources of data including the Retirement Confidence Survey (RCS), the EBRI IRA Database and a 401(k) database. EBRI, however, does not allow third-party access to its proprietary data. The proprietary data consist of:
1. RCS: a. Conducted annually in conjunction with American Savings Education
Council (ASEC) and Matthew Greenwald & Associates b. Surveys 1,000 people on basic retirement savings information and
expectations 2. EBRI IRA Database:
a. Collects data from IRA plan administrators b. Contains 14 million accounts with $732 billion in assets c. Does not currently track changes over time (i.e., withdrawals,
contributions and rollovers), but expansion is currently underway 3. EBRI/ICI 401(k) Database
a. Conducted with Investment Company Institute (ICI) b. Contains 50,000 plans, 20 million participants and $1.2 trillion in
assets c. Annual updates track balances, asset allocation and loan behavior
The Center for Research in Security Prices Data
Website: http://www.crsp.com CRSP was founded in 1960 as part of the University of Chicago’s Booth School of business, specializing in securities prices. CRSP maintains a number of databases including: a database of daily stock prices, dividends and rates of return since 1926; the CRSP/Ziman Real Estate Data Series created with the Ziman Center of the

I.4. Other Data Sources 18
Anderson School of Business, University of California, Los Angeles; and a database of active and inactive mutual funds created by Mark Carhart of Goldman Sachs Asset Management. CRSP data is available for purchase by subscription only. The CRSP Survivor-Bias-Free US Mutual Fund Database attempts to provide complete data on both active and inactive mutual funds. The CRSP website states that “the survivor-bias-free nature of the database ensures accurate performance benchmarks and valid analysis.” The database contains the following:
• Data on 44,888 funds o 17,565 inactive o 27,323 active
• Fund Types o Equity o Taxable and municipal bonds o International o Money market
• Data beginning in 1962 including: o History of each mutual fund’s name o Investment style o Fee structure o Holdings o Asset allocation o Monthly total returns o Monthly total net assets (TNA) o Monthly/daily net asset values o (DNAV/NAV) o Distributions o Dividends o Schedules of rear and front load fees o Asset class codes o Management company contact information o Identifying information
• 2 year contracts at $14,080 per annum will allow five users access to all data updated quarterly
Financial Research Corporation Data
Website: http://www.frcnet.com FRC compiles data for investment professionals on financial industry trends and financial product performance. The data are at the mutual-fund/variable-annuity level, and they are further broken down by advisor/sponsor and sub-advisor. Data on fees, breakpoints, asset amounts and classes, distribution channel, investment objective, and fund rankings are presented. Manager changes as found in SEC filings are also tracked. Most of these data are measured in bi-annual snapshots.

I.4. Other Data Sources 19
E-filings of SEC Form N-SAR
Website: http://www.sec.gov/about/forms/secforms.htm On Form N-SAR, registered investment management companies report the operations of their combined share classes on a semi-annual basis. Variables measured include amount of share sales, portfolio turnover rate, front-loads paid by consumers, total inflows subject to loads, and total front- and back-loads paid by consumers. These loads are disaggregated between unaffiliated brokers and captive brokers.
FINRA BrokerCheck Reports
Website: http://www.finra.org/Investors/ToolsCalculators/BrokerCheck/ FINRA’s BrokerCheck provides investors with information about FINRA registered brokers and brokerage firms. The database contains information from the securities industry’s registration and licensing process on 1.3 million current and former brokers and 17,000 brokerage firms. BrokerCheck derives its data from the Central Registration Depository (CRD) which contains required broker licensing forms and regulator-reported information. Brokers and brokerage firms are required to update the CRD within 30 days of an event. Below is a summary of the information contained in BrokerCheck reports.
1. FINRA registered brokerage firm:
• Report summary with brief overview of the firm and its background • Firm profile that describes where and when the firm was founded and lists
the people and organizations that own controlling shares or influence daily operations
• Firm history detailing mergers, acquisitions and name changes • Firm operations section that describes the firm’s type of business as well
as active licenses and registrations • Disclosure section listing active and resolved incidents including arbitration
awards, disciplinary events and financial matters that are on the firm’s record
2. Broker registered within the last 10 years • Report summary with overview of broker’s credentials • Broker qualifications section describing broker’s licenses, registrations and
completed industry exams • Registration and employment section containing two types of information
o List of the broker’s current or previous FINRA registered employers o Broker’s full ten year employment history in and outside of the
securities industry as reported by the broker on his or her Form U4 (submitted by securities firms to states and self-regulatory organizations when registering brokers)
• Disclosure section that includes customer disputes, disciplinary events and financial matters that have been reported by regulators, involved firms and the broker
3. Broker with registration expired more than 10 years ago: • Report summary, broker qualifications and registration and employment
sections are the same as a broker registered within the last ten years

I.4. Other Data Sources 20
• Disclosure section only includes certain civil, criminal, regulatory or judicial complaints. To be included, the broker must have been: o Subject of a final regulatory action, o Convicted or pled guilty to certain crimes, o Subject to investment related civil injunction or found by a civil court
to have violated investment related regulations, or o Involved in civil litigation or arbitration where the broker was accused
of a sales practice violation and judgment went against the broker.
SEC Form ADV
Website: http://www.adviserinfo.sec.gov/ Investment advisors file a Form ADV to register with the U.S. Securities and Exchange Commission (SEC) and state securities authorities. This form includes information about the investment advisor’s business, ownership, clients, employees, business practices, affiliations, and disciplinary actions against the advisor or any of its employees. Beginning in 2011, a second portion of the form requires investment advisors to prepare non-technical brochures with information on the types of advisory services offered, the advisor’s fee schedule, disciplinary information, conflicts of interest, and background information on the management and key advisory personnel. Some potential areas of interest on the Form ADV are included below.
1. Item 5: Information About Your Advisory Business • Approximate number of clients • Approximate percentage of clients by client type (i.e., individual, banking
institution, charitable organization, etc. IRAs and DC plans are combined under the “individual” category)
• Approximate percentage of assets by client type • Compensation arrangement type, total assets under management and
number of accounts • Additional information regarding the type of services and activities
engaged in by the investment advisor 2. Item 8: Participation or Interest in Client Transactions
• Attempts to identify potential conflicts of interest by asking questions regarding proprietary and sales interest, and investment or brokerage discretion in client transactions
Some potential questions of interest are included below as they appear on the Form ADV. All of the questions are answered in check box format where Yes or No is the only valid response except when noted.
A. You are compensated for your investment advisory services by (check all that apply):
1. A percentage of assets under your management 2. Hourly Charges 3. Subscription fees (for a newsletter or periodical) 4. Fixed fees (other than subscription fees) 5. Commissions 6. Performance-based fees

I.4. Other Data Sources 21
7. Other (specify): __________________________________ B. Do you or any related person:
1. Buy securities for yourself from advisory clients, or sell securities you own to advisory clients (principal transactions)?
2. Buy or sell for yourself securities (other than shares of mutual funds) that you also recommend to advisory clients?
3. Recommend securities (or other investment products) to advisory clients in which you or any related person has some other proprietary (ownership) interest (other than those mentioned in Items 8.A.91) or (2))?
4. As a broker-dealer or registered representative of a broker-dealer, execute securities trades for brokerage customers in which advisory client securities are sold to or bought from the brokerage customer (agency cross transactions)?
5. Recommend purchase of securities to advisory clients for which you or any related person serves as underwriter, general or managing partner, or purchaser representative?
6. Recommend purchase or sale of securities to advisory clients for which you or any related person has any other sales interest (other than the receipt of sales commissions as a broker or registered representative of a broker-dealer)?
C. Do you or any related person have discretionary authority to determine the: 1. Securities to be bought or sold for a client’s account? 2. Amount of securities to be bought or sold for a client’s account? 3. Broker or dealer to be used for a purchase or sale of securities for a
client’s account? 4. Commission rates to be paid to a broker or dealer for a client’s
securities transactions? D. If you answered “yes” to C.(3) above, are any of the brokers or dealers
related persons? E. Do you or any related person recommend brokers or dealers to clients? F. If you answered “yes” to E above, are any of the brokers or dealers related
persons? G.
1. Do you or any related person receive research or other products or services other than execution from a broker-dealer or third party (“soft dollar benefits”) in connection with client securities transactions?
2. If you answered “yes” to G.(1) above, are all the “soft dollar” benefits you or any related persons receive eligible “research or brokerage services” under section 28(e) of the Securities Exchange Act of 1934?
H. Do you or any related person, directly or indirectly, compensate any person for client referrals?
I. Do you or any related person, directly or indirectly, receive compensation from any person for client referrals?
Form ADV data are available in spreadsheet format from the SEC. The Investment Advisor Information Report file contains approximately 11,700 investment advisors as of October 3, 2011.

I.4. Other Data Sources 22
State Financial Regulators
Website: http://www.nasaa.org/about-us/contact-us/contact-your-regulator/ We did not locate any data which would plausibly assist this Task Order.

I.5. Bibliography 23
I.5. BIBLIOGRAPHY
Bricker, Jesse, Brian Bucks, Arthur Kennickell, Traci Mach, and Kevin Moore (2011). “Surveying the Aftermath of the Storm: Changes in Family Finances from 2007 to 2009.” Board of Governors of the Federal Reserve System. Retrieved from http://www.federalreserve.gov/pubs/feds/2011/201117/201117pap.pdf.
Kennickell, Arthur B. (1998). “Multiple Imputation in the Survey of Consumer Finances.” Board of Governors of the Federal Reserve System. Retrieved from http://www.federalreserve.gov/pubs/oss/oss2/papers/impute98.pdf.
Kennickell, Arthur B. (1999). “Revisions to the SCF Weighting Methodology: Accounting for Race/Ethnicity and Homeownership.” Board of Governors of the Federal Reserve System. Retrieved from http://www.federalreserve.gov/pubs/oss/oss2/papers/weight.revision.pdf.
Kennickell, Arthur B. (2000). “Revisions to the Variance Estimation Procedure for the SCF.” Board of Governors of the Federal Reserve System. Retrieved from http://www.federalreserve.gov/pubs/oss/oss2/papers/variance.pdf.
Kennickell, Arthur B. and R. Louise Woodburn (1997). “Consistent Weight Design for the 1989, 1992 and 1995 SCFs, and the Distribution of Wealth.” Board of Governors of the Federal Reserve System. Retrieved from http://www.federalreserve.gov/pubs/oss/oss2/papers/wgt95.pdf.
SCF Codebook (2001). “Codebook for 2001 Survey of Consumer Finances.” Board of Governors of the Federal Reserve System, Washington, DC. Retrieved from http://www.federalreserve.gov/econresdata/scf/files/codebk2001.txt.
SCF Codebook (2004). “Codebook for 2004 Survey of Consumer Finances.” Board of Governors of the Federal Reserve System, Washington, DC. Retrieved from http://www.federalreserve.gov/pubs/oss/oss2/2004/codebk2004.txt.
SCF Codebook (2007). “Codebook for 2007 Survey of Consumer Finances.” Board of Governors of the Federal Reserve System, Washington, DC. Retrieved from http://www.federalreserve.gov/econresdata/scf/files/codebk2007.txt.
SCF Codebook (2010). “Codebook for 2010 Survey of Consumer Finances.” Board of Governors of the Federal Reserve System, Washington, DC. Retrieved from http://www.federalreserve.gov/econresdata/scf/files/codebk2010.txt.
SCF Codebook (2013). “Codebook for 2013 Survey of Consumer Finances.” Board of Governors of the Federal Reserve System, Washington, DC. Retrieved from http://www.federalreserve.gov/econresdata/scf/files/codebk2013.txt.
U.S. Census Bureau, Demographics Survey Division, Survey of Income and Program Participation branch (2009). “Overview of the Survey of Income and Program Participation (SIPP).” Retrieved from http://www.census.gov/sipp/index.html.
Westat and Mathematica Policy Research Inc. (2001). “Survey of Income and Program Participation Users’ Guide. Third Edition.” Washington, DC. Retrieved from http://www.census.gov/sipp/usrguide/sipp2001.pdf.

PART II. STATISTICAL ANALYSIS

II.1. Introduction 25
II.1. INTRODUCTION
Part II of this report compiles the analyses and statistical tabulations completed for the “SCF Statistical Studies and Literature Analysis” task order. This includes tabulations and analyses relating to the differences among owners of individual retirement accounts (IRAs), 401(k) and other defined contribution (DC) plans, and after-tax investment accounts. The IRA category includes:
• Roth IRAs, • IRAs rolled over from pension accounts, • Regular or other IRAs, and • Keogh Accounts.
The DC category includes:
• 401(k), • 403(b), • 457, • Thrift/Savings, • Supplemental Retirement Annuities (SRA), • Simplified Employee Pensions (SEP), • Simplified Incentive Match Plans for Employers (SIMPLE), • Money Purchase Plans, • Other current job plans from which loans or withdrawals can be made, and • Accounts from past jobs from which the family expects to receive the
account balance in the future or is currently drawing from the account. (Note: The DC category excludes cash balance plans.3
)
The taxable asset category includes: 4
• Mutual funds,
• Bonds (other than savings bonds), • Publicly traded stock, • Cash or call-money accounts held at brokerages, and • Trusts that can be cashed in.
As requested by staff of the U.S. Department of Labor’s Employee Benefits Security Administration (EBSA), all data in this document are sourced from the 2013 Survey of Consumer Finances (SCF) and weighted by household weights unless otherwise stated. Note that households with IRAs, DC plans, and taxable accounts are not mutually exclusive classifications of households.
3 The account type of plans from prior jobs is unknown. Some cash balance plans from prior jobs may be included in the analysis. Also, cash balance plans on the current job from which the respondent can borrow or withdraw may be included. 4 The taxable asset category does not include savings accounts, certificates of deposit (CDs), cashable life insurance, cashable annuities or savings bonds. However, the document does analyze these after-tax investment types individually when noted.

II.2. Tabulations and Analyses 26
II.2. TABULATIONS AND ANALYSES
Table 15. Categories of Households by Ownership and Value of Account
Number of households (millions) Percent
Total value of accounts ($ billions) Percent
Not mutually exclusive:IRA 34.4 28.1% 19,557.5 80.2%DC 43.2 35.2% 12,897.7 52.9%Taxable 24.3 19.9% 19,910.8 81.7%
Mutually exclusive:None 56.5 46.1% 0.0 0.0%IRA only 10.9 8.9% 1,280.3 5.3%DC only 22.3 18.2% 1,358.6 5.6%Taxable only 4.8 3.9% 1,507.8 6.2%IRA & DC 8.5 7.0% 1,831.9 7.5%IRA & Taxable 7.2 5.9% 8,695.8 35.7%DC & Taxable 4.5 3.7% 1,957.7 8.0%IRA, DC & Taxable 7.8 6.4% 7,749.5 31.8%Total 122.5 100.0% 24,381.6 100.0%
Source: SCF 2013.
AssetsHouseholds
Note: Weighted by household weights. Not-mutually-exclusive asset figures include assets from any of the three types. For example, 28.1% of households own an IRA. Their total assets holdings, including DC plan and taxable account balances, sum to $19.6 trillion, 80.2% of all assets.

II.2. Tabulations and Analyses 27
Table 16 replicates Table 15, but uses an expanded definition of taxable assets that we refer to as “retail” assets. In addition to the categories of assets that were included in the taxable category (publicly traded stocks, mutual funds, bonds, trusts, and brokerage call (cash) accounts) the retail asset category also includes savings accounts, CDs, cashable life insurance, cashable annuities, and savings bonds.
Table 16. Categories of Households by Ownership and Value of Accounts (including all retail investments and savings)
Number of households (millions) Percent
Total value of accounts ($ billions) Percent
Not mutually exclusive:IRA 34.4 28.1% 22,428.5 78.6%DC 43.2 35.2% 14,734.7 51.6%Retail* 83.6 68.2% 27,846.1 97.5%
Mutually exclusive:None 29.2 23.8% 0.0 0.0%IRA Only 2.4 1.9% 207.0 0.7%DC Only 6.2 5.0% 270.2 0.9%Retail Only 32.1 26.2% 2,274.3 8.0%IRA & DC Only 1.2 1.0% 227.2 0.8%IRA & Retail Only 15.7 12.8% 11,334.5 39.7%DC & Retail Only 20.6 16.8% 3,577.6 12.5%IRA, DC & Retail 15.2 12.4% 10,659.7 37.3%Total 122.5 100.0% 28,550.5 100.0%
Source: SCF 2013.
Note: Weighted by household weights. Not-mutually-exclusive asset figures include assets from any of the three types. For example, 28.1% of households own an IRA. Their total assets holdings, including DC plan and retail account balances, sum to $22.4 trillion, 78.6% of all assets.
*Retail financial assets include publicly traded stocks, mutual funds, bonds, trusts, brokerage call (cash) accounts, savings accounts, CDs, cashable life insurance, cashable annuities, and savings bonds.
Households Assets

II.2. Tabulations and Analyses 28
Table 17. Taxable Asset Holders and Holdings by Asset Type
Asset type
Households holding assets
(millions)Percent of all households
Total balance ($ billions)
Percent of taxable assets
Stock 16.8 13.8% 4,792.3 38.7%Mutual fund 10.0 8.2% 4,548.7 36.7%Bond 1.7 1.4% 959.3 7.7%Trust 1.8 1.5% 1,687.6 13.6%Brokerage call 2.4 1.9% 409.8 3.3%Total 12,397.6 100.0%Source: SCF 2013.Note: Weighted by household weights. Holders of taxable asset types are not mutually exclusive. Trust holdings include cash-out eligible accounts only.

II.2. Tabulations and Analyses 29
Table 18. Income Distribution for All Households and for Those with IRAs, DC Plans, or Taxable Accounts
Annual household income
Number (millions) Percent
Number (millions) Percent
Number (millions) Percent
Number (millions) Percent
Under $10,000 3.6 2.9% 0.1 0.3% 0.1 0.2% 0.1 0.6%$10,000 - $20,000 14.9 12.1% 0.5 1.4% 0.6 1.3% 0.6 2.4%$20,000 - $50,000 41.9 34.2% 6.7 19.4% 8.6 20.0% 4.4 18.0%$50,000 - $100,000 35.3 28.8% 11.4 33.2% 16.5 38.3% 6.9 28.5%$100,000 - $200,000 19.2 15.7% 10.1 29.3% 12.3 28.6% 7.2 29.5%$200,000 - $500,000 5.9 4.8% 4.2 12.3% 3.7 8.7% 3.5 14.3%$500,000 and above 1.9 1.6% 1.4 4.1% 1.3 3.0% 1.6 6.6%
Total 122.5 100.0% 34.4 100.0% 43.2 100.0% 24.3 100.0%Source: 2013 SCF.Note: Weighted by household weights. Income includes withdrawals from DC plans and IRAs.
All householdsHouseholds with
IRAsHouseholds with
DC plansHouseholds with taxable accounts

II.2. Tabulations and Analyses 30
Figure 1. Income Distribution for All Households and for Those with IRAs, DC Plans, or Taxable Accounts
0%
5%
10%
15%
20%
25%
30%
35%
40%
45%
Under $10,000
$10,000 -$20,000
$20,000 -$50,000
$50,000 -$100,000
$100,000 -$200,000
$200,000 -$500,000
$500,000 and above
All households Households with IRAs
Households with DC plans Households with taxable accounts

II.2. Tabulations and Analyses 31
Table 19. Income Distribution of Asset Holdings for Households with IRAs, DC Plans, or Taxable Accounts
Figure 2. Household Income Distribution of Asset Holdings for Households with IRAs, DC Plans, or Taxable Accounts
Annual household income
Value of accounts ($ billions) Percent
Value of accounts ($ billions) Percent
Value of accounts ($ billions) Percent
Under $10,000 4.1 0.1% 0.3 0.0% 19.4 0.2%$10,000 - $20,000 26.3 0.4% 9.1 0.2% 71.4 0.6%$20,000 - $50,000 458.2 6.9% 191.3 3.6% 464.8 3.7%$50,000 - $100,000 1,390.4 20.8% 1,083.5 20.4% 1,132.1 9.1%$100,000 - $200,000 1,857.8 27.8% 1,924.3 36.3% 1,888.5 15.2%$200,000 - $500,000 1,712.3 25.6% 1,124.0 21.2% 3,178.2 25.6%$500,000 and above 1,226.9 18.4% 975.6 18.4% 5,643.4 45.5%
Total 6,676.0 100.0% 5,308.0 100.0% 12,397.6 100.0%Source: 2013 SCF.Note: Weighted by household weights. Income includes withdrawals from DC plans and IRAs.
Households with IRAsHouseholds with
DC plansHouseholds with taxable accounts
0%
5%
10%
15%
20%
25%
30%
35%
40%
45%
50%
Under $10,000
$10,000 -$20,000
$20,000 -$50,000
$50,000 -$100,000
$100,000 -$200,000
$200,000 -$500,000
$500,000 and above
Households with IRAs With DC plans With taxable accounts

II.2. Tabulations and Analyses 32
Table 20. Income Summary Statistics for Households with IRAs, DC Plans, or Taxable Accounts ($ thousands)
Table 21. Account-Balance Summary Statistics for IRAs, DC Plans, and Taxable Accounts ($ thousands)
Table 22. Stock-Fraction Summary Statistics for IRAs, DC Plans, and Taxable Accounts
Account type p10 p25 Median p75 p90 Mean
Household- IRA 35.5 54.7 93.3 153.2 269.9 153.0weighted DC 34.5 52.8 85.2 133.9 213.1 129.8
distribution Taxable 31.5 55.8 100.4 181.6 329.7 185.0All HHs 15.2 27.4 50.7 91.3 154.9 85.7
Asset- IRA 54.8 90.3 175.5 355.1 760.9weighted DC 67.0 101.5 157.3 322.6 759.9
distribution Taxable 81.2 175.5 396.7 1,148.5 2,800.1Source: 2013 SCF.Note: The n-th percentile is denoted "pn". Income includes withdrawals from DC plans and IRAs. The row labeled "All HHs" reflects all households, including households without any accounts.
Account type p10 p25 Median p75 p90 Mean
Household- IRA 4.0 13.0 50.0 164.0 450.0 193.9weighted DC 1.3 8.0 35.0 125.0 300.0 123.0
distribution Taxable 2.0 9.0 48.0 260.0 975.0 509.2Asset- IRA 100.0 261.0 700.0 1,830.0 4,504.0
weighted DC 72.0 170.0 366.0 833.0 2,419.0distribution Taxable 350.0 1,080.0 3,525.0 15,450.0 50,799.0
Source: 2013 SCF.Note: The n-th percentile is denoted "pn". Accounts are aggregated by households.
Account type p10 p25 Median p75 p90 Mean
Household- IRA 0.0% 15.0% 50.0% 81.6% 100.0% 49.4%weighted DC 0.0% 18.2% 50.0% 80.0% 100.0% 49.3%
distribution Taxable 36.9% 79.9% 100.0% 100.0% 100.0% 84.1%Asset- IRA 5.0% 30.0% 54.5% 80.0% 100.0%
weighted DC 10.0% 30.0% 52.7% 80.0% 100.0%distribution Taxable 23.1% 47.4% 72.1% 95.7% 100.0%
Source: 2013 SCF.Note: The n-th percentile is denoted "pn." Fractions are calculated after aggregating account balances by households.

II.2. Tabulations and Analyses 33
Table 23. Distribution of Demographic Characteristics of the Heads of All Households and of Those with IRAs, DC Plans, or Taxable Accounts
All households With IRAs
With DC plans
With taxable
accountsMarital status
Married 48.1% 64.7% 62.9% 64.7%Separated 3.5% 1.0% 1.8% 0.9%Divorced 16.6% 13.6% 14.7% 10.9%Widowed 9.6% 8.2% 2.6% 8.4%Never married 22.1% 12.5% 18.0% 15.0%
EducationLess than high school 11.0% 1.5% 3.6% 1.9%High school or equivalency 31.3% 19.7% 24.1% 15.5%Some college 18.9% 14.1% 17.7% 13.8%Associate's degree 6.6% 7.1% 8.4% 4.7%Bachelor's degree 19.7% 31.4% 27.4% 34.4%Master's degree 9.3% 18.4% 13.6% 20.4%Professional degree/doctorate 3.2% 7.7% 5.3% 9.3%
EthnicityHispanic/Latino origin 13.3% 4.8% 8.5% 3.8%Non-Hispanic/Latino 86.7% 95.2% 91.5% 96.2%
RaceWhite 70.1% 86.8% 76.8% 88.0%Black 14.6% 5.6% 11.8% 3.9%Hispanic 10.6% 2.7% 6.4% 2.1%Other 4.7% 4.9% 5.0% 6.0%
Age18-25 6.2% 0.7% 3.6% 2.4%26-35 16.2% 10.7% 19.4% 10.7%36-45 17.5% 15.9% 23.2% 15.8%46-55 19.7% 20.2% 26.2% 20.3%56-65 18.6% 25.9% 21.1% 21.9%66-75 12.2% 17.2% 5.0% 16.6%76-85 7.5% 7.6% 1.2% 9.8%>85 2.3% 1.7% 0.3% 2.5%
Source: 2013 SCF.Note: Weighted by household weights.

II.2. Tabulations and Analyses 34
Table 24. Asset-Weighted Distribution of Demographic Characteristics of the Heads of Households with IRAs, DC Plans, or Taxable Accounts
Table 25. Margin Loan Statistics
Households with IRAs
With DC plans
With taxable accounts
Marital statusMarried 81.0% 80.3% 79.6%Separated 0.3% 0.8% 1.2%Divorced 8.3% 10.1% 6.8%Widowed 6.5% 1.6% 6.4%Never married 3.9% 7.2% 6.0%
EducationLess than high school 0.2% 1.1% 1.1%High school or equivalency 8.8% 12.5% 5.2%Some college 9.7% 12.3% 7.6%Associate's degree 2.7% 5.1% 3.2%Bachelor's degree 29.8% 31.6% 31.2%Master's degree 24.9% 20.0% 30.8%Professional degree/doctorate 23.9% 17.4% 20.9%
EthnicityHispanic/Latino origin 2.3% 4.0% 2.3%Non-Hispanic/Latino 97.7% 96.0% 97.7%
RaceWhite 95.4% 88.2% 95.4%Black 1.3% 4.6% 0.7%Hispanic 0.6% 2.2% 0.7%Other 2.7% 5.0% 3.2%
Age18-25 0.0% 0.3% 0.4%26-35 1.4% 5.0% 2.7%36-45 6.3% 17.2% 7.3%46-55 13.5% 32.1% 20.1%56-65 30.4% 34.1% 27.9%66-75 36.7% 9.8% 26.5%76-85 10.0% 1.3% 10.4%>85 1.8% 0.2% 4.9%
Source: 2013 SCF.Note: Weighted by household weights and account balances.
p10 p25 Median p75 p90 MeanLoan balance ($ thousands)
4.0 10.0 25.0 250.0 500.0 192.8
Ratio of loan balance to taxable assets
0.3% 6.9% 14.7% 16.7% 40.0% 16.7%
Source: 2013 SCF.Note: 0.75% of households with taxable assets (0.15% of all households) reported having a margin loan. The n-th percentile is denoted by "pn". Weighted by household weights.

II.2. Tabulations and Analyses 35
Table 26: IRAs, IRA assets, and Median Household Income of IRA Holders, by Type of Institution Holding IRAs5
5 Please see Appendix 2 for detailed information on the method used to calculate the numbers in Table 25.
Fraction of IRAs held in institution
Median income of households with
account at institution
($ thousands)
Fraction of IRA assets
held in institution
Asset-weighted median income of households with
acct at institution ($ thousands)
Commercial bank 46.0% 90.3 45.8% 164.4Savings and loan 2.9% 71.0 1.2% 60.9Credit union 6.3% 71.0 2.2% 72.0Finance or loan company 1.4% 111.6 1.1% 120.7Brokerage 40.1% 106.5 45.6% 182.6Insurance company 1.6% 97.4 0.8% 152.2Investment/mgmt company 0.9% 93.3 2.6% 335.8Other 1.0% 74.1 0.8% 101.5All 100.0% 100.0%Source: 2013 SCF.

II.2. Tabulations and Analyses 36
Table 27. Distribution of Asset Holdings By Household Income
$ billions Percent $ billions Percent $ billions Percent $ billions PercentDC accounts 0.3 0.9 9.1 4.8 191.3 11.6 1,083.5 23.9IRAs 4.1 11.6 26.3 13.9 458.2 27.8 1,390.4 30.6Stocks 16.0 45.5 21.2 11.2 201.4 12.2 533.0 11.7Mutual funds 2.9 8.3 39.0 20.6 147.2 8.9 392.3 8.6Savings accounts 8.6 24.4 23.2 12.3 210.4 12.8 374.3 8.2Bonds 0.2 0.5 1.2 0.7 34.4 2.1 54.9 1.2CDs 0.1 0.4 35.5 18.8 120.4 7.3 138.3 3.0Trusts 0.0 0.0 9.8 5.2 66.7 4.0 96.2 2.1Cashable life 2.0 5.6 11.0 5.8 88.5 5.4 177.0 3.9Cashable annuities 0.7 1.9 9.3 4.9 100.2 6.1 225.2 5.0Broker cash 0.3 0.8 0.0 0.0 15.0 0.9 55.7 1.2Savings Bonds 0.0 0.1 3.5 1.8 15.9 1.0 20.2 0.4Total 35.1 100.0 189.2 100.0 1,649.8 100.0 4,541.0 100.0
$ billions Percent $ billions Percent $ billions Percent $ billions PercentDC accounts 1,924.3 29.6 1,124.0 16.5 975.6 11.0 5,308.0 18.6IRAs 1,857.8 28.6 1,712.3 25.2 1,226.9 13.9 6,676.0 23.4Stocks 842.9 13.0 1,065.6 15.7 2,112.3 23.9 4,792.3 16.8Mutual funds 694.6 10.7 1,220.2 17.9 2,052.3 23.2 4,548.7 15.9Savings accounts 432.1 6.6 426.2 6.3 502.1 5.7 1,977.0 6.9Bonds 68.6 1.1 369.4 5.4 430.5 4.9 959.3 3.4CDs 91.0 1.4 85.0 1.2 141.5 1.6 612.0 2.1Trusts 252.5 3.9 395.2 5.8 867.0 9.8 1,687.6 5.9Cashable life 137.7 2.1 151.7 2.2 260.7 3.0 828.7 2.9Cashable annuities 150.7 2.3 108.0 1.6 78.6 0.9 672.7 2.4Broker cash 29.9 0.5 127.7 1.9 181.2 2.1 409.8 1.4Savings Bonds 19.6 0.3 14.5 0.2 4.9 0.1 78.6 0.3Total 6,501.7 100.0 6,799.9 100.0 8,833.7 100.0 28,550.5 100.0Source: 2013 SCF.
$100,000-$200,000 $200,000-$500,000 $500,000+ Total
Under $10,000 $10,000-$20,000 $20,000-$50,000 $50,000-$100,000
Note: Weighted by household weights. Income includes withdrawals from DC plans and IRAs. Totals differ from those in Table 18 because Table 18 excludes savings accounts, CDs, cashable life insurance, cashable annuities, and savings bonds.

II.2. Tabulations and Analyses 37
37
Figure 3. Household Asset Holdings, Income < $10K
Figure 4. Household Asset Holdings, Income $10K-20K
Figure 5. Household Asset Holdings, Income $20K-50K
Figure 6. Household Asset Holdings, Income $50K-100K
DC accounts
0.9%
IRAs11.6%
Stocks45.5%Mutual funds
8.3%
Savings accounts24.4%
Bonds0.5%
CDs0.4%
Trusts0.0%
Cashable life5.6%
Cashable annuities1.9%
Broker cash0.8%
Savings Bonds0.1%
DC accounts4.8%
IRAs13.9%
Stocks11.2%
Mutual funds20.6%
Savings accounts12.3%
Bonds0.7%
CDs18.8%
Trusts5.2%
Cashable life5.8%
Cashable annuities4.9%
Broker cash0.0%
Savings Bonds1.8%
DC accounts11.6%
IRAs27.8%
Stocks12.2%
Mutual funds8.9%
Savings accounts12.8%
Bonds2.1%
CDs7.3%
Trusts4.0%
Cashable life5.4% Cashable
annuities6.1%
Broker cash0.9%
Savings Bonds1.0%
DC accounts23.9%
IRAs30.6%Stocks
11.7%
Mutual funds8.6%
Savings accounts8.2%
Bonds1.2%
CDs3.0%
Trusts2.1%
Cashable life
3.9%
Cashable annuities5.0%
Broker cash1.2%
Savings Bonds0.4%

II.2. Tabulations and Analyses 38
38
Figure 7. Household Asset Holdings, Income $100K-200K
Figure 8. Household Asset Holdings, Income $200K-500K
Figure 9. Household Asset Holdings, Income $500K+
Figure 10. Household Asset Holdings, Total Population
DC accounts29.6%
IRAs28.6%
Stocks13.0%
Mutual funds10.7%
Savings accounts
6.6%
Bonds1.1%
CDs1.4%
Trusts3.9%
Cashable life2.1%
Cashable annuities2.3%
Broker cash0.5%
Savings Bonds0.3%
DC accounts16.5%
IRAs25.2%
Stocks15.7%
Mutual funds17.9%
Savings accounts6.3%
Bonds5.4%
CDs1.2% Trusts
5.8%
Cashable life2.2%
Cashable annuities1.6%
Broker cash1.9%
Savings Bonds0.2%
DC accounts11.0%
IRAs13.9%
Stocks23.9%
Mutual funds23.2%
Savings accounts5.7%
Bonds4.9%
CDs1.6%
Trusts9.8%
Cashable life3.0%
Cashable annuities0.9%
Broker cash2.1%
Savings Bonds0.1%
DC accounts18.6%
IRAs23.4%
Stocks16.8%
Mutual funds15.9%
Savings accounts6.9%
Bonds3.4%
CDs2.1%
Trusts5.9%
Cashable life2.9%
Cashable annuities2.4%
Broker cash1.4%
Savings Bonds0.3%

II.2. Tabulations and Analyses 39
Table 28. Distribution of Households, IRA Accounts, and IRA Assets by Total Household IRA Assets
Households IRA Accounts IRA Assets
Household IRA Assets
Number of households (millions) Percent
Cumulative Percent
Number of accounts (millions) Percent
Cumulative Percent
Value of accounts ($ billions) Percent
Cumulative Percent
None 88.1 71.9% 71.9% 0.0 0.0% 0.0% 0.0 0.0% 0.0%$1-$9,999 6.4 5.3% 77.2% 7.6 11.5% 11.5% 25.4 0.4% 0.4%
$10,000-$24,999 5.9 4.8% 82.0% 8.6 13.0% 24.5% 93.4 1.4% 1.8%$25,000-$49,999 4.2 3.5% 85.5% 7.3 11.1% 35.6% 149.0 2.2% 4.0%$50,000-$99,999 5.6 4.6% 90.0% 10.7 16.2% 51.8% 388.8 5.8% 9.8%
$100,000-$249,999 5.9 4.8% 94.8% 13.5 20.4% 72.1% 912.1 13.7% 23.5%$250,000-$499,999 3.2 2.6% 97.4% 8.2 12.4% 84.5% 1,100.5 16.5% 40.0%$500,000-$999,999 1.9 1.5% 99.0% 5.7 8.6% 93.2% 1,273.9 19.1% 59.1%
$1,000,000+ 1.3 1.0% 100.0% 4.5 6.8% 100.0% 2,733.0 40.9% 100.0%Total 122.5 100.0% 66.1 100.0% 6,676.0 100.0%
Source: 2013 SCF.Note: Weighted by household weights.

II.2. Tabulations and Analyses 40
Table 29. Distribution of Number of IRA Accounts per Household Member by Total Household IRA Assets
Household IRA Assets
Total number of accounts (millions) Percent
Total number of accounts (millions) Percent
Total number of accounts (millions) Percent
None 0.0 0.0% 0.0 0.0% 0.0 0.0%$1-$9,999 5.2 12.0% 2.4 10.9% 0.0 1.2%
$10,000-$24,999 5.8 13.4% 2.7 12.0% 0.1 17.5%$25,000-$49,999 4.9 11.3% 2.2 9.9% 0.2 37.6%$50,000-$99,999 6.8 15.8% 3.8 17.0% 0.0 7.5%
$100,000-$249,999 9.0 20.9% 4.4 19.5% 0.1 11.6%$250,000-$499,999 4.9 11.4% 3.2 14.5% 0.1 10.2%$500,000-$999,999 3.6 8.3% 2.1 9.2% 0.1 11.1%
$1,000,000+ 2.9 6.8% 1.5 6.9% 0.0 3.2%Total 43.1 100.0% 22.3 100.0% 0.6 100.0%
Source: 2013 SCF.Note: Weighted by household weights.
Respondent Spouse Other member

II.2. Tabulations and Analyses 41
Table 30. Household Account Types by Source of Financial Advice
Source Call a
roun
d
Magaz
ines/
Newsp
aper
s/ B
ooks
Mater
ial in
the
Telev
ision
/ Rad
io
Inte
rnet
/ Onli
ne
serv
ices
Adve
rts
Frien
ds/ R
elativ
es
Lawye
rs
Acco
unta
nt
Bank
ers
Brok
ers
Finan
cial p
lanne
r
Self
Sample Size (n/5) 776.2 817.2 361.8 480.4 2,253.8 356.6 2,313.0 314.8 817.2 2,016.4 765.8 1,806.8 487.6HHs with IRAs 27.6% 47.3% 31.7% 28.7% 35.4% 25.3% 25.7% 26.3% 38.7% 26.1% 56.4% 46.8% 33.2%HHs with DC plans 34.0% 36.8% 32.8% 32.1% 46.8% 31.2% 39.6% 26.0% 38.0% 35.2% 42.4% 46.4% 39.9%HHs with taxable acct 18.9% 37.0% 18.6% 23.4% 26.7% 19.9% 21.2% 22.0% 31.4% 17.3% 44.9% 34.6% 17.1%HHs without IRAs 72.4% 52.7% 68.3% 71.3% 64.6% 74.7% 74.3% 73.7% 61.3% 73.9% 43.6% 53.2% 66.8%HHs without DC plans 66.0% 63.2% 67.2% 67.9% 53.2% 68.8% 60.4% 74.0% 62.0% 64.8% 57.6% 53.6% 60.1%Source: 2013 SCF.Note: Weighted by household weights. Percentages do not add to 100% because multiple answers were allowed. Sample size contains decimal values because the SCF stores each household response as five replicate values and imputes missing values using five different assumptions; therefore, a household can be imputed into multiple categories of a single variable. For example, a household may hold an IRA in two replications and not hold an IRA in three replications.

II.2. Tabulations and Analyses 42
Table 31 shows sources of financial advice by various account types that households own or do not own. Its top row shows unweighted sample sizes. The SCF stores each household response as five records (“replicates”) and imputes missing values using five different assumptions; therefore, a household can be imputed into multiple categories of a single variable. For example, a household may hold an IRA in two replicates and not hold an IRA in three replicates. The sample sizes reported in Table 31 and subsequent tables are equal to one-fifth of the number of records that match the category, rounded to the nearest integer.
Table 31. Sources of Financial Advice by Household Account Types
Source All householdsHouseholds with IRAs
Households with DC plans
Households with taxable
accountsHouseholds
without IRAs
Households without DC
plansSample size 6,015 2,170 2,309 1,815 3,845 3,706Call around 13.2% 12.9% 12.7% 12.5% 13.3% 13.4%Magazines/Newspapers/Books 11.0% 18.5% 11.5% 20.4% 8.0% 10.7%Material in the mail 6.4% 7.2% 5.9% 6.0% 6.1% 6.6%Television/Radio 8.0% 8.1% 7.2% 9.4% 7.9% 8.3%Internet/Online services 35.3% 44.4% 46.9% 47.5% 31.7% 28.9%Advertisements 6.2% 5.6% 5.5% 6.2% 6.4% 6.6%Friends/Relatives 40.1% 36.7% 45.0% 42.7% 41.4% 37.4%Lawyers 3.8% 3.6% 2.8% 4.2% 3.9% 4.4%Accountants 10.2% 14.0% 11.0% 16.1% 8.7% 9.7%Bankers 33.0% 30.7% 32.9% 28.7% 33.9% 33.0%Brokers 8.6% 17.3% 10.4% 19.5% 5.2% 7.7%Financial planners 25.5% 42.4% 33.6% 44.3% 18.8% 21.1%Self 6.8% 8.0% 7.7% 5.8% 6.3% 6.3%Financial planner, banker, broker, accountant, or lawyer
56.5% 72.3% 62.5% 73.5% 50.3% 53.2%
Source: 2013 SCF.Note: Weighted by household weights. Percentages do not add to 100% because multiple answers were allowed.

II.2. Tabulations and Analyses 43
Table 32. Sources of Financial Advice for Households with an IRA, by Household IRA Assets
SourceHouseholds with IRAs $1-$9,999
$10,000-$24,999
$25,000-$49,999
$50,000-$99,999
$100,000-$249,999
$250,000-$499,999
$500,000-$999,999 $1,000,000+
Sample size 2,170 296 275 217 308 382 251 205 237Call around 12.9% 16.2% 15.5% 12.2% 13.5% 11.9% 9.8% 6.7% 5.8%Magazines/Newspapers/Books 18.5% 11.6% 12.8% 18.7% 15.0% 22.0% 29.3% 26.0% 39.3%Material in the mail 7.2% 7.8% 6.5% 10.7% 5.1% 7.5% 7.8% 5.1% 4.8%Television/Radio 8.1% 5.4% 6.6% 8.2% 7.9% 10.1% 11.6% 9.7% 9.8%Internet/Online services 44.4% 42.8% 49.0% 41.1% 44.9% 42.8% 39.8% 51.2% 48.6%Advertisements 5.6% 5.8% 3.8% 7.8% 5.8% 4.8% 9.0% 3.6% 2.2%Friends/Relatives 36.7% 44.9% 37.7% 39.3% 37.9% 33.4% 31.7% 27.8% 17.3%Lawyers 3.6% 3.3% 4.1% 3.7% 3.5% 2.7% 5.2% 1.3% 6.6%Accountants 14.0% 12.0% 15.5% 15.3% 10.7% 14.1% 15.1% 17.5% 19.6%Bankers 30.7% 37.1% 34.5% 37.2% 27.5% 24.5% 27.6% 21.4% 23.4%Brokers 17.3% 10.2% 19.2% 12.5% 18.8% 17.9% 22.2% 25.6% 27.0%Financial planners 42.4% 27.7% 41.5% 45.7% 36.8% 49.8% 54.8% 55.5% 51.0%Self 8.0% 7.9% 7.4% 8.4% 8.8% 7.5% 5.0% 9.3% 14.8%Financial planner, banker, broker, accountant, or lawyer
72.3% 65.5% 70.5% 73.4% 69.8% 77.7% 75.7% 80.8% 76.2%
Source: 2013 SCF.Note: Weighted by household weights. Percentages do not add to 100% because multiple answers were allowed.

II.2. Tabulations and Analyses 44
Table 33. Sources of Financial Advice for Households with an IRA, by Household IRA Assets
SourceHouseholds with IRAs
$1-$24,999
$1-$49,999
$1-$99,999
Sample size 2,170 571 788 1,095Call around 12.9% 15.9% 14.9% 14.6%Magazines/Newspapers/Books 18.5% 12.2% 13.9% 14.1%Material in the mail 7.2% 7.1% 8.1% 7.3%Television/Radio 8.1% 6.0% 6.5% 6.9%Internet/Online services 44.4% 45.8% 44.6% 44.7%Advertisements 5.6% 4.8% 5.6% 5.6%Friends/Relatives 36.7% 41.5% 40.9% 40.2%Lawyers 3.6% 3.7% 3.7% 3.6%Accountants 14.0% 13.7% 14.1% 13.2%Bankers 30.7% 35.9% 36.2% 34.0%Brokers 17.3% 14.5% 14.0% 15.2%Financial planners 42.4% 34.3% 37.2% 37.1%Self 8.0% 7.7% 7.8% 8.1%Financial planner, banker, broker, accountant, or lawyer
72.3% 67.9% 69.3% 69.4%
Source: 2013 SCF.Note: Weighted by household weights. Percentages do not add to 100% because multiple answers were allowed.

II.2. Tabulations and Analyses 45
Table 34. IRA Assets of Households That Consulted a Financial Planner, Banker, Broker, Accountant, or Lawyer
Households IRA Assets
Household IRA Assets
Number of households (millions) Percent
Cumulative percent
Value of accounts ($ billions) Percent
Cumulative percent
None 44.3 64.0% 64.0% 0.0 0.0% 0.0%$1-$9,999 4.2 6.1% 70.1% 17.5 0.4% 0.4%
$10,000-$24,999 4.2 6.1% 76.2% 67.0 1.4% 1.7%$25,000-$49,999 3.1 4.5% 80.7% 109.7 2.2% 3.9%$50,000-$99,999 3.9 5.7% 86.3% 275.0 5.5% 9.5%
$100,000-$249,999 4.6 6.6% 92.9% 709.3 14.3% 23.8%$250,000-$499,999 2.4 3.5% 96.4% 845.5 17.0% 40.8%$500,000-$999,999 1.5 2.2% 98.6% 1,017.6 20.5% 61.3%
$1,000,000+ 1.0 1.4% 100.0% 1,918.7 38.7% 100.0%Total 69.2 100.0% 4,960.3 100.0%
Source: 2013 SCF.Note: Weighted by household weights.

II.2. Tabulations and Analyses 46
Table 35. IRA Assets of Households That Consulted a Broker
Households IRA Assets
Household IRA Assets
Number of households (millions) Percent
Cumulative percent
Value of accounts ($ billions) Percent
Cumulative percent
None 4.6 43.6% 43.6% 0.0 0.0% 0.0%$1 - $10,000 0.7 6.2% 49.8% 3.3 0.2% 0.2%
$10,000 - $25,000 1.1 10.8% 60.6% 19.3 1.3% 1.6%$25,000 - $50,000 0.5 5.0% 65.6% 19.4 1.3% 2.9%$50,000 - $100,000 1.1 10.0% 75.6% 74.7 5.1% 8.0%$100,000 - $250,000 1.1 9.9% 85.5% 162.7 11.2% 19.2%$250,000 - $500,000 0.7 6.6% 92.1% 241.4 16.6% 35.7%
$500,000 - $1,000,000 0.5 4.6% 96.7% 329.7 22.6% 58.3%$1,000,000 and above 0.3 3.3% 100.0% 607.9 41.7% 100.0%
Total 10.6 100.0% 1,458.4 100.0%Source: 2013 SCF.Note: Weighted by household weights.

II.2. Tabulations and Analyses 47
Table 36. Median Household Income, by IRA Ownership and Professional Advice
Number of households (millions)
Median household income
($ thousands)
IRA-asset-weighted median household income
($ thousands)No IRA, no professional advice 43.8 35.5No IRA, receives professional advice 44.3 45.7Owns IRA, no professional advice 9.5 86.2 182.6Owns IRA, receives professional advice 24.9 96.3 166.4All 122.5 50.7 175.5Source: 2013 SCF.Note: Weighted by household weights. Professional advice includes advice from a financial planner, banker, broker, accountant, or lawyer.

II.2. Tabulations and Analyses 48
Table 37. Sources of Financial Advice by Household Income
SourceUnder
$10,000$10,000 - $20,000
$20,000 - $50,000
$50,000 - $100,000
$100,000 - $200,000
$200,000 - $500,000
$500,000 and above
Sample size 146 586 1,673 1,479 952 462 718Call around 15.7% 12.6% 13.4% 13.5% 13.1% 10.2% 10.6%Magazines/Newspapers/Books 6.4% 6.6% 8.8% 10.4% 14.4% 26.3% 29.4%Material in the mail 3.8% 6.2% 6.1% 6.6% 7.2% 6.1% 5.4%Television/Radio 6.0% 8.0% 7.5% 8.4% 8.5% 8.1% 8.0%Internet/Online services 23.2% 18.1% 27.9% 38.1% 52.1% 60.3% 53.0%Advertisements 5.8% 5.7% 6.7% 6.4% 5.6% 5.1% 3.2%Friends/Relatives 41.9% 38.0% 40.3% 40.7% 40.4% 39.2% 34.2%Lawyers 6.4% 4.2% 3.1% 3.6% 4.1% 5.9% 7.0%Accountants 4.3% 8.0% 7.2% 11.0% 14.1% 17.7% 25.5%Bankers 24.9% 31.9% 34.3% 35.7% 29.9% 25.4% 32.5%Brokers 2.8% 3.1% 5.5% 8.8% 13.4% 24.3% 32.4%Financial planners 15.2% 14.2% 19.0% 28.5% 37.6% 40.5% 49.3%Self 2.8% 4.4% 5.1% 7.3% 9.1% 13.8% 14.0%Source: 2013 SCF.Note: Weighted by household weights. Percentages do not add to 100% because multiple answers were allowed.
Annual household income
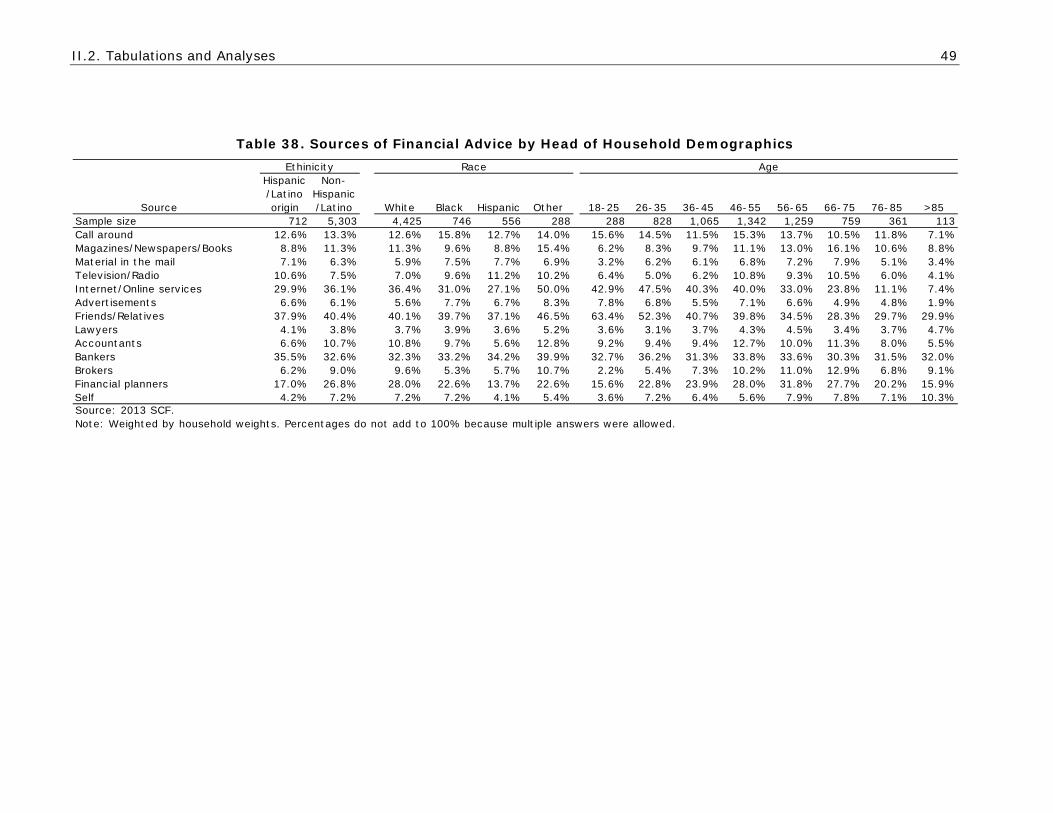
II.2. Tabulations and Analyses 49
Table 38. Sources of Financial Advice by Head of Household Demographics
Source
Hispanic/Latino origin
Non-Hispanic/Latino White Black Hispanic Other 18-25 26-35 36-45 46-55 56-65 66-75 76-85 >85
Sample size 712 5,303 4,425 746 556 288 288 828 1,065 1,342 1,259 759 361 113Call around 12.6% 13.3% 12.6% 15.8% 12.7% 14.0% 15.6% 14.5% 11.5% 15.3% 13.7% 10.5% 11.8% 7.1%Magazines/Newspapers/Books 8.8% 11.3% 11.3% 9.6% 8.8% 15.4% 6.2% 8.3% 9.7% 11.1% 13.0% 16.1% 10.6% 8.8%Material in the mail 7.1% 6.3% 5.9% 7.5% 7.7% 6.9% 3.2% 6.2% 6.1% 6.8% 7.2% 7.9% 5.1% 3.4%Television/Radio 10.6% 7.5% 7.0% 9.6% 11.2% 10.2% 6.4% 5.0% 6.2% 10.8% 9.3% 10.5% 6.0% 4.1%Internet/Online services 29.9% 36.1% 36.4% 31.0% 27.1% 50.0% 42.9% 47.5% 40.3% 40.0% 33.0% 23.8% 11.1% 7.4%Advertisements 6.6% 6.1% 5.6% 7.7% 6.7% 8.3% 7.8% 6.8% 5.5% 7.1% 6.6% 4.9% 4.8% 1.9%Friends/Relatives 37.9% 40.4% 40.1% 39.7% 37.1% 46.5% 63.4% 52.3% 40.7% 39.8% 34.5% 28.3% 29.7% 29.9%Lawyers 4.1% 3.8% 3.7% 3.9% 3.6% 5.2% 3.6% 3.1% 3.7% 4.3% 4.5% 3.4% 3.7% 4.7%Accountants 6.6% 10.7% 10.8% 9.7% 5.6% 12.8% 9.2% 9.4% 9.4% 12.7% 10.0% 11.3% 8.0% 5.5%Bankers 35.5% 32.6% 32.3% 33.2% 34.2% 39.9% 32.7% 36.2% 31.3% 33.8% 33.6% 30.3% 31.5% 32.0%Brokers 6.2% 9.0% 9.6% 5.3% 5.7% 10.7% 2.2% 5.4% 7.3% 10.2% 11.0% 12.9% 6.8% 9.1%Financial planners 17.0% 26.8% 28.0% 22.6% 13.7% 22.6% 15.6% 22.8% 23.9% 28.0% 31.8% 27.7% 20.2% 15.9%Self 4.2% 7.2% 7.2% 7.2% 4.1% 5.4% 3.6% 7.2% 6.4% 5.6% 7.9% 7.8% 7.1% 10.3%Source: 2013 SCF.Note: Weighted by household weights. Percentages do not add to 100% because multiple answers were allowed.
AgeEthinicity Race

II.2. Tabulations and Analyses 50
Table 39. Sources of Financial Advice by Financial Institution(s) that Hold Households’ IRAs
SourceCommercial
bankSavings and loan
Credit union
Finance or loan
company BrokerageInsurance company
Investment /mgmt
company OtherSample size 1,086 60 129 33 982 43 20 29Call around 11.9% 16.8% 10.1% 16.1% 13.3% 20.4% 2.6% 9.3%Magazines/Newspapers/Books 18.6% 24.6% 11.0% 8.7% 22.3% 26.4% 19.3% 14.7%Material in the mail 6.9% 9.3% 1.5% 12.4% 8.0% 11.4% 14.2% 1.7%Television/Radio 6.8% 14.9% 8.5% 11.8% 9.6% 9.7% 14.2% 6.6%Internet/Online services 42.5% 37.8% 35.4% 40.1% 51.8% 54.4% 42.2% 25.8%Advertisements 5.6% 10.1% 7.1% 8.5% 4.5% 15.1% 16.8% 7.5%Friends/Relatives 34.3% 32.9% 31.2% 32.2% 40.6% 34.4% 18.1% 42.2%Lawyers 3.1% 0.0% 2.3% 4.7% 3.9% 7.2% 10.4% 0.0%Accountants 11.9% 17.6% 9.7% 4.8% 17.2% 10.7% 21.0% 15.1%Bankers 32.4% 53.0% 41.9% 21.0% 24.7% 36.3% 18.4% 24.3%Brokers 14.6% 18.8% 11.1% 12.2% 22.6% 23.9% 6.6% 6.1%Financial planners 43.7% 38.4% 26.7% 43.7% 43.6% 50.2% 62.9% 57.5%Self 9.1% 2.1% 15.8% 12.1% 5.1% 14.9% 0.0% 3.7%Source: 2013 SCF.Note: Weighted by household weights. Percentages do not add to 100% because multiple answers were allowed.
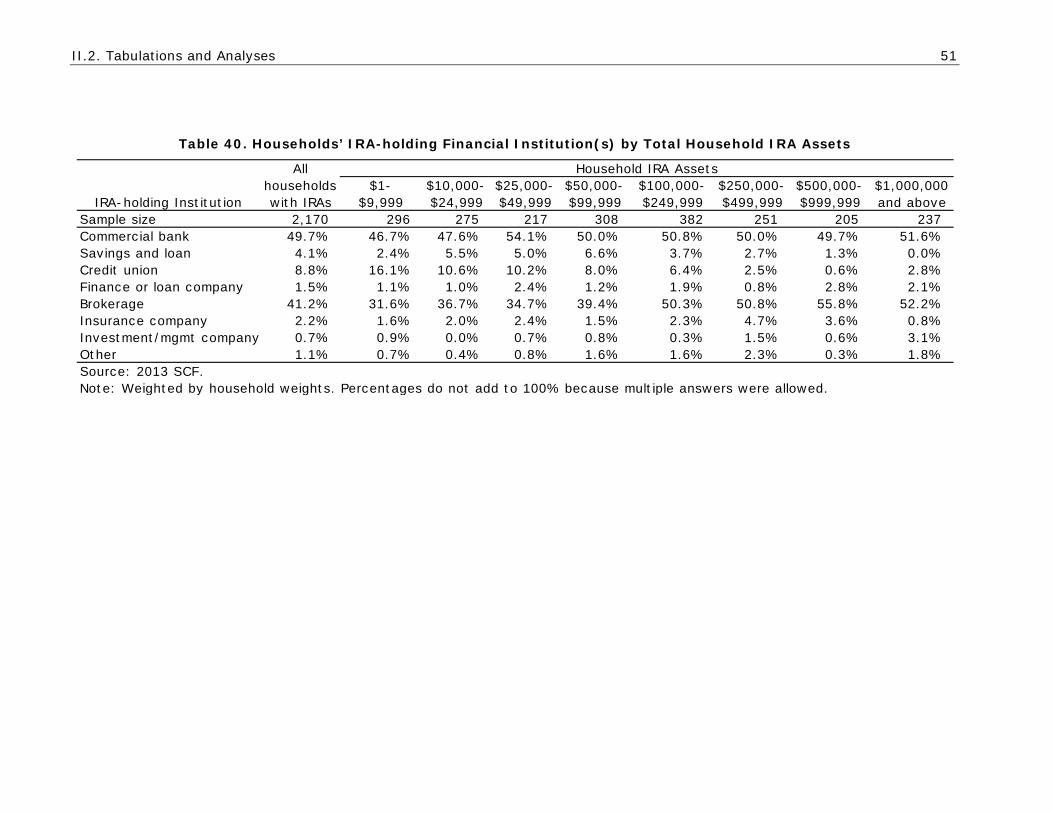
II.2. Tabulations and Analyses 51
Table 40. Households’ IRA-holding Financial Institution(s) by Total Household IRA Assets
All
IRA-holding Institutionhouseholds with IRAs
$1-$9,999
$10,000-$24,999
$25,000-$49,999
$50,000-$99,999
$100,000-$249,999
$250,000-$499,999
$500,000-$999,999
$1,000,000 and above
Sample size 2,170 296 275 217 308 382 251 205 237Commercial bank 49.7% 46.7% 47.6% 54.1% 50.0% 50.8% 50.0% 49.7% 51.6%Savings and loan 4.1% 2.4% 5.5% 5.0% 6.6% 3.7% 2.7% 1.3% 0.0%Credit union 8.8% 16.1% 10.6% 10.2% 8.0% 6.4% 2.5% 0.6% 2.8%Finance or loan company 1.5% 1.1% 1.0% 2.4% 1.2% 1.9% 0.8% 2.8% 2.1%Brokerage 41.2% 31.6% 36.7% 34.7% 39.4% 50.3% 50.8% 55.8% 52.2%Insurance company 2.2% 1.6% 2.0% 2.4% 1.5% 2.3% 4.7% 3.6% 0.8%Investment/mgmt company 0.7% 0.9% 0.0% 0.7% 0.8% 0.3% 1.5% 0.6% 3.1%Other 1.1% 0.7% 0.4% 0.8% 1.6% 1.6% 2.3% 0.3% 1.8%Source: 2013 SCF.Note: Weighted by household weights. Percentages do not add to 100% because multiple answers were allowed.
Household IRA Assets

II.2. Tabulations and Analyses 52
Table 41. Households’ IRA-holding Financial Institution(s) by Total Household Income
IRA-holding Institution
All Households
with IRAUnder
$10,000$10,000 - $20,000
$20,000 - $50,000
$50,000 - $100,000
$100,000 - $200,000
$200,000 - $500,000
$500,000 and above
Sample size 2,170 8 18 257 498 529 336 523 Commercial bank 49.7% 57.1% 51.9% 49.9% 51.7% 48.7% 45.9% 49.8%Savings and loan 4.1% 0.0% 7.1% 5.8% 4.5% 3.9% 1.3% 0.7%Credit union 8.8% 36.8% 12.1% 11.2% 12.0% 6.0% 5.2% 0.5%Finance or loan company 1.5% 0.0% 0.0% 0.9% 1.6% 2.2% 0.4% 2.3%Brokerage 41.2% 0.2% 20.7% 34.2% 36.3% 46.1% 52.3% 54.4%Insurance company 2.2% 5.9% 0.0% 2.5% 2.2% 1.7% 3.7% 1.9%Investment/mgmt company 0.7% 0.0% 2.5% 1.0% 0.6% 0.4% 1.3% 0.9%Other 1.1% 0.0% 5.7% 0.8% 1.6% 0.8% 1.2% 1.1%Source: 2013 SCF.
Annual Household Income
Note: Weighted by household weights. Percentages do not add to 100% because multiple answers were allowed.

II.2. Tabulations and Analyses 53
Table 42. Households’ IRA-holding Financial Institution(s) by Head of Household Demographics
IRA-holding Institution Married Separated Divorced Widowed
Never married-
Male
Never married-Female
Less than high
High school
or Some
collegeAssoc degree
Bachelor degree
Master degree
Prof. degree/doctorat
Sample size 3,286 201 920 446 686 476 544 1,601 1,028 369 1,346 726 400Commercial bank 50.6% 29.6% 45.4% 53.2% 48.5% 49.4% 39.8% 50.9% 49.3% 55.7% 51.0% 45.5% 48.1%Savings and loan 3.9% 0.0% 4.8% 6.4% 3.6% 2.7% 0.0% 5.8% 4.9% 5.3% 3.1% 3.3% 3.6%Credit union 7.5% 30.6% 14.1% 4.2% 12.6% 9.5% 17.8% 15.1% 10.5% 7.2% 6.4% 6.8% 4.4%Finance or loan company 1.7% 0.0% 1.3% 0.8% 1.1% 2.1% 0.0% 2.2% 0.6% 1.5% 0.8% 3.3% 0.3%Brokerage 43.8% 40.0% 35.9% 39.2% 36.5% 32.1% 47.1% 29.3% 40.3% 30.9% 45.2% 46.2% 52.9%Insurance company 2.2% 0.0% 2.7% 4.1% 1.5% 0.5% 0.0% 2.2% 2.0% 3.3% 1.8% 2.8% 2.5%Investment/mgmt company 0.8% 0.0% 0.1% 1.1% 0.3% 1.5% 0.0% 0.5% 0.3% 1.3% 0.5% 1.3% 1.5%Other 1.2% 0.0% 1.6% 0.7% 0.0% 2.6% 0.0% 0.9% 0.4% 1.1% 2.1% 1.0% 0.2%
Marital Status Education
IRA-holding Institution
Hispanic/Latino origin
Non-Hispanic/Latino White Black Hispanic Other 18-25 26-35 36-45 46-55 56-65 66-75 76-85 >85
Sample size 712 5,303 4,425 746 556 288 288 828 1,065 1,342 1,259 759 361 113Commercial bank 50.3% 49.7% 50.2% 38.7% 53.6% 51.4% 52.3% 44.2% 49.2% 47.5% 51.3% 48.8% 56.0% 69.9%Savings and loan 3.9% 4.1% 3.9% 7.6% 0.0% 5.2% 0.0% 3.5% 2.4% 3.4% 3.2% 6.4% 7.9% 4.1%Credit union 7.1% 8.9% 8.5% 19.6% 8.6% 1.9% 5.1% 11.6% 7.6% 8.9% 9.9% 7.4% 8.0% 6.2%Finance or loan company 1.6% 1.5% 1.3% 2.7% 2.8% 3.0% 0.0% 2.4% 1.1% 3.4% 0.9% 0.7% 0.3% 0.0%Brokerage 36.4% 41.4% 42.0% 31.4% 31.1% 43.3% 30.0% 38.4% 43.7% 45.8% 39.6% 42.7% 33.1% 28.8%Insurance company 1.3% 2.3% 2.4% 2.2% 2.3% 0.3% 0.0% 1.0% 1.2% 1.2% 3.4% 3.5% 2.6% 1.1%Investment/mgmt company 0.1% 0.8% 0.7% 0.9% 0.0% 1.9% 12.6% 1.0% 0.5% 0.4% 0.6% 1.3% 0.2% 0.0%Other 1.4% 1.2% 1.1% 1.1% 2.5% 1.8% 0.0% 0.6% 1.0% 1.1% 1.2% 2.0% 1.0% 0.0%Source: 2013 SCF.
Age
Note: Weighted by household weights. Percentages do not add to 100% because multiple answers were allowed.
Ethinicity Race

II.2. Tabulations and Analyses 54
Table 43. Households' IRA-holding Financial Institution(s) by Total Household Wealth Quintiles and Top Percentiles
IRA-holding InstitutionLowest-
First Second Third FourthHighest-
Fifth Top 5% Top 1%Sample size 1,242 787 986 1,015 1,984 995 510Lower wealth boundary $0 $0 $3,300 $30,000 $165,000 $881,000 $3,700,000Commercial bank 0.0% 45.3% 46.8% 51.1% 49.8% 48.7% 51.6%Savings and loan 0.0% 3.1% 2.7% 6.2% 3.2% 1.0% 0.8%Credit union 0.0% 13.7% 14.6% 12.9% 4.7% 3.2% 0.5%Finance or loan company 0.0% 2.4% 1.3% 1.3% 1.6% 1.2% 1.7%Brokerage 0.0% 25.4% 33.6% 33.5% 48.5% 53.6% 56.1%Insurance company 0.0% 2.9% 2.2% 1.2% 2.8% 3.3% 1.5%Investment/mgmt company 0.0% 3.3% 0.5% 0.7% 0.7% 1.1% 1.9%Other 0.0% 3.9% 0.6% 0.4% 1.6% 0.7% 0.2%Source: 2013 SCF.
Total household wealth quintiles
Note: Weighted by household weights. Percentages do not add to 100% because multiple answers were allowed.
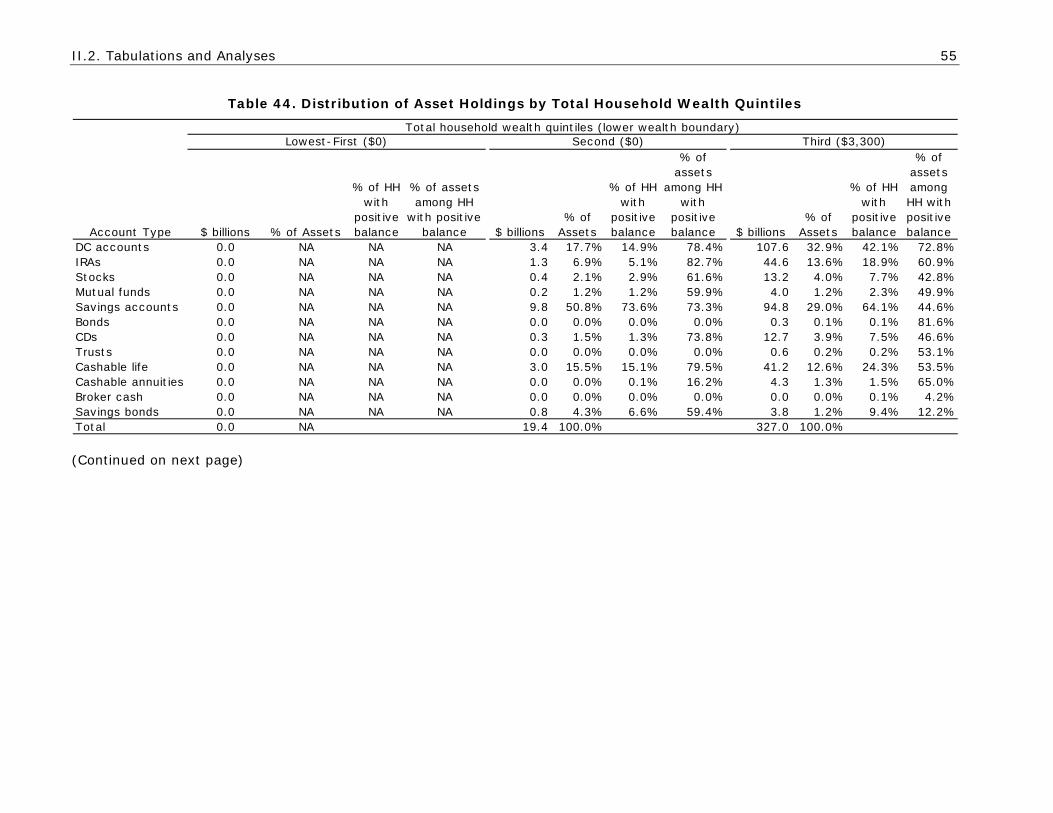
II.2. Tabulations and Analyses 55
Table 44. Distribution of Asset Holdings by Total Household Wealth Quintiles
(Continued on next page)
Total household wealth quintiles (lower wealth boundary)
Account Type $ billions % of Assets
% of HH with
positive balance
% of assets among HH
with positive balance $ billions
% of Assets
% of HH with
positive balance
% of assets
among HH with
positive balance $ billions
% of Assets
% of HH with
positive balance
% of assets among HH with positive balance
DC accounts 0.0 NA NA NA 3.4 17.7% 14.9% 78.4% 107.6 32.9% 42.1% 72.8%IRAs 0.0 NA NA NA 1.3 6.9% 5.1% 82.7% 44.6 13.6% 18.9% 60.9%Stocks 0.0 NA NA NA 0.4 2.1% 2.9% 61.6% 13.2 4.0% 7.7% 42.8%Mutual funds 0.0 NA NA NA 0.2 1.2% 1.2% 59.9% 4.0 1.2% 2.3% 49.9%Savings accounts 0.0 NA NA NA 9.8 50.8% 73.6% 73.3% 94.8 29.0% 64.1% 44.6%Bonds 0.0 NA NA NA 0.0 0.0% 0.0% 0.0% 0.3 0.1% 0.1% 81.6%CDs 0.0 NA NA NA 0.3 1.5% 1.3% 73.8% 12.7 3.9% 7.5% 46.6%Trusts 0.0 NA NA NA 0.0 0.0% 0.0% 0.0% 0.6 0.2% 0.2% 53.1%Cashable life 0.0 NA NA NA 3.0 15.5% 15.1% 79.5% 41.2 12.6% 24.3% 53.5%Cashable annuities 0.0 NA NA NA 0.0 0.0% 0.1% 16.2% 4.3 1.3% 1.5% 65.0%Broker cash 0.0 NA NA NA 0.0 0.0% 0.0% 0.0% 0.0 0.0% 0.1% 4.2%Savings bonds 0.0 NA NA NA 0.8 4.3% 6.6% 59.4% 3.8 1.2% 9.4% 12.2%Total 0.0 NA 19.4 100.0% 327.0 100.0%
Lowest-First ($0) Second ($0) Third ($3,300)

II.2. Tabulations and Analyses 56
Table 44. Distribution of Asset Holdings by Total Household Wealth Quintiles (Continued)
Total household wealth quintiles (lower wealth boundary)
Account Type $ billions % of Assets
% of HH with
positive balance
% of assets among HH
with positive balance $ billions
% of Assets
% of HH with
positive balance
% of assets
among HH with
positive balance
DC accounts 753.5 38.1% 58.4% 64.9% 4,443.4 16.9% 58.1% 33.3%IRAs 465.7 23.5% 43.9% 48.5% 6,164.3 23.5% 73.9% 28.8%Stocks 93.7 4.7% 16.7% 27.1% 4,685.1 17.9% 42.3% 28.3%Mutual funds 62.0 3.1% 8.6% 31.6% 4,482.4 17.1% 29.1% 33.5%Savings accounts 318.9 16.1% 72.7% 22.0% 1,553.4 5.9% 72.1% 9.2%Bonds 4.7 0.2% 0.8% 30.8% 954.4 3.6% 6.3% 16.6%CDs 91.1 4.6% 12.8% 33.2% 507.9 1.9% 17.5% 12.4%Trusts 11.8 0.6% 1.1% 49.8% 1,675.2 6.4% 6.1% 42.0%Cashable life 99.0 5.0% 26.4% 18.7% 685.4 2.6% 33.6% 6.9%Cashable annuities 59.0 3.0% 5.2% 51.2% 609.5 2.3% 12.6% 17.9%Broker cash 4.3 0.2% 1.4% 15.7% 405.4 1.5% 7.8% 9.8%Savings bonds 16.0 0.8% 15.5% 5.1% 58.0 0.2% 20.1% 1.2%Total 1,979.7 100.0% 26,224.4 100.0%Source: 2013 SCF.Note: Weighted by household weights. Total household wealth is the sum of DC accounts, IRAs, stocks,mutual funds, savings accounts, bonds, CDs, trusts, cashable life, cashable annuities, broker cash,and savings bonds.
Fourth ($30,000) Highest-Fifth ($165,000)

II.2. Tabulations and Analyses 57
Table 45. Distribution of Asset Holdings Overall and by Total Household Wealth Top Percentiles
Account Type $ billions % of Assets
% of HH with
positive balance
% of assets among HH
with positive balance $ billions
% of Assets
% of HH with
positive balance
% of assets
among HH with
positive balance $ billions
% of Assets
% of HH with
positive balance
% of assets among HH with positive balance
DC accounts 5,308.0 18.6% 34.0% 36.2% 2,088.3 10.9% 53.1% 23.0% 824.1 7.5% 51.3% 16.8%IRAs 6,676.0 23.4% 28.1% 29.8% 4,122.1 21.6% 86.8% 25.3% 1,785.9 16.2% 84.5% 19.6%Stocks 4,792.3 16.8% 13.8% 28.4% 4,060.3 21.3% 62.8% 29.6% 2,611.6 23.7% 79.5% 30.0%Mutual funds 4,548.7 15.9% 8.2% 33.5% 3,944.6 20.7% 50.5% 33.8% 2,643.9 24.0% 61.1% 35.7%Savings accounts 1,977.0 6.9% 53.2% 10.7% 976.4 5.1% 68.0% 8.4% 436.4 4.0% 60.1% 7.3%Bonds 959.3 3.4% 1.4% 16.6% 927.1 4.9% 17.8% 16.6% 723.1 6.6% 37.2% 16.6%CDs 612.0 2.1% 7.8% 13.9% 287.2 1.5% 16.6% 10.2% 111.7 1.0% 15.7% 7.4%Trusts 1,687.6 5.9% 1.5% 42.0% 1,502.1 7.9% 11.4% 41.6% 1,214.6 11.0% 20.1% 41.8%Cashable life 828.7 2.9% 19.2% 7.9% 460.4 2.4% 39.1% 6.1% 275.5 2.5% 38.2% 6.3%Cashable annuities 672.7 2.4% 3.9% 19.0% 332.8 1.7% 13.8% 13.4% 111.3 1.0% 12.6% 8.4%Broker cash 409.8 1.4% 1.9% 9.8% 376.5 2.0% 14.7% 10.3% 256.2 2.3% 20.8% 9.9%Savings bonds 78.6 0.3% 10.0% 1.5% 22.5 0.1% 19.1% 0.7% 8.3 0.1% 18.4% 0.5%Total 28,550.5 100.0% 19,100.3 100.0% 11,002.8 100.0%Source: 2013 SCF.Note: Weighted by household weights. Total household wealth is the sum of DC accounts, IRAs, stocks, mutual funds, savings accounts, bonds, CDs, trusts, cashable life, cashable annuities, broker cash, and savings bonds.
Top 5% ($881,000) Top 1% ($3,700,000)All HouseholdsTotal household wealth percentiles (lower wealth boundary)

II.2. Tabulations and Analyses 58
Table 46. Distribution of Asset Holdings among IRA Holders by Total IRA-holding Household Wealth Quintiles
Account Type $ billions% of
Assets
% of HH with
positive balance
% of assets among HH with positive balance $ billions
% of Assets
% of HH with
positive balance
% of assets among HH with positive balance $ billions
% of Assets
% of HH with
positive balance
% of assets among HH with positive balance $ billions
% of Assets
% of HH with
positive balance
% of assets among HH with positive balance $ billions
% of Assets
% of HH with
positive balance
% of assets among HH with positive balance
DC accounts 16.3 13.6% 26.2% 41.8% 118.3 21.8% 47.2% 45.6% 327.2 25.3% 52.2% 48.7% 808.6 27.0% 57.1% 46.8% 1,770.7 10.1% 51.9% 21.8%IRAs 69.3 58.0% 100.0% 58.0% 273.4 50.4% 100.0% 50.4% 559.4 43.2% 100.0% 43.2% 1,149.7 38.3% 100.0% 38.3% 4,624.1 26.5% 100.0% 26.5%Stocks 2.0 1.7% 8.9% 16.5% 16.6 3.1% 16.5% 18.0% 57.3 4.4% 27.1% 15.7% 243.6 8.1% 39.7% 20.0% 3,451.7 19.8% 60.0% 27.7%Mutual funds 1.9 1.6% 3.9% 28.6% 17.3 3.2% 10.6% 26.6% 59.5 4.6% 17.2% 25.7% 190.6 6.4% 24.6% 25.3% 3,446.6 19.7% 47.3% 32.7%Savings accounts 19.8 16.5% 55.4% 27.5% 67.9 12.5% 70.6% 17.8% 144.0 11.1% 75.2% 14.7% 212.3 7.1% 73.9% 9.6% 901.5 5.2% 68.7% 8.3%Bonds 0.0 0.0% 0.0% 0.0% 0.1 0.0% 0.0% 50.7% 3.3 0.3% 2.5% 8.3% 8.6 0.3% 1.3% 22.7% 811.6 4.6% 16.0% 16.1%CDs 3.4 2.8% 6.6% 34.7% 15.4 2.8% 11.6% 24.8% 31.0 2.4% 16.5% 14.7% 104.5 3.5% 19.4% 17.5% 230.0 1.3% 18.1% 8.8%Trusts 0.0 0.0% 0.0% 0.0% 0.9 0.2% 0.5% 40.1% 3.5 0.3% 0.8% 40.4% 57.0 1.9% 4.3% 42.6% 1,126.8 6.4% 9.5% 36.3%Cashable life 5.0 4.2% 14.5% 25.9% 19.2 3.5% 27.6% 12.1% 53.2 4.1% 29.1% 14.1% 82.6 2.8% 33.9% 8.2% 414.8 2.4% 38.9% 5.9%Cashable annuities 0.1 0.1% 1.3% 9.9% 8.7 1.6% 4.3% 30.1% 43.4 3.4% 9.6% 33.4% 122.9 4.1% 14.9% 26.1% 336.6 1.9% 14.1% 13.5%Broker cash 0.0 0.0% 0.0% 0.0% 2.2 0.4% 3.0% 12.3% 3.3 0.3% 3.3% 6.4% 6.5 0.2% 5.5% 4.0% 329.7 1.9% 15.2% 9.4%Savings bonds 1.7 1.4% 13.1% 9.6% 3.0 0.6% 14.5% 3.8% 9.3 0.7% 22.0% 3.3% 11.7 0.4% 19.4% 2.0% 29.1 0.2% 20.9% 0.9%Total 119.5 100.0% 542.9 100.0% 1,294.3 100.0% 2,998.6 100.0% 17,473.2 100.0%Source: 2013 SCF.
Total household wealth quintiles (lower wealth boundary)
Note: Weighted by household weights. Total household wealth is the sum of DC accounts, IRAs, stocks, mutual funds, savings accounts, bonds, CDs, trusts, cashable life, cashable annuities, broker cash, and savings bonds.
Highest-Fifth ($650,000)Fourth ($270,000)Third ($121,800)Lowest-First ($0) Second ($40,170)

II.2. Tabulations and Analyses 59
Table 47. Distribution of Asset Holdings among IRA Holders Overall and by Total IRA-holding Household Wealth Top Percentiles
Account Type $ billions% of
Assets
% of HH with
positive balance
% of assets among HH with positive balance $ billions
% of Assets
% of HH with
positive balance
% of assets among HH with positive balance $ billions
% of Assets
% of HH with
positive balance
% of assets among HH with positive balance
DC accounts 3,041.1 13.6% 46.9% 28.1% 728.4 6.5% 49.0% 14.8% 164.6 3.0% 40.6% 8.0%IRAs 6,676.0 29.8% 100.0% 29.8% 2,336.6 20.8% 100.0% 20.8% 939.5 17.4% 100.0% 17.4%Stocks 3,771.2 16.8% 30.4% 26.7% 2,655.1 23.6% 80.2% 29.4% 1,292.3 23.9% 76.2% 31.1%Mutual funds 3,715.9 16.6% 20.7% 32.0% 2,540.1 22.6% 68.8% 32.1% 1,463.9 27.0% 72.8% 35.4%Savings accounts 1,345.5 6.0% 68.8% 9.3% 502.2 4.5% 63.4% 7.8% 109.3 2.0% 55.3% 4.0%Bonds 823.5 3.7% 4.0% 16.1% 697.2 6.2% 34.4% 15.9% 326.9 6.0% 40.0% 14.2%CDs 384.2 1.7% 14.4% 11.0% 90.0 0.8% 12.1% 6.4% 13.6 0.3% 14.4% 2.0%Trusts 1,188.2 5.3% 3.0% 36.6% 971.6 8.6% 14.0% 37.6% 684.0 12.6% 29.9% 35.8%Cashable life 574.8 2.6% 28.8% 6.7% 273.5 2.4% 42.1% 5.9% 140.6 2.6% 38.6% 6.5%Cashable annuities 511.6 2.3% 8.8% 16.4% 134.9 1.2% 15.2% 8.4% 72.9 1.3% 13.4% 10.4%Broker cash 341.7 1.5% 5.4% 9.1% 291.4 2.6% 20.8% 10.7% 205.3 3.8% 33.2% 12.3%Savings bonds 54.8 0.2% 18.0% 1.3% 12.5 0.1% 21.2% 0.6% 1.6 0.0% 19.0% 0.2%Total 22,428.5 100% 11,233.5 100% 5,414.6 100%Source: 2013 SCF.Note: Weighted by household weights. Total household wealth is the sum of DC accounts, IRAs, stocks, mutual funds, savings accounts, bonds, CDs, trusts, cashable life, cashable annuities, broker cash, and savings bonds.
Top 5% ($2,455,500) Top 1% ($8,174,000)All Households with IRATotal household wealth percentiles (lower wealth boundary)

Appendix 1 60
APPENDIX 1
This section’s facts, statements, and tabulations are current as of September 30, 2011.
Availability of Data on IRA and DC Account Age
We researched the availability of information on the duration from the purchase to the sale of assets, but were unable to locate such information. However, the SIPP and SCF do ask some questions about the age of IRA and DC plan accounts.
SIPP
The SIPP Assets and Liabilities topical module contains the following questions on IRA and DC account age.
• For how many years has ... contributed to ...'s IRA accounts? • For how many years has ... contributed to ...'s 401k, 403b, or thrift plans?
The SIPP Retirement and Pension Plans topical module contains the following question for DC accounts.
• How many years have you been included in this plan?
SCF
The SCF does not include any data on IRA account age, but it includes the following question on the DC pension plan with their current main job.
• How long (have you/has your[husband/wife/partner]) been in this plan? o Number of years o Age of respondent when account opened o Year plan began
“How America Saves 2011” Vanguard
A thorough review of Vanguard’s “How America Saves” report revealed that Vanguard does not publish information on the duration that assets are held or the age of accounts.6
EBRI
A cursory review of EBRI publications and the EBRI website did not reveal any information on the duration that assets are held or the age of IRAs or DC plans.
6 Downloaded from https://institutional.vanguard.com/iam/pdf/HAS11.pdf.

Appendix 2 61
APPENDIX 2
Calculations for Table 26: IRAs, IRA assets, and Median Household Income of IRA Holders, by Type of Institution Holding IRAs
The SCF does not ask respondents to specify the type of institution in which each IRA account is held. We used the responses to two sets of questions to assign accounts and balances to institutions. First, the SCF asks about total balances in four different types of IRA accounts: Roth, roll-over from pension account, regular or other IRA, and Keogh. These data were collected separately for the respondent, spouse and other family members who are part of the primary economic unit, if any. Second, respondents were asked to list the type of each institution (e.g., commercial bank, brokerage) where any IRA accounts were held. Again, this was asked separately for the respondent, spouse and other family members and responses were recorded in the order that they were given. Each positive balance reported in the first set of questions was treated as if it related to one account. Accounts and balances were assigned to the institution types reported in the following manner:
1) If only one institution type was reported, all accounts were assumed to be held at that institution type;
2) If multiple types of institutions were reported, the account balances were sorted and the account with the largest balance was assigned to the institution mentioned first, the account with the second largest balance was assigned to the institution mentioned second and so on;
3) If the number of accounts reported was larger than the number of institutions reported then the account with the smallest balance was assigned to the last mentioned institution, the next smallest to the next-to-last mentioned institution and so on, with the remaining balances all assigned to the first mentioned institution;
4) If the number of balances was smaller than the number of institutions then we used the process described in (2) and ignored any excess institutions.

Disclaimer 62
This document was produced for the U.S. Department of Labor pursuant to Task Order DOL-OPS-14-T-00025 (SCF Statistical Studies and Literature Analysis) under Contract DOLJ139335157.
DISCLAIMER
The views, opinions, and/or findings contained in this report should not be construed as an official Government position, policy or decision, unless so designated by other documentation issued by the appropriate governmental authority. We call your attention to the possibility that other professionals may perform procedures concerning the same information or data and reach different findings than Advanced Analytical Consulting Group, Inc. (AACG) and Deloitte Transaction and Business Analytics LLP (Deloitte) for a variety of reasons, including the possibilities that additional or different information or data might be provided to them that was not provided to Deloitte and AACG, that they might perform different procedures than did Deloitte and AACG, or that professional judgments concerning complex, unusual, or poorly documented matters may differ. This document contains general information only. AACG and Deloitte are not, by means of this document, rendering business, financial, investment, or other professional advice or services. This document is not a substitute for such professional advice or services, nor should it be used as a basis for any decision or action. Before making any decision or taking any action, a qualified professional adviser should be consulted. AACG and Deloitte, its affiliates, or related entities shall not be responsible for any loss sustained by any person who relies on this publication.