chapter 3 cash holdings. corporate cash holdings cash holdings represent the most liquid asset,...
TRANSCRIPT

Chapter 3 Cash Holdings
CORPORATE CASH HOLDINGS
• Cash holdings represent the most liquid asset, which explains the common phrase “cash is king”.• Cash holdings refer to transaction account balances. •Marketable securities represent short-term instruments owned by firms that mature in less than a year and have relatively low risk and cheap liquidation costs. Subsequently, these short-term investments provide liquidity in addition to cash holdings.
• Typically, determining the proportion of assets held in cash is one of the first investment decisions that management faces. The firm’s overall risk posture, as reflected in current macroeconomic conditions and competition in product markets, influences the cash position.• Further, the availability of other liquidity sources should be
considered before adopting a particular cash strategy; non-cash items can provide liquidity if the stock of cash and current cash inflow is insufficient to cover obligations.

liquidity strategy
•A low-liquidity strategy entails a minimal investment in cash. This strategy allows managers to internally finance increased investment in net operating working capital or fixed assets.•Certain firms may be able to justify the low-liquidity strategy on the basis of predictable cash flows and spare debt capacity.

•Benefits accompanying reduced cash holdings include a higher return on assets and lower agency costs.•Moderate-liquidity strategy involves a greater investment in cash with correspondingly less risk. This strategy may be premised on a matching philosophy: increased near-term financial obligations imply a heightened need to invest in cash.

•Last, the high-liquidity strategy prescribes a relatively large cash-to-assets ratio. •Default and bankruptcy risks are reduced because of the greater liquidity reserve.
• However, profitability is lower as well since a greater proportion of assets is allocated to low-yielding cash. Companies with significant business or financial risk might implement such a strategy. • For years, automakers and Microsoft justified large cash positions because of unknown future capital investment opportunities, such as plant expansions or newly developed technologies

Costs and Benefits of Holding Cash
• The costs and benefits of holding cash influence the optimal cash level. A key marginal cost of cash holdings is opportunity costs.• The opportunity cost of cash and near-cash investments
should not be dismissed as trivial, given the current lower yields on transaction accounts offered by financial institutions. Another important consideration is the agency costs associated with cash. Jensen’s (1986) theory on the agency costs of cash posits that excess liquidity provides avenues through which managers can extract private benefits from the firm to the detriment of shareholders

Motives for holding cash
• Cash holdings result from transactions, precautionary, and speculative motives.
• Transactions motive to hold cash when cash outflow are unsynchronized with cash inflows. In this case cash provides a medium to fulfill payments in lieu of liquidating long-term assets. Thus, cash can reduce transaction costs and opportunity costs that stem from lost returns due to early liquidation.
• The transactions motive for holding cash is important for firms with unsynchronized cash inflows and outflows.

• Managers may hold cash for precautionary purposes because cash can buffer against unexpected contingencies or cash flow shortages; realized cash inflows may be less than expected.
• Precautionary cash holdings provide funding for purchases and repayment of debt, which are even more critical during tight credit periods when external capital is more difficult to acquire.
• Managers also have a speculative motive because cash holdings allow for the acquisition of positive net present value investments, where examples include strategic mergers or acquisitions.

CASH-BASED LIQUIDITY MEASURES
• Cash Conversion Efficiency
• Generating revenues is important, but converting revenues into operating cash flow (OCF) is essential to maximizing shareholder wealth. Hence, the proportion of sales that yield operating cash flow, dubbed cash conversion efficiency (CCE), is critical for firms’ long-term viability.

Generous credit policy and large inventory holdings.

Cash ratio
• Stock of cash held on the balance sheet scaled by total assets.
• A function of the prior period cash balance plus the change in cash provided by the statement of cash flows (i.e., the sum of cash flow from operations, net cash flow from investing activities, and net cash provided from financing activities).
• Since the cash ratio provides the proportion of assets held in cash, this metric is a key measure used to assess corporate liquidity.
• Higher cash ratios imply an improved ability to weather uncertain conditions in product markets and the broader economy.
• At the same time, high cash holdings increase agency and opportunity costs.

Cash Burn Rate
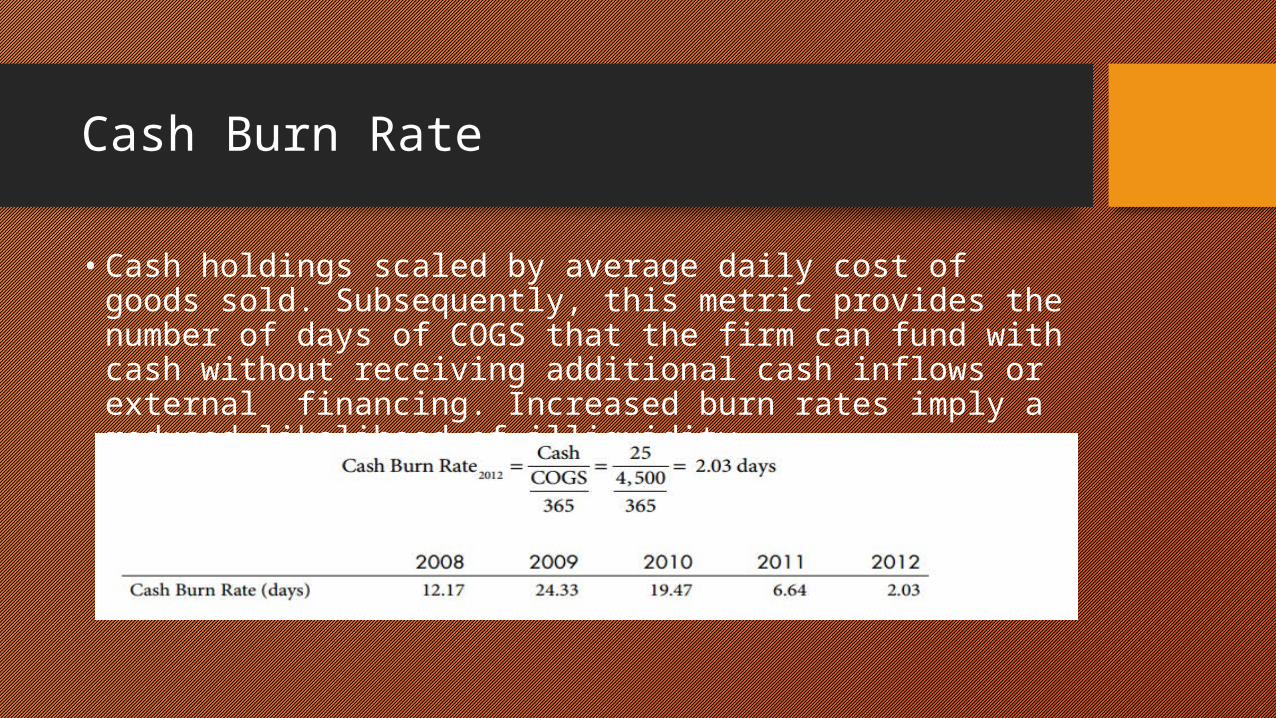
• Cash holdings scaled by average daily cost of goods sold. Subsequently, this metric provides the number of days of COGS that the firm can fund with cash without receiving additional cash inflows or external financing. Increased burn rates imply a reduced likelihood of illiquidity.
Net Liquid Balance
• Sum of cash and short-term investments minus current nonspontaneous financial liabilities (i.e., arranged financing) such as notes payable and current maturing debt. • A negative NLB indicates dependence on outside
financing and suggests the minimum capacity needed from a credit line. While a negative NLB by itself does not mean that the firm will default on debt obligations, a negative NLB implies reduced liquidity.

• net working capital (NWC) equals the sum of the working capital requirement ( WCR) and the NLB.
• To conceptualize how the NLB measures liquidity, consider the interaction between sales growth and the operating cycle. With growing sales the WCR will expand due to increased receivables and inventory. The increased investment in WCR must either be financed by drawing down the NLB or by raising financing through the acquisition of additional long-term financing. Therefore, a greater NLB implies an increased amount of liquid resources available to fund the WCR.
• If the increase in WCR is seasonal, then drawing down the NLB is appropriate. However, if the increase in WCR is permanent because of a new higher level of operations, then the increase in WCR should be financed with a permanent source of fi nancing and contract as sales shrink (selling off of inventory and collection of receivables)

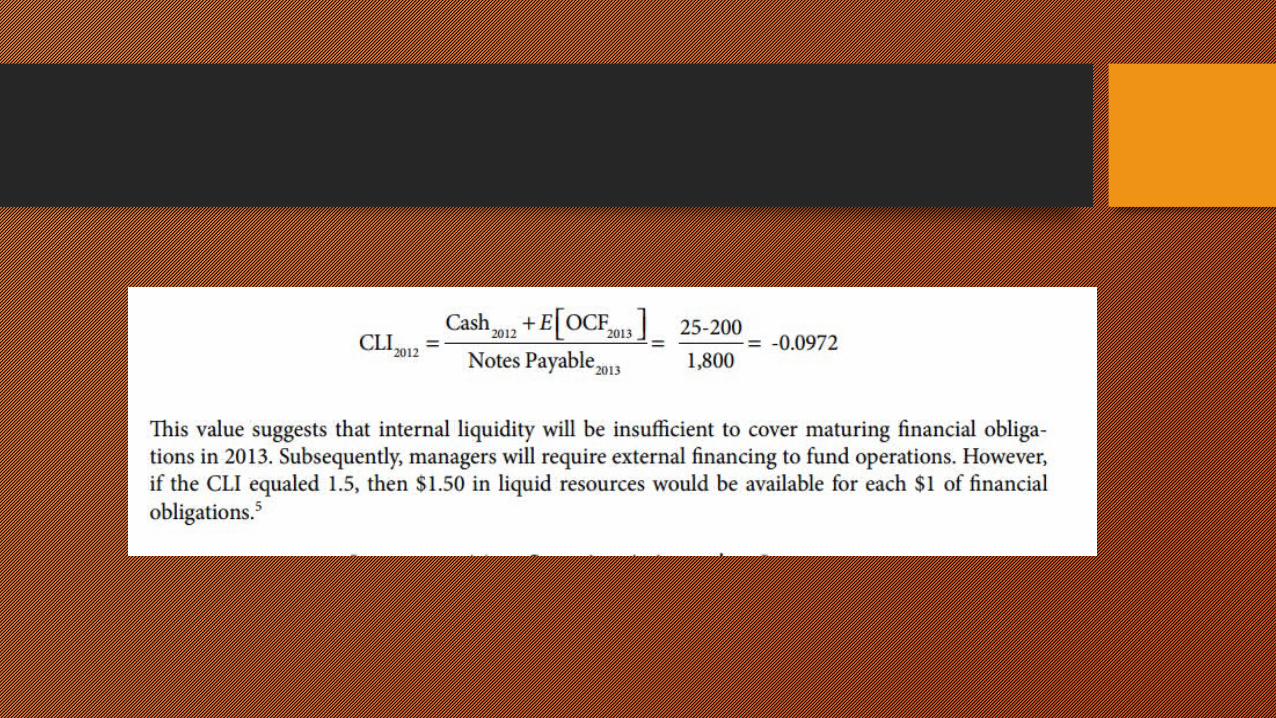
Current Liquidity Index
• The current liquidity index (CLI) quantifies liquidity by scaling the sum of current cash and equivalents and the next period’s expected operating cash flow by next period’s short-term financial liabilities.• Reduced values for the CLI signal potential liquidity problems and vice versa.
CASH MANAGEMENT MODELS
• Baumol Model
• the optimal cash level that minimizes the total costs associated with transferring funds out of securities into cash during a given time period.• Total costs of setting the cash position include the
transactions costs incurred to replenish cash by selling securities and the opportunity costs of foregone interest resulting from holding demand deposit balances.
Baumol Model
• The assumptions involved in using the Baumol model include:
• Periodic receipt of funds but a continuous and steady disbursement of monies
• Certain cash needs (that is, the demand for cash is known)
• When the cash balance reaches $0, or the desired “ safety stock” level, securities are sold so that the balance is replenished to the initial cash balance, denoted as Z*.

Baumol Model (Cont.)
Baumol Model (Cont.)

Miller-Orr Model
•First, the former allows for unpredictable fluctuations in the cash balance instead of assuming a perfect forecast. The Miller-Orr model accomplishes this by incorporating the variance of the company’s daily net cash flows.
•Second, it permits both upward and downward movements in the cash balance subsequent to replenishment, as opposed to the company experiencing a one-time periodic cash infusion that is subsequently depleted at a continuous rate.
Miller-Orr Model (Cont.)
• The model includes two trigger points that signal a purchase or sale of securities. The upper control limit (UCL) triggers a purchase of securities large enough to reduce excess cash balances to the return point Z*.
Miller-Orr Model (Cont.)
• When the cash balance dips down to the lower control limit (LCL), a sale of securities sufficient to return the cash balance to Z* is initiated. Notice that no transactions are initiated as long as the cash balance remains within the control limits. In such a case, the stream of cash receipts and disbursements would need to be moderately synchronized, but the Miller-Orr model assumes unpredictable cash flows meaning that next period’s flows
Miller-Orr Model (Cont.)

Miller-Orr Model (Cont.)

• Be careful interpreting Z*. If the company sets the LCL limit at any value other than $0, then Z* is no longer the return point for cash. Instead, the return point is Z* + LCL• While the LCL equals $0 or some arbitrary low
value, the optimal value of UCL (derived using stochastic calculus) is 3Z* + LCL. • The average cash balance equals 4/3(Z*) + LCL
and the return point is Z* + LCL
Miller-Orr Model (Cont.)

Miller-Orr Model (Cont.)

Stone Model
• The Stone model (1972) improves on the realism of the Miller-Orr optimization process by allowing the manager’s knowledge of imminent cash flows to override model directives.
• This model potentially provides larger cost savings because there are times that the manager will anticipate a cash inflow from collections reducing the need to sell securities or imminent cash disbursements may be large enough to pull the cash balance back within the UCL.
• Stone’s formulation permits treasury staff to look ahead up to 3 to 12 days.
• A security transaction only occurs when the cash balance is both out of bounds today and will still be out of bounds K days from now.

• Advanced Software, Inc. (ASI) has had little success in implementing cash management models. Ed, the treasurer, has just returned from a training seminar at which he heard about the Stone model, and he is excited about applying it. The seminar instructor told Ed to use the same control limits that he has been using but to modify the decision rules.

• First, transfers between cash and securities will not take place unless the cash position is very high or low and is expected to stay that way for another 3 days. This implies that Ed must make decisions based on the anticipated cash position, which is the sum of today’s cash position and the next 3 days’ forecasted cash flows (K = 3). Second, to partially account for forecasting errors, the trigger points are adjusted by a 3% safety stock cushion. This effectively shrinks the range of values the forecasted cash position can move within before a transaction occurs.
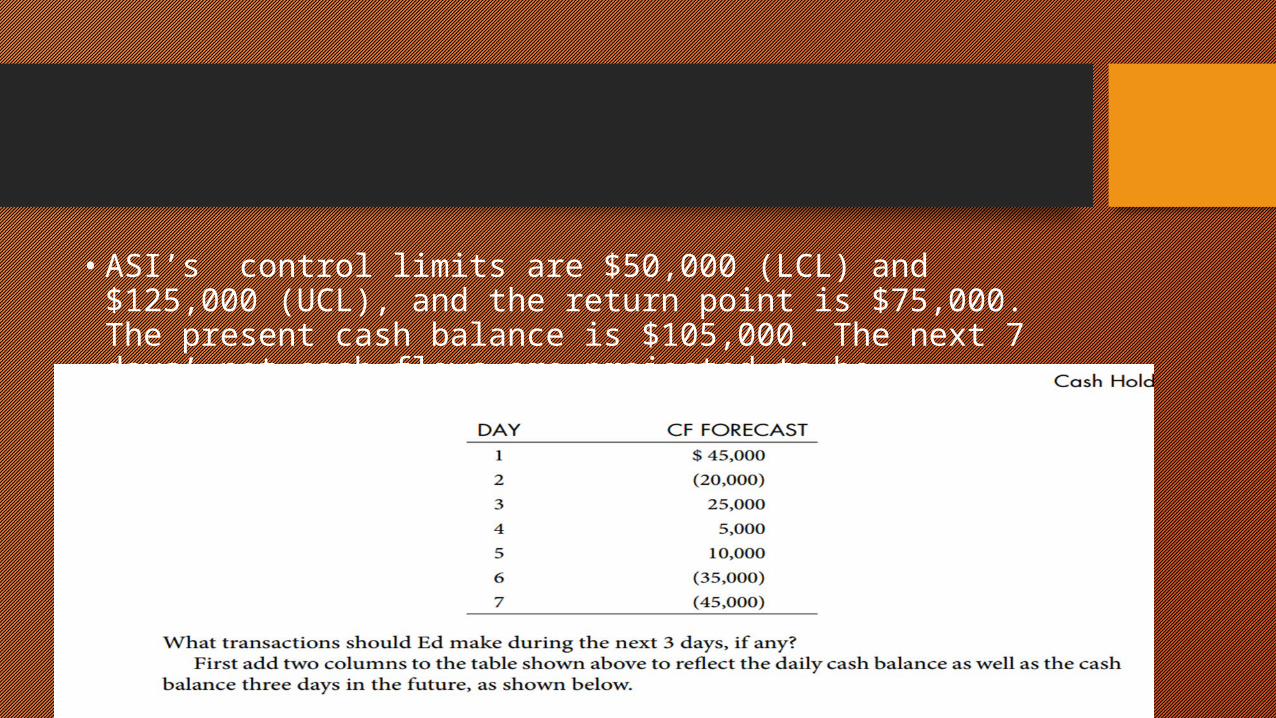
• ASI’s control limits are $50,000 (LCL) and $125,000 (UCL), and the return point is $75,000. The present cash balance is $105,000. The next 7 days’ net cash flows are projected to be
