asset holdings of young households: trends and patterns
TRANSCRIPT

Federal Reserve Bank of St. Louis REVIEW Fourth Quarter 2014 391
Asset Holdings of Young Households: Trends and Patterns
Ellen A. Merry and Logan Thomas
R ecent research focused on how young households fared throughout the GreatRecession has highlighted the losses this group incurred, in part because a largeshare of their assets was in housing. Emmons and Noeth (2013) find evidence that
homeownership rates in 2007 were elevated for younger households relative to earlier yearsafter controlling for other factors. The significant losses in wealth as a result of the GreatRecession have prompted many questions about how households, particularly younger house-holds and minorities, can rebuild and invest for the future.
This article builds on the existing work on portfolio choices of young households andfocuses on households’ decisions to hold a range of asset types, including both financial assets(e.g., bank accounts, stocks, and retirement accounts) and nonfinancial assets (e.g., residentialreal estate, businesses, and automobiles). While several recent articles on the 2007-09 recessionand recovery have focused on the losses and gains experienced by different groups, includingthe young, the possible changes in household decisions to hold different types of nonhousingassets in recent years have received less attention. The composition of asset ownership is impor-tant for both long-term economic mobility and the ability of households to weather temporary
The authors use multiple waves of the triennial Survey of Consumer Finances (SCF) from 1989 to2013 to examine the composition of the asset portfolios of young households whose head of householdis between 18 and 41 years of age. The focus is on households’ decisions to hold different types ofassets, including both financial assets (e.g., bank accounts, stocks, and retirement accounts) and non-financial assets (e.g., residential real estate, businesses, and automobiles). The authors describe thepatterns of acquisition of broad asset categories in the early part of the life cycle with attention to pat-terns that appear to have changed over time and explore how the propensity to hold different typesof assets varies across households. (JEL D14, D31, G11)
Federal Reserve Bank of St. Louis Review, Fourth Quarter 2014, 96(4), pp. 391-411.
Ellen A. Merry is a senior economist and Logan Thomas is a research assistant in the Division of Consumer and Community Affairs of the Board ofGovernors of the Federal Reserve System. The authors thank Arthur Kennickell, Kevin Moore, Trina Williams Shanks, and colleagues in the Board’sDivision of Consumer and Community Affairs for their comments and suggestions. This article was prepared for the symposium “The BalanceSheets of Younger Americans: Is the American Dream at Risk?” presented May 8 and 9, 2014, by the Center for Household Financial Stability andthe Research Division at the Federal Reserve Bank of St. Louis and the Center for Social Development at Washington University in St. Louis.
© 2014, The Federal Reserve Bank of St. Louis. The views expressed in this article are those of the author(s) and do not necessarily reflect the viewsof the Federal Reserve System, the Board of Governors, or the regional Federal Reserve Banks. Articles may be reprinted, reproduced, published,distributed, displayed, and transmitted in their entirety if copyright notice, author name(s), and full citation are included. Abstracts, synopses, andother derivative works may be made only with prior written permission of the Federal Reserve Bank of St. Louis.

financial shocks. For example, stocks have historically provided a greater return over time butalso involve a greater risk of loss over shorter time horizons. In contrast, bank accounts growmore slowly over time but offer a ready reserve for emergencies. Recent decades provide exam-ples of both positive and negative impacts of asset price changes on household balance sheetsdepending on the degree of exposure to different asset classes.
We use the triennial Survey of Consumer Finances (SCF) to examine the composition ofthe asset portfolios of young households whose head of household is between 18 and 41 yearsof age over the years 1989 to 2013. While the SCF does not follow the same households overthis entire period, it does allow us to study different cohorts or groups of young adults whoentered adulthood at different points in time. The next two sections describe the asset cate-gories used in the analysis and the young adults included in the measures of asset ownershipconstructed with the SCF data. We then describe the patterns of acquisition of broad assetcategories in the early part of the life cycle with attention to patterns that appear to havechanged over time and explore how the propensity to hold different types of assets variesacross households.
DATA AND DESCRIPTIONS OF ASSET CATEGORIESThis article uses data from the Federal Reserve Board’s SCF collected from 1989 through
2013 to examine the composition of household assets. The SCF is a triennial cross-sectionalsurvey of households that includes detailed information on assets, liabilities, and income aswell as attitudes toward saving, credit, and risk. The SCF uses a two-part sampling frame andoversamples wealthy households in an effort to measure the wealth holdings concentratedamong households at the top of the wealth distribution. As Kennickell (2009) notes, since 1989the SCF has been conducted using comparable methodologies that facilitate comparisonsover time.1
The SCF measures both assets and liabilities. Although not provided here, a completetreatment of asset ownership would involve examining the relationship between the use ofdebt—particularly secured debt—and asset holdings. Much recent work on household balancesheets has focused on the role of home leverage and its implications for households’ ability toenter, sustain, and benefit financially from homeownership.2 Other assets, such as businessesand vehicles, are also often financed by loans.
As a complement to this literature on the distribution of and changes in net worth, ourfocus here is on the composition of household assets to better understand which householdsare exposed to the potential financial risks and rewards that accompany the decision to allocatewealth to a particular asset type. For assets that may have associated secured debt, we focuson the ownership of the asset, not the value, for two reasons. First, assets may yield serviceflows or income (in the case of a business) even if their net equity value is zero or negative.3Second, we are interested in exposure to the potential risks and rewards of asset ownershipover the longer term, not necessarily the value of the asset if it were liquidated at the time ofthe survey. Negative net equity positions in assets can be a serious concern for householdfinancial security and can be associated with bankruptcy, foreclosure, and other types of
Merry and Thomas
392 Fourth Quarter 2014 Federal Reserve Bank of St. Louis REVIEW

financial distress. However, the focus on ownership here is intended to be a complement to,not a substitute for, other work focused on values and net worth.
While the SCF includes very detailed information on many types of assets, for the purposeof this study, assets are grouped into several broad categories. This aggregation approach issimilar to that used by Gouskova, Juster, and Stafford (2006) in their analysis of householdportfolios using the Panel Study of Income Dynamics. The seven categories and the componentasset types that comprise each one are listed in Table 1 and discussed below.
Transaction Accounts and CDs
Following Bricker et al. (2012), the category for transaction accounts is composed ofchecking, savings, and money market deposit accounts plus money market mutual funds andcash or call accounts at brokerage firms. In addition to transaction accounts, certificates ofdeposit (CDs) are also included in this category. Transaction accounts are characterized bythe immediate availability of their funds and generally stable asset values. Although CDs maybe subject to early withdrawal penalties, they are not subject to the fluctuations in value thatoccur with some other financial assets such as bonds, stocks, and non-money market mutualfunds. These characteristics of liquidity, immediate (or rapid) availability of funds, and stabilityof asset values make these financial products readily accessible. However, the lack of exposureto market fluctuations implies that these assets yield a lower rate of return than some riskierassets. The lower return raises the likelihood that the real rate of return for households withtransactions accounts and CDs may be negative over some periods if the nominal after-taxrate of return is lower than the inflation rate.
Vehicles
For most SCF respondents, the vehicles asset category reflects ownership of an automobile.However, this asset category also includes motor homes, recreational vehicles, airplanes, and
Merry and Thomas
Federal Reserve Bank of St. Louis REVIEW Fourth Quarter 2014 393
Table 1
Asset Categories
Broad asset category Assets included
Transaction accounts and CDs Checking, savings, and money market deposit accounts; money market mutual fund and call accounts; CDs
Vehicles Autos, motor homes, recreational vehicles, airplanes, or boats
Residential real estate Owner-occupied or other residential real estate
Retirement accounts Quasi-liquid retirement accounts, including IRAs and Keogh, thrift, 401(k), 403(b), and supplemental retirement accounts
Bonds, stocks, and mutual funds Bonds (including savings bonds), stocks, and non-money market mutual funds
Business equity and nonresidential real estate Business equity or nonresidential real estate
Other assets Cash value of life insurance, other managed assets (e.g., trusts, annuities),and other financial or nonfinancial assets

boats. Unlike many of the other asset categories, vehicles typically offer little opportunity forappreciation in the value of the asset over time unless they are vintage or collectible models.Although automobiles may be a poor store of value based on their likely depreciation and needfor upkeep, they can have important impacts on financial security and economic opportunitybeyond the market value reflected on the household balance sheet. For example, Pendell et al.(2014) find that automobile access has effects on the economic opportunities available tohousing voucher recipients.
Wolff (2006) excludes automobiles, appliances, and other consumer durables from house-hold wealth, noting that such assets may be more valuable for their service flow than as a sourceof potential funds were they to be sold. However, Kennickell (2009) notes that vehicles are aparticularly important component of wealth for low-income and low-wealth groups and thatother assets—particularly owner-occupied housing—also yield a flow of services. Many youngadults have low wealth or low income as they enter adulthood; therefore, including vehicleswould seem important for a study of asset holdings of this population.
Residential Real Estate
The residential real estate category includes both owner-occupied homes and other residen-tial real estate. These other residential properties could include second or vacation homes andany properties that may be used as rental properties for additional income. For all SCF wavesused in this study, almost all households who own residential real estate own their homes. Whilesome respondents do own other residential real estate in addition to their home, only 1 to 2percent of young households own other residential real estate without also owning their home.
Retirement Accounts
The retirement accounts category includes tax-deferred retirement accounts such as indi-vidual retirement accounts (IRAs), Keogh, thrift, 401(k), 403(b), and supplemental retirementaccounts.4 The underlying assets in these accounts vary and include stocks, bonds, and mutualfunds. However, because institutional factors can play such a significant role in the acquisitionof assets in retirement accounts, they are treated as a distinct category. Employer-sponsoredplans such as 401(k)s may have features that may include automatic payroll deductions, match-ing, and automatic enrollment that encourage employees to enroll and contribute a portionof their salary to saving in the plan. IRA owners may have more latitude than participants in401(k)s or other employer-sponsored plans to choose the fund company and asset allocation.However, Holden and Bass (2014) find that few investors in traditional IRAs contribute to theseplans, and most new traditional IRA accounts are created with rollovers from employer-sponsored plans. Thus, access to and participation in employer-sponsored retirement planscan have a significant impact on whether households have assets in various types of retirementaccounts.
Bonds, Stocks, and Mutual Funds
While many households who hold bonds and stocks do so in tax-deferred retirementaccounts, some households hold these assets directly. Holdings of these assets outside retire-
Merry and Thomas
394 Fourth Quarter 2014 Federal Reserve Bank of St. Louis REVIEW

ment accounts are captured in the bonds, stocks, and mutual funds category. This asset cate-gory includes U.S. savings bonds, municipal and corporate bonds, directly held stocks, andnon-money market mutual funds held outside a retirement account.
Business Equity and Nonresidential Real Estate
Following Bricker et al. (2012), business equity in the SCF reflects the ownership of a rangeof business types, including sole proprietorships, partnerships, and privately held corpora-tions. Nonresidential real estate includes commercial properties, residential structures withmore than five units, and undeveloped land. Farm and ranch land, as well as assets associatedwith agricultural businesses, are also included in this category. Bricker et al. (2012) also notethat because nonresidential real estate investments may have multiple owners and may be high-value investments associated with large mortgages that are paid out of the income from theproperty, these assets may more closely resemble a business than residential investment prop-erties. For this reason, ownership of privately held businesses and nonresidential real estate isgrouped together into a single asset category for our analysis.
The summary data extracts of SCF data used here compute the value of business equityand nonresidential real estate net of any associated debt. Although most households who holdthese assets have positive net equity in them, for some asset holders these categories havenegative or zero net asset values. As noted previously, we use a measure of ownership of theasset, not its value, so households with no net equity in the business are still included as own-ing assets in this category.
Other Assets
The remaining category of “other assets” includes all other financial assets, such as thecash value of life insurance policies, deferred compensation, and trusts, plus all other nonfinan-cial assets, such as jewelry, artwork, and various collections (e.g., baseball cards, records, andwine).
While the SCF provides detailed information on the broad range of asset types listedabove, some sources of wealth are not included. Kennickell (2009) notes that the SCF does notmeasure, or provides only limited information on, particular forms of wealth.5 For example,the survey includes questions about whether members of the household are covered by a pen-sion plan, but the value of defined benefit pensions is not measured. Similarly, educationalattainment is included, but the value of human capital is not measured. Even though the assetcategories included here may be incomplete, they nonetheless reflect many of the major storesof wealth for households across the wealth distribution.
YOUNG HOUSEHOLDS IN THE SCFIn the following descriptions of asset holding, a portion of the young adult population is
reflected in the asset measures provided by the SCF and a portion may be missing because ofthe survey design. Dettling and Hsu (2014) note that the SCF’s design captures the asset hold-ings of young adults who have formed independent households but is not well suited for
Merry and Thomas
Federal Reserve Bank of St. Louis REVIEW Fourth Quarter 2014 395

studying the balance sheets of young adults living with parents or roommates. When youngadults are still included in their parents’ household, their asset information may be collectedbut cannot be separately identified. Asset data for those living with roommates are collectedonly for the head of the household, who is defined as the oldest member of the household.Thus, the asset measures for young households presented in this article reflect only the hold-ings of independent households in which the head is between 18 years of age and their early40s. This includes married, cohabitating, and single-person households, as well as some headsof household who may live with younger roommates not captured in the survey.
The lack of information on asset ownership for young adults not living in independenthouseholds may affect profiles of asset acquisition for several reasons. First, the characteristicsand asset ownership patterns of young adults who form independent households may differfrom those living with parents or roommates. Dettling and Hsu (2014) compare median wageincome measures for young adults (18 to 31 years of age) in the Census Bureau’s CurrentPopulation Survey (CPS) with estimates of wage income for individual young adults in the SCFand find that this income measure in the SCF is higher by around $10,000 over the 2001-10period. This finding may suggest that the young adult households included in the SCF maybe doing better on average than young adults living with parents or roommates who are notincluded in the SCF.
Second, if household formation patterns change, then the households reporting assetholdings will change, potentially altering the composition of the sampled population. Dettlingand Hsu (2014) note that household formation patterns have changed since 2001: Young adults18 to 31 years of age are more likely to be living with parents in more recent years. However,they also examine the wage data previously mentioned and find that the $10,000 difference inwage income between young adults in the CPS and SCF has been relatively stable over time.This could imply that even with the recent changes in household formation, the compositionof the underlying population of independent households has not necessarily changed markedly.
Finally, the characteristics of young adults may differ based on the age at which they formindependent households. If so, profiles of asset acquisition reflect both changes in the likeli-hood of owning assets as people age and changes in the composition of the households weobserve. For example, young adults who attend college may be less likely to be sampled whenthey are 18 to 23 years of age as they may still be dependent on their parents. Once they grad-uate and are employed, they may form households. College graduates may be more likely tohave access to and participate in retirement savings plans at work than the population that didnot attend college. This could imply that our observed increase in ownership of retirementaccounts between the 18- to 23-year age group and the 24- to 29-year age group is affected bythe entry into the sample of households who are more likely to own retirement accounts, andnot just an increase in ownership of retirement assets with age.
Because we are not able to track individual households over time in the SCF, we cannotdistinguish the “newly formed” households from those who formed households at earlier ages.Thus, the profile of asset ownership should be interpreted as a series of snapshots of younghouseholds that can be observed over time, recognizing that the snapshots reflect an increasingshare of the young adult population as it ages and that the composition of the observed groupsmay be changing across time.
Merry and Thomas
396 Fourth Quarter 2014 Federal Reserve Bank of St. Louis REVIEW

OVERVIEW OF TRENDS AND PATTERNS IN ASSET HOLDINGSWe first examine ownership of each asset category, where we see wide differences in the
incidence of ownership between asset types and some indications of changes over time.Figure 1 shows ownership of the various asset categories from 1989 through 2013 for house-holds whose head is between 18 and 41 years of age.6,7
Two categories—transaction accounts and CDs and vehicles—have the highest ownershiprates over all waves of the SCF. Figure 1 clearly shows that these two assets are the most com-monly held asset categories among those 18 to 41 years of age. Ownership of transactionaccounts and CDs exceeded 80 percent for this entire period, trending up from 82 percent in1989 to around 90 percent in 2013. Vehicle ownership also was above 80 percent over this time,registering between 83 and 86 percent with a dip to 81 percent in 1998. Ownership of vehiclesalso declined a bit between 2007 and 2010 before increasing again in the 2013 survey.
Residential real estate is the third most commonly held asset type; ownership rates for younghouseholds hovered around 50 percent over most of this period. Ownership rates in 2004 and2007 were around 52 percent but declined to 48 percent in 2010 and 46 percent in 2013.
Ownership of retirement accounts increased from 36 percent in 1989 to around 52 percentin 2001. Ownership has dropped a bit in more recent years. In 2013, 44 percent of young house-holds had assets in this fourth most common asset category.
Merry and Thomas
Federal Reserve Bank of St. Louis REVIEW Fourth Quarter 2014 397
0
20
40
60
80
100
Percent
1989 1992 1995 1998 2001 2004 2007 2010 2013
Transaction Accounts and CDs Vehicles
Residential Real Estate Retirement Accounts
Bonds, Stocks, and Mutual Funds Other Assets
Business Equity and Nonresidential Real Estate
Figure 1
Ownership of All Asset Categories: All Ages 18-41 Years
SOURCE: SCF.

Ownership of the three less widely held asset categories declined over this period. Owner -ship rates for the bonds, stocks, and mutual funds category ranged from 34 to 37 percent from1989 to 2001 but declined in more recent years to around 20 percent in 2013. Ownership ofother assets declined as well, falling steadily from 46 percent in 1989 to 22 percent in 2013.Business equity and nonresidential real estate, now the least commonly held asset category,also registered a decline in ownership rates: from 18 percent of young households in 1989 to15 percent in 2007 and 11 percent in 2013.
Ownership Over the Life Cycle
We construct cohorts based on the years that respondents enter adulthood to examinelife cycle patterns of ownership. While we cannot follow the same households over time, weare able to follow the cohorts over time as samples in each successive SCF are weighted to berepresentative of the underlying population of young households. Using 6-year age groupings,we compute asset ownership rates for eight cohorts in the 18- to 41-year age range duringone or more waves of the SCF between 1989 and 2013 (Table 2). In the accompanying figures,cohorts are identified by the year in which the members of that cohort were 18 to 23 years ofage. The oldest cohort observed during ages 18 to 41 is the group of young adults who werebetween 36 and 41 years of age in 1989; the youngest cohort appears initially in the 2013 survey.Two cohorts—those 18 to 23 years of age in 1989 and those 18 to 23 years of age in 1995—canbe followed throughout their early adult years in the triennial SCF surveys.
Because the cohorts are defined by 6-year groupings of birth years, we defined 6-year agegroups of young adults (18-23, 24-29, 30-35, and 36-41 years) to follow them through theirearly adult years. The labeled tick marks on the figures reflect the ages of the cohorts in the1989, 1995, 2001, 2007, and 2013 waves of the SCF. Since the SCF is collected every three years,cohorts “age into” the next age group every other wave of the SCF. The unlabeled tick marks
Merry and Thomas
398 Fourth Quarter 2014 Federal Reserve Bank of St. Louis REVIEW
Table 2
Six-Year Age Cohorts
Year cohort was SCF waves when cohort was Birth years 18-23 years of age 18-41 years of age (44)
1948-53 1971 1989 (1992)
1954-59 1977 1989-95 (1998)
1960-65 1983 1989-2001 (2004)
1966-71 1989 1989-2007 (2010)
1972-77 1995 1995-2013
1978-83 2001 2001-13
1984-89 2007 2007-13
1990-95 2013 2013
NOTE: Ownership rates for the four older cohorts are also included for years when the head was between 39 and 44years of age, as noted in parentheses.

reflect measures for that cohort from the other waves of the SCF (1992, 1998, 2004, and 2010)when the cohort was between two age groups. For example, those in the 18- to 23-year groupin 1989 were between 21 and 26 years of age in 1992 and between 24 and 29 years of age in1995. The individual lines follow the same cohort over time through the various waves of theSCF as the cohort ages. While our focus is on households in the 18- to 41-year age range, weinclude observations for cohorts who are 39 to 44 years of age in 1992, 1998, 2004, and 2010.While this extends the age range slightly, it also allows us to observe the changes in ownershipfrom 2007 to 2010 for all cohorts observed in 2007. This period is noteworthy as it captureschanges to household balance sheets that may have occurred around the Great Recession.
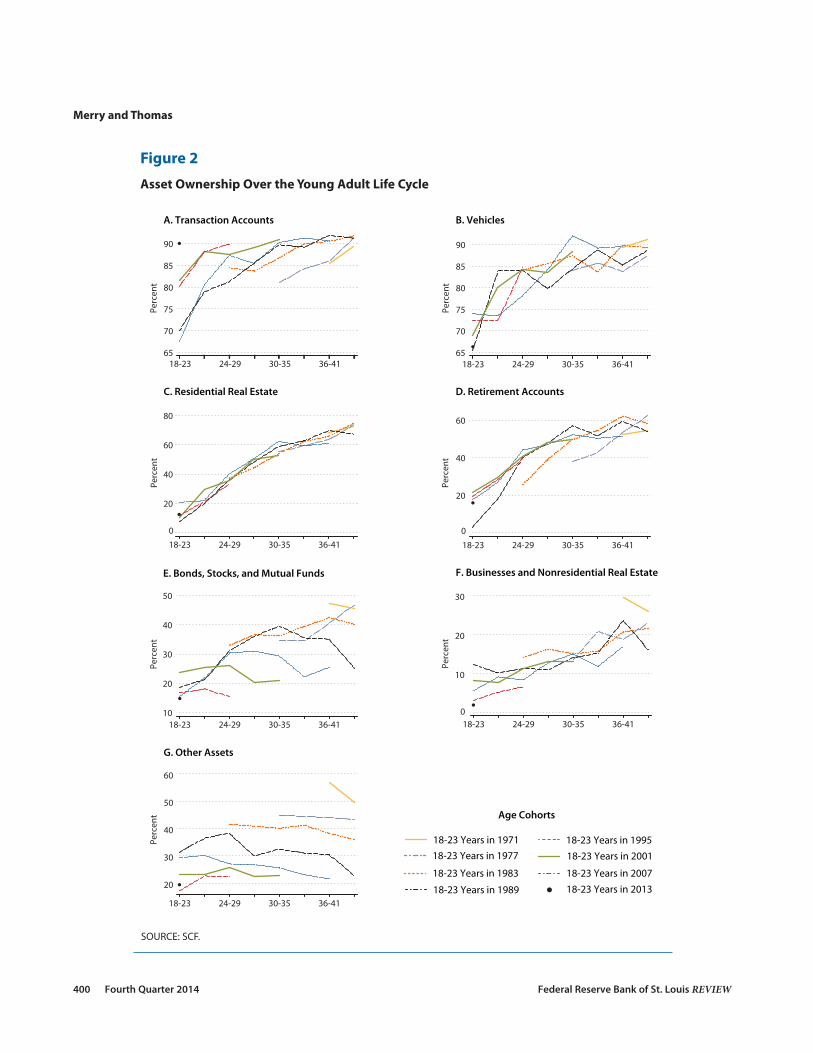
Figure 2 shows asset ownership profiles for all cohorts across the seven asset categories.Ownership rates for transaction accounts and CDs are relatively high even for the youngesthouseholds in the SCF and increase over the early part of the adult life cycle (Figure 2A). Forall cohorts observed in their 20s, ownership rates for this asset category are above 65 percentfor households 18 to 23 years of age and climb above 80 percent by the time they reach theirlate 20s. Increases in ownership as households age into their 30s and early 40s are smaller, withownership rates around 85 to just above 90 percent by the late 30s or early 40s.
As with ownership of transaction accounts, vehicle ownership is relatively high for veryyoung adults (Figure 2B). Around 65 to 75 percent of those in the 18- to 23-year age groupown vehicles; this proportion increases to around 85 or 90 percent by the early to mid-30s.
Ownership patterns for residential real estate follow a distinct pattern of acquisition overthe early adult life cycle (Figure 2C). Rates of ownership increase substantially from the earliestage group to the oldest: from between 10 and 20 percent for the 18- to 23-year age group to60 to 75 percent by the early 40s.
As with real estate, ownership of retirement accounts rises steadily over the early adult lifecycle (Figure 2D). Rates of ownership are low early—around 20 percent or below for those 18to 23 years of age—but increase to about 50 to 60 percent by the mid-30s and early 40s.
While a sizable share of young adult households have acquired transaction accounts, vehi-cles, homes, and retirement accounts by the time they reach their 40s, ownership of the remain-ing three asset types is less prevalent across this population. Ownership rates of bonds, stocks,and mutual funds also trend upward as households move through the early adult portion ofthe life cycle, although ownership rates have dropped off noticeably in recent years (Figure 2E).
Ownership of business equity and nonresidential real estate increases with age, althougheven by the late 30s or early 40s, ownership rates are lower than the other six asset categories(Figure 2F).
Ownership rates for the other assets category decline between the older cohorts and theyounger ones (Figure 2G). This declining trend in ownership over time is the dominant patternin the holdings of other assets for young households, and thus Figure 2G does not indicate anyparticular life cycle profile of acquisition.
Changes in Ownership Patterns Over Time
While Figure 2 follows particular cohorts as they age, the remaining figures focus on thepatterns for particular age groups across all nine waves of the SCF from 1989 to 2013. Owner -
Merry and Thomas
Federal Reserve Bank of St. Louis REVIEW Fourth Quarter 2014 399
Merry and Thomas
400 Fourth Quarter 2014 Federal Reserve Bank of St. Louis REVIEW
65
70
75
80
85
90
18-23 24-29 30-35 36-4165
70
75
80
85
90
0
20
40
60
80
0
20
40
60
10
20
30
40
50
0
10
20
30
20
30
40
50
60
18-23 Years in 1989
18-23 Years in 197718-23 Years in 199518-23 Years in 2001
18-23 Years in 1983 18-23 Years in 2007
18-23 Years in 1971
18-23 Years in 2013
18-23 24-29 30-35 36-41
18-23 24-29 30-35 36-41 18-23 24-29 30-35 36-41
18-23 24-29 30-35 36-41 18-23 24-29 30-35 36-41
18-23 24-29 30-35 36-41
Age Cohorts
A. Transaction Accounts B. Vehicles
C. Residential Real Estate D. Retirement Accounts
E. Bonds, Stocks, and Mutual Funds F. Businesses and Nonresidential Real Estate
G. Other Assets
Perc
ent
Perc
ent
Perc
ent
Perc
ent
Perc
ent
Perc
ent
Perc
ent
Figure 2
Asset Ownership Over the Young Adult Life Cycle
SOURCE: SCF.

ship of transaction accounts and CDs increased across all four age groups, but the increasewas most pronounced for those in the 18- to 23-year age group (Figure 3).8,9 This rise inownership and earlier acquisition of transaction accounts and CDs may be related to theincreased use of direct deposit over time, whereby employees are required to have some typeof transaction account. Hogarth, Anguelov, and Lee (2005) note that changes in governmentpolicy, such as the move to electronic benefits transfers, may have increased ownership oftransaction accounts, and they document the increase in account ownership over time in thebroader population as well.
Vehicle ownership rates show some differences over time (Figure 4). Mannering, Winston,and Starkey (2002) document the rise in consumer auto leasing over the 1990s. The SCF dataon vehicle leasing (not shown) show a sharp rise in the share of households with leased vehiclesbetween 1992 and 1998. This share remained elevated into the early 2000s, so leasing may havecontributed to the estimates showing a lower propensity to own vehicles for some age groupsduring this period. While strong trends are not evident in the pattern of vehicle acquisitionbetween the earlier and later years, vehicle ownership rates are lower for the 18- to 23-year agegroup in recent waves of the SCF.
Ownership rates for residential real estate have remained generally consistent over timefor the younger age groups in their 20s (Figure 5). Ownership rates climb markedly for younghouseholds in their 30s and early 40s. Therefore, it is not surprising that the impact of the
Merry and Thomas
Federal Reserve Bank of St. Louis REVIEW Fourth Quarter 2014 401
60
70
80
90
100
1989
18-23 Years 24-29 Years 30-35 Years 36-41 Years
60
70
80
90
100
60
70
80
90
100
60
70
80
90
100
19952001
20072013
19891995
20012007
20131989
19952001
20072013
19891995
20012007
2013
Perc
ent
Age Groups
Figure 3
Ownership of Transaction Accounts and CDs
NOTE: Vertical bars represent 95 percent confidence intervals for the means of the groups.
SOURCE: SCF.

402 Fourth Quarter 2014 Federal Reserve Bank of St. Louis REVIEW
Elliott, Lewis, Grinstein-Weiss, Nam
0
20
40
60
80
1989
18-23 Years 24-29 Years 30-35 Years 36-41 Years
0
20
40
60
80
0
20
40
60
80
0
20
40
60
80
19952001
20072013
19891995
20012007
20131989
19952001
20072013
19891995
20012007
2013
Perc
ent
Age Groups
Figure 5
Ownership of Residential Real Estate
NOTE: Vertical bars represent 95 percent confidence intervals for the means of the groups.
SOURCE: SCF.
60
70
80
90
100
1989
18-23 Years 24-29 Years 30-35 Years 36-41 Years
60
70
80
90
100
60
70
80
90
100
60
70
80
90
100
19952001
20072013
19891995
20012007
20131989
19952001
20072013
19891995
20012007
2013
Perc
ent
Age Groups
Figure 4
Ownership of Vehicles
NOTE: Vertical bars represent 95 percent confidence intervals for the means of the groups.
SOURCE: SCF.

Merry and Thomas
Federal Reserve Bank of St. Louis REVIEW Fourth Quarter 2014 403
10
20
30
40
50
1989
18-23 Years 24-29 Years 30-35 Years 36-41 Years
10
20
30
40
50
10
20
30
40
50
10
20
30
40
50
19952001
20072013
19891995
20012007
20131989
19952001
20072013
19891995
20012007
2013
Perc
ent
Age Groups
Figure 7
Ownership of Bonds, Stocks, and Mutual Funds
NOTE: Vertical bars represent 95 percent confidence intervals for the means of the groups.
SOURCE: SCF.
0
20
40
60
80
1989
18-23 Years 24-29 Years 30-35 Years 36-41 Years
0
20
40
60
80
0
20
40
60
80
0
20
40
60
80
19952001
20072013
19891995
20012007
20131989
19952001
20072013
19891995
20012007
2013
Perc
ent
Age Groups
Figure 6
Ownership of Retirement Accounts
NOTE: Vertical bars represent 95 percent confidence intervals for the means of the groups.
SOURCE: SCF.
Merry and Thomas
404 Fourth Quarter 2014 Federal Reserve Bank of St. Louis REVIEW
10
20
30
40
60
1989
18-23 Years 24-29 Years 30-35 Years 36-41 Years
10
20
30
40
60
10
20
30
40
60
10
20
30
40
60
19952001
20072013
19891995
20012007
20131989
19952001
20072013
19891995
20012007
2013
Perc
ent
50 50 50 50
Age Groups
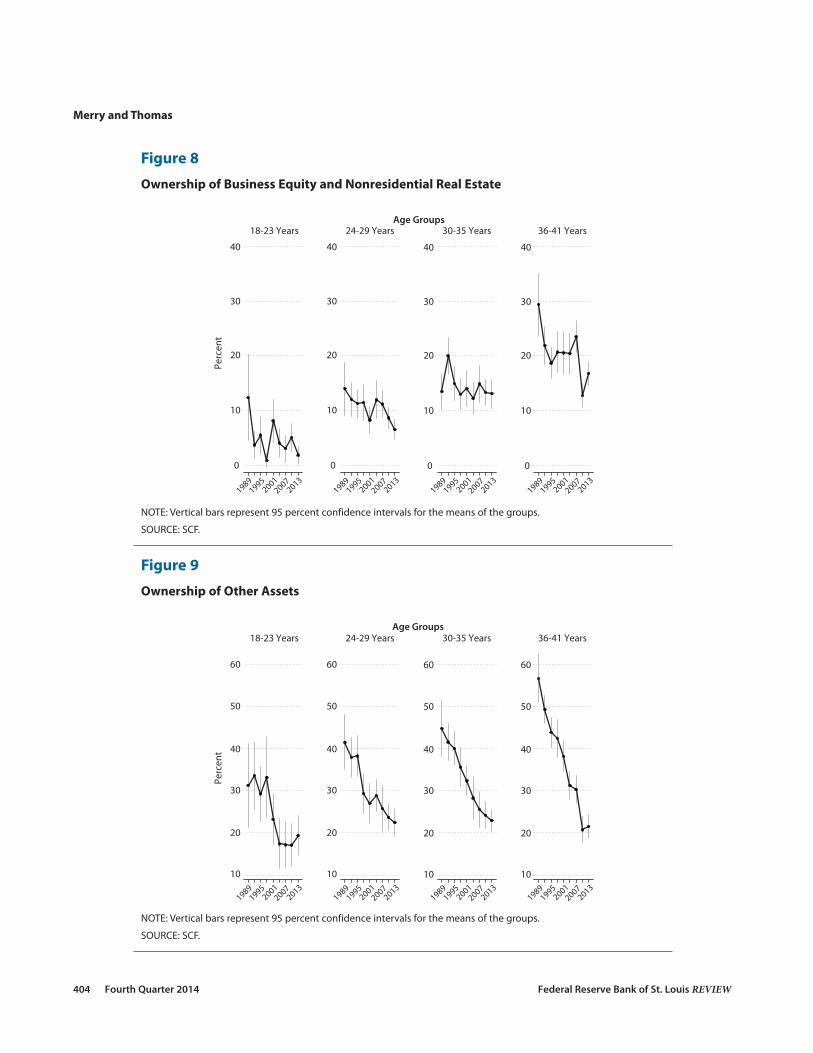
Figure 9
Ownership of Other Assets
NOTE: Vertical bars represent 95 percent confidence intervals for the means of the groups.
SOURCE: SCF.
0
10
20
30
40
1989
18-23 Years 24-29 Years 30-35 Years 36-41 Years
0
10
20
30
40
0
10
20
30
40
0
10
20
30
40
19952001
20072013
19891995
20012007
20131989
19952001
20072013
19891995
20012007
2013
Perc
ent
Age Groups
Figure 8
Ownership of Business Equity and Nonresidential Real Estate
NOTE: Vertical bars represent 95 percent confidence intervals for the means of the groups.
SOURCE: SCF.

Great Recession appears to have been felt by these groups, as evidenced by the drop in theirownership rates after 2007.
As with transaction accounts, ownership of retirement accounts has trended up over timefor the younger age groups (Figure 6). Ownership rates for all age groups peaked in 2001, justafter the rise in stock prices of the late 1990s. Ownership rates for the two older age groupshave trended down somewhat since then.
The remaining three asset types are less widely held among young households, and theirownership rates have also fallen over time. Ownership rates for bonds, stocks, and mutualfunds have dropped substantially, particularly for the older age groups (Figure 7). As withretirement accounts, much of this decline has occurred since 2001. Although the patterns overtime are not as pronounced as with some other asset categories, ownership rates of businessand nonresidential real estate have also trended lower over time (Figure 8). Ownership of otherassets has dropped steadily over time (Figure 9), driven primarily by the decline in ownershipof life insurance (not shown). Ownership rates for the broad other financial and other non -financial components of this category have declined over time as well.
Differences in Asset Holdings Across Households
Portfolio composition can vary substantially across different demographic groups. Edu -cation and race are two household characteristics often considered in discussions of wealthholding. To briefly explore how asset holdings may differ across households in the SCF basedon these characteristics, we focus on the young households whose head of household is between36 and 41 years of age. We focus on this group to possibly avoid some of the complications ofdifferences in the timing of household formation across different segments of the populationsince many adults have formed independent households by this age. This age group also pro-vides a snapshot of overall asset ownership patterns just as many of these households areentering their middle years of work and raising families.
Figure 10 provides an overall look at the mean rate of ownership of the seven differentasset types for households in the 36- to 41-year age group whose head of household has a col-lege degree (the blue outer line) and for those households whose head does not have a collegedegree (the red inner line). Households whose head has a college degree have higher rates ofownership of all asset types relative to those households whose head does not have a degree.10The differences in ownership rates are smaller for the vehicles and transaction accounts andCDs categories (4 percentage points and 14 percentage points, respectively) but larger for res-idential real estate (26 percentage points), the third most commonly held asset for householdsin this age group.
Large differences in ownership rates are particularly evident for the financial assets in theretirement accounts category (40 percentage points) and the bonds, stocks, and mutual fundscategory (34 percentage points). As noted earlier, both of these asset categories can containsome of the same types of underlying securities, but retirement accounts have a number ofdistinguishing institutional features that can set them apart. Some of these features—particu-larly automatic enrollment and payroll deductions—may be important for spurring asset own-ership. That said, some employers do not offer retirement plans, and Copeland (2013) finds
Merry and Thomas
Federal Reserve Bank of St. Louis REVIEW Fourth Quarter 2014 405
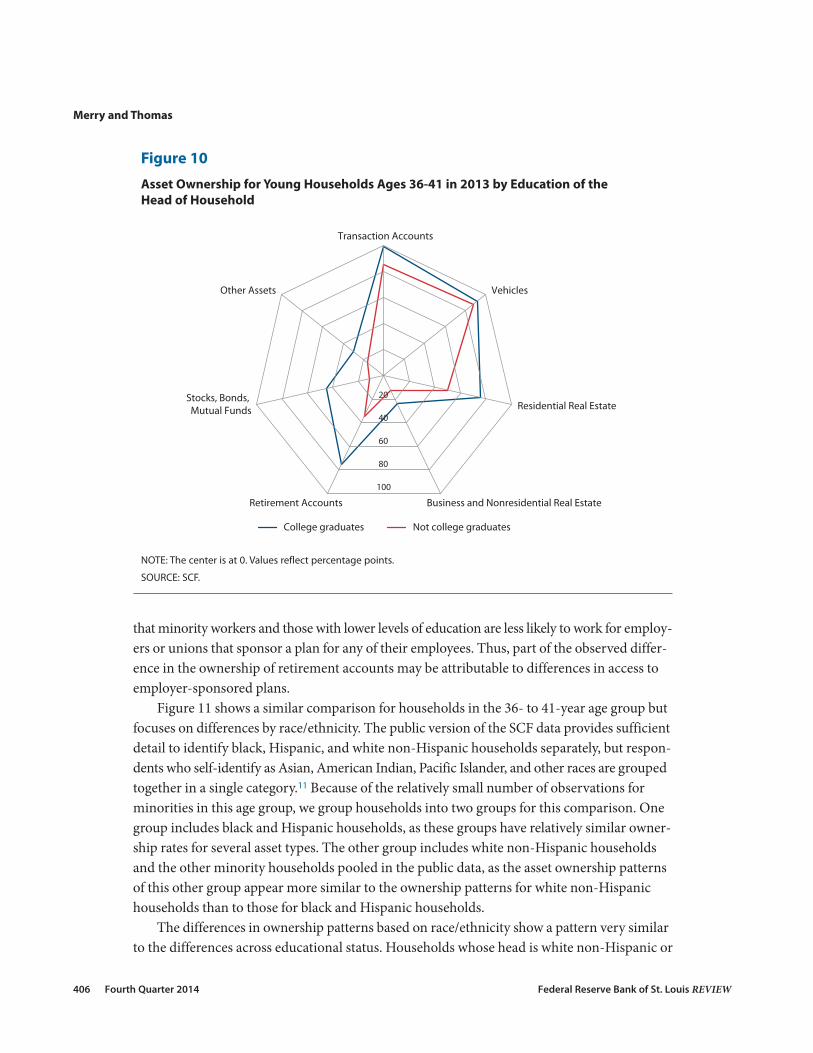
that minority workers and those with lower levels of education are less likely to work for employ-ers or unions that sponsor a plan for any of their employees. Thus, part of the observed differ-ence in the ownership of retirement accounts may be attributable to differences in access toemployer-sponsored plans.
Figure 11 shows a similar comparison for households in the 36- to 41-year age group butfocuses on differences by race/ethnicity. The public version of the SCF data provides sufficientdetail to identify black, Hispanic, and white non-Hispanic households separately, but respon-dents who self-identify as Asian, American Indian, Pacific Islander, and other races are groupedtogether in a single category.11 Because of the relatively small number of observations forminorities in this age group, we group households into two groups for this comparison. Onegroup includes black and Hispanic households, as these groups have relatively similar owner-ship rates for several asset types. The other group includes white non-Hispanic householdsand the other minority households pooled in the public data, as the asset ownership patternsof this other group appear more similar to the ownership patterns for white non-Hispanichouseholds than to those for black and Hispanic households.
The differences in ownership patterns based on race/ethnicity show a pattern very similarto the differences across educational status. Households whose head is white non-Hispanic or
Merry and Thomas
406 Fourth Quarter 2014 Federal Reserve Bank of St. Louis REVIEW
Transaction Accounts
Vehicles
Residential Real Estate
Business and Nonresidential Real EstateRetirement Accounts
Stocks, Bonds, Mutual Funds
Other Assets
20
40
60
80
100
College graduates Not college graduates
Figure 10
Asset Ownership for Young Households Ages 36-41 in 2013 by Education of the Head of Household
NOTE: The center is at 0. Values reflect percentage points.
SOURCE: SCF.

one of the other minority groups (the blue outer line) have higher ownership rates of all assettypes relative to black and Hispanic households (the red inner line).12As with education, thelargest differences in ownership rates are in the categories for retirement accounts (35 percent-age points), residential real estate (29 percentage points), and bonds, stocks, and mutual funds(29 percentage points). Differences in ownership rates for transaction accounts and CDs andvehicles are smaller (10 percentage points and 7 percentage points, respectively).
Racial differences in wealth and asset ownership are well documented in the existing litera-ture; this previous work suggests some possible reasons for the sizable differences in the prob-ability of ownership of assets. For example, Menchik and Jianakoplos (1997) note that whitehouseholds are more likely to have either received or expect to receive some type of inheritance,which may increase their chances of owning any given asset type. Houses are a noteworthyexample, as inheritances and other types of wealth transfers are commonly used for downpayments on real estate purchases. Also, Caskey (1997) finds that some black and Hispanichouseholds do not save because of social network pressure to share any such savings.
Basic comparisons of differences in asset ownership rates such as those included here foreducation and race/ethnicity exclude many other important factors that may be helpful inexplaining the variation in household portfolios. These factors include differences in income;
Merry and Thomas
Federal Reserve Bank of St. Louis REVIEW Fourth Quarter 2014 407
20
40
60
80
100
Transaction Accounts
Vehicles
Residential Real Estate
Business and Nonresidential Real EstateRetirement Accounts
Stocks, Bonds, Mutual Funds
Other Assets
White or Other Black or Hispanic
Figure 11
Asset Ownership for Young Households Ages 36-41 in 2013 by Race/Ethnicity of theHead of Household
NOTE: The center is at 0. Values reflect percentage points.
SOURCE: SCF.
geographic location, which can affect the cost and availability of transportation and housing;and participation in government programs, which can include asset limits as a condition ofeligibility. However, these basic comparisons suggest the need for additional attention to theportfolio choice challenges and opportunities faced by households across the income andwealth distributions. The asset classes with the greatest differences in ownership rates in thesecomparisons (i.e., retirement accounts, residential real estate, and bonds, stocks, and mutualfunds) are also the categories with the potential for significant long-run appreciation, whichcan contribute to household economic security over time.13
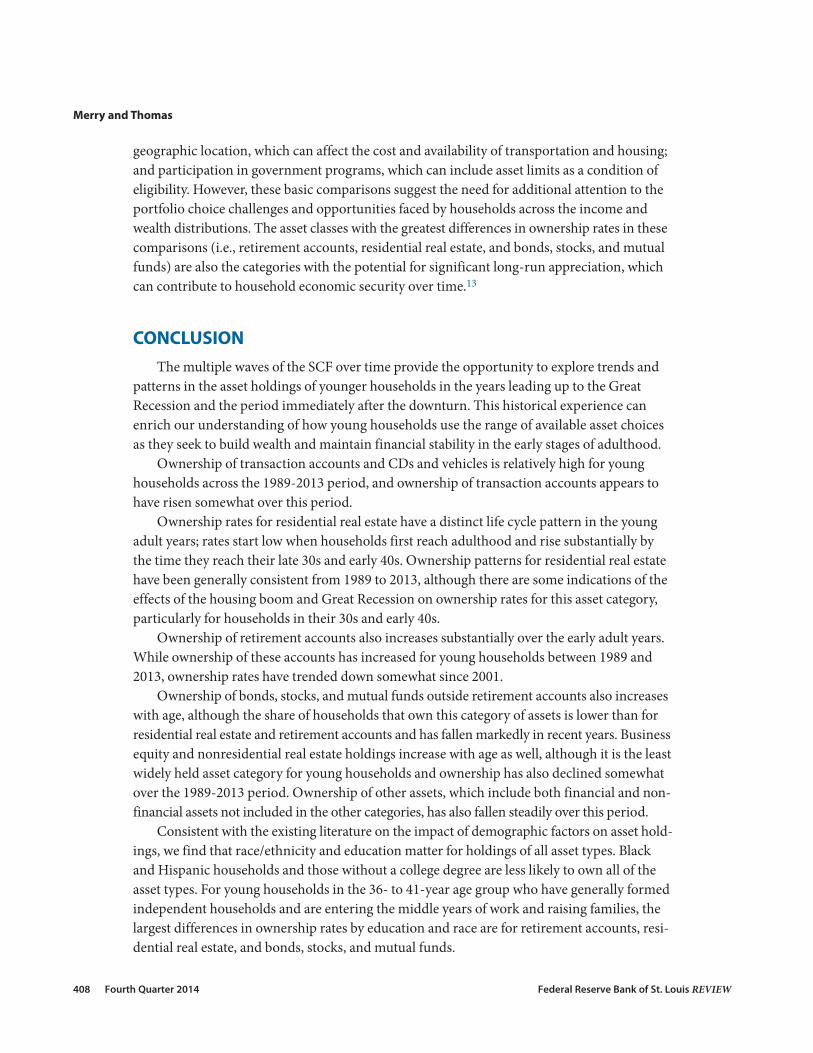
CONCLUSIONThe multiple waves of the SCF over time provide the opportunity to explore trends and
patterns in the asset holdings of younger households in the years leading up to the GreatRecession and the period immediately after the downturn. This historical experience canenrich our understanding of how young households use the range of available asset choicesas they seek to build wealth and maintain financial stability in the early stages of adulthood.
Ownership of transaction accounts and CDs and vehicles is relatively high for younghouseholds across the 1989-2013 period, and ownership of transaction accounts appears tohave risen somewhat over this period.
Ownership rates for residential real estate have a distinct life cycle pattern in the youngadult years; rates start low when households first reach adulthood and rise substantially bythe time they reach their late 30s and early 40s. Ownership patterns for residential real estatehave been generally consistent from 1989 to 2013, although there are some indications of theeffects of the housing boom and Great Recession on ownership rates for this asset category,particularly for households in their 30s and early 40s.
Ownership of retirement accounts also increases substantially over the early adult years.While ownership of these accounts has increased for young households between 1989 and2013, ownership rates have trended down somewhat since 2001.
Ownership of bonds, stocks, and mutual funds outside retirement accounts also increaseswith age, although the share of households that own this category of assets is lower than forresidential real estate and retirement accounts and has fallen markedly in recent years. Businessequity and nonresidential real estate holdings increase with age as well, although it is the leastwidely held asset category for young households and ownership has also declined somewhatover the 1989-2013 period. Ownership of other assets, which include both financial and non-financial assets not included in the other categories, has also fallen steadily over this period.
Consistent with the existing literature on the impact of demographic factors on asset hold-ings, we find that race/ethnicity and education matter for holdings of all asset types. Blackand Hispanic households and those without a college degree are less likely to own all of theasset types. For young households in the 36- to 41-year age group who have generally formedindependent households and are entering the middle years of work and raising families, thelargest differences in ownership rates by education and race are for retirement accounts, resi-dential real estate, and bonds, stocks, and mutual funds.
Merry and Thomas
408 Fourth Quarter 2014 Federal Reserve Bank of St. Louis REVIEW

Young households typically have long time horizons to accumulate wealth. Their ability to(i) invest in assets likely to appreciate and (ii) weather short-term shocks can yield significantbenefits both now and in the future as they age. Many young households faced financial shocksduring the Great Recession that may have necessitated the liquidation of assets or impairedtheir ability to save and invest for the future. Additional research on the patterns of asset hold-ing over time may improve our understanding of factors affecting asset acquisition before andafter the recession. The recession was also a reminder of the importance of examining whichasset ownership strategies are also sustainable, particularly for young households and otherswho may be just starting to build wealth. �
Merry and Thomas
Federal Reserve Bank of St. Louis REVIEW Fourth Quarter 2014 409
NOTES1 Our analysis is built on the asset categories defined in the SCF Summary Extract Public Data files. These datainclude variables used in Federal Reserve Bulletin articles on the SCF. While the SCF is typically conducted as across-sectional survey, panel data were collected between 1983 and 1989 and between 2007 and 2009, althoughthe panels are not used in this study. More information on the SCF, including codebooks and other documenta-tion, is available at http://www.federalreserve.gov/econresdata/scf/scfindex.htm.
2 For example, see Emmons and Noeth (2013) and Herbert, McCue, and Sanchez-Moyano (2013).
3 The owner of an asset often has positive net equity in that asset, but not always. It has been common recently formany homeowners to have an outstanding mortgage balance greater than the market value of the house.
4 Although the SCF includes data on defined benefit pensions, such plans are not included in this measure.
5 In Table 1 of his article, Kennickell includes an inventory of all the income, debt, and asset categories measured inthe SCF, as well as some categories that are only partially measured or not measured at all.
6 All estimates of asset ownership rates presented in this section are computed using the SCF weights.
7 The SCF is a household survey, and the focus is on the “primary economic unit” consisting of a single individual ora couple together with other members of the household who are financially interdependent with that individualor couple. When a single individual is economically dominant in the household, that person is defined as the headof the household. For the purpose of organizing the data for couples, the SCF defines the household head as themale in a mixed-sex couple or the older individual in a same-sex couple.
8 The vertical bars in the graphs represent the 95 percent confidence interval for the mean ownership rate for eachgroup. The authors appreciate Karen Pence’s sharing of code to compute standard errors accounting for bothsampling and imputation variance in the SCF.
9 Sample sizes for the younger age groups are smaller than for older age groups across all waves of the SCF. Cautionis warranted in interpreting the asset holding rates for those 18 to 23 years of age and those 24 to 29 years of agebecause the smaller samples imply more sampling variability in the estimates of the ownership rates for theseyounger age groups.
10 The difference in vehicle ownership is statistically significant at the 5 percent level. All other differences betweenasset ownership rates for these two groups based on the education of the head of household in 2013 are statisti-cally significant at the 1 percent level.
11 In recent waves of the SCF, respondents have been able to self-identify as more than one race or ethnicity but areasked to respond first with the category that best describes their race. For simplicity, we classify the household’srace based on the first response.
12 All differences between asset ownership rates for these groups based on the race or ethnicity of the householdhead in 2013 are statistically significant at the 1 percent level.
13 See Wolff (2012) for estimates of rates of return for several broad asset types similar to those used in this article.
REFERENCESBricker, Jesse; Kennickell, Arthur B.; Moore, Kevin B. and Sabelhaus, John. “Changes in U.S. Family Finances from2007 to 2010: Evidence from the Survey of Consumer Finances.” Federal Reserve Bulletin, June 2012, 98(2), pp. 1-80;http://www.federalreserve.gov/pubs/bulletin/2012/pdf/scf12.pdf.
Caskey, John P. “Beyond Cash-and-Carry: Financial Savings, Financial Services, and Low-Income Households in TwoCommunities.” Washington, DC: Consumer Federation of America, 1997.
Copeland, Craig. “Employment-Based Retirement Plan Participation: Geographic Differences and Trends, 2012.”EBRI Issue Brief, No. 378, Employee Benefit Research Institute, November 2013; http://www.ebri.org/pdf/briefspdf/EBRI_IB_11-2012_No378_RetParticip.pdf.
Dettling, Lisa J. and Hsu, Janne W. “The State of Young Adults’ Balance Sheets: Evidence from the Survey ofConsumer Finances.” Federal Reserve Bank of St. Louis Review, Fourth Quarter 2014, 96(4), pp. 305-30.
Merry and Thomas
410 Fourth Quarter 2014 Federal Reserve Bank of St. Louis REVIEW

Emmons, William R. and Noeth, Bryan J. “Why Did Young Families Lose So Much Wealth During the Crisis? The Roleof Homeownership.” Federal Reserve Bank of St. Louis Review, January/February 2013, 95(1), pp. 1-26;http://research.stlouisfed.org/publications/review/13/01/Emmons.pdf.
Gouskova, Elena; Juster, F. Thomas and Stafford, Frank, P. “Trends and Turbulence: Allocations and Dynamics ofAmerican Family Portfolios, 1984-2001,” in Edward N. Wolff, ed., International Perspectives on Household Wealth.Northampton, MA: Edward Elgar, 2006, pp. 365-93.
Herbert, Christopher E.; McCue, Daniel T. and Sanchez-Moyano, Rocio. “Is Homeownership Still an Effective Meansof Building Wealth for Low-Income and Minority Households? (Was It Ever?).” Working Paper No. HBTL-06, JointCenter for Housing Studies, Harvard University, September 2013; http://www.jchs.harvard.edu/sites/jchs.harvard.edu/files/hbtl-06.pdf.
Hogarth, Jeanne M.; Anguelov, Christoslav E. and Lee, Jinhook. “Who Has a Bank Account? Exploring Changes overTime, 1989-2001.” Journal of Family and Economic Issues, Spring 2005, 26(1), pp. 7-30.
Holden, Sarah and Bass, Steven. “The IRA Investor Profile: Traditional IRA Investors’ Activity, 2007-2012.” ICI ResearchReport, Investment Company Institute, March 2014; http://www.ici.org/pdf/rpt_14_ira_traditional.pdf.
Kennickell, Arthur B. “Ponds and Streams: Wealth and Income in the U.S., 1989 to 2007.” Finance and EconomicsDiscussion Series 2009-13, Federal Reserve Board, January 2009;http://www.federalreserve.gov/pubs/feds/2009/200913/200913pap.pdf.
Mannering, Fred; Winston, Clifford and Starkey, William. “An Exploratory Analysis of Automobile Leasing by U.S.Households.” Journal of Urban Economics, July 2002, 52(1), pp. 154-76.
Menchik, Paul L. and Jianakoplos, Nancy A. “Black-White Wealth Inequality: Is Inheritance the Reason?” EconomicInquiry, April 1997, 35(2), pp. 428-42.
Pendall, Rolf; Hayes, Christopher; George, Arthur; McDade, Zach; Dawkins, Casey; Jeon, Jae Sik; Knaap, Eli;Blumenberg, Evelyn; Pierce, Gregory and Smart, Michael. “Driving to Opportunity: Understanding the Linksamong Transportation Access, Residential Outcomes, and Economic Opportunity for Housing Voucher Recipients.”Washington, DC: Urban Institute, 2014; http://www.urban.org/uploadedpdf/413078-driving-to-opportunity.pdf.
Wolff, Edward N. “Changes in Household Wealth in the 1980s and 1990s in the United States,” in Edward N. Wolff,ed., International Perspectives on Household Wealth. Northampton, MA: Edward Elgar, 2006, pp. 107-50.
Wolff, Edward N. “The Asset Price Meltdown and the Wealth of the Middle Class.” NBER Working Paper No. 18559,National Bureau of Economic Research, November 2012; http://www.nber.org/papers/w18559.pdf.
Merry and Thomas
Federal Reserve Bank of St. Louis REVIEW Fourth Quarter 2014 411

412 Fourth Quarter 2014 Federal Reserve Bank of St. Louis REVIEW