final team 10
DESCRIPTION
final team 10 top score puih selalu kimak scribdTRANSCRIPT
Air Conditioning Laboratory
Project 99.10
Design Team Members:
Sean Gallagher Prathana Vannarath 260 Elkton Rd, Apt D-9 211-8 Thorne Lane Newark, DE 19711 Newark, DE 19711 (302) 369-2820 (302) 738-8765 [email protected] [email protected]
Brian Davison Pamela McDowell 64 Willow Creek Lane 135 E Cleveland Ave
Newark, DE 19711 Newark, DE 19711 (302) 239-1340 (302) 366-7473
[email protected] [email protected]
Sponsors:Dr. Tony Wexler226 Spencer Lab
Mechanical Engineering DepartmentUniversity of Delaware
Newark, DE 19716(302) 831-8743
Dr. Suresh Advani205 Spencer Lab
Mechanical Engineering DepartmentUniversity of Delaware
Newark, DE 19716(302) 831-8975
Executive Summary:
The University of Delaware, Department of Mechanical Engineering, is
drastically changing the curriculum for the class of 2000 in order to keep up with ABET
standards. As a result, a new joint Thermodynamics and Heat Transfer laboratory has
been created. Our mission is to design a set of experiments for this joint lab class. These
experiments are to be based on an air conditioning cycle.
After interviewing our customers to identify their wants, we made use of the SSD
process to weight them. System benchmarking was used to identify our major
competitors, and again SSD helped us compare them to a window air conditioner. None
of the alternatives had nearly as many as the window air conditioner. Functional
benchmarking was used to investigate specific types of window air conditioners and
sensors.
This project consists of two integrated parts, the lab apparatus and the lab
experiments. When analyzing our project, we first considered the lab apparatus. As
mentioned above, we decided that a window air conditioner was the best apparatus. From
here, we generated concepts about the actual written experiments. Through evaluating
our metrics, we decided on a set of labs that will have between four and seven
experiments, each examining a component of the air conditioning unit. The students will
be asked to write a short report following each lab, and after every experiment has been
completed, a technical paper will be written bringing together all the concepts learned.
Sensors were then chosen based on the needs of each experiment, and on our metrics.
2
After fabrication of the apparatus was completed and lab experiments were
written, we began the testing phase. From the results of the testing, we made
modifications and repeated the testing. Upon comparing our results with our wants and
metrics, we concluded that we had successfully completed the project.
3
Table of Contents:
Executive Summary…………………………………………………..3
Table of Contents……………………………………………………..4
Introduction…………………………………………………………...5
Background……………………………………………………5
Customers…………………………………………………….6
Wants…………………………………………………………7
Constraints……………………………………………………8
Metrics & Target Values……………………………………..8
Concept Generation………………………………………………….12
System Benchmarking……………………………………….13
Functional Benchmarking……………………………………15
Lab Experiment Benchmarking……………………………...17
Concept Generation………………………………………….18
Concept Selection……………………………………………………24
Fabrication…………………………………………………………...26
Assembly…………………………………………………………….31
Testing/Re-Design…………………………………………………...34
Hardware…………………………………………………….34
Labs………………………………………………………….37
Suggested Modifications…………………………………………….39
Conclusion…………………………………………………………..41
Appendix
A – file – Appendix A_Team10.xls………………………….43B – file – Appendix B_Team10.xls………………………….43C – file – Appendix C_Team10.xls……….…………………43D…………………………………………...………………...44E……………………………………………………………...45F……………………………………………………………...47G……………………………………..………………………69
H……………………………………………………………..77J – file – Team10.vi………………….………………………80K – file – Appendix K_Team10.xls…………………………81
4
Introduction:
Background:
The University of Delaware, Department of Mechanical Engineering, is
drastically changing the curriculum for the class of 2000 in order to keep up with ABET
standards. Part of this new curriculum includes a joint laboratory class; this lab is for
Thermodynamics and Heat Transfer. The professors of these courses, Dr. Wexler and Dr.
Advani, have proposed a project to the New Castle Design Associates to design a set of
experiments for this joint lab. The problem is to design a set of thermodynamic and heat
transfer experiments using a window air conditioner unit for the Undergraduate
Laboratory. Experiments will be based on lessons designed by our senior design group.
Our mission is to design a set of thermodynamic and heat transfer experiments for
the University of Delaware, Mechanical Engineering Undergraduate Laboratory, using an
apparatus that will be completed by April 1999 for no more than four thousand dollars.
In evaluating our concepts, we compared them in terms of their correlation to the
wants and constraints set forth by our customers. In order to determine how exactly the
concepts correspond to the wants we used metrics and target values derived from
benchmarking.
5
Customers:
Our customer list encompasses our sponsors as well as experts in the fields of
HVAC, education, and scholarly work. Our customers are as follows:
1. Dr. Wexler, Professor
1. Dr. Advani, Professor
2. Undergraduate students
3. Graduate student TA’s
4. Judy Greene, Educational Expert
5. Dr. Sun, Professor, Lab Expert
6. William Davison, HVAC Engineer
7. Manufacturers: Hampden, Armfield Ltd.
8. Other schools (Georgia Institute of Technology, Pennsylvania State
University)
The list can be seen on our SSD chart, which is attached in Appendix A. The list is
ranked by order of importance, which is set by the team. We determined that Dr. Wexler
and Dr. Advani were of the utmost importance as sponsors. The project is not only their
idea, but they are jointly funding it. Undergraduate students are directly effected by each
and every aspect of our project. The primary purpose of any laboratory experiment is to
effectively teach ideas in a hands-on manner. The graduate students are also directly
effected in that they will be actively in charge of the hands-on learning process. Judy
Greene, an educational expert, helped us evaluate the level of effectiveness of our
laboratory experiments. Dr. Sun is an expert in the field of laboratory experiments,
perhaps one day he will use our experiments and our apparatus to teach his classes.
6
William Davison is an expert in determining which hardware will function effectively
under our given conditions. Manufacturers and other schools help in benchmarking, and
are of concern in the case that our apparatus be manufactured for more widespread use.
Wants:
Our list of wants encompasses the top eleven most important wants set forth by
our customers. It is as follows:
1. Educational Effectiveness
1. Portable
2. Easy to use
3. Self Evident
4. Easy to Set-Up
5. Cost Effectiveness
6. Multiple Purposes
7. LabVIEW Compatible Data Acquisition
8. Forgiving of Incompetence
9. Quiet
10. Quick
These wants appear in their order of importance according to our SpreadSheet Design
Chart, in Appendix A. This ranking comes about from assigning values to the wants
according to their location on the customer list, and then weighting those numbers by
multiplying them by the inverse of customer rank. For example, if Mr. Davison’s first
want is cost effectiveness, then cost effectiveness is assigned a value of .45 because it
7
appears in the first column and then it gets multiplied by 1/6 because he has a rank of 6th
on our list of customers.
Constraints:
The constraints for this project include a number of issues. The most important is
the size. It must be small enough to be portable because it may be moved often. Also, we
are on a strict schedule which states that this project be finished by April 1999, and the
format of our presentations and written reports are given, which is all dictated by New
Castle Design Associates. Lastly, our budget is four thousand dollars (see Appendix C).
Our mission is to be fulfilled in such a way as to include as many customer wants
and constraints as possible. We are going to measure whether we have satisfied this by
using metrics and set target values.
Metrics & Target Values:
Although our project integrates two parts, lab experiments and the hardware,
some of the wants pertain to the experiments and some to the lab apparatus. Considering
the aspect of our lab experiments, each needs to be a self-evident, easy to use, effective
learning tool. The most important benefit is that the undergraduate students here at the
University of Delaware will learn about heat transfer and thermodynamics and the
realities of measured versus theoretical quantities.
To measure how well we have achieved each want, we will use metrics and the
target values associated with them. As described previously, our wants are prioritized by
their relative importance. Each want has at least one metric associated with it, and some
8
have multiple metrics. As for priority among the metrics, we used the association of the
want as a determining factor. For example, if the want is ranked number one the metric
corresponding with it is also ranked number one. If a want has multiple metrics, then we
considered each to have the same rank. For instance, if the number two want has three
metrics, then all three metrics have a rank of two. To see an all–encompassing table of
prioritized wants, metrics and target values, see Appendix B. Below we discuss each
metric according to whether it pertains to the lab experiments or the hardware.
Several of the wants correspond to the lab experiments; they are educational
effectiveness, self evident, and quick. Educational effectiveness is going to be measured
by the evaluation chart found in Appendix C, for now, but ultimately by survey during
the testing. Whether it is self-evident is going to be determined by survey. The questions
on the survey are the basis for Appendix C. At this point in time, Judy Greene has
evaluated our lab experiments and commented on them. She used her expertise based on
her professional experience to perform the evaluation. When the apparatus is complete,
we will persuade some undergraduates to perform the experiments and fill out surveys,
commenting on how clear the lessons and objectives are and if the procedure is in a
logical order. These surveys will have rankings on them from one to five, with five being
the best. We have a target value of 4 because we want it to be self evident to everyone,
but we realize that nothing will please everyone. For now we have evaluated these things
based on our own experience, as we consider ourselves as experts in the field of
laboratories for undergraduate students. Lastly, we want the experiments to be quick.
From our personal experiences, those of other undergraduates, those of present teaching
assistants, and those of Dr. Advani and Dr. Wexler: if the lab is too long very little is
9
retained. We are going to measure this with time. We have a constraint of two hours,
which is the scheduled amount of time for the laboratory. However, we are aiming for no
longer than an hour because based on our experience and under the advisement of Judy
Greene, students attention deteriorates rapidly at this point.
The rest of the wants pertain to the hardware aspect of the project. The most
important according to our SSD chart, as described above, is that it be portable. We are
going to measure this by size. The apparatus should fit on a cart that has wheels and is
able to pass through a regular doorway, so we have set our target values to be 36 inches
in width and 60 inches in height. We are also going to measure this by weight; we have
designated 100lbs to be the target value in order to ensure that any one could push the
cart.
The next want is easy to use. We are going to measure this by physically looking
at the apparatus and determining whether the components are visible and how accessible
they are. By accessible, we mean that the students should be able to touch all the parts,
not take them apart. In other words, we want to not only see the components in the
apparatus, but we want to be able to touch them. We could physically count all the visible
parts and the number of touchable parts; however, each apparatus may have a different
number of parts so these numbers may not be comparable. Instead, as we consider each
apparatus, we will visually examine them and determine whether the components are in
fact visible and touchable. Each will receive either a ‘yes’, if they are, or a ‘no’, if they
are not, for each category, visible components and accessible components. Our target
value is of course yes, because we want everyone to be able to use the apparatus.
10
We also want the apparatus to be easy to set up. Time is the key method to
measure this; we have a target value of 15 minutes, as this is the amount of time between
classes and the TA should not need more time than this to set up the lab. We are also
going to measure this by the number of separate parts. The idea is to be able to get the
entire apparatus onto one moveable cart, because this would greatly minimize the time it
would require to set up therefore increasing the ease of setting up the apparatus. Either it
fits onto one cart or it does not. Our target value for this is that it does.
The next want regarding the hardware is cost effectiveness. The apparatus should
have a low initial cost, a low operating cost, be long lasting, and the parts should be
easily available from a store or catalogue. Our target value for a low initial cost is the
$4000 budget that we were given. For low operating cost we are aiming for $22, this
comes from estimating that the apparatus runs for 12 hours a day, 5 days a week, for four
weeks at a rate of 9 cents per kilowatt /hour (This is the rate charges by the City of
Newark). For long lasting, we are targeting 10 years because of changes in technology
and EPA standards. Currently R-22, the refrigerant in the window air conditioner, is
banned from use in car air conditioners and central ac units in homes because of the
environmental effects. Right now it is still being used for window air conditioners
because of cost considerations, but in a few years it may be illegal to use R-22.
Another want is that the apparatus have multiple purposes. It must contain both
thermodynamic and heat transfer principles. This is a yes or no question asked of every
concept. Our target value is going to be yes because this is a lab for both heat transfer and
thermodynamics so both topics should be included.
11
This system should also have a LabVIEW compatible data acquisition system so
that the existing acquisition board can be used to read the data. This is either present or it
is not. Our target value is present. We are investigating other software packages besides
LabVIEW; however, LabVIEW is what the ME department currently uses and would be
the most convenient. LabVIEW satisfies all metrics associated with the acquisition
program required, as it is compatible with itself and it is free.
The apparatus should also be forgiving of incompetence. What this means is that
the apparatus should give relatively good data even if the operator makes a few mistakes.
This will be measured by physically trying the limits of the apparatus when it is finally
assembled, but for now we are taking this into consideration when purchasing parts. We
are consulting our customers, such as Dr. Sun, Dr. Advani, Dr. Wexler (who has written a
book on sensors and can be considered an expert in this area) and other manufactures of
sensors, such as Omega and Optrand. When we are able to test the apparatus, we will
compare the data collected, and we have set a target value of 10%. By this, we mean that
as long as the error in the data is less than 10%, it is acceptable.
Lastly, we want the apparatus to be quiet. This will be measured by a target value
we have set at 60 decibels, which is a conversation level of noise. OSHA laws are not
important here, the noise level limitation is for the convenience of the users.
Concept Generation:
Although the project consists of two integrated parts, the hardware and the lab
experiments were benchmarked separately. The following sections, system and
12
functional benchmarking, pertain to the hardware, and the benchmarking for the lab
experiments follows below that.
System Benchmarking:
System level benchmarking began with a search for existing thermodynamics and
heat transfer labs. We started by looking at what is being offered and what has been
offered previously here at the University of Delaware. We found that the MEEG 391,
Engineering Science Lab, taught by Dr. Sun, was the closest match, but none of the
apparatuses displayed the Heat Transfer and Thermodynamics principles we had in mind.
Investigations into various other universities’ engineering departments revealed
information of little use. The same result applies to research into HVAC programs in
technical schools. Through inquiries to professors and searches on the Internet,
manufacturers in this area were found to be Armfield Limited and Hampden Engineering
Corporation. Dr. Prasad provided some literature on both the Armfield and Hampden
labs. A further check into the companies’ respective Internet pages provided updated
information on the old labs and listings of new laboratory offerings.
Armfield Limited offers a large selection of engineering teaching research
equipment. The laboratory equipment most applicable to this project can be found in
Armfield’s Heat Transfer line of laboratory equipment. Of primary interest is the HT10X
line of heat transfer teaching equipment. This line is comprised of single bench top
Service Unit, and seven individual laboratory accessories, each illustrating a single heat
transfer fundamental. Each of the individual laboratory setups can be purchased with a
Data Logging Accessory package. Additionally, in Armfield’s Fluid Mechanics line, the
13
FM23 Plunger Pump Demonstration Unit can be used to partially simulate the
compressor found within an air conditioning unit. The air conditioning unit compressor
is typically a piston type compressor and the FM23 uses a positive displacement pump.
However, this is not a true match. This can also be said for the rest of Armfield labs.
Some of Armfield’s products display heat transfer and thermodynamic principles, but
none of them do everything a window air conditioner can do.
Hampden differs from Armfield by offering laboratory equipment related to
specific industry equipment such as cooling towers, heat exchangers, heat pumps, and
refrigeration cycles. Of interest is Hampden’s H-ACD-2 Basic refrigeration Cycle
Trainer. According to Hampden’s product literature, this equipment “has been designed
to demonstrate the principles of … R-134 a refrigeration system … including heating,
cooling, humidification, de-humidification, recirculation, and mixing.” The inclusion of
humidification, de-humidification, recirculation, and mixing is beyond the original scope
of our project, as this equipment is more oriented to larger, building HVAC systems
rather than the small, window unit style air conditioning unit we are interested in. This is
also evident in the size of the H-ACD-2. The unit measures 88” x 70” and 31” deep.
Total weight for the unit is 1170 lbs. The H-ACD-2 requires 208V, three phase power
and a water supply. Hampden offers an option data logging package including 13 type-T
thermocouples, a single air velocity meter, three pressure transducers, two differential
pressure transducers, and two wattmeters.
Hampden also manufactures a Refrigeration Cycle Trainer, H-RST-2, that covers
the complete refrigeration cycle. This does not take the form of a recognizable piece of
machinery. All of the equipment, such as the coils, are specially fabricated for this lab
14
apparatus and are not industry standard equipment. The unit is also similar in size and
weight as the H-ACD-2. There remains a number of Hampden labs such as the H-RST-
3B Basic Refrigeration Cycle and Heat Pump Trainer, the H-6710-CDL Refrigeration
Demonstrator, and the H-6830 Heat Pump Trainer that each satisfy a few of our
requirements, but are inferior to the H-RST-2 and H-ACD-2 as a competitor.
Overall, we did not learn very much from the system benchmarking. What we did
learn was that the window air conditioner appears to be our best choice.
Functional Benchmarking:
For functional level benchmarking, we researched the major manufacturers of
laboratory equipment and scientific sensors. Omega Engineering, Incorporated was
found to supply an extensive line of sensors. Additionally, their catalogs and web site
offered plenty of technical information about each sensor. The sensors in Omega’s
product line that we were interested in included thermocouples, pressure transducers, a
mass flow sensor, and a relative humidity sensor. This was beneficial as a source to help
determine specific types of sensors need for the purpose of this project.
In terms of thermocouples, we found that type K are the best choice for our needs,
the type K range from –100 oC to 400 0C. As for the other sensors we are investigating,
all of them have outputs of volts, so they will not require modules to convert their signals.
Pressure sensors come in a wide variety with fairly large ranges, so we will not have any
problems choosing one that will be compatible with the air conditioner. The air
conditioner, while off has a pressure of approximately 150psi, and while operating at full
capacity, a low pressure of about 75psi and a high of about 250psi. Considering this, we
15
are investigating pressure sensors that have a range of 0 to 500psi. Relative humidity
sensors are fairly standard. They all measure 0% to 100% relative humidity. These
sensors also determine the temperature of the air, but the velocity will have to be
determined with a separate sensor. The mass flow sensors are very delicate. It is difficult
to find ones that are compatible with refrigerant. Therefore, the engineering department
of Omega is guiding us. We trust their advisement because if it doesn’t work, they’ll
replace it.
Another company, Optrand, produces fiber-optic pressure transducers. This
provides an alternative method of pressure measurements for the lab as well as allowing a
thorough study of a compressor. Optrand’s AutoPSI-TC Dynamic Pressure Sensor would
allow continuous measurements of the pressure inside the compressor. This is a new
discovery and its feasibility for this particular lab will be further evaluated.
Window air conditioner manufacturers were also researched. A large number of
air conditioners in the range of products we are interested in were found in Carrier’s
room Air Conditioners series, Airtemp’s Room Air Conditioner series, and Port-a-Cool’s
product line to name just a few. The University of Delaware’s HVAC department
donated an older air conditioning system. Unfortunately, this system uses R-22 for a
refrigerant. We desire a newer system with an environmentally safe refrigerant. It does
not do any good for the students to study a system using an obsolete refrigerant. Our
customer, Dr. Wexler, agrees with the importance of using an environmentally safe
refrigerant for the lab. This air conditioner did, however, provide an excellent
opportunity to study the air conditioning system hardware in order to get a better picture
of what the eventual lab setup will require.
16
The LabVIEW software and data acquisition board and computer are already
available in the department. Therefore, the selection and purchasing of the data
acquisition card and the software does not need to be considered. The number of
channels and type of inputs that the board can handle has been determined to aid in the
selection of the individual sensors.
Finally, the actual mounting of the sensors needs to be determined. The fittings
required in mating the sensors to the air conditioning unit refrigerant lines and coils is
dependent on the sensor and its location on the air conditioner. Various tee fittings can
be purchased with the required thread to match any threaded sensor and thermowells can
be used for temperature measurements. The tee fittings can be soldered to the refrigerant
lines, but the sensors should be removable for replacement or maintenance. The wiring
and wire connectors required will also be determined later by sensor type and location.
Lab Experiments Benchmarking:
Benchmarking of thermodynamics and heat transfer labs from other schools
turned out to be not that beneficial. Of all the schools we researched, none of them use a
window air conditioner as a lab apparatus. The most helpful site was that of Michigan
State. We got ideas for lab experiment styles and how to prove specific principles from
labs with similar heat transfer and thermodynamic principles.
The educational benchmarking we did was primarily through Judy Greene, an
educational expert. As a way of measuring the teaching effectiveness of our labs, she
recommended we evaluate the lab apparatus and lab reports. She provided us with
pamphlets on teaching techniques and writing clear lesson plans. The pamphlets she
17
provided were “Evaluate Your Instructional Effectiveness”, ”Develop a Unit of
Instruction”, and “Establish Student Performance Criteria”; we used these to help write
the lab manual. She said we would have to evaluate the manual and apparatus for
teaching effectiveness with actual students, and the best way to do this would be to
conduct a survey and make modifications. We also researched a couple of web sites and
books concerning educational effectiveness, however they were not nearly as beneficial
as Judy Greene.
Concept Generation:
As previously stated, our project consists of two parts that must be integrated.
One aspect is to design the experiments, and the other is to investigate the hardware
needed to execute the experiments.
The lab experiments section can also be examined in three different ways. The
first being the number of experiments performed during the semester, the second being
the basis of the experiments, either by component or by heat transfer/thermodynamic
principle, and the third being the way in which the students write their lab reports. The
three wants mentioned above for lab experiment concepts are educational effectiveness,
self evident, and quick. The key method used to evaluate these concepts is through
metrics for educational effectiveness.
For number of experiments preformed during the semester, there are three
possible concepts. The first is to do one experiment repeatedly, the only change being
that different sensors will be used each time. For instance, we may only be able to
evaluate conservation of energy in our apparatus. Conservation would be measured
18
repeatedly, every week, using a different type of sensor each week. This rated very
poorly with undergraduates, graduate students, and professors. It rated poorly in terms of
educational effectiveness because it would be monotonous since the objectives will be the
same every time. Talking with Dr. Greene revealed that as a result, this monotony will
cause the students to lose interest. It rated poorly in terms of the number of concepts
covered because only a small number of objectives can be achieved, so this set of lab
experiments will only cover the principles present. Although, seeing the different answers
from different sensors can be an effective learning tool, it is not in our case because the
main point demonstrated is experimental error, and these students, being in their third
year and having performed numerous labs before, already know what experimental error
is.
The second possibility for number of experiments performed during the semester
is to do four to seven laboratory experiments. Each experiment would differ in that they
would present different fundamentals. This set of experiments would generate more
interest because the experiments would vary from lab to lab.
The last possibility is to do 13 experiments. This comes down to one lab per
week. Within the apparatus there are a limited number of fundamentals. In order to
stretch the fundamentals over 13 labs, the experiments would be short. From our own
personal experience, we thought that this would not keep the students interest because the
labs would seem pointless.
When considering the basis of experiments, as mentioned above, we considered
two options. One is to divide the experiments by fundamentals. Here each lab would deal
with a different thermodynamic or heat transfer principle. For example, if the topic is
19
convection, the students would analyze the apparatus everywhere convection is taking
place. The overview of how this set of experiments would flow is as follows:
I Conservation of Energy
II Convection
III Conduction
IV Psychometric Chart
V Thermodynamic Diagrams (T-s & P-v)
VI Cross Flow Heat Exchanger
VII Overall Efficiency
This concept contains the fundamentals covered in the classes. With each topic, there
would be numerous components and data to analyze.
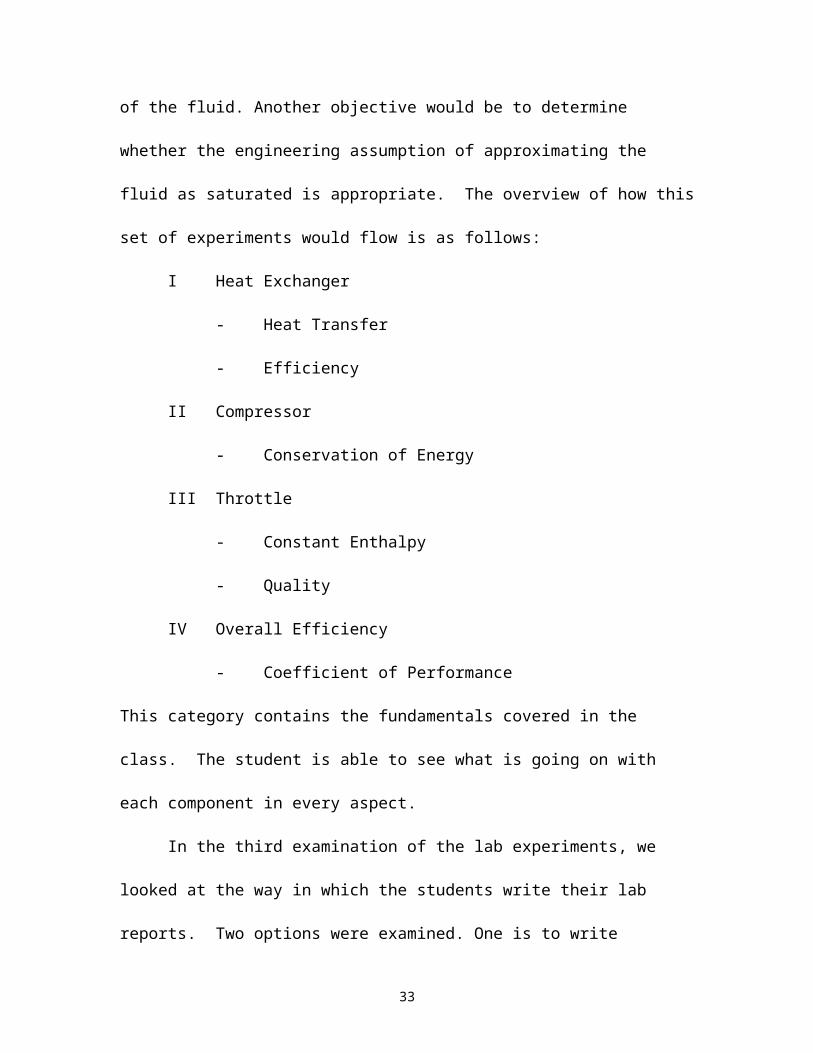
The other way to divide the experiments is by component within the apparatus.
Each lab would deal with a specific part, analyzing every thermodynamic and heat
transfer aspects. For example, if the part is a throttle, the students would measure
temperature and pressure and show that enthalpy remains constant throughout. Also, the
fluid is going through a phase change as it passes through the throttle, so another
objective would be to find the quality of the fluid. Another objective would be to
determine whether the engineering assumption of approximating the fluid as saturated is
appropriate. The overview of how this set of experiments would flow is as follows:
I Heat Exchanger
- Heat Transfer
- Efficiency
II Compressor
20

- Conservation of Energy
III Throttle
- Constant Enthalpy
- Quality
IV Overall Efficiency
- Coefficient of Performance
This category contains the fundamentals covered in the class. The student is able to see
what is going on with each component in every aspect.
In the third examination of the lab experiments, we looked at the way in which the
students write their lab reports. Two options were examined. One is to write standard lab
reports after each experiment. By standard we mean they would have all the section
including an objective, a procedure, a list of equipment, a theory, a background, results,
data analysis, and a conclusion. These reports are typically 5-8 pages. The students
would be writing a thorough report on the experiment.
The other option is to write short weekly lab reports; then, in the end, write a
technical paper on how the apparatus works. The short weekly lab reports would consist
of a short background, results, data analysis, and a conclusion. The technical paper would
tie all the labs together and the student would have to support all their conclusions with
data that they collected from the labs. One constraint that goes along with this concept is
time. The students would need time to write the technical paper after all the labs had been
completed and all the short lab reports were written. Our target value is to allow the
students four weeks to write the technical paper. The technical paper allows the student
21

to physically understand what is happening inside the apparatus, which gives a complete
real world connection.
The hardware section can be examined in two ways: apparatus and sensors.
Through conversations with our sponsors, Dr. Wexler and Dr. Advani, as well as a
thorough evaluation of our metrics, (see Appendix C) the window air conditioner was
selected as the lab apparatus. Most importantly, a window air conditioner is a real world
machine that students have seen. This is a point of major concern to our sponsors. The
cost of creating a special built apparatus will be well over the cost of purchasing a
commercially available air conditioning unit. Finally, the time constraint imposed on us
by the senior design process prevent the thorough design of a specialized apparatus in
conjunction with the thorough development of the educational values and laboratory
procedures. Therefore, the option of creating our own lab apparatus is not feasible. The
air conditioner chosen should use the newer, environmentally friendly refrigerant. The
older refrigerants are obsolete, so there is no reason to have the students studying an
already obsolete system.
Purchasing and instrumenting a window air conditioner is also superior to
purchasing a commercially available lab apparatus from our competitors. Again, through
discussion with our sponsors and a thorough evaluation of the wants that appear on the
evaluation chart, found in Appendix C, the window air conditioner is found to be superior
to any commercially available lab apparatus.
The sensor package requirements are partially determined by the lab experiments.
The number of sensors required is determined by the data required to complete the labs.
Eliminating overlapping or redundant sensors can optimize the cost of the sensor
22
package. The specific sensor concepts related to each individual lab concept can be
summarized as follows; instrumented with redundancy, fully instrumented, and
economically instrumented.
In the case of the fully instrumented with redundancy, there are redundant sensors
for the measurements required, allowing the comparison for different types of sensors.
This concept requires the largest and most expensive sensor package. The second case,
fully instrumented without redundancy, allows the complete measurement of all points in
the air conditioning unit required to complete the labs without the redundancy in the
previous case. This does not require a sensor package as large as in the previous case;
therefore, it is not as expensive. The trade off is the redundancy factor, which is not a
want; therefore, it is not nearly as important according to our wants as cost effectiveness.
The last option is to economically instrument the air conditioner. In this case, we would
cut the number of sensors to a bare minimum, including just enough to demonstrate a few
heat transfer and thermodynamic principles. This would limit the capability of the air
conditioner to perform all the requirements necessary to satisfy the want of educational
effectiveness. The number of principles will not score well enough on our survey to meet
the target value of four. This sensor package is the smallest and least expensive of all the
cases, but it trades educational effectiveness for cost effectiveness.
Concept Selection:
In order to propose a complete solution, we need to choose a sensor package, the
number of experiments to be preformed during the semester, the basis of the experiments,
and the way that the students will write their lab reports. We have already justified using
23
a window air conditioner for the lab apparatus. To completely analyze all of our choices
as they compare to our wants, we have created a table that correlate all of our wants with
our metrics for each possibility. The metrics are answered with a ‘yes’ or ‘no’, either the
metric is met or it is not. This table can be found in Appendix C, the evaluation chart.
Once the table is filled out, the percentage of ‘yes’s’ is multiplied by that particular
want’s Rate of Importance, determined by the SSD process, Appendix A. Each
competing option with the highest number in the end is our best choice. When this is
complete, we will have a complete solution.
Upon detailed and careful observation of our metrics on the evaluation chart, we
will compare the three cases possible for the number of experiments preformed during
the semester. Educational effectiveness is the key want as mentioned above. The second
case, four to seven experiments, keeps the students interest better than the other two
concepts because it has variety and is complex enough to hold their attention. The first
case, one experiment, is too monotonous. It lacks a number of fundamentals and doesn’t
keep the students interest. The last case, 13 experiments, is too simple. It doesn’t keep the
students interests either because the labs will be too short for the objective to seem clear,
as the students would have to come several times to collect the necessary data to perform
the analysis. Case two, four to seven experiments, contains more fundamentals than case
one, and integrates the fundamentals better than case three. It is apparent using our
metrics as they apply to our choices that four to seven labs is the best option for
educational effectiveness.
Comparing the two ways to base the experiments, by component or by principle,
using educational effectiveness, we see that the basis of component has more real world
24
connections because they are analyzing components. These are things that the students
can understand and relate to. The basis of heat transfer/thermodynamic principle
analyzes the apparatus by topic; however this does not make real world connections to
the students because they are not grasping how each individual component works. The
students are only studying fundamentals, and not how they relate to the real world.
Knowing that a real world connection is a metric for educational effectiveness, this
comparison leads us to the conclusion that basing the experiments on components is the
better choice.
Evaluating the choices for the way the students could write their lab reports, leads
us to choose the short lab reports followed by a technical paper. By examining Appendix
C, it is apparent that this option scored twice as well as the option to write standard
weekly reports. The technical paper brings all the fundamentals from the experiments
together, forces the students to prove the heat transfer and thermodynamic principles
through theory and experimental data, and goes that extra distance to make the real world
connection.
Regarding the sensors, the fully instrumented without redundancy was selected.
While the fully instrumented with redundancy is more detailed, the additional cost of the
sensors prevents its use. The economically instrumented package was not selected due to
its hindering effect on the educational effectiveness of our labs. We have estimated the
numbers of sensors needed to run our best lab experiments based on components. The
specifics are outlined in our Drawing Package, Appendix G. The properties of the sensor
are detailed in the fabrication section, as they depend on the specific operation conditions
of the chosen window air conditioner.
25
From the above analysis, it is obvious that our current complete solution is to use
a window air conditioner as the apparatus. Approximately four experiments will be
written, each in reference to a specific component within the air conditioner. The lab
reports will be short and followed by a technical paper, which will summarize the
complete function of a window air conditioner, using experimental data to support all
statements and analyses.
Fabrication:
Top Cover:
The original air conditioner cover needed to be removed to make the internal
components visible during lab. The removal of this cover also exposed the main
electrical wiring for the control panel and the easily damaged styrofoam ducts. Finally,
the original top cover provided the structural restraint for the cooling coil and fan. A new
cover needed to be fabricated that would protect the foam and wiring, retain the original
structural integrity, and keep the major components visible and accessible. A new top
cover was designed and galvanized steel selected for its durability and ease of fabrication.
(See Figure 1, Appendix G)
Fabrication of the top cover began with the initial laying out of the pattern onto a
sheet of galvanized steel. Next, 0.125” diameter holes were drilled at all internal
corners. These holes provided a point to cut to as well as allowed clean bends to the
corners. The pattern was then sheared from the sheet with a jump shear and finished
with aviation snips. All bends were made on a brake. The cover is installed with self-
26
tapping sheet metal screws, therefore no mounting holes are provided. The cover was
left unfinished, bare galvanized steel.
Safety Guards:
Three Safety Guards are required for the apparatus. (See Figures 2, 6, & 5, in
Appendix G) The air conditioner uses two fans, which were exposed by the removal of
the original cover. A guard must be placed over the opening between these fans to
prevent injury due to the exposed fan blades. Additionally, the fragile coil fins were
exposed with the removal of the original cover. These fins need to be protected from
damage. The fins are also sharp and therefore cannot be left exposed. A galvanized
steel frame with galvanized steel screen was selected for ease of fabrication and
availability. The screen is ¼” mesh to provide sufficient protection and maintain
visibility of the protected components.
The first step in fabricating the guards was the laying out of the frame onto the
sheet steel. The steel guards were cut on a shear and bent on a brake. The screen was
cut with aviation snips. The frame was installed on the screen using 1/8” pop rivets.
The guards were finished with black wrinkle-finish paint. The guards are installed with
self-tapping sheet metal screws, therefore no mounting holes are provided. Heavier gage
steel is recommended for future guards. The heavier steel would allow for cleaner bends
and a stronger guard.
27
Thermocouple and Pressure Transducer Connector Panels:
One of the wants for the lab apparatus was portability. To increase the ease in
which the apparatus can be connected to the computer and to clean up the wiring, panels
were created to mount connectors for all of the thermocouples and pressure transducers.
Two panels were designed, one for thermocouples and one for the pressure transducers.
Each panel is similar in design, varying only through the dimensions of the connector
holes. Two separate panels were selected rather than a single panel to accommodate
future changes or upgrades in either the thermocouples or pressure transducers. (See
Figure 4 in Appendix 4)
The panels were cut from .080” aluminum sheet on a band saw. 0.125” holes
were drilled at all internal corners before cutting. The connector mounting holes were
fabricated by drilling holes for each corner then cutting and filing the rectangular hole.
For future production, the purchase and use of a square or rectangular punch would
dramatically decrease the time required for fabrication as well as result in a much cleaner
and accurate panel. All holes were drilled on a drill press after laying out the hole
locations with a prick punch and center punch. The additional accuracy of the milling
machine was deemed unnecessary for these panels and the drill press was chosen for
speed. After all holes were made, the panels were bent on a brake. The guards are
installed with self-tapping sheet metal screws, therefore no mounting holes are provided.
RH Sensor Hangers:
To minimize the expense of the sensor package, one RH sensor will be used to
measure three points of interest. This will require a quick and convenient method of
28

mounting the RH sensor in each of these locations. ¾” PVC clips were used for the RH
mounts. The clips are mounted to the air conditioner with angle brackets. The front and
middle brackets are mounted with self-tapping sheet metal screws while the rear is
mounted to a plastic shroud with double sided automotive trim tape. The clips are
installed on the bracket using two 6-32 machine screws. Therefore, the only holes to be
drilled are for the machine screws. The angle brackets were fabricated from .080”
aluminum sheet. The brackets were cut on a shear, the holes drilled on a drill press, and
the bend made in a vice. (See Figure 7, in Appendix G)
Pressure sensors:
The pressure sensors mount with a 1/8”NPT male connections. Bullet piercing
valves were used to tap the pressure transducers to the refrigerant lines for two important
reasons. First, using the piercing valves eliminates the need to cut the lines and sweat in
fittings. Secondly, in the event of a pressure transducer failure or the need to change
transducers, the valve can be shut off and the transducer removed without the need for
evacuating the system of refrigerant. The valves use a ¼” male flare fitting. A
1/8”NPT to flare adapter was used in conjunction with a swivel nut flare fitting to mate
the parts properly. The swivel nut flare adapter was used to allow rotation of the
transducer with relation to the valve in order to guarantee proper alignment before
tightening the seal. The No. 1 pressure transducer location required a clearance cut in the
air conditioner chassis. This cut can be made properly with a die grinder. (See Figure 3,
Appendix G)
29
Wiring of the transducers was done after installation. The transducers share a
power source with the relative humidity sensor. All of the transducers’ power and ground
leads are tied into a single two-pin connector on the pressure transducer connector panel.
A power lead was made with a mating two-pin connector. The outputs of each of the
pressure transducers are connected to two-pin connectors, even though the output only
uses a single wire. Some pressure transducers and transmitters use a two-wire output.
Using a two-pin connector allows the future modification to a different style of pressure
transducer without changing the connector arrangement.
Mass flow sensors:
The mass flow sensor is supplied with two compression fittings. The sensor is
heavy enough to require support other than a simple hanging from the copper lines. The
bottom of the sensor has two tapped holes for 4-40 machine screws. The top cover was
removed and the machine screws threaded in from the bottom. University of Delaware
HVAC spliced additional copper tubing into the lines to route the refrigerant through the
mass flow sensor.
Thermocouples:
The thermocouples are supplied with 36” leads. The leads were cut 10” from the
thermocouple, creating a thermocouple with 10” leads to be mounted on the air
conditioner and a 26” long lead to run from the air conditioner to the data acquisition
board. A female miniature thermocouple connector was installed on the thermocouple
leads while a male miniature thermocouple connector was installed on the data
30
acquisition leads. These connectors are installed by unscrewing the connector halves,
carefully stripping the insulation off the leads, installing the leads at the connector’s
screw terminals using the soft nylon washers, and reassembling the connector halves.
Additionally, the panel mount brackets were installed on the female connectors.
RH sensor:
The relative humidity sensor requires an external power source. The sensor uses
a four pin connector. The female end of the connector is wired to the sensor, the male
end is supplied with the sensor. The power source and output leads need to be soldered
to the male connector. The connector is disassembled by removing the two screws
holding the tail piece on and the single screw holding the halves together. The wires are
soldered to the sockets in the connector and the halves reassembled.
Assembly
Before assembly can be started, a few items need to be removed from the air
conditioner. The outer casing of the air conditioner needs to be removed first. This
requires the removal of the mounting screws as well as the air conditioner control knobs
and face-plate. The knobs and controls face-plate need to be retained for reinstallation.
Next, a damper control pull tab can be removed from the front duct.
The air conditioner should now be sent to an HVAC shop to have the refrigerant
recovered from the system. This needs to be done before the mass flow can be installed
and doing this first has the added safety of eliminating the possibility of puncturing a
31

high pressure line during assembly. With these items removed and the refrigerant
evacuated, the assembly process can begin.
The first item to be installed is the top cover. The first step in installing the top
cover is screwing the mass flow sensor to the cover. Next, the cover is fit over the front
coil and control box. Once the cover is in complete alignment, self-tapping sheet metal
screws are used to fasten the cover to the air conditioner.
The connector panels can now be installed. These panels are fastened by driving
self-tapping screws through the mounting flanges and into the air conditioner chassis.
The power cable for the air conditioner passes through the air conditioner body near the
location of the screws. This cable must be held out of the way of the screws to prevent
damage. Once the screws are in place, the cable needs to be held away from the
protruding screw points with a zip ties.
The guards can be installed with self-tapping screws. The location of the screws
needs to be examined to avoid piercing a tube in the coil.
The relative humidity sensor clips and brackets can be mounted after the guards
are in place. The bracket for the rear coil is adhered to the plastic coil shroud with
double-sided automotive trim tape. The remaining two are fastened with self-tapping
sheet metal screws.
As stated in the fabrication procedure for the transducers, a clearance cut needs to
be made on the air conditioner chassis before the pressure transducers can be installed.
This cut is best made with a die grinder. Installation of the pressure transducers is
simple. The valves can be installed on a variety of tubing diameters by using the shims
included with the valves. First, the transducer, adapter fittings, and valve assemblies are
32
made. Teflon tape needs to be used to ensure a good seal on the pressure transducer’s
pipe thread. The location of the valves is cleaned using a Scotch-Brite pad. The
required shim is then placed in the valve and the valve attached to the tube using the three
cap screws included with the valve. Any required adjustments to the rotational
orientation of the transducers in order to make them fit can be done by loosening one of
the flare fittings and rotating the assembly. The final step in installing the valve is to
thread the needle into the valve body, piercing the tube, and then back it out a full turn,
opening the valve. The nylon connectors are then fastened to the connector panel with 4-
40 machine screws.
The air conditioner is now ready to return to the HVAC shop to have additional
copper tubing routed to the mass flow and to have the refrigerant recharged. The
installation of the thermocouples must wait until after this process due to the relative
fragility of the thermocouples.
The thermocouples are supplied on adhesive backed pads. Installation of the
thermocouples involves cleaning the area of the tubing to which the thermocouple will be
installed with a Scotch-Brite pad and rinsing with acetone. Once the thermocouples are
adhered to the air conditioner, the female connectors can be mounted to the thermocouple
panel using the machine screws supplied with the panel mount brackets.
The final details of the installation can now be completed. The control panel
face-plate is attached with double-sided automotive trim tape. The face plate needs a
small clearance notch in the bottom right to clear a wire. With the plate installed, the
control knobs can be reattached by pressing them back onto the studs. This completes
the hardware installation. (See Figure 8, in Appendix 8)
33
Testing/Re-Design
Hardware (calibration):
The hardware consists of four components: the AC unit, the sensors, the
acquisition boards and the LabVIEW program. Part of the Testing of the air conditioning
unit was necessary before testing of the other hardware could be accomplished. First we
needed to determine that the unit was portable. Since the air conditioner easily fit on the
cart that we had purchased, it was concluded that the constraint of ‘portable’ was
satisfied. Secondly, it was necessary to determine how much noise was produced during
operation of the air conditioner. Using a decimeter we determined that the air conditioner
produced approximately 50dB during operation. This easily meets our target value of
60dB. Then we had University of Delaware HVAC evacuate the refrigerant so that the
pressure sensors could be installed; after we did that, we had UD HVAC recharge unit
with refrigerant. Again we had to make sure that the AC unit turned-on, and that the
refrigerant was not leaking in order for us to test the rest of the hardware.
Once we determined that the AC unit was functioning properly we were able to
proceed with the testing of the other three components of the hardware. First a sample
LabVIEW program was written. It is possible to test a program in LabVIEW by using its
capability to read-in sample data. Usually it would be difficult to test the sensors and the
acquisition board independently of each other. Fortunately the UD Mechanical
Engineering department has a number of sensors that have already been determined to
operate properly. With functional sensors we were able to determine the correlation
34

between LabVIEW channels and inputs on the acquisition board. In LabVIEW a
different ‘channel’ must be used for each input to the program from the acquisition board.
By specifying a ‘channel’ the user is telling LabVIEW where on the acquisition board to
‘look’ for a certain input.
With the acquisition board and the LabVIEW program being operational we were
able to turn our attention toward the sensors determining if they were operational and, if
so, how to calibrate them. The pressure sensors were not an issue since the manufacturer
calibrated them. They have a linear output of 1-5Volts with 1V being 0psi and 5V being
500psi.
The thermocouples, however, presented a bit more of a roadblock. The only
metric/restriction on thermocouples was that they be the economical and function over
the entire temperature range of the air conditioner. Therefore, we originally had
purchased ‘Type-T’ thermocouples since they best fit our temperature range and were
quite inexpensive. In trying to test them we immediately noticed that, although we had
‘Type-T’ thermocouples, the university’s acquisition board is equipped with ‘Type-K’
modules. The problem being that, since different ‘Type’s of thermocouples are specified
for different temperature ranges, the very same temperature is converted to different
voltages depending on the ‘Type’ of thermocouple. Since the manufacturer was not
aware of a correction factor between ‘Type-T’ and ‘Type-K’ products, a purchase was
required. We determined that buying ‘Type-K’ thermocouples was a more cost and time
effective option than re-quipping the acquisition board with ‘Type-T’ modules.
If only life were so simple. We come to find out that the range on ‘Type-K’
modules is 0-5Volts and 0-500degrees Celsius. The problem here is that there are points
35
in the air conditioning cycle that the temperature of the refrigerant drops below 0degrees
C. It is interesting to note that if in the LabVIEW program it is specified that the
expected voltage is –1-4V instead of 0-5V then the module is ‘tricked’ into accepting
different voltages than usual. And no error occurs since the module is still being asked to
accept voltages within a 5Volt range. Now the temperature range on the ‘Type-K’
thermocouples is effectively –100-400degrees C, as opposed to 0-500degrees C.
With this problem solved it became possible to calibrate the thermocouples. This
is necessary since the correlation between temperature and voltage is not precisely linear.
Calibration is done by placing the thermocouples in a medium of a known temperature;
namely ice water at 0degrees C and boiling water at 100degrees C. The voltage is read at
these two temperatures. With two points it is now possible to make a new linear
correlation between voltage and temperature. This correlation is approximately 93%
accurate and is thus acceptable given our target of 90%. However it is considerably more
reliable than simply taking –1V to be -100degrees C and 4V to be 400degrees C, and it
is accurate certainly enough for the purposes of our labs.
The mass flow sensor has it’s own read-out and thus does not need to be run
through LabVIEW. And although it is calibrated for the mass flow of Nitrogen a
correction factor for refrigerant was readily attainable. It was important, though, to have
the mass-flow sensor placed in a location where no phase is homogenous, since phase
change introduces error into the readings. Such a location is readily determined from an
understanding of the air conditioning cycle.
The relative humidity (rh) sensor has two outputs, temperature and relative
humidity. The temperature was calibrated using ice water and boiling water, the same as
36

for the thermocouples. And stream was used as the calibration medium for the relative
humidity. Actually, since this sensor uses temperature as one of its tools to calculate the
rh, the steam was used to check the accuracy. And with a rh near 97% was obtained
using steam, it was assumed that the relative humidity sensor was now properly
calibrated.
The velocity sensor is hand held with its own digital indicator and does not need
to be run through LabVIEW. It also has a temperature reading. It can be placed at the
inlet or exit of the condenser or evaporator and give a reading of the maximum velocity
of the airflow if held perpendicular to the flow.
The wattmeter is clamped to the end of the power cord and there is a digital read-
out, revealing the power drawn by the air conditioning unit.
Labs:
In order to test the labs we determined that it would be most effective to actually
have undergraduate students come-in to perform and evaluate them. The reason that this
is the most effective method is that our metrics for evaluating the labs are very subjective
and extremely difficult to evaluate using typical engineering methods. So, by talking to
experts in the educational field, out judgement to have student surveys was reinforced
and we proceeded thusly.
We had students from the ME undergraduate thermodynamics class come to our
lab in groups of 4 to perform any one of 4 labs that we had written. While they
performed the labs we, as instructors, made notes regarding the duration of the
37
experiment, how much time was spent waiting, and the nature of the questions that the
students asked.
After the students performed the lab we had them fill-out a survey. (See Appendix
H) On this survey we asked them to evaluate our lab in several key areas, we asked:
1) Did you learn/see a number of fundamentals?
2) Were the lessons/objectives clear?
3) Did you feel ‘real world’ connections?
4) Did the lab keep your interest?
5) Was the lab hands-on/interactive?
6) Was the procedure logical?
7) Was the lab fun?
With regard to these questions, the students rated the lab from 1 to 5 (1=poor,
5=excellent). We also asked them to write specifically which fundamentals they saw
demonstrated in the lab; this was to ensure that the students truly understood the point of
the lab. Most importantly, though, we asked the students to write down any suggestions
for making the experiment better.
After evaluating this first round of surveys we were rated with a high percentage
of 4’s and 5’s and no 1’s or 2’s (for complete results see appendix E). We received a
number of comments about what we had done well; but we also received a number of
suggestions. The suggestions included: better labeling the sensors and components of the
air conditioner; more clearly identifying the relation between the location of each sensor
and where its output was reading in LabVIEW. Also, we took note of the fact that the
38

students seemed to learn the most about the air conditioner when they were discussing its
functions among themselves.
Using their suggestions and our own observations we determined that it would be
beneficial to put all the experiments into a lab manual and include an introduction
explaining some important aspects of the labs. We also included a complete description
of all the hardware aspects of the lab (for a complete copy of our lab manual see
appendix F). Upon completion of the lab manual we brought all the students into the lab
for a second round of testing. Again we asked them to read the lab manual as well as run
an experiment after which they were to fill out a survey. The second round survey was
identical to the first round survey except that was asked for an additional evaluation: “If
you participated in the previous round of experiments, please comment on whether or not
you found the changes beneficial.”
The second round of surveys yielded extremely positive results. The percentages
of 4’s and 5’s rose significantly and all comments were positive. And every single
person who participated in the first round of experiments found our changes to be
beneficial (for complete results see appendix E).
Suggested Modifications:
We feel that, at this point, the lab manual that we have put together is truly an
optimization given the input that we have received from lab experts, educational experts,
and especially undergraduate students. However we also realize that we have never
participated a lab course in which we didn’t have suggestions for improvement.
Therefore we propose that, after each semester, the students should be asked for their
39
input and the lab manual should be modified accordingly. It will be known that he
modifications have been beneficial as long as the same criticisms do not continue to be
voiced.
Also, we feel that it would be beneficial to have a larger pool of experiments to
choose from. For instance, out of eleven total experiments, every semester four or five
will be chosen. Not only will this provide an option for the professor to choose labs
based on the specific needs of the class; but also it will help prevent the passing down of
experiments from older engineers. We realize that it is not uncommon for students to
obtain lab reports from older students and use them to aid in their own reports. By
simply re-using old reports the student will lose the benefits of putting their own
independent thought into the writing of the lab reports and especially the technical paper.
As for hardware modifications we suggest that the mechanical engineering
department purchase an entirely new apparatus. This includes: a new air conditioner,
specifically a different brand; and new sensors, specifically different types of the same
kind of sensor. By having an entirely new apparatus the students will be able to
investigate how different air conditioners look and operate, as well as differences in
accuracy’s between different types of sensors. Both of these are important real-life skills
for an engineer. This should not be a monetary problem given the fact that we completed
the entire design project for approximately half of our expected budget, although this
could possibly turn out to be a problem in terms of actually finding someone to spend the
time doing this.
40
Conclusion:
In conclusion it can be seen that through our surveys we have satisfied our wants
of ‘educational effectiveness’ and ‘self evident’. Since the components of the air
conditioner are both visible and accessible the want of ‘easy to use’ is satisfied. Our
experiments can be set-up in less than 15 minutes and all of the parts fit on our cart, thus
we conclude that our experiment is ‘easy to set-up’. Our experiments successfully
demonstrate the desired thermodynamic and heat-transfer concepts (as set-forth) by Dr.
Advani and Dr. Wexler, therefore we have demonstrated ‘multiple purposes’. Our
apparatus is LabVIEW compatible, and is thus ‘compatible with a data acquisition
program’. The air conditioner operates under 60dB and can thusly be considered ‘quiet’.
And finally the experiments were completed in 20min, well under the desired 2 hours,
and are therefore ‘quick’.
It needs to be made clear, if not already done so, that the wants of ‘educational
effectiveness’ and ‘self evident’ truly drove our project. While ‘easy to use’ was the
second most important want that, along with most of the other wants were both very
easily measurable and easily obtainable using our metrics and target values.
Consequently, nearly all of our time was spent meeting the two aforementioned wants.
41
Wants Metrics Target Values Obtained Values
1Educational
Effectiveness Survey 4 4.6Judy Green approval approval
3 Self Evident Survey 4 4.6

This table includes the metrics we feel drove our project. A table including the rest of
wants can be found in Appendix K.
Through benchmarking and evaluation of our customers’ wants and constraints,
we determined our metrics as well as target values for each metric. Benchmarking and
input from our customer provided the necessary information for brainstorming concepts
and determining the optimal solution. We tested our prototype, including a lab-manual
and apparatus, and made modifications where necessary. The final product consists of a
window air conditioning unit, fully instrumented and labeled without redundancy, a lab
manual consisting of four component-based labs, and a recommendation for short lab
reports with a technical paper. We completed our project within the given time constraint
and well under budget. Our customers are thoroughly satisfied with the final product.
We have successfully completed the project.
42
Appendix A:
The SSD Chart.
See file Appendix A_Team 10.xls
Appendix B:
Table: Wants – Metrics – Target Values (Prioritized)
See file Appendix B_Team 10.xls
Appendix C:
The evaluation chart.
See file Appendix C_Team 10.xls
43
Appendix D:
The budget
44
Appendix E:Test Results
45
46

Appendix F:
Lab Manual for
Air Conditioning Experiments
For Heat Transfer and ThermodynamicsJoint Laboratory
47
Mission Statement:
Our mission is to teach the students the Thermodynamic and Heat Transfer principles of a window air conditioner with as little guidance as possible. This lab manual consists of what we hope is the only necessary information needed for the student to independently investigate these principles. We envision the lab time spent as a brainstorming session for the student to discuss the air conditioner with minimal time spent collecting data.
WARNING: Be careful when examining the air conditioner, as some of the parts get
very hot!
48

Table of Contents
Introduction………………………………………………..50
Schematic of Refrigeration Cycle…………………………51
Description of Parts………………………………………..52
Sensors……………………………….……………………53
LabVIEW Controller……………………………………...54
Lab Reports………………………………………………..56-66
Compressor……………………...…..56
Throttling Valve………………....…..59
Air Flow Across the Coil……….……62
The Ideal Air-Conditioning Cycle…...65
References…………………………………………………68
49
Introduction:
The basic objective of an air conditioner (or window AC as it would be) is to
remove heat from the air of a room that is being cooled. The heat is discharged to the
environment outside the room. It should be noted that the same air conditioner could be
used as a heat pump as well by simply turning it around. In this case the air conditioner
would be absorbing heat from the outside environment and rejecting it into the room.
The ideal vapor-compression refrigeration cycle is the most widely used for
refrigerators, air conditioning systems, and heat pumps. It is composed of four processes.
Starting form the compressor, refrigerant is isentropically compressed. Then, it is sent
through the condenser, where pressure remains constant. From the condenser, warm air
is rejected into the outside environment. From there, the refrigerant flows through the
throttling valve, which is an expansion device. Next, the refrigerant is sent through the
evaporator, where pressure is again constant (as in the condenser). Finally, the
refrigerant reaches the compressor where the cycle begins all over again.
It is important to recognize that the refrigerant does not simply flow through the
devices mentioned above. The refrigerant is experiencing phase changes throughout the
cycle. As the refrigerant enters the compressor, it is a saturated vapor. During the
compression process, the temperature of the refrigerant increases to well above that of the
surroundings. As it enters the condenser it is a super-heated vapor, and it leaves as a
saturated liquid. This phase change results from the refrigerant losing heat while flowing
through the condenser. It should be noted that the temperature of the refrigerant at this
phase is still well above that of the environment.
Upon entering the throttling valve, the refrigerant experiences a pressure-drop,
which in turn results in a decrease in temperature. It is at this point that the temperature
of the refrigerant finally falls below that of the surroundings. As it enters the evaporator
the refrigerant is a low quality saturated mixture. The refrigerant uses the heat from the
room to provide the necessary energy to complete the evaporation process. At this point
it is again a saturated vapor and ready to re-enter the compressor and start the cycle over.
50

It is often helpful to use graphs to interpret the process, which is the air-
conditioning cycle. One such graph is the ‘T-s diagram’. The heat transfer for internally
reversible processes is represented as the area under the process curve ‘4-1’ (as shown in
figure 2).
Another commonly used graph is the ‘P-h’ diagram. As can be seen from figure
3, three of the four processes appear as straight lines. The heat transfer in the condenser
and the evaporator is proportional to the lengths of the corresponding process lines.
51
Description of Parts:
Condenser/Evaporator:
In the window air conditioner, the condenser and the evaporator are actually heat
exchangers. All that can be seen of either one are the ‘U’ shaped coils attached to the
sides on the front and the back of the unit. One set of coils gets hot and the other gets
cold, so be careful when touching them.
Throttling Valve:
A throttling valve, in this case, reduces the pressure of the refrigerant. To achieve
this, the refrigerant should flow from a smaller diameter tube to a larger diameter tube. If
you still are unsure where the throttle is, ask the TA.
Compressor:
The compressor is the tall black cylinder that sits between the heat exchangers. It
gets very hot when the air conditioner has been running after several minutes.
Other:
The little black cylinder behind the compressor is a collector that has no effect on
the Thermodynamic/Heat Transfer processes of the unit, so it is ignored. Fans are needed
to move the air over the coils of the heat exchangers. There are two of them. They are
both attached to the same motor, which is located next to the collector, between the heat
exchangers. A shield covers them for your safety.
52
Sensors:
Numbering of the Sensors:
The sensors are labeled with numbers. These numbers are made to correspond
with the LabVIEW program. They have no significance to any other numbering scheme
mentioned in this laboratory manual or any of the written lab instructions.
Pressure Sensors:
There are four pressure sensors placed throughout the air conditioner. Basically
one between each device (between the condenser and the compressor, etc.) They are
black with the OMEGA label on them. They measure the pressure in volts (1-5V, 1
being 0 psi and 5 being 500 psi). They are connected to the data acquisition board
through the blue wires.
Thermocouples:
There are also four thermocouples, placed the same as the pressure sensors. They
are attached to the outside wall of the tubing. They are connected to the data acquisition
board through the copper wires. Their output (in volts) is converted by LabView, and is
displayed in degrees Celsius.
Relative Humidity Sensor:
This sensor is long and cylindrical in shape, and silver in color. It mounts to the
air conditioner in three places, the outside of the evaporator, the outside of the condenser,
and in between the two. It has two functions, measuring the relative humidity of the air
and the temperature of the air. It output is also in volts, and converted by LabView to %
relative humidity and degrees Celsius, respectively.
53

Mass flow sensor:
The box mounted on top of the casing is the mass flow sensor. It has a digital
display of it’s own. The number shown must be multiplied by a conversion factor of
0.4956, for refrigerant-22.
Velocity Sensor –
A hand held device use to measure the velocity and temperature of the air exiting
the condenser and the evaporator. This device is used by simply holding it in front of
desired air flow. NOTE: The fan should be perpendicular to the direction of the flow to
maximize accuracy. This device also had a digital indicator of it’s own. The output of the
temperature is in degrees Celsius, and the velocity is in meters per second.
Watt Meter:
This clamps to the power cord of the air conditioner, which is connected to the
outlet. A digital read-out shows how much power the air conditioner is using.
LabVIEW Program:
The LabVIEW program (see Appendix H) is interfaced with the data acquisition
boards. The two acquisition boards are 1) a green box, and 2) a green board with blue
boxes. The green box is connected to the pressure sensors and the mass flow sensor. The
green board with the blue boxes is connected to it; it reads the thermocouple outputs and
the relative humidity sensor outputs. Our LabVIEW program (see Appendix H) reads
and converts the signals from each of the sensors to their respective units of measure, for
example pressure is converted from volts to psi and temperature in Kelvin. LabVIEW
has the capability to read up to sixteen channels. The green board with the blue boxes is
read into the first eight channels (0-7), and the green box reads into the upper eight
channels (8-15).
The pressure sensors are labeled 1-4 and their respective channels are 8-11. The
thermocouples are also labeled 1-4, and their respective channels are 0-3. The mass flow
54

is read through channel 12, and the relative humidity is read through channel 4. Be sure
the check the channel numbers BEFORE collecting any data.
55
Compressor
Objectives:To understand the thermodynamic principles involved in the function of a
compressor. To use conservation of energy to find heat loss to the environment.
Background:The purpose of a compressor is to increase the pressure of a fluid. Work is done
on the fluid therefore the work term is negative when dealing with a compressor. Certain engineering assumptions are made when dealing with a compressor:
(figure 1)
56
In the case of a compressor there is intentional cooling, therefore the heat transfer term cannot normally be neglected
A compressor involves a rotating shaft crossing its boundaries, therefore the work term is important.
The change in potential energy is normally quite small and thus neglected.
In a compressor the velocities involved are usually not high enoughto effect the kinetic energy at all, especially compared to the change in enthalpy.
1.
2.
3.
4.
0
0
0
0
ke
pe
W
Q
P1,T1
P2,T2
q

A compressor can be modeled as a steady flow system.
Relevant Equations:
Conservation of Energy:
q – w = h + pe + ke (eq. 1)
By making the assumptions presented previously, eq. 1 can be reduced to
q – w = h (eq. 2)
Power:
Power = (mass flow rate)*(work per unit mass w) (eq. 3)
Procedure:
1. Measure the temperature and pressure at the inlet (1) and exit (2) of the compressor.Note: The numbers (1) and (2) do not correspond to the sensor numbers only the figure 1 numbers.
2. Measure the mass flow rate of refrigerant (read from indicator on sensor).3. Determine the power input to the compressor by reading the current and voltage off the motor to the fan. OPTIONAL: Read the power from the Power Clamp on the cord, which is connected to the electrical outlet.
Analysis:
1. Do the measured values of temperature and pressure correspond to what you know is happening in the compressor? Explain in terms of thermodynamic principles.
2. Using the measured temperature and pressure values, determine the specific enthalpy h at the inlet and exit using the refrigerant tables in the back of your thermodynamics text.
3. Solve for the work done on the fluid using the power input (read from the fan motor) to the compressor and eq. 3.
57

4. Solve for the heat loss to the environment using the values from parts 1 and 2 of the analysis and eq. 2.
5. Calculate the power input to the compressor using eq. 3, assuming heat loss can be neglected. Could this be a reasonable engineering assumption? Explain.
6. OPTIONAL: Compare the power calculated from reading the voltage and current off the fan motor to the power reading from the Power Clamp. Explain differences.
58
Throttling Valve
Objectives:To understand the thermodynamic principles involved in the function of a
throttling valve. To determine whether approximating the fluid as saturated at the inlet of the valve is a good engineering approximation. To determine the relationship between the quality of the mixture at the exit and the temperature.
Background:The purpose of a throttling valve is to cause a significant drop in the pressure of
the fluid. A good example of this is any adjustable valve such as a sink faucet. Along with the drop in pressure comes a drop in temperature. In an air conditioner, it is this temperature drop that is the primary purpose of a throttling valve. As with any device, several engineering assumptions are made in order to simplify the analysis:
(figure 2)
A throttling valve can be modeled as a steady flow system.
59
The fluid is usually moving rather quickly and throttling valves are usually small. Thus it is assumed that there is neither sufficient time nor area for significant heat transfer to occur.
A throttling valve involves no moving boundaries and therefore no work is done by or on the fluid.
The change in potential energy is normally quite small and thus neglected.
Even though the change in velocity can be quite large, the change in kinetic energy is considered insignificant.
1.
2.
3.
4. 0
0
0
0
ke
pe
w
q
fluid
Throttling Valve
Relevant Equations:
Conservation of Energy:
q – w = h + pe + ke (eq. 1)
By making the assumptions presented previously, eq. 1 can be reduced to
h = 0 or h1 = h2 (eq. 2)
It is more useful to expand eq. 2:
u1 + P1v1 = u2 + P2v2 (eq. 3)whereP is the pressureu is the internal energy, andv is the specific volume.
Qualityx = mvapor (eq. 4)
mtotal
where mvapor is the mass of the vapor, andmtotal is the total mass of the liquid and the vapor
It can be derived that:x = (hav – hf)/hfg (eq. 5a)x(exit) = (h(e) – hf(e) )/hfg(e) (eq. 5b)where hf is the specific enthalpy of the liquidhfg is the difference between the specific enthalpy of the fluid and the gas, andhav is defined as hf + xhfg.the subscript e is for the exit pressure
Procedure:
1. Measure the temperature and pressure at the inlet (1) and exit (2) of the throttling valve. NOTE: The numbers (1) and (2) do not correspond to the sensor numbers, but they do correspond to the numbers in figure 1.2. Measure the mass flow rate of refrigerant (read from indicator on the sensor).
60
3. Repeat step 1 for at least 2 more settings on the air conditioner (e.g. low, med, high).
Analysis:
Questions 1 through 3 need only be evaluated at 1 air conditioner setting.7. Using only the inlet pressure reading and assuming that the refrigerant is a saturated
liquid as it flows through the throttling valve, find the specific enthalpy.8. Assuming that the enthalpy across a throttling valve does not change, use the enthalpy
from question 1 and the reading of the exit pressure, determine what state the mixture at the exit is.
9. If the refrigerant is a saturated mixture at the exit, find the quality using equation 5b.10. Using the temperature and the pressure form the inlet reading, does the previous
assumption that the inlet and of the throttling valve is a saturated refrigerant? Explain why or why not.
11. What is the temperature change for this process? A) Using the saturation temperatures from the given pressures. B) Using the data read off of the air conditioner. Is there a difference and if so, explain.
61

Air Flow Across the Coil
Objective:To understand the heat transfer principles by determining the convection heat
transfer rate involved with cross flow over the coils (tubes).
Background:There is a coolant flowing inside the coils and as the air flows over the coils, heat
is transferred between the flowing coolant in the coil and the air around it. The rate at which the heat is transferred is dependent upon the heat transfer coefficient. The coil rows are either arranged in an aligned or staggered bank.
geometry of the coils
V, T (Tinlet)
ST
SL
Relevant Equations:
Maximum Velocity of the fluid around the tube
(eq. 1)
V is the measured velocity
Reynolds number for the air
(eq. 2)
D is the diameter of the tube is for the inlet of the air
Air-side Nusselt number
(eq. 3)
C2, C, and m values come from tables 7.7 and 7.8 from the Heat Transfer book
62
The other properties are evaluated at the average of the inlet and outlet temperature of the fluid and the subscript s is for the surface temperature.
The average heat transfer coefficient
(eq. 4)
the k value is from the inlet of the air
Knowing only the inlet temperature of the fluid in the coil
(eq. 5)
N is the number of coils NT is the number of coils that are first hit by the air flow and cp are properties from the inlet of the air
Log mean temperature difference
(eq. 6)
Ts is the temperature of the coil surface
Heat transfer rate per unit length of the tube
(eq. 7)
Procedures:1. Measure the diameter of the coil.2. Count the number of coils that are first hit by the air and the total number of coils for
each exchanger (for every U shape seen, there are two coils running through).3. Find the coil surface temperature.4. Find velocity of the air entering the coils.5. Find the temperature of the air entering the flow over the coils. 6. With the humidity sensor, take relative humidity and temperature readings of the air
near the cool side of the air conditioner.7. Repeat step 6 at the other locations on the air conditioner.
Analysis:
63

1. Using the tables in the back of the Heat Transfer book find the relevant properties of the air using table A4. Air properties using temperatures of the inlet and the coil surface.
2. Using the given equations, find the convection heat transfer rate.3. Looking at the temperature and the relative humidity data, is this a comfortable
atmosphere?
64
The Ideal Air-Conditioning Cycle
Objectives:To determine the coefficient of performance (COP) of a window air-conditioner
using the assumptions of an ideal vapor-compression refrigeration cycle. To determine the rate of heat removal from the refrigerated space and heat rejected from the refrigerant to the environment. To determine the power into the compressor.
Background:The ideal vapor-compression refrigeration cycle is the most commonly
used/assumed cycle for air-conditioning. This cycle in made-up of four processes:
1-2 Isentropic compression in a compressor.2-3 Heat rejection in a condenser coil, P = constant.3-4 Expansion in the throttling valve.4-1 Heat absorption in an evaporator coil, P = constant.
(Figure 1)
For an ideal cycle the refrigerant enters the compressor as a saturated vapor and is compressed isentropically. The temperature increases during the compression. The refrigerant enters the condenser as a superheated vapor and leaves as a saturated liquid.
65
Win
3
4
2
1
Evaporator
Condenser
Compressor
Throttling Valve
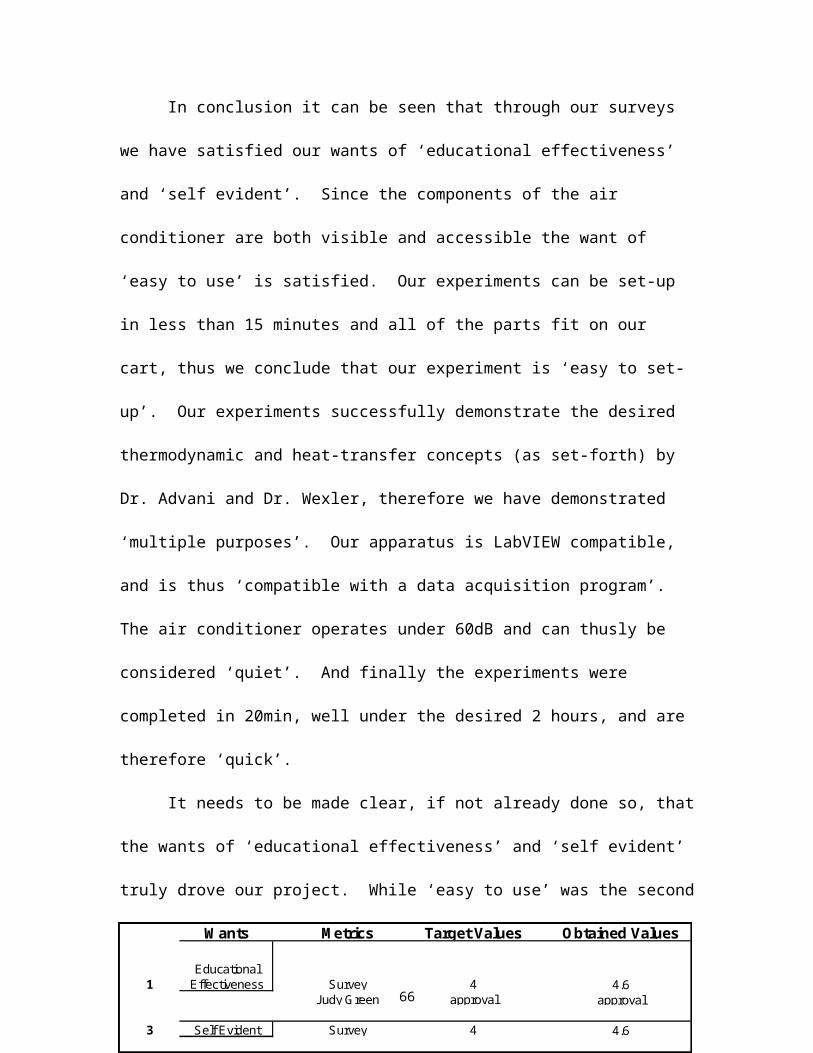
The pressure and temperature both drop as it passes through the throttling valve. The refrigerant then enters the evaporator as a low quality mixture and evaporates completely as it absorbs heat from the surroundings.
All four parts can be modeled as steady-flow devices. The change in kinetic and potential energy are usually small compared to the work and potential energy terms. The conservation of energy equation reduces to:
q – w = he - hi (eq. 1)
The condenser and evaporator do not involve any work. The compressor can be approximated as adiabatic. The COP of an air conditioner can be expressed as:
(eq. 2)
(eq. 3)In the ideal case h1 = hg@P1 and h3 = hf@P3.
Relevant Equations:
Rate of Heat removal
(eq. 4)
Power input
(eq. 5)
Procedure:
1. Measure the temperature and pressure each of the four states described in the background.2. Measure the mass flow rate of refrigerant (read from the indicator on the sensor).
66
3. OPTIONAL: Read the voltage and current from the fan motor and the power given by the Power Clamp.
Analysis:
12. Determine the specific enthalpy h at each of the four states using the refrigerant tables in the back of your thermodynamics text.
13. Using the answers from (1):(a) Use eq. 4 to determine the rate of heat removal from the refrigerated space.(b) Use eq. 5 to determine the power input to the compressor.(c) Use eq. 4 to determine the rate of heat rejection from the refrigerant to the
environment.14. Determine the coefficient of performance of the refrigerator and the heat pump using
equations 2 and 3 respectively.15. OPTIONAL: Compare the power calculated in 2b to the power obtained by reading
voltage and current from the motor of the fan and to the power read from the Power Clamp.
67

References:
Boles, Dr. Michael A., and Dr. Yunus A. Cengel, Thermodynamics, An Engineering
Approach, McGraw-Hill Inc., New York, 1994.
Dewitt, David P., and Frank P. Incropera, Introduction to Heat Transfer, Third Edition,
John Wiley & Sons, New York, 1985, pp. 351-360, 757.
68

Appendix G:
The drawing package
Figure 1
69

Figure 2
70

Figure 3
71

Figure 4
72
Figure 5
73

Figure 6
Brian Davison’s Responsibility
74
Figure 7
Brian Davison’s Responsibility
75
Figure 8
Brian Davison’s Responsibility
76
Appendix H:
The surveys
Instructor Survey
Name of Lab Preformed __________________________________________
Start time _______ End time __________
Number of students in the group _____________
What questions did the students ask?________________________________________________________________________________________________________________________________________________________________________________________________________________________________________________________________________________________________________________________________________________________________________
How many of the above questions pertain to each of the following?
Procedure ____________Data Analysis ____________Other _____________
How much of the time was spent waiting, “down time”? _____________________
77

Student Survey (1st Round)
Name: _________________________________
Name of Lab: ____________________________ Date: _____________
Please answer the following questions on the basis of your personal experience during the lab. Please choose a number rating between one and five, with one being the lowest and five being the highest.
Did you learn/see a number of fundamentals? 1 2 3 4 5
Were the lessons/objectives clear? 1 2 3 4 5
Did you feel “real world” connections? 1 2 3 4 5
Did the lab keep your interest? 1 2 3 4 5
Was the lab hands-on/interactive? 1 2 3 4 5
Was the procedure logical? 1 2 3 4 5
Was the lab fun? 1 2 3 4 5
What fundamentals did you see demonstrated in this experiment:________________________________________________________________________________________________________________________________________________________________________________________________________________________________________________________________________________________________
Thank you for your time and patience, your participation is greatly appreciated.Please list any comments or suggestions you may have below; they would be extremely beneficial to us.
Comments/Suggestions:________________________________________________________________________________________________________________________________________________________________________________________________________________________________________________________________________________________________
78

Student Survey (2nd Round)
Name: _________________________________
Name of Lab: ____________________________ Date: _____________
Please answer the following questions on the basis of your personal experience during the lab. Please choose a number rating between one and five, with one being the lowest and five being the highest.
Did you learn/see a number of fundamentals? 1 2 3 4 5
Were the lessons/objectives clear? 1 2 3 4 5
Did you feel “real world” connections? 1 2 3 4 5
Did the lab keep your interest? 1 2 3 4 5
Was the lab hands-on/interactive? 1 2 3 4 5
Was the procedure logical? 1 2 3 4 5
Was the lab fun? 1 2 3 4 5
If you participated with Dr. Wexler’s class, please comment on whether or not you found the changes beneficial.________________________________________________________________________________________________________________________________________________________________________________________________________________________________________________________________________________________________
Thank you for your time and patience, your participation is greatly appreciated.Please list any comments or suggestions you may have below; they would be extremely beneficial to us.
Comments/Suggestions:________________________________________________________________________________________________________________________________________________________________________________________________________________________________________________________________________________________________
79

Appendix J:LabVIEW ProgramSee file Team10.vi
80
Appendix K:
Table: Metrics: Target values versus Obtained Values
See file Appendix K_Team 10.xls
81