final results 2016/17 investor presentation april 2017 presentation april 2017. 2 ... • business...
TRANSCRIPT
Final Results 2016/17Investor Presentation
April 2017
2
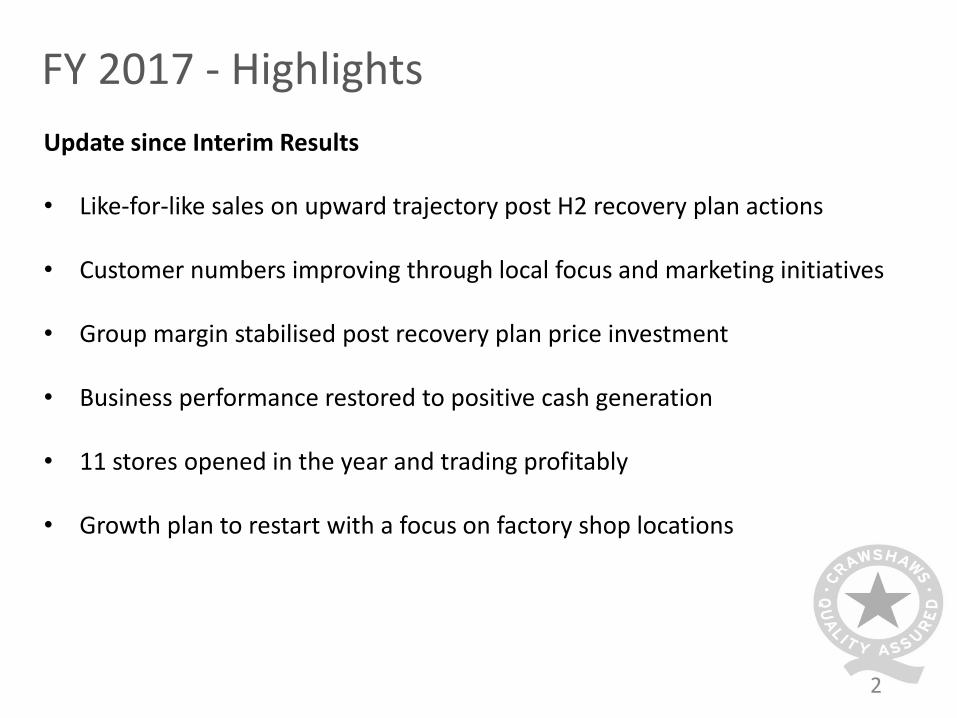
FY 2017 - Highlights
Update since Interim Results
• Like-for-like sales on upward trajectory post H2 recovery plan actions
• Customer numbers improving through local focus and marketing initiatives
• Group margin stabilised post recovery plan price investment
• Business performance restored to positive cash generation
• 11 stores opened in the year and trading profitably
• Growth plan to restart with a focus on factory shop locations
FINANCIAL PERFORMANCE
4
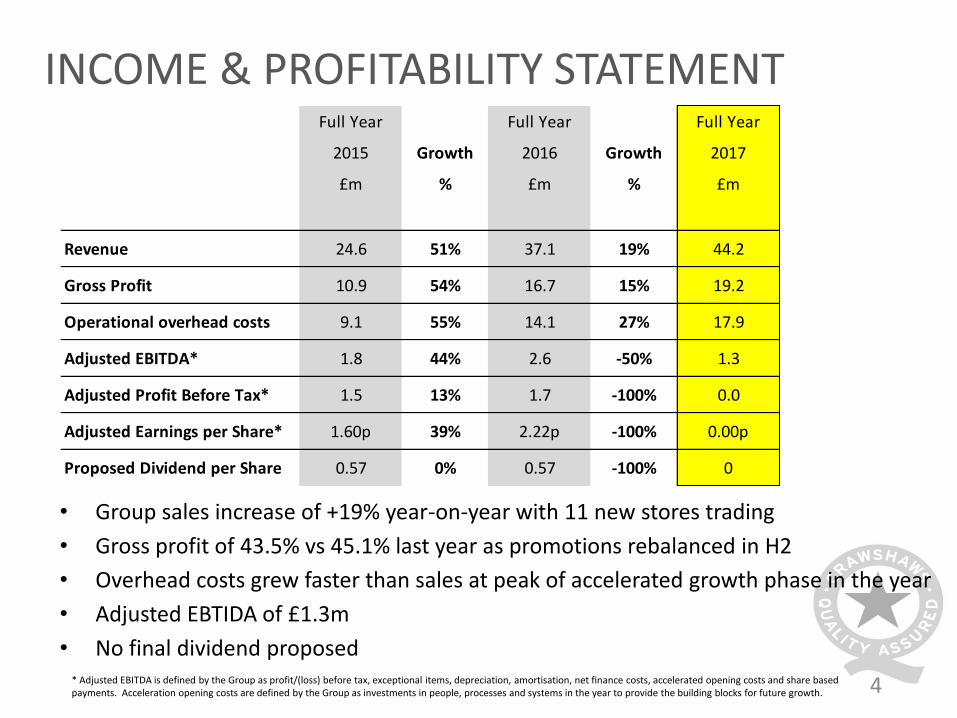
INCOME & PROFITABILITY STATEMENT
• Group sales increase of +19% year-on-year with 11 new stores trading
• Gross profit of 43.5% vs 45.1% last year as promotions rebalanced in H2
• Overhead costs grew faster than sales at peak of accelerated growth phase in the year
• Adjusted EBTIDA of £1.3m
• No final dividend proposed* Adjusted EBITDA is defined by the Group as profit/(loss) before tax, exceptional items, depreciation, amortisation, net finance costs, accelerated opening costs and share based payments. Acceleration opening costs are defined by the Group as investments in people, processes and systems in the year to provide the building blocks for future growth.
Full Year Full Year Full Year
2015 Growth 2016 Growth 2017
£m % £m % £m
Revenue 24.6 51% 37.1 19% 44.2
Gross Profit 10.9 54% 16.7 15% 19.2
Operational overhead costs 9.1 55% 14.1 27% 17.9
Adjusted EBITDA* 1.8 44% 2.6 -50% 1.3
Adjusted Profit Before Tax* 1.5 13% 1.7 -100% 0.0
Adjusted Earnings per Share* 1.60p 39% 2.22p -100% 0.00p
Proposed Dividend per Share 0.57 0% 0.57 -100% 0
5
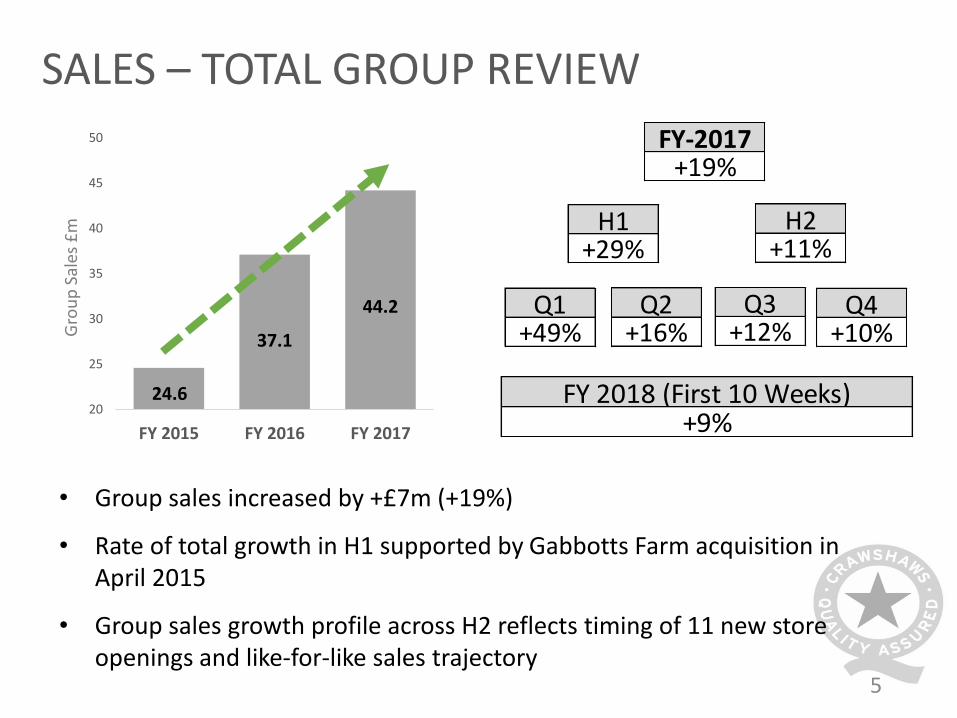
SALES – TOTAL GROUP REVIEW
H1+29%
H2+11%
24.6
37.1
44.2
20
25
30
35
40
45
50
FY 2015 FY 2016 FY 2017
Q3+12%
Q4+10%
FY-2017+19%
• Group sales increased by +£7m (+19%)
• Rate of total growth in H1 supported by Gabbotts Farm acquisition in April 2015
• Group sales growth profile across H2 reflects timing of 11 new store openings and like-for-like sales trajectory
Q1+49%
Q2+16%
FY 2018 (First 10 Weeks)+9%
Gro
up
Sal
es £
m
6
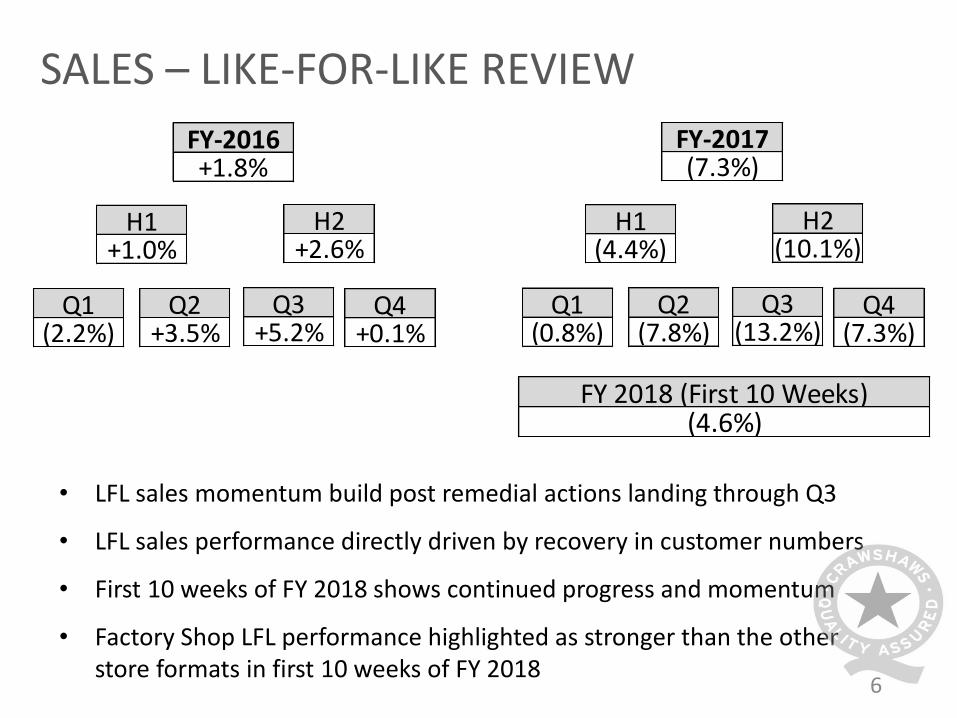
SALES – LIKE-FOR-LIKE REVIEW
• LFL sales momentum build post remedial actions landing through Q3
• LFL sales performance directly driven by recovery in customer numbers
• First 10 weeks of FY 2018 shows continued progress and momentum
• Factory Shop LFL performance highlighted as stronger than the other store formats in first 10 weeks of FY 2018
H1(4.4%)
H2(10.1%)
Q3(13.2%)
Q4(7.3%)
FY-2017(7.3%)
Q1(0.8%)
Q2(7.8%)
H1+1.0%
H2+2.6%
Q3+5.2%
Q4+0.1%
FY-2016+1.8%
Q1(2.2%)
Q2+3.5%
FY 2018 (First 10 Weeks)(4.6%)
7
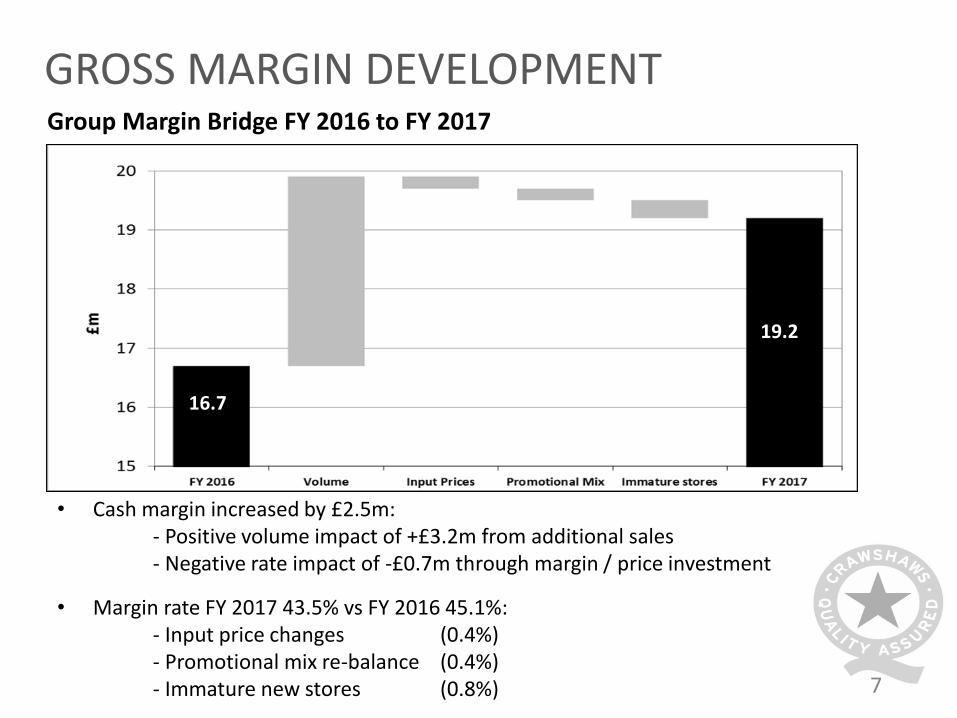
GROSS MARGIN DEVELOPMENT
• Cash margin increased by £2.5m:- Positive volume impact of +£3.2m from additional sales- Negative rate impact of -£0.7m through margin / price investment
• Margin rate FY 2017 43.5% vs FY 2016 45.1%:- Input price changes (0.4%)- Promotional mix re-balance (0.4%)- Immature new stores (0.8%)
19.2
16.7
Group Margin Bridge FY 2016 to FY 2017
19.2
16.7
8
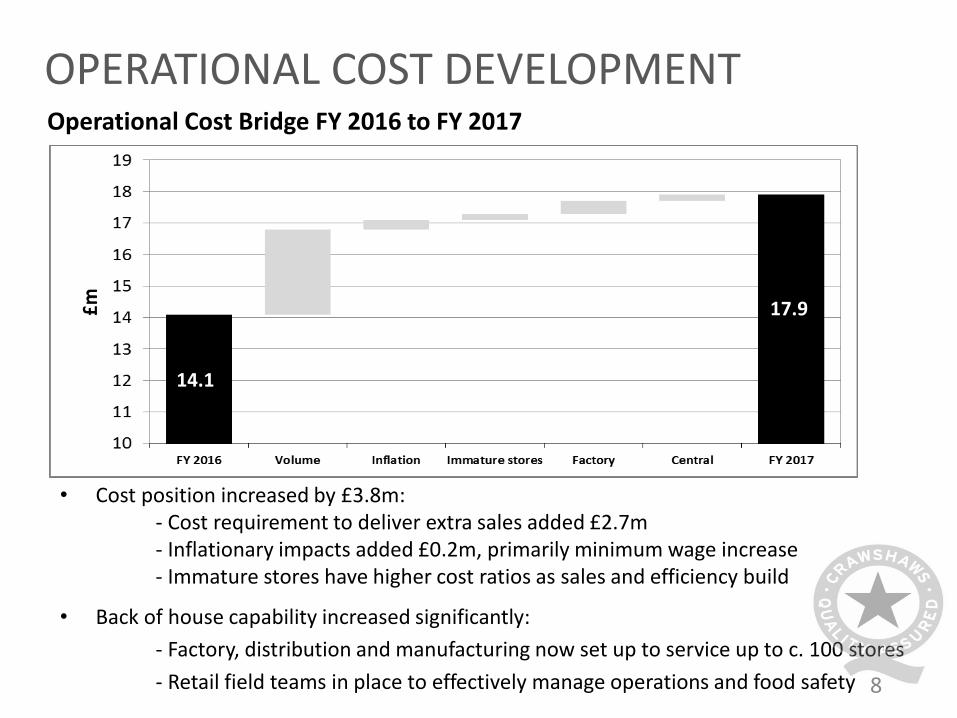
OPERATIONAL COST DEVELOPMENT
• Cost position increased by £3.8m:- Cost requirement to deliver extra sales added £2.7m- Inflationary impacts added £0.2m, primarily minimum wage increase- Immature stores have higher cost ratios as sales and efficiency build
• Back of house capability increased significantly:
- Factory, distribution and manufacturing now set up to service up to c. 100 stores
- Retail field teams in place to effectively manage operations and food safety
14.1
17.9
Operational Cost Bridge FY 2016 to FY 2017
9
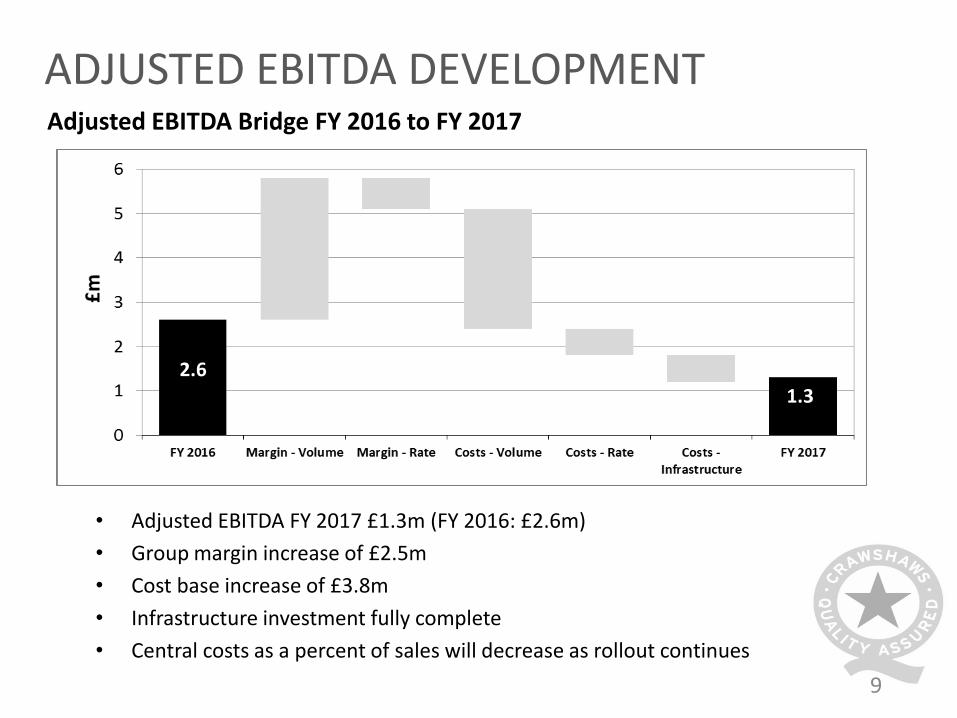
ADJUSTED EBITDA DEVELOPMENT
• Adjusted EBITDA FY 2017 £1.3m (FY 2016: £2.6m)
• Group margin increase of £2.5m
• Cost base increase of £3.8m
• Infrastructure investment fully complete
• Central costs as a percent of sales will decrease as rollout continues
2.61.3
Adjusted EBITDA Bridge FY 2016 to FY 2017
10
*
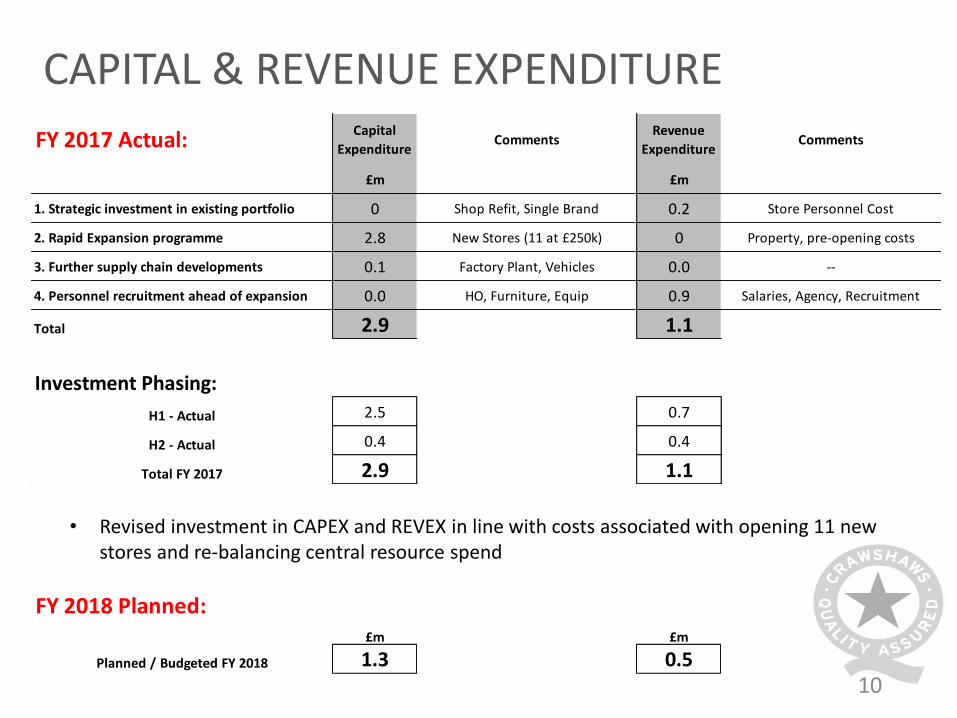
• Revised investment in CAPEX and REVEX in line with costs associated with opening 11 new stores and re-balancing central resource spend
CAPITAL & REVENUE EXPENDITURE
FY 2017 Actual:Capital
ExpenditureComments
Revenue
ExpenditureComments
£m £m
1. Strategic investment in existing portfolio 0 Shop Refit, Single Brand 0.2 Store Personnel Cost
2. Rapid Expansion programme 2.8 New Stores (11 at £250k) 0 Property, pre-opening costs
3. Further supply chain developments 0.1 Factory Plant, Vehicles 0.0 --
4. Personnel recruitment ahead of expansion 0.0 HO, Furniture, Equip 0.9 Salaries, Agency, Recruitment
Total 2.9 1.1
Investment Phasing:
H1 - Actual 2.5 0.7
H2 - Actual 0.4 0.4
Total FY 2017 2.9 1.1
FY 2018 Planned:£m £m
Planned / Budgeted FY 2018 1.3 0.5
11
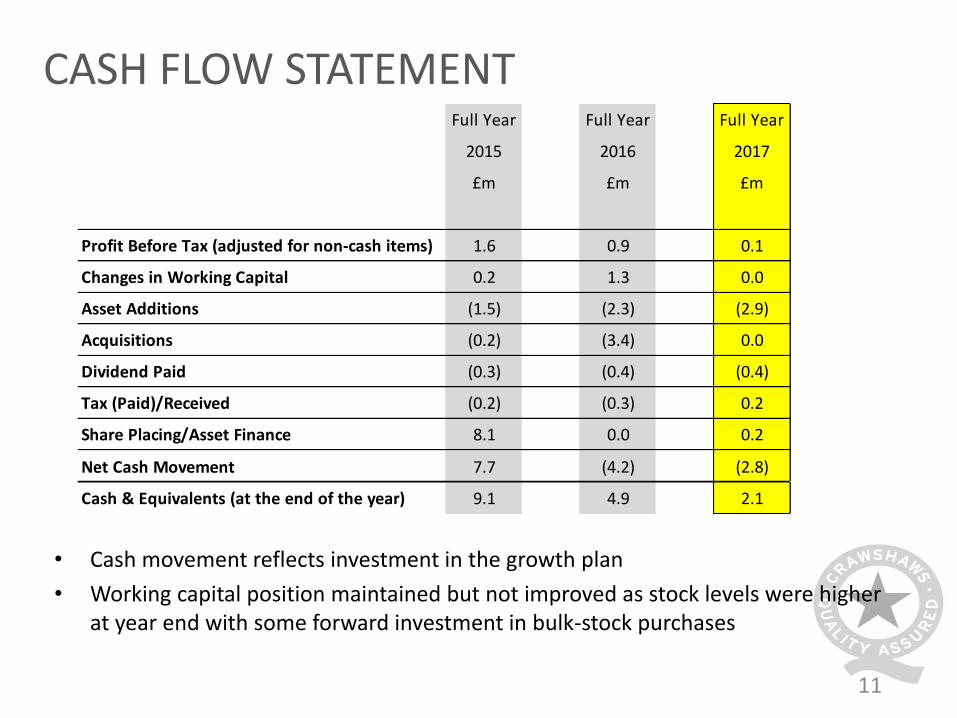
CASH FLOW STATEMENT
• Cash movement reflects investment in the growth plan
• Working capital position maintained but not improved as stock levels were higher at year end with some forward investment in bulk-stock purchases
Full Year Full Year Full Year
2015 2016 2017
£m £m £m
Profit Before Tax (adjusted for non-cash items) 1.6 0.9 0.1
Changes in Working Capital 0.2 1.3 0.0
Asset Additions (1.5) (2.3) (2.9)
Acquisitions (0.2) (3.4) 0.0
Dividend Paid (0.3) (0.4) (0.4)
Tax (Paid)/Received (0.2) (0.3) 0.2
Share Placing/Asset Finance 8.1 0.0 0.2
Net Cash Movement 7.7 (4.2) (2.8)
Cash & Equivalents (at the end of the year) 9.1 4.9 2.1
12
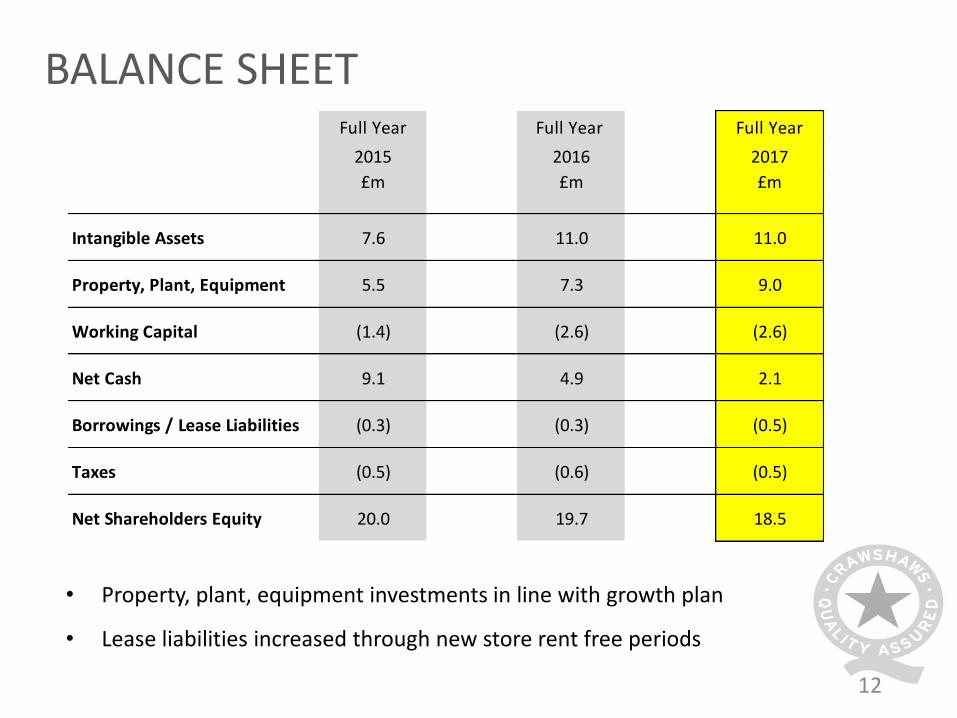
BALANCE SHEET
• Property, plant, equipment investments in line with growth plan
• Lease liabilities increased through new store rent free periods
Full Year Full Year Full Year
2015 2016 2017
£m £m £m
Intangible Assets 7.6 11.0 11.0
Property, Plant, Equipment 5.5 7.3 9.0
Working Capital (1.4) (2.6) (2.6)
Net Cash 9.1 4.9 2.1
Borrowings / Lease Liabilities (0.3) (0.3) (0.5)
Taxes (0.5) (0.6) (0.5)
Net Shareholders Equity 20.0 19.7 18.5
INITIATIVES UPDATE
14
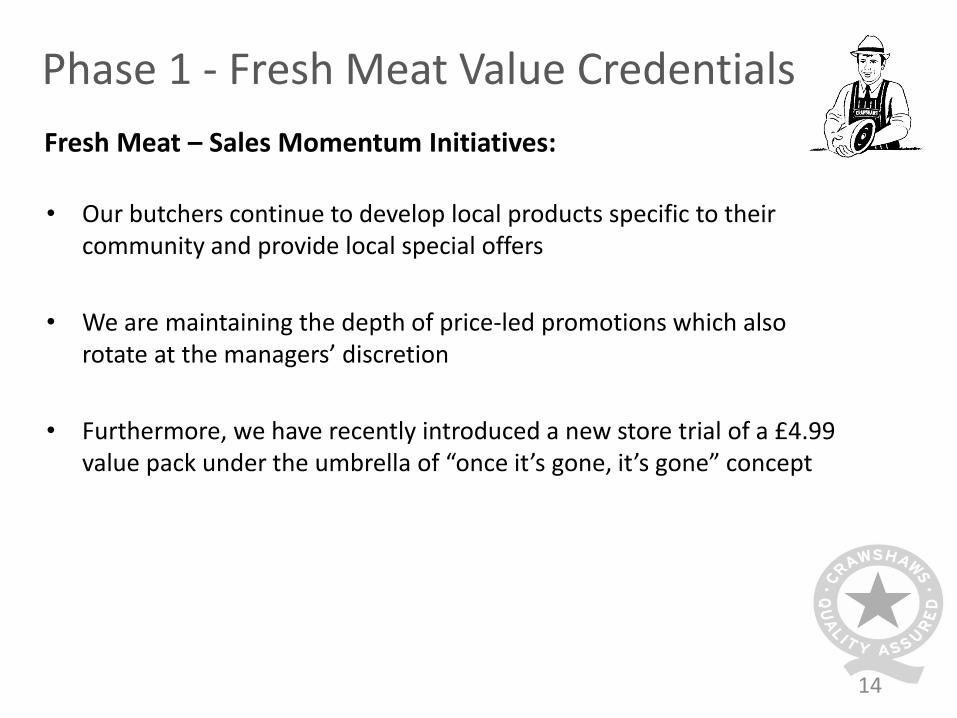
Phase 1 - Fresh Meat Value Credentials
Fresh Meat – Sales Momentum Initiatives:
• Our butchers continue to develop local products specific to their community and provide local special offers
• We are maintaining the depth of price-led promotions which also rotate at the managers’ discretion
• Furthermore, we have recently introduced a new store trial of a £4.99 value pack under the umbrella of “once it’s gone, it’s gone” concept
15
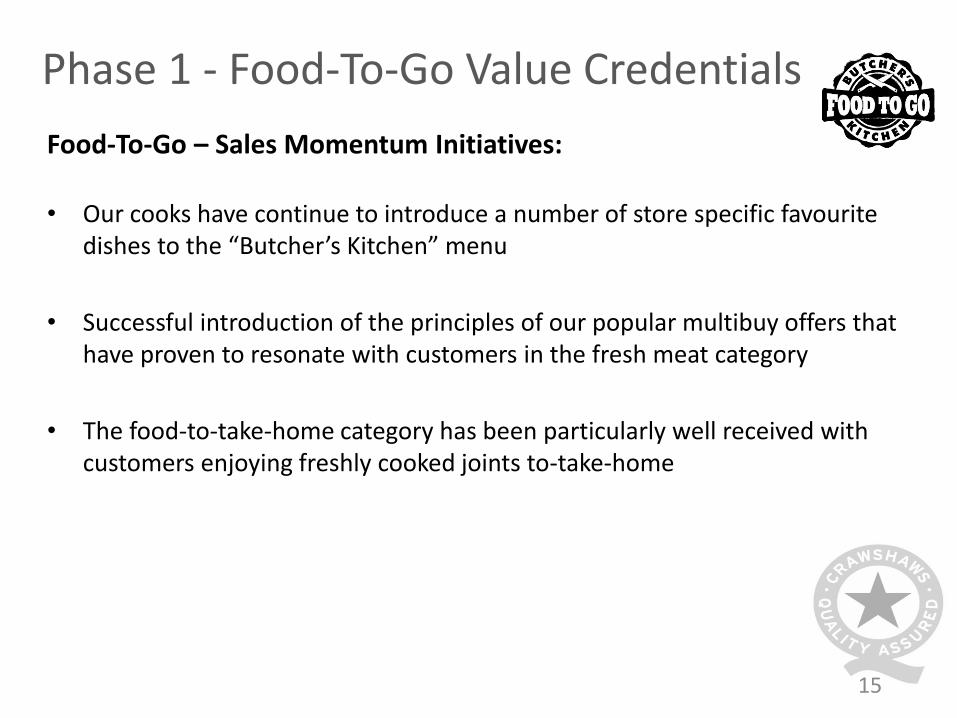
Phase 1 - Food-To-Go Value Credentials
Food-To-Go – Sales Momentum Initiatives:
• Our cooks have continue to introduce a number of store specific favourite dishes to the “Butcher’s Kitchen” menu
• Successful introduction of the principles of our popular multibuy offers that have proven to resonate with customers in the fresh meat category
• The food-to-take-home category has been particularly well received with customers enjoying freshly cooked joints to-take-home
16
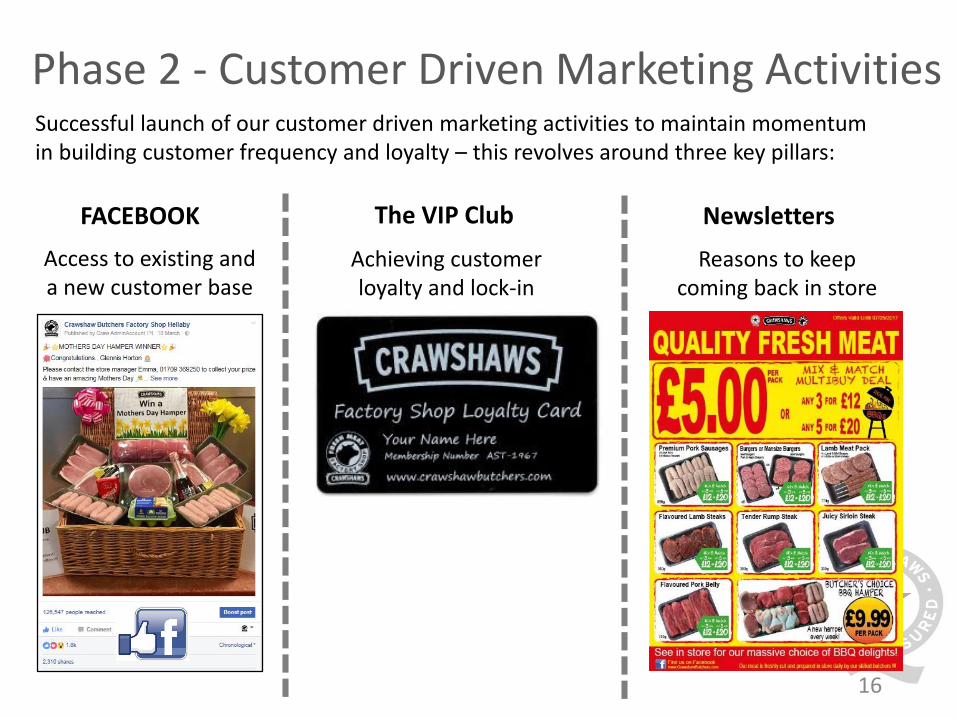
Phase 2 - Customer Driven Marketing Activities
Access to existing and a new customer base
FACEBOOK The VIP Club Newsletters
Achieving customer loyalty and lock-in
Reasons to keep coming back in store
Successful launch of our customer driven marketing activities to maintain momentum in building customer frequency and loyalty – this revolves around three key pillars:

GROWTH PLAN
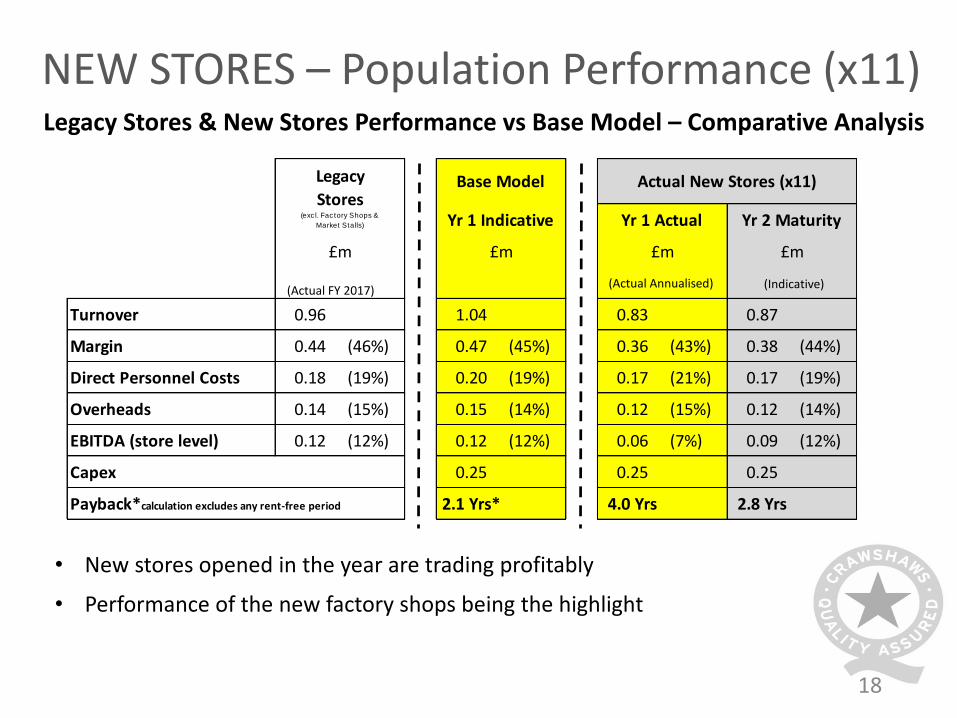
Turnover 0.96 1.04 0.83 0.87
Margin 0.44 (46%) 0.47 (45%) 0.36 (43%) 0.38 (44%)
Direct Personnel Costs 0.18 (19%) 0.20 (19%) 0.17 (21%) 0.17 (19%)
Overheads 0.14 (15%) 0.15 (14%) 0.12 (15%) 0.12 (14%)
EBITDA (store level) 0.12 (12%) 0.12 (12%) 0.06 (7%) 0.09 (12%)
Capex 0.25 0.25 0.25
Payback*calculation excludes any rent-free period 2.1 Yrs* 4.0 Yrs 2.8 Yrs
£m£m £m £m
Legacy
Stores (exc l. Fac tory Shops &
Market Stalls)
Actual New Stores (x11)
Yr 1 Actual Yr 2 Maturity
Base Model
Yr 1 Indicative
18
Legacy Stores & New Stores Performance vs Base Model – Comparative Analysis
• New stores opened in the year are trading profitably
• Performance of the new factory shops being the highlight
NEW STORES – Population Performance (x11)
(Actual FY 2017)(Actual Annualised) (Indicative)
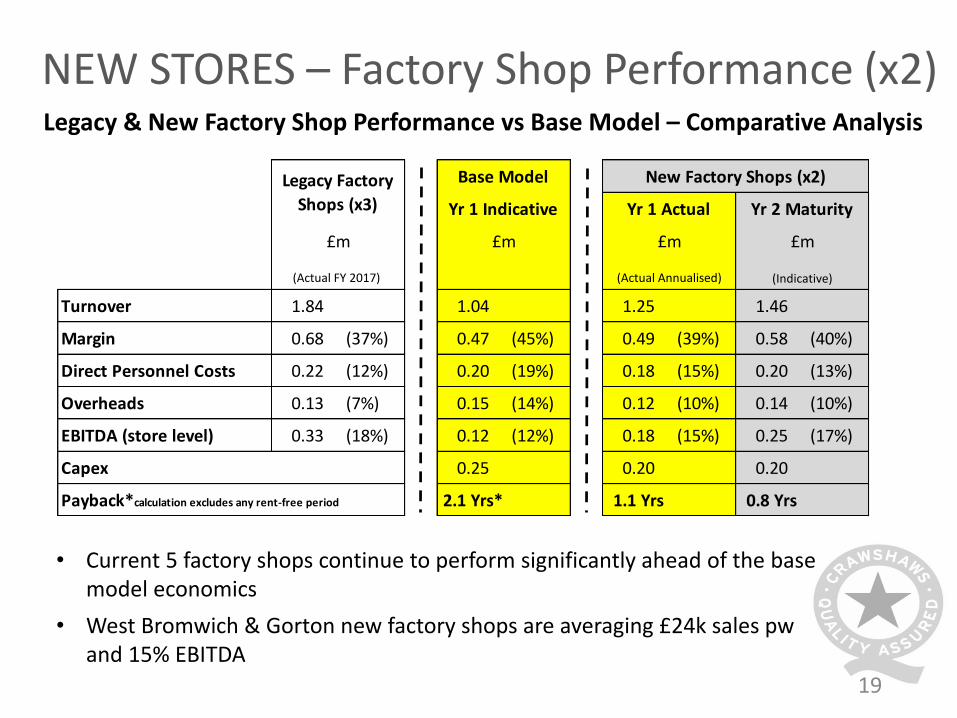
Turnover 1.84 1.04 1.25 1.46
Margin 0.68 (37%) 0.47 (45%) 0.49 (39%) 0.58 (40%)
Direct Personnel Costs 0.22 (12%) 0.20 (19%) 0.18 (15%) 0.20 (13%)
Overheads 0.13 (7%) 0.15 (14%) 0.12 (10%) 0.14 (10%)
EBITDA (store level) 0.33 (18%) 0.12 (12%) 0.18 (15%) 0.25 (17%)
Capex 0.25 0.20 0.20
Payback*calculation excludes any rent-free period 2.1 Yrs* 1.1 Yrs 0.8 Yrs
£m £m £m £m
Legacy Factory
Shops (x3)
Base Model New Factory Shops (x2)
Yr 1 Indicative Yr 1 Actual Yr 2 Maturity
19
Legacy & New Factory Shop Performance vs Base Model – Comparative Analysis
• Current 5 factory shops continue to perform significantly ahead of the base model economics
• West Bromwich & Gorton new factory shops are averaging £24k sales pw and 15% EBITDA
NEW STORES – Factory Shop Performance (x2)
(Actual FY 2017) (Actual Annualised) (Indicative)
20
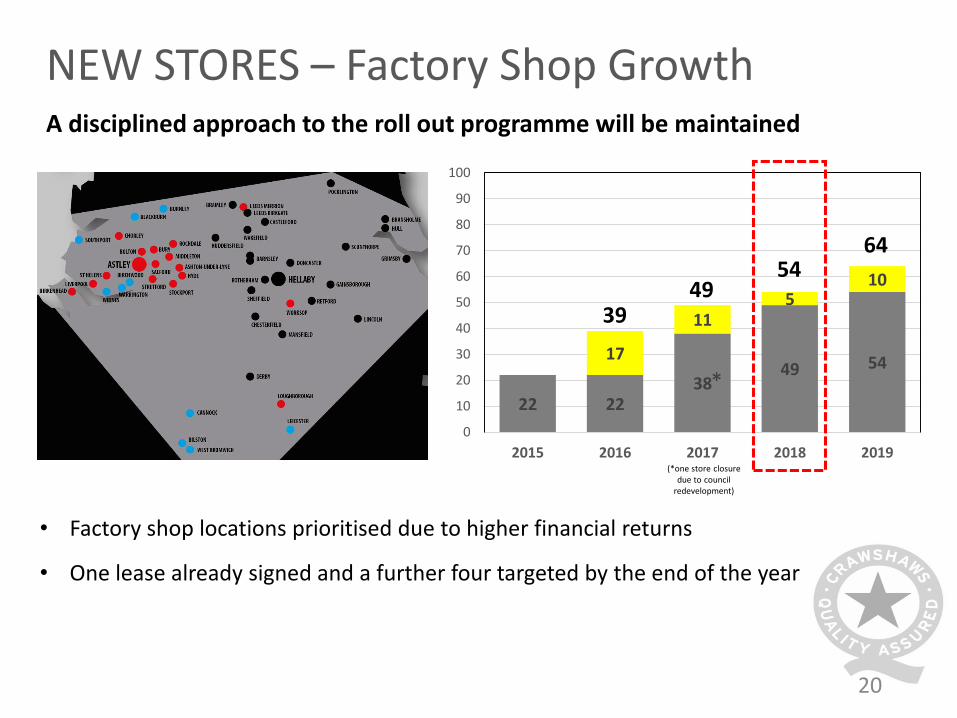
A disciplined approach to the roll out programme will be maintained
NEW STORES – Factory Shop Growth
22 2238
49 5417
115
10
0
10
20
30
40
50
60
70
80
90
100
2015 2016 2017 2018 2019
3949
5464
• Factory shop locations prioritised due to higher financial returns
• One lease already signed and a further four targeted by the end of the year
(*one store closure due to council
redevelopment)
*
TRANSFORMATIONAL STRATEGIC PARTNERSHIP
22
Highlights – Initial three-year Supply Agreement with 2 Sisters Food Group:
• Immediate access to increased volumes of continuity and surplus fresh poultry produce
• Crawshaws to use its unique vertically integrated capability to handle supply/demand imbalances across the poultry and added-value range
• Provides scalable supply to complement the current spot-market buying model
• Increased UK supply provides protection from exchange rate risk
• Crawshaws set to benefit from a greater range and product availability and 2 Sisters set to benefit from the reduction in supply/demand imbalance
• Crawshaw customers to benefit from an expanded range at competitive prices
• Provides a catalyst for accelerated growth in the factory shop concept
Transformational Strategic Partnership
23
Transformational Strategic PartnershipThe 50/50 equity split reflects the symbiotic nature of the partnership:
• The strategic construct of this transformational partnership truly aligns both parties’ interests to achieve maximum shareholder value
• The two-stage subscription including conditional warrants will allow the commercial benefit to be demonstrated as part of the process in the next 12 months
• The three year Supply Contract is long term relative to most equivalent supply arrangements
• Involves an initial investment in 29.9% stake of the business (c.34m new shares to be issued at 15.2p per share, representing a c.£5m investment)
• A warrant for an additional 20.1% stake of the business, giving a 50% holding (c.45m new shares to be issued at 15.2p per share, exercisable after 12 months if share price over 40p/share, representing a c.£7m investment)
24
Transformational Strategic PartnershipCustomer benefits:
• Crawshaw customers will have access to an expanded range of quality fresh produce and the opportunity to access entirely new product categories
• The arrangement will provide more operational flexibility to manage exciting promotional volumes across the wider store estate, delighting more customers
• The developments in range and improved availability will underpin the Crawshaws quality-value proposition
• More frequent delivery slots to the central factory and stores due to more products being sourced locally, which will improve product availability and customer satisfaction
• The agreement provides a catalyst for accelerated growth in the factory shop concept, meaning more new customers in new geographical locations are set to benefit
25
Transformational Strategic PartnershipCommercial benefits:
• A strong strategic fit, with synergies through supply chain integration and a direct route to market to maximise the food production and logistics processes
• Access to increased volumes of continuity and surplus fresh meat that provides further surety of supply (whilst complementing the spot-market buying model)
• Greater certainty on the Crawshaws retail prices due to volume balancing on UK sourced product with international spot-market purchases
• Increased protection from the existing exchange rate risk, particularly with the levels of uncertainty in the economic outlook, which strategically balances exposure
• Provides a catalyst for accelerated growth in the factory shop concept
• Greater product range development and new channel capability for Crawshaws to a wider customer base
26
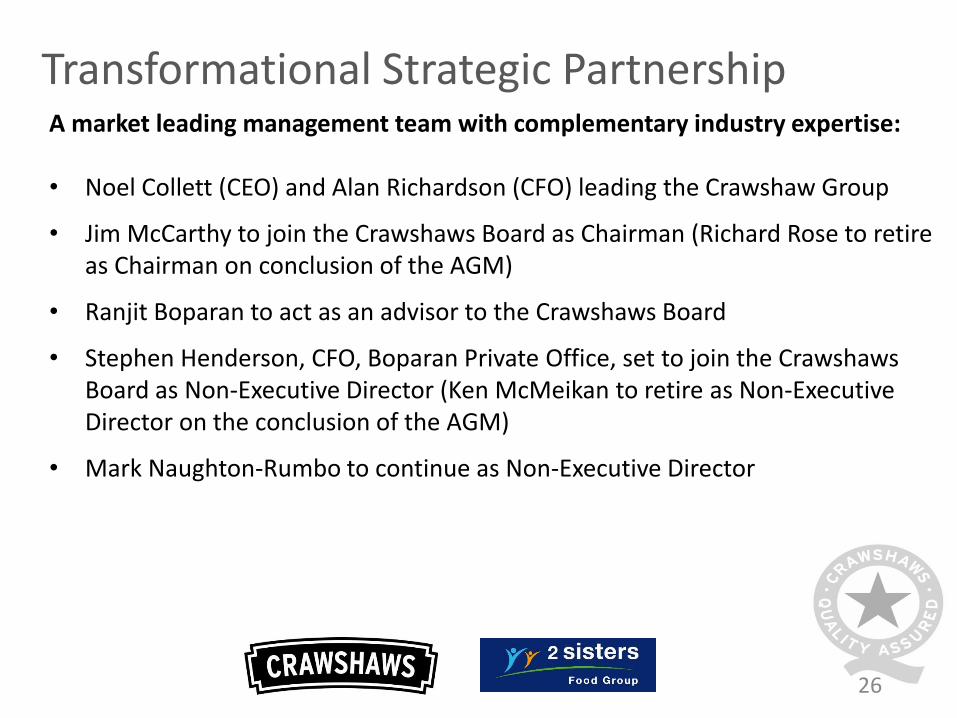
Transformational Strategic PartnershipA market leading management team with complementary industry expertise:
• Noel Collett (CEO) and Alan Richardson (CFO) leading the Crawshaw Group
• Jim McCarthy to join the Crawshaws Board as Chairman (Richard Rose to retire as Chairman on conclusion of the AGM)
• Ranjit Boparan to act as an advisor to the Crawshaws Board
• Stephen Henderson, CFO, Boparan Private Office, set to join the Crawshaws Board as Non-Executive Director (Ken McMeikan to retire as Non-Executive Director on the conclusion of the AGM)
• Mark Naughton-Rumbo to continue as Non-Executive Director
27
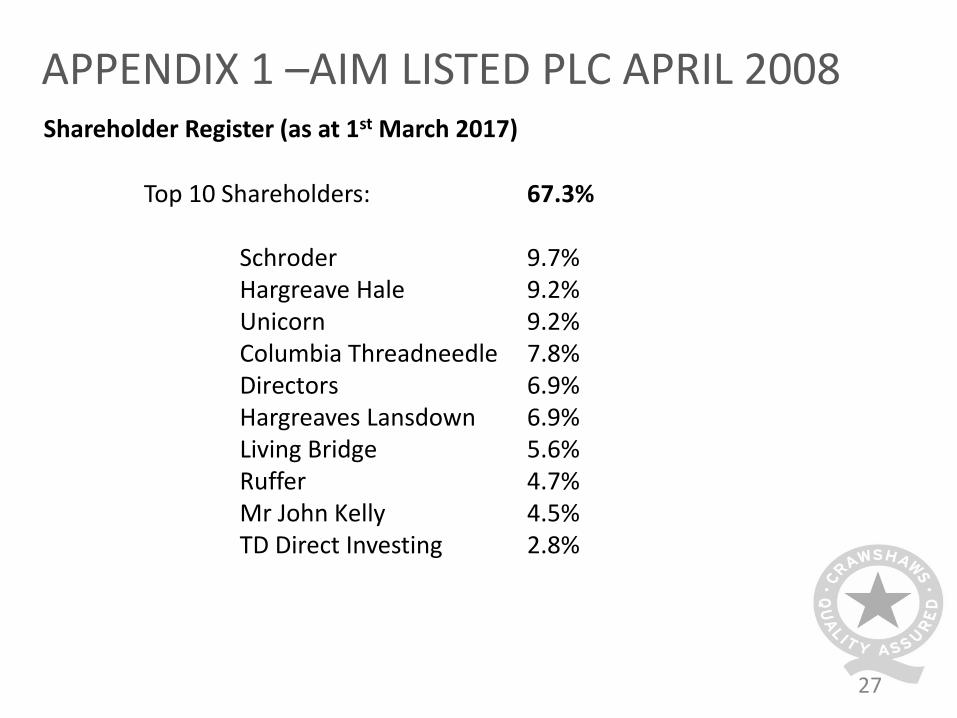
APPENDIX 1 –AIM LISTED PLC APRIL 2008Shareholder Register (as at 1st March 2017)
Top 10 Shareholders: 67.3%
Schroder 9.7%Hargreave Hale 9.2%Unicorn 9.2%Columbia Threadneedle 7.8%Directors 6.9%Hargreaves Lansdown 6.9%Living Bridge 5.6%Ruffer 4.7%Mr John Kelly 4.5%TD Direct Investing 2.8%
28
DISCLAIMERNo reliance may be placed for any purpose whatsoever on the information or opinions contained in this Presentation or its completeness. Neither Crawshaws nor Peel Hunt LLP nor any of their respective directors, employees, agents or advisers give, have given or have authority to give any representation or warranty express or implied, as to the accuracy, completeness or fairness of the information or opinions contained in this Presentation, or any revision thereof, or as to any other written or oral information relating to Crawshaws to be made available to any interested party and/or its advisors (all such information and opinions the “Information”) and save in the case of fraud, no such person accepts any responsibility or liability (and all such liability is hereby excluded to the extent permitted by law) for any loss, cost, damage of expense suffered as a result of reliance on any such Information.
This Presentation may not be reproduced or further distributed to any other person or published, in whole or in part, for any purpose. Neither this Presentation (or any copy of it) nor the information contained in this Presentation may be sent or taken into the United States, Canada, Australia or Japan, nor may it be distributed to any US person (within the meaning of regulation S under the US Securities Act of 1933, as amended) or to any national, resident or citizen of Canada, Australia or Japan or to any person in any other country outside the United Kingdom where such distribution may lead to a breach of any legal or regulatory requirement.
Furthermore, this Presentation is being made only in the United Kingdom and is directed only at (i) persons who are investment professionals within the meaning of Article 19(5) of the Financial Services and Markets Act 2000 (Financial Promotion) Order 2005 (SI 2005/1529), as amended, (the “FPO”); (ii) persons falling within paragraph 49 of the FPO (high net worth companies, unincorporated associations etc.); and (iii) persons to whom it is otherwise lawful to communicate this Presentation (“Permitted Recipients”). Any persons who are not Permitted Recipients should not stay for the remainder of this presentation and, in any event, must not act or rely upon the information contained in this Presentation. By staying for the remainder of this presentation and/or receiving this Presentation, each participant is deemed to confirm that they are a Permitted Recipient.