decision usefulness of cash flow information format – an ... · method of presentation of cash...
TRANSCRIPT

23Decision Usefulness of Cash Flow Information Format
– An Experimental Study–
Decision Usefulness of Cash Flow Information Format
– An Experimental Study–
Koji KOJIMA*
Abstract
The main purpose of this study is to examine whether the method ofpresenting financial reports influences the decisions made by their users. Twooperating cash flow presentations, namely, direct and indirect, are employed toinvestigate whether the presentation format of operating cash flow influenceslending decisions using financial information about a hypothetical retailcompany, as a pilot study for an international project. Thirty-eight accountingstudents (graduates and undergraduates) participated. Following themethodology of Klammer and Reed (1990) and Conover et al. (2011), thefindings show that more accurate decisions can be made by the direct methodof presentation than by the indirect method of presentation.
Keywords: Experiment, Statement of Cash Flows, Operating Cash Flow,Format,
1. IntroductionThe main purpose of the study is to examine whether the method of presenting financial
reports influences the decisions made by their users. Two operating cash flow presentations,namely, direct and indirect, are employed to investigate whether the presentation of operatingcash flow influences hypothetical lending decisions by users. I believe that this paperprovides evidence for the IASB (International Accounting Standards Board)’s decisionprocess on the Preliminary Views document on Financial Statement Presentation, which is ajoint project with the FASB (Financial Accounting Standards Board).
Previous research has shown that a relationship exists between the presentation offinancial information and users’ decisions. Libby (1981) points out that changing thepresentation and amount of information can improve users’ decision making. A studyconducted by Stock and Watson (1984) concludes that users’ judgment can be influenced bythe accounting report format. Maines and McDaniel (2000) conclude that alternativepresentation formats affect the degree of investors’ understanding of accounting information.
* Koji Kojima is an Associate Professor at the School of International Studies, Kwansei GakuinUniversity, Hyogo, Japan. Email: [email protected]

24 Koji KOJIMA
Numerous research studies have focused on differences between the direct and indirectmethod formats, especially the use of the financial statements’ individual components versusaggregate information (Krishnan and Largay 2000, CFA Institute 2005, 2007). Although boththe IASB and the FASB permit the indirect method, they consider the direct method ofpresenting operating cash flow the preferred method. The IASB’s conceptual framework(IASB 2010) lists understandability as an identified factor that enhances the qualitativecharacteristics of financial information. Understandability is defined as “the quality ofinformation that enables users to comprehend its meaning” and “understandability isenhanced when information is classified, characterized and presented clearly (IASB 2010,pp.30-31)”. Previous studies on the statement of cash flows show that there are materialdifferences between estimated and actual operating cash flow calculated using the directmethod of presentation of cash flow1. Also, it has been pointed out that even when operatingcash flow in the direct method of presentation is estimated from indirect components, it is nota true representation of the actual direct method of presentation of operating cash flow. TheCFA (Chartered Financial Analyst) Institute, formerly known as the AIMR (Association forthe Investment Management and Research) also has shown strong support for the directmethod of presenting operating cash flow. Although the FASB and CFA Institute support thedirect method, however, a survey conducted by the AICPA (American Institute of CertifiedPublic Accountants) in 2000 revealed that only seven companies out of the 600 companiessampled use the direct method.
Klammer and Reed (1990) show that bank analysts’ lending decisions are influenced bythe presentation of statement of cash flows. However, a study by Kwok (2002) shows thatusers’ lending decisions are not affected by the format of operating cash flow and concludesthat they rely on accrual based accounting figures rather than cash flow figures when makinglending decisions.
The author is currently working on an international project to test the decision usefulnessof the direct and indirect methods of presenting cash flows from operating activities on thestatement of cash flows in a cross-cultural setting (Conover et al. 2011). The main purpose ofthe project is to extend Klammer and Reed’s (1990) seminal work entitled “Operating CashFlow Formats: Does Format Influence Decisions?” in an international setting. The projectwill conduct a cross-cultural experiment on bankers to examine whether two differentoperating cash flow formats, namely, direct and indirect, influence their hypothetical loandecisions.
In this study, a pilot study for the international project, I conducted experimental testsusing financial information about a hypothetical retail company. Thirty-eight students
1 See Krishnan and Largay (2000) and Orpurt and Zang (2009).

25Decision Usefulness of Cash Flow Information Format
– An Experimental Study–
studying accounting at graduate school and vocational school participated in the experiment.Following the methodology of Klammer and Reed (1990) and Conover et al. (2011), I findthat direct method presentation of operating cash flow significantly reduces computationalerrors. The results support the views by the IASB and FASB that the direct method ofpresentation of operating cash flow should be a requirement for all firms.
The paper is organized as flows. Section 2 offers a brief introduction of previous cash flowliterature. Section 3 describes the experimental design employed by the study withdescriptions of participants. Section 4 presents the experimental results.
2. Literature ReviewPrevious studies of the statement of cash flows and its decision usefulness have focused on
the differences between the direct and indirect method of presentation. Krishnan and Largay(2000) use data of a 405 U.S. firm/year sample that adopts the direct method for the period1988-1993. They find that there exist considerable forecasting errors in articulating cash flowfrom operating activities using income statement and balance sheet information. Theyconclude that using the direct method is a better predictor of future operating cash flow thanthe indirect method, earnings or accrual information. A more recent study by Orpurt and Zang(2009) confirms these findings. Their sample uses companies using the direct method in theperiod 1989-2002 (604 firm/year sample). Clinch, Sidhu and Sin (2002), using a sample ofAustralian companies (648 firm/year sample) in the period 1992-1997, find that thecomponents of operating cash flow have greater explanatory power over aggregated operatingcash flow when predicting future operating cash flow. Barth, Cram and Nelson (2001) findthat cash flow components increase predictability of future cash flows when they disaggregateearnings into accrual components. They suggest disaggregating cash flow from operatingactivities into the direct method components and other components to increase the predictiveability of future cash flows. Cheng and Hollie (2007) extend Barth et al.’s (2001) work andshow that disaggregating cash flow into core and non-core cash flows—which is readilyavailable from the direct method of presentation of cash flows—improves predictability offuture cash flows.
As previously noted, the CFA Institute has contended for many years that experiencedanalysts have difficulty in constructing direct method cash flow information from financialstatement data for companies using the indirect method2. Several studies have confirmed this(Krishnan and Largay 2000, Orpurt and Zang 2009, Hriber and Collins 2002 and Clinch et al.2002). These studies show that even when the direct method of presenting financialinformation is constructed from other information sources, it is not a true representation of the
2 See CFA Institute (2005, 2007) for detailed discussion.

26 Koji KOJIMA
actual direct method of presenting operating cash flow. These studies all find that whencalculating operating cash flow by the direct method of presentation using figures estimatedfrom the indirect method of presentation of operating cash flow and other financial statementinformation, there are material differences between the estimated and actual direct methodoperating cash flow3. These studies conclude that the statement of cash flows should beprepared using the direct method.
Another area of concern that extends from the wide adoption of the indirect method inpractice4 is the use of aggregate cash flow information. The CFA Institute (2007) states that“cash collected from customers is perhaps the single most important direct cash flow figureand is a primary indicator of the company’s cash generating ability”5. Krishnan and Largay(2000) in fact find that gross cash receipts and gross cash payments are more relevant than netamounts.
Survey studies have been used to assess the usefulness of cash flow information. Jones andWidjaja (1998) conducted a survey on bank loan officers and financial analysts in Australia toexamine relevance of financial information on their economic decision making process. Theyfind that both groups of participants rate the statement of cash flows and other financialstatements as having a high level of relevance in making economic decisions. They point outthat the statement of cash flows supplements or complements financial information. They alsofound that the majority (more than 70 percent) of the participants support the direct methodfor decision making while less than five percent prefer the indirect method6.
3. Research DesignI follow a similar research design to that of Klammer and Reed (1990). They asked bank
loan officers and analysts with experience in making lending decisions to participate in theirstudy to compare the decision usefulness of the statement of cash flows. Klammer and Reed(1990) suggest future studies employ less experienced users of financial statements to obtainmore generalized results7.
In this study, the participants, accounting students, are given a research instrument thattests decision making based on two different presentations of the statement of cash flows (seeAppendices 1 and 2). Half of the participants received a research instrument using the directmethod of presentation and the other half received a research instrument using the indirect
3 See Krishnan and Largay (2000) and Orpurt and Zang (2009).4 See AICPA (2000) for U.S. firms. Also, the author finds that among 2,239 firms listed at the Tokyo
Stock Exchange, only four firms present cash flows from operations using the direct method.5 CFA Institute (2007), p.22.6 See discussions in Jones and Widjaja (1998), p.213-214.7 Klammer and Reed (1990), p.233.

27Decision Usefulness of Cash Flow Information Format
– An Experimental Study–
method of presentation. The participants were randomly assigned to one of the two researchinstruments. A total of 38 subjects (indirect = 20, and direct = 18) participated in theexperiment. The participants were either students studying accounting at the graduate level(14) or vocational school students studying for the Japanese Certified Public Accountants’Examination (24).
The participants were provided a randomly selected set of comparative financialstatements for the experiment. All packets contained identical cover letters, three-year balancesheets, three-year income statements and set of questions. The presentation of the operatingsection of the statement of cash flows was different between the two groups, but the investingand financing sections of statement of cash flows were identical.
The cover letter informs the participants that a hypothetical firm, Crescent Company, hadapplied to their bank for a four billion Japanese yen (about 51.5 million US dollars) loan. Inthe hypothetical setting, the loan is to be used for Crescent Company’s expansion plan. Basedon the provided materials, the participants are asked to make a decision about the company’sability to meet future debt services and to decide the size of the loan, if any, that should beprovided to Crescent Company.
The participants are asked to compute several important financial ratios related to the loanbefore they come up with the size of the loan, if any. Namely, they are asked to respond tofive questions related to accounting ratio questions (Inventory turnover ratio, Labor intensityratio), cash flow questions (Cash collected from customers, Unanticipated cash collection,Dollar contribution margin, Total fixed payment) and future projection questions (Projectedbreakeven sales, Projected fixed charges). Participants are asked to answer these questions sothat they could measure Crescent Company’s future operating performance as well as theirfuture debt repayment ability before making the lending decisions. Participants were alsoasked to record their starting and ending times.
Answers to the above questions are grouped into four categories as follows. The firstcategory serves as a check of the comparability of the two groups8: Question IV asksparticipants to find “Total Debt Repaid” from given data. Since exactly the same informationis available in the statement of cash flows under financing activities for both groups, allparticipants would be expected to experience identical difficulty in finding this piece ofinformation.
The second category reveals whether format differences matter in decision making:Participants are asked to answer four questions relating to operating cash flow, specifically (1)
8 In the original Klammer and Reed (1990) paper, they use three variables to check the comparabilitybetween the two groups. In this study, to reduce participants’ expected time to complete the experiment,I decreased the number of questions from three to one.
28 Koji KOJIMA
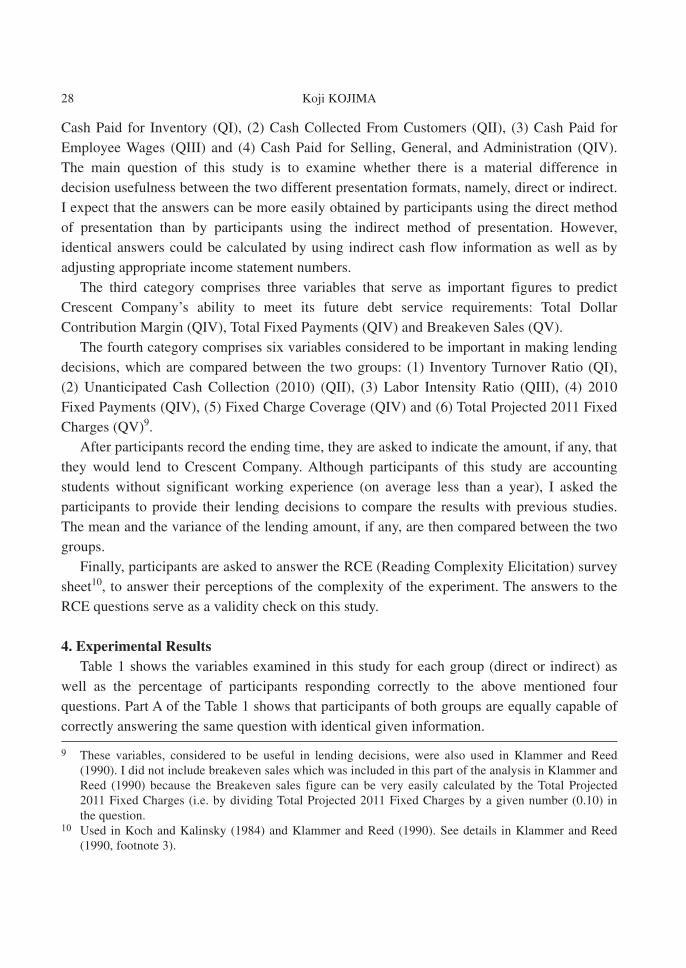
Cash Paid for Inventory (QI), (2) Cash Collected From Customers (QII), (3) Cash Paid forEmployee Wages (QIII) and (4) Cash Paid for Selling, General, and Administration (QIV).The main question of this study is to examine whether there is a material difference indecision usefulness between the two different presentation formats, namely, direct or indirect.I expect that the answers can be more easily obtained by participants using the direct methodof presentation than by participants using the indirect method of presentation. However,identical answers could be calculated by using indirect cash flow information as well as byadjusting appropriate income statement numbers.
The third category comprises three variables that serve as important figures to predictCrescent Company’s ability to meet its future debt service requirements: Total DollarContribution Margin (QIV), Total Fixed Payments (QIV) and Breakeven Sales (QV).
The fourth category comprises six variables considered to be important in making lendingdecisions, which are compared between the two groups: (1) Inventory Turnover Ratio (QI),(2) Unanticipated Cash Collection (2010) (QII), (3) Labor Intensity Ratio (QIII), (4) 2010Fixed Payments (QIV), (5) Fixed Charge Coverage (QIV) and (6) Total Projected 2011 FixedCharges (QV)9.
After participants record the ending time, they are asked to indicate the amount, if any, thatthey would lend to Crescent Company. Although participants of this study are accountingstudents without significant working experience (on average less than a year), I asked theparticipants to provide their lending decisions to compare the results with previous studies.The mean and the variance of the lending amount, if any, are then compared between the twogroups.
Finally, participants are asked to answer the RCE (Reading Complexity Elicitation) surveysheet10, to answer their perceptions of the complexity of the experiment. The answers to theRCE questions serve as a validity check on this study.
4. Experimental ResultsTable 1 shows the variables examined in this study for each group (direct or indirect) as
well as the percentage of participants responding correctly to the above mentioned fourquestions. Part A of the Table 1 shows that participants of both groups are equally capable ofcorrectly answering the same question with identical given information.
9 These variables, considered to be useful in lending decisions, were also used in Klammer and Reed(1990). I did not include breakeven sales which was included in this part of the analysis in Klammer andReed (1990) because the Breakeven sales figure can be very easily calculated by the Total Projected2011 Fixed Charges (i.e. by dividing Total Projected 2011 Fixed Charges by a given number (0.10) inthe question.
10 Used in Koch and Kalinsky (1984) and Klammer and Reed (1990). See details in Klammer and Reed(1990, footnote 3).

29Decision Usefulness of Cash Flow Information Format
– An Experimental Study–
Indirect Directmethod method Statistical(N=20) (N=18) significance
Cash Flow Questions
Part A. Financing Activity Cash Flow Question: t-stat Prob.
Percentage of participants responding correctly:
Total Debt Repaid 70.00 88.89
Average correct answers (1 possible) 0.70 0.89 1.43 0.162
Part B. Operating Activity Cash Flow Questions:
Percentage of participants responding correctly:
Cash Paid for Inventory 45.00 88.89
Cash Collected from customers 50.00 83.33
Cash Paid for Employee Wages 55.00 83.33
Cash Paid for Selling, General, and Administrative Expenses 55.00 83.33
Average correct answers (4 possible) 2.05 3.39 2.97 0.005 *
Part C. Future Debt Service Questions:
Percentage of participants responding correctly:
Total Dollar Contribution Margin (page 7) 30.00 72.22
Total Fixed Payments (page 7) 45.00 77.78
Breakeven Sales (page 8) 45.00 72.22
Average correct answers (3 possible) 1.20 2.22 2.90 0.006 *
Loan Analysis Questions
Part D. Percentage of participants responding correctly:
Inventory Turnover Ratio (page 5) 40.00 88.89
Unanticipated Cash Collection (2010) (page 6) 45.00 66.67
Labor Intensity Ratio (page 6) 50.00 72.22
2010 Fixed Payments (page 8) 45.00 77.78
Fixed Charge Coverage (page 7) 40.00 77.78
Total Projected 2011 Fixed Charges (page 8) 45.00 72.22
Average correct answers (6 possible) 2.65 4.56 2.96 0.005 *
Additional Analysis Questions
Part E. Total Time (in minutes) 25.61 19.72 -2.12 0.041 **
Average Approved Loan Amount (in billions of Yen) ¥2.6818 ¥2.5022 -0.33 0.747
Standard Deviation of the Loan Amount (in billions of Yen) ¥1.2952 ¥1.3467 1.20 0.701
* Significant at .01 level ** Significant at .05 level
Table 1. Research Questions and Participant Responses

30 Koji KOJIMA
In contrast, Part B of the Table 1 shows that on average, the two groups show differentcapabilities when asked to answer operating cash flow questions. The participants in thedirect method presentation group answered all four questions significantly more accuratelycompared with the indirect method presentation group at the 0.01 level of significance (two-tailed t test). The results suggest that format or presentation method does matter in users’information processing. These findings are consistent with those of Klammer and Reed(1990).
The results of Part C of Table 1 also suggest participants had difficulty in answering thequestions related to the likelihood of the firm’s future debt service abilities. Similarly, Part Dof Table 1 shows that participants given the direct method of presentation could answerimportant loan analysis questions significantly (at the 0.01 level, two-tailed t test) moreaccurately than participants given the indirect method of presentation.
Part E of Table 1 shows the results of additional analyses. I compared the average totaltime between the two groups to answer Questions I through V. The results show that, onaverage, participants given the indirect method of presentation took statistically significantly(significance at the 0.05 level, two-tailed t test) more time to finish their task than the directmethod group.
Although the above results support the view that the direct method of presentation is moreuseful, on average, to find information from a given data set and to more accurately calculatefinancial ratios typically used in loan analyses, I did not find statistically different results inthe amount of loan approved between the two groups. These findings are partly supported byinformal interviews with participants after the experiment. Some of the participants arguedthat they were familiar with the financial ratio questions given in the experiment, however, itwas extremely difficult for them to connect the financial ratios they had calculated and theamount of loan that they should approve, if any.
Overall, the results shown in Table 1 suggest that selection of presentation format mayimprove users’ decision making and may reduce calculation errors.
Part A to Part E of Table 2 summarize the results of the 2 x 2 factorial design ANOVAs.Since two different groups of students participated in the experiment (i.e. 14 accountingschool students and 24 vocational school students), I examined the degree to which theobserved results were caused by differences among the participants.
Regarding the loan variability (in billions of yen) and financing activity cash flowquestions, there are no statistically significant differences between the two different groups ofstudents according to the ANOVA analyses (Parts A and B). However, I find statisticallysignificant differences in the accuracy of answering these questions between the two groupsof students for the results of the operating cash flow questions, future debt service questionsand loan analysis questions, in addition to the main effects that were found in Table 1 (Parts

31Decision Usefulness of Cash Flow Information Format
– An Experimental Study–
Indirect Directmethod method Statistical(N=20) (N=18) significance
Loan Approval
Part A. Loan Variability (in billions of Yen)
Accounting School Students ¥2.60 ¥3.00 No main effect
Vocational School Students ¥3.10 ¥2.25
Response Accuracy
Part B. Financing Activity Cash Flow Question: (1 possible)
Accounting School Students 0.71 0.86 No main effect
Vocational School Students 0.69 0.91
Part C. Operating Activity Cash Flow Questions: (4 possible)
Accounting School Students 1.71 3.00 Main effect *
Vocational School Students 2.23 3.64 Interaction **
Part D. Future Debt Service Questions: (3 possible)
Accounting School Students 0.71 1.86 Main effect *
Vocational School Students 1.46 2.45 Interaction **
Part E. Loan Analysis Questions: (5 possible)
Accounting School Students 1.86 3.86 Main effect *
Vocational School Students 3.08 5.00 Interaction **
Part F. Validity Questions t-stat Prob.
1 The operating cash flows section was clearly written. 3.25 3.00 -0.50 0.617
2 The language used in the statement required too muchtechnical expertise in accounting. 2.70 4.00 2.35 0.024 **
3 The statement failed to include all the information neededabout operating cash flows. 3.78 4.06 0.56 0.581
4 The cash provided by operations was easily understood. 3.90 3.82 0.13 0.896
5 The statement in conjunction with other financial statementshelped me to assess future operating cash flows. 3.35 2.83 -1.12 0.272
6 The financing and investing sections were clearly written. 2.70 2.56 0.35 0.725
7 The statement presentation was longer than necessary. 3.90 3.89 0.02 0.981
8 The statement format made it easy to identify majoroperating cash inflows and outflows. 4.05 2.22 3.52 0.001 *
(1 Strongly Agree to 7 Strongly Disagree)
* Significant at .01 level ** Significant at .05 level
Table 2. Results of ANOVAs: Participant Response Accuracy

32 Koji KOJIMA
B, C, and D). Specifically, the vocational school students’ accuracy in answering thesequestions, on average, was significantly higher than that of the accounting school students atthe 0.05% level of significance for both the indirect and direct groups.
Finally, Part B of Table 2 summarizes the average responses to the eight RCE questions.These questions are expected to provide further insight on participants’ perceptions aboutquestions in the experiment. Among the eight RCE questions, I find that there are statisticallysignificant results for question two (“The language used in the statement required too muchtechnical expertise in accounting.”) and question eight (“The statement format made it easy toidentify major operating cash inflows and outflows.”). Although the direct methodpresentation group, on average, more accurately responded to the operating cash flowquestions, participants in that group thought that the language used in the direct methodpresentation required a higher degree of expertise in accounting (significant at the 0.05%level). In addition, the direct method presentation group, on average, thought it was easier toidentify major operating cash flow.
5. ConclusionsThis paper presents the following results. Participants provided the indirect format of
presentation showed significantly less accurate results than participants provided the directformat of presentation when both groups were asked to calculate the financial ratios related toa firm’s ability to meet future debt service requirements. The results suggest that presentationformat influences users’ decision making, and the direct method of presentation, partlybecause it does not require additional calculation needed as under the indirect method ofpresentation to calculate operating cash flow information, is the preferred method to usebecause of such advantages. The results of the paper extend Klammer and Reed (1990) in thatin comparison with experienced bank loan managers and analysts, even less experienced usersof financial statements, namely, accounting students with little work experience, find that thedirect method of presentation of operating cash flow is more understandable (i.e. would causefewer computational errors). The results of the paper suggest that, as IASB (2008)recommends, the direct method of presentation of operating cash flow should be arequirement for all firms.

33Decision Usefulness of Cash Flow Information Format
– An Experimental Study–
REFERENCES
American Institute of Certified Public Accountants (AICPA). 2000. Accounting Trends and Techniques.New York. NY: AICPA.
Barth M.E., Cram, D.P., Nelson, K.K. 2001. Accrual and the Prediction of Future Cash Flows. TheAccounting Review 76(1): 61-74.
Chartered Financial Analysts (CFA) Institute. 2005. A Comprehensive Business Reporting Model. FinancialReporting for Investors. Charlottesville, VA: CFA Institute.
CFA Institute. 2007. A Comprehensive Business Reporting Model. Financial Reporting for Investors.Charlottesville, VA: CFA Institute.
Cheng, C.S.A., and D. Hollie. 2008. Do Core and Non-Core Cash Flows from Operations PersistDifferently in Predicting Future Cash Flows? Review of Quantitative Finance and Accounting: 31: 29-53.
Clinch, G., B. Dishu, and S. Sin. 2002. The Usefulness of Direct and Indirect Cash Flow Disclosures.Review of Accounting Studies 7 (4): 383-404.
Conover, T., Dahawy, K., Dick, W., Iatrides, G., Klammer, T., Kojima, K., Lai, S., Paananen, M., Poli, P.,and Rahman, A. 2011. Research Proposal: Decision Usefulness of Operating Cash Flows: DirectMethod or Indirect Method.
International Accounting Standards Board (IASB). 1992. Cash Flow Statements. International AccountingStandard 7. London, U.K.: IASB.
International Accounting Standards Board (IASB). 2008. Discussion Paper: Preliminary Views onFinancial Statement Presentation. London, U.K.: IASB.
International Accounting Standards Board (IASB). 2010. Exposure Draft: Conceptual Framework forFinancial Reporting. London, U.K.: IASB. February.
Jones, S. and L. Widjaja. 1998. The Decision Relevance of Cash-Flow Information: A Note. Abacus 34 (2):204-219.
Klammer, T.P. and A.A. Reed. 1990. Operating Cash Flow Formats: Does Format Influence Decisions?Journal of Accounting and Public Policy 9: 217-235.
Koch, B.S., and Karlinsky, S.S. 1984. The Effect of Federal Income Tax Law Reading Complexity onStudents’ Task Performance. Issues in Accounting Education 1: 98-110.
Krishnan, G.V. and J.A. Largay III. 2000. The Predictive Ability of Direct Method Cash Flow Information.Journal of Business Finance & Accounting 27 (1-2): 215-245.
Kwok, H.2002 The Effect of Cash Flow Statement Format on Lenders’ Decisions. The InternationalJournal of Accounting 37(3): 347-362.
Libby, R. 1981. Accounting and Human Information Processing Theory: Theory and Applications.Englewood Cliffs, NJ: Prentice Hall.
Maines, L.A., and L.S. McDaniel. 2000. Effects of Comprehensive-Income Characteristics onNonprofessional Investors’ Judgments: The Role of Financial-Statement Presentation Format. TheAccounting Review 75(2): 179-207.
Mello-e-Souza, C. 2009. Taking the Mystery out of the Cash Flow Statement: A Simplified Implimentationof the Indirect Method. Working Paper, Seattle University.
Nurnberg, H. 2006. Perspectives on the Cash Flow Statement Under FASB Statement No.95. October.Columbia Business School CEASA Occasional Paper Series.
Orpurt, S.F. and Y. Zang. 2009. Do Direct Cash Flow Disclosures Help Predict Future Operating CashFlows and Earnings? The Accounting Review 84(3): 893-935.
Sharma, D.S. and E.R. Iselin. 2003a. The Relative Relevance of Cash Flow and Accrual Information forSolvency Assessments: A multi-Method Approach. Journal of Business Finance & Accounting 30(7-8):1115-1140.
Sharma, D.S. and E.R. Iselin. 2003b. The Decision Usefulness of Reported Cash Flow and Accrual

34 Koji KOJIMA
Information in a Behavioural Field Experiment. Accounting and Business Research 33(2): 123-135.Stock, D. and C.J. Watson. 1984. Human Judgment Accuracy, Multidimensional Graphics, and Humans
versus Models. Journal of Accounting Research 22(1): 192-206.

35Decision Usefulness of Cash Flow Information Format
– An Experimental Study–
Appendix 1 Survey Sheet for Indirect Method.
Dear Participant,
Cash flow analysis is an important part of the lending decision. Proposed changes in financialstatement presentation requirements are expected to put more emphasis on cash flowinformation. Financial institutions are likely to modify the ratios used to assess borrower’spotential future cash flows as these changes are implemented.
For this study we are asking you to review the financial statements (balance sheet, incomestatement, and statement of cash flows) for Crescent Company, a fictional retail entity. Thisentity has been repositioning itself in the market place and narrowing its geographic focus.
You will use the given financial statements to compute a series of financial ratios. Using theratio information and the financial statement data you are then asked what, if any, portion of arequested loan you would make to Crescent Company. Please assume that the ratio definitionsused have been agreed upon as being appropriate for this type of analysis.
For simplicity, none of the supplemental financial data that would normally be available foryour use has been provided. However, additional detail has been included on the incomestatement and your analysis is not complicated by mergers or non-operating transactions inreceivables, payables, inventory and so forth.
Before you begin to compute the requested financial ratios take a few moments to review thefinancial statements. When you are ready to begin working on the questions, separate thefinancial statements from the rest of the instrument and follow the instructions for eachsegment.
Thank you for agreeing to participate in this study.
Koji KojimaSchool of International StudiesKwansei Gakuin University

36 Koji KOJIMA
Crescent CompanyStatement of Financial Position
December 31, 2010(Yen in Millions)
2008 2009 2010
AssetsCurrent assets
Cash ¥430 ¥750 ¥2,220Trade receivables, net 1,600 1,840 1,850Inventories 1,250 1,130 1,200
Total current assets ¥3,280 ¥3,720 ¥5,270Investments in subsidiaries (equity method) 760 890 860Property and equipment (net) 6,810 6,960 7,040
Total Assets ¥10,850 ¥11,570 ¥13,170
Liabilities and Owners EquityCurrent liabilities
Accounts payable – trade ¥1,400 ¥1,490 ¥1,460Short-term debt 240 130 180Wages payable 170 290 450Accrued interest payable 200 240 310Accrued selling, general and administrative expenses 280 300 380Current portion – store shutdown costs 120 120 40
Total current liabilities ¥2,410 ¥2,570 ¥2,820Long-term debt 2,540 2,760 2,730Deferred income taxes 160 210 330Long-term portion-store shutdown costs 520 420 270
Total liabilities ¥5,630 ¥5,960 ¥6,150
Owners EquityCommon stock, no par 2,130 2,160 2,670Retained earning 3,090 3,450 4,350
Total owners equity ¥5,220 ¥5,610 ¥7,020
Total liabilities and owners equity ¥10,850 ¥11,570 ¥13,170

37Decision Usefulness of Cash Flow Information Format
– An Experimental Study–
Crescent CompanyIncome Statement
For the Year Ending December 31, 2010(Yen in Millions)
2008 2009 2010
Sales revenue, net ¥12,930 ¥12,490 ¥13,940
Operating expenses
Cost of goods sold 10,710 10,070 11,140
Wage expense 770 760 830
Depreciation expense 530 520 570
Selling, general and administrative expense 660 660 690
Total operating expense 12,670 12,010 13,230
Income from primary operations ¥260 ¥480 ¥710
Other
Income from equity investments in subsidiaries 130 160 370
Gain on sale of property and equipment 40 160 810
Gain – repurchase of debt 70 60 40
Interest expense (180) (210) (230)
Loss on partial sale of subsidiaries (40)
Estimated cost of store closing (810) -- --
Other income (¥750) ¥170 ¥950
Income before tax (¥490) ¥650 ¥1,660
Less - income tax expense ¥190 (¥150) (¥580)
Net income (loss) (¥300) ¥500 ¥1,080
38 Koji KOJIMA
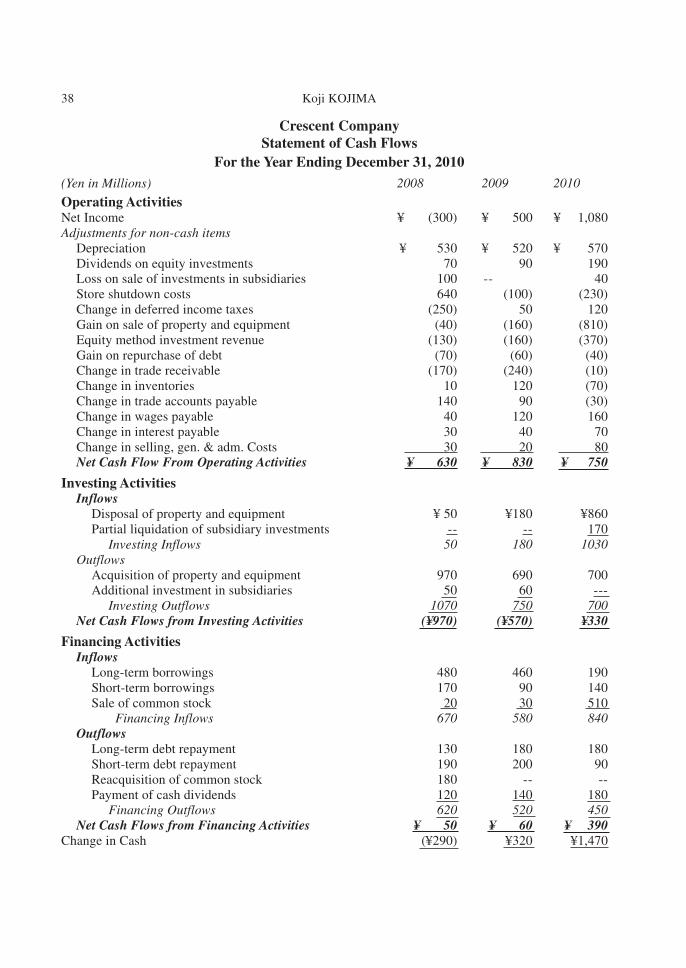
Crescent CompanyStatement of Cash Flows
For the Year Ending December 31, 2010(Yen in Millions) 2008 2009 2010
Operating ActivitiesNet Income ¥ (300) ¥ 500 ¥ 1,080Adjustments for non-cash items
Depreciation ¥ 530 ¥ 520 ¥ 570Dividends on equity investments 70 90 190Loss on sale of investments in subsidiaries 100 -- 40Store shutdown costs 640 (100) (230)Change in deferred income taxes (250) 50 120Gain on sale of property and equipment (40) (160) (810)Equity method investment revenue (130) (160) (370)Gain on repurchase of debt (70) (60) (40)Change in trade receivable (170) (240) (10)Change in inventories 10 120 (70)Change in trade accounts payable 140 90 (30)Change in wages payable 40 120 160Change in interest payable 30 40 70Change in selling, gen. & adm. Costs 30 20 80Net Cash Flow From Operating Activities ¥ 630 ¥ 830 ¥ 750
Investing ActivitiesInflows
Disposal of property and equipment ¥ 50 ¥180 ¥860Partial liquidation of subsidiary investments -- -- 170 Investing Inflows 50 180 1030
OutflowsAcquisition of property and equipment 970 690 700Additional investment in subsidiaries 50 60 --- Investing Outflows 1070 750 700
Net Cash Flows from Investing Activities (¥970) (¥570) ¥330
Financing ActivitiesInflows
Long-term borrowings 480 460 190Short-term borrowings 170 90 140Sale of common stock 20 30 510 Financing Inflows 670 580 840
OutflowsLong-term debt repayment 130 180 180Short-term debt repayment 190 200 90Reacquisition of common stock 180 -- --Payment of cash dividends 120 140 180 Financing Outflows 620 520 450
Net Cash Flows from Financing Activities ¥ 50 ¥ 60 ¥ 390Change in Cash (¥290) ¥320 ¥1,470

39Decision Usefulness of Cash Flow Information Format
– An Experimental Study–
Answer Sheet
Student ID # Year Name
LOAN ANALYSIS
Below your are asked to compute several financial ratios as part making a decision onwhether to loan Crescent Company additional funds to help them expand. The formula forcomputing the ratios are provided with each question. The information you need to make thecomputations can be obtained from an analysis of the provided financial statements.
You will find it helpful to separate the cover sheet and financial statement pages (pages 1-4)from the remainder of the questionnaire. Room for computations is provided below eachquestion. Use the back of the cover sheet if you need additional computational room. Certaincomputations you make for one ratio question will be used in one or more additionalquestions. The questions refer you back to the original computation question so you cansimply copy your prior computation.
Please Record the Time You Start: Time :
I. In 2008, accounts receivable turned over 7.98 times. In 2010, receivables were convertedless quickly to cash (The accounts receivable turnover ratio was 7.53). In 2008,inventories turned over 8.44 times. What was the comparable inventory turnover ratio for2010? Please round your answer to two decimals.
2008 2010Accounts Receivable Turnover Ratio: (Cash basis) 7.98 7.53
Inventory Turnover Ratio: (Cash basis)
Cash Paid for Inventory Purchases Inventories at Year End
= 8.45 Ans.
II. Operating cash inflows must be adjusted for spontaneous (sales driven) changes. In 2010,how much more or less cash was collected from customers by Crescent Company thanone would have anticipated, given that sales increased by 11.6% over 2009 (Calculatewhether cash collections from customers increased by more or less than 11.6%).
Unanticipated Cash Collections:
Cash Collected From Customers (2010) millions

40 Koji KOJIMA
LessAnticipated 2010 Cash Collections[Cash Collected from Customers (2009)Adjusted for Expected Increase of 11.6%] ¥14,210 millions
Unanticipated Cash Collection (2010) Ans. _________millions (bracket answer if negative)
III. Crescent Company shut down stores that they believed were obsolete because they weretoo small and thus overly labor intensive. In 2008, approximately 5.7% of the cashcollections from customers were used to pay payroll related costs. What was thecomparable labor intensity ratio in 2010?
Please round your answer to two decimals.
Labor Intensity Ratio (2008) 5.72%
Labor Intensity Ratio (2010):
Cash Paid for Employee Wages X 100 = __________ x 100
Cash Collected from Customers (from II above)
Ans. ___________%
IV. Crescent Company has applied for a ¥4,000,000,000 loan. The firm plans to use 90% oftheir cash (as of 12/31/10) along with the loan proceeds to purchase several new superstores. Cash, not profits, repays loans. You must make a judgment about CrescentCompany’s ability to meet future debt service requirements. One indicator is the marginof comfort in the existing repayment ability of Crecent Company? What is the firm's fixedcharge coverage ratio for 2010? Please round your answer to two decimals.
Fixed Charge Coverage:
Dollar Contribution Margin (a) = ____________________= Total Fixed Payments (b) Ans. ___________
a. Dollar Contribution Margin: (Yen in millions)
Cash Collected from Customers (from question II or III) _______________less Cash Paid for Inventory (from question I) - _______________less Cash Paid for Employee Wages (from question III) - _______________

41Decision Usefulness of Cash Flow Information Format
– An Experimental Study–
less Cash Paid for Income Taxes - 460,000
Total Dollar Contribution Margin _______________
b. Total Fixed Payments:
Cash Paid for Selling, General and Administrative Expenses _______________plus Interest Paid in Cash + 160,000plus Total Debt Repaid + _____________
Total Fixed Payments ______________
(Note) Assume all “Cash Paid for Selling, General and Administrative Expenses” are fixedpayments.
V. If Crescent Company’s Loan request is approved the interest rate will be 10% interest rateand there will be a principal payoff of ¥160 millions per year for 25 years. The projectedadditional debt service charges would be ¥560 millions in 2011 (¥400 millions interestand ¥160 millions principle). You project that Crecent Company's Average ContributionMargin will be 10% in 2011. Compute the projected breakeven sales needed to cover2010 fixed payments and the projected new annual debt service charges of ¥560 millions.
Breakeven Sales:
Total Projected 2011 Fixed Charges (a) =
______________ =
Average Projected Contribution Margin .10Ans. ___________
a. Total Projected Fixed Charges:
2010 Fixed Payments (from question IV) _____________plus Projected New 2011 Debt Charges + 560,000
Total Projected Fixed Charges _____________
Review your answers as desired
Please Record the Time you Stop: Time :

42 Koji KOJIMA
AUTHORIZE LOAN QUESTION
Based totally upon your analysis of Crescent Company’s financial statements and the ratiosyou computed, how much, if any, of the ¥4,000,000,000 loan request would you agree to lendto Change Company?
Assume, your bank is eligible by Federal regulations to lend ¥10,000,000,000 to a single firm.Your bank also has corresponding bank relationships with several other banks which allowyou to participate in lending.
You may (1) approve Crescent Company’s loan request for the full ¥4,000,000,000; (2) denythe loan in its entirety; or (3) agree to be part of a participation of several banks for someamount between ¥0 and ¥4 billion. Please indicate what you would do with an X and providethe Yen amount if you select the partial loan option.
_____ Deny loan request
_____ Approve the total ¥4 billion loan request
_____ Approve a loan for the Yen amount indicated below _______________
Demographic Information
Student ID # Year Name
This information will be used only to help analyze the results. All details will be kept totallyconfidential, as will your answers to the questions asked.
Education: Major YearMasters Degree ____________ ____________ _________Bachelors Degree __________ ____________ _________No College Degree _________
Professional Certifications: (Certificate of Book Keeping, CFA, CPA, etc.) (Please list)
Years studying for CPA examination ________________ year(s)
Experience in job (years) ___________________________ year(s)
Experience in current job (years) ________________

43Decision Usefulness of Cash Flow Information Format
– An Experimental Study–
We are interested in your opinion of the cash flow statement that was included as part of theset of financial statements that you just used. Listed below are a series of statements thatrepresent possible feelings that you might have about the cash flow statement. Think aboutthe cash flow statement that you just used to answer questions and indicated below, bycircling the numbers provided, your level of agreement or disagreement with each of thefollowing statements.
1 Strongly Agree 2 Agree 3 Slightly Agree 4 Neither Agree or Disagree5 Slightly Disagree 6 Disagree 7 Strongly Disagree
1. The operating cash flows section was clearly written.1 2 3 4 5 6 7
2. The language used in the statement required too much technical expertise in accounting.1 2 3 4 5 6 7
3. The statement failed to include all the information needed about operating cash flows.1 2 3 4 5 6 7
4. The cash provided by operations was easily understood.1 2 3 4 5 6 7
5. The statement in conjunction with other financial statements helped me to assess futureoperating cash flows.
1 2 3 4 5 6 76. The financing and investing sections were clearly written.
1 2 3 4 5 6 77. The statement presentation was longer than necessary.
1 2 3 4 5 6 78. The statement format made it easy to identify major operating cash inflows and outflows.
1 2 3 4 5 6 7
44 Koji KOJIMA
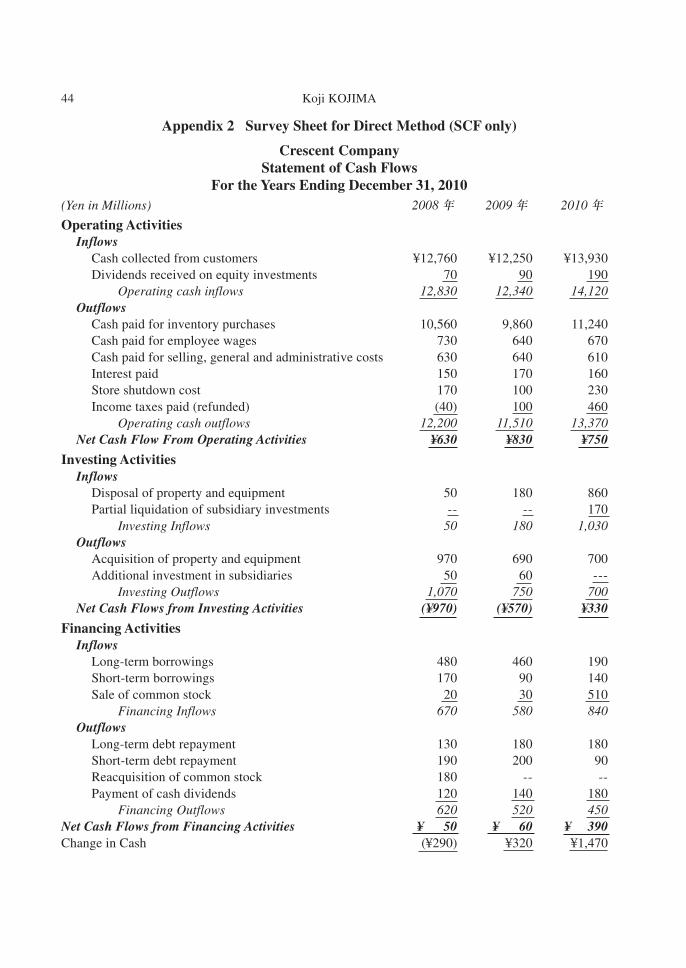
Appendix 2 Survey Sheet for Direct Method (SCF only)
Crescent CompanyStatement of Cash Flows
For the Years Ending December 31, 2010(Yen in Millions) 2008 年 2009 年 2010 年
Operating ActivitiesInflows
Cash collected from customers ¥12,760 ¥12,250 ¥13,930Dividends received on equity investments 70 90 190
Operating cash inflows 12,830 12,340 14,120Outflows
Cash paid for inventory purchases 10,560 9,860 11,240Cash paid for employee wages 730 640 670Cash paid for selling, general and administrative costs 630 640 610Interest paid 150 170 160Store shutdown cost 170 100 230Income taxes paid (refunded) (40) 100 460
Operating cash outflows 12,200 11,510 13,370Net Cash Flow From Operating Activities ¥630 ¥830 ¥750
Investing ActivitiesInflows
Disposal of property and equipment 50 180 860Partial liquidation of subsidiary investments -- -- 170
Investing Inflows 50 180 1,030Outflows
Acquisition of property and equipment 970 690 700Additional investment in subsidiaries 50 60 ---
Investing Outflows 1,070 750 700Net Cash Flows from Investing Activities (¥970) (¥570) ¥330
Financing ActivitiesInflows
Long-term borrowings 480 460 190Short-term borrowings 170 90 140Sale of common stock 20 30 510
Financing Inflows 670 580 840Outflows
Long-term debt repayment 130 180 180Short-term debt repayment 190 200 90Reacquisition of common stock 180 -- --Payment of cash dividends 120 140 180
Financing Outflows 620 520 450Net Cash Flows from Financing Activities ¥ 50 ¥ 60 ¥ 390Change in Cash (¥290) ¥320 ¥1,470