final report - florida department of transportation - home€¦ · · 2015-03-10final report ....
TRANSCRIPT

Final Report
VALIDATION AND REFINEMENT OF MIXTURE VOLUMETRIC MATERIAL PROPERTIES IDENTIFIED IN SUPERPAVE MONITORING PROJECT II: PHASE II
Submitted to:
Florida Department of Transportation
605 Suwannee Street
Tallahassee, FL, 32399
Dr. Reynaldo Roque, PE
Dr. Marco Isola
Michael Bekoe
Dr. Jian Zou
George Lopp
Department of Civil and Coastal Engineering
Engineering School of Sustainable Infrastructure and Environment
365 Weil Hall, P. O. Box 116580
Gainesville, FL, 32611-6580
Tel: (352) 392-9537 ext. 1458
February 2015
UF Project No.:
Contract No.: BDV31-977-18

DISCLAIMER
The opinions, findings, and conclusions expressed in this publication are those of the authors and not necessarily those of the Florida Department of Transportation. Prepared in cooperation with the State of Florida Department of Transportation.
ii

iii

Technical Report Documentation Page
1. Report No.
2. Government Accession No. 3. Recipient’s Catalog No.
4. Title and Subtitle Validation and Refinement of Mixture Volumetric Material Properties Identified in Superpave Monitoring Project II – Phase II
5. Report Date February 2015 6. Performing Organization Code
7. Author(s) Reynaldo Roque, Michael Bekoe, Marco Isola, Jian Zou, George Lopp
8. Performing Organization Report No.
9. Performing Organization Name and Address University of Florida Department of Civil and Coastal Engineering 365 Weil Hall P. O. Box 116580 Gainesville, FL 32611-6580
10. Work Unit. (TRAIS) 11. Contract or Grant No.
BDV31-977-18 12. Sponsoring Agency Name and Address Florida Department of Transportation Research Management Center 605 Suwannee Street, MS 30 Tallahassee, FL 32399
13. Type of Report and Period Covered Final
11/15/2011 – 02/16/2015 14. Sponsoring Agency Code
15. Supplementary Notes
16. Abstract This study was initiated to validate and refine mixture volumetric material properties identified in the Superpave Monitoring Project II. It has been found that differences in performance are primarily controlled by differences in gradation and resulting volumetric properties between the mixtures. A set of performance-related parameters and associated criteria have been developed based on analysis of the aggregates in the Dominant Aggregate Size Range and the Interstitial Component (DASR-IC). These parameters include DASR porosity, disruption factor (DF), effective film thickness (EFT), and the fine aggregate ratio (FAR). The porosity relates to the DASR, which has been found to be beneficial to improving both rutting and cracking resistance while DF, EFT, and FAR relate to the IC. This study focused on EFT and FAR parameters, which have not been validated. The study was to assess the effects of changes in interstitial volume (IV) characteristics on cracking performance. The main goal was to establish through extensive laboratory study clear implementable gradation and volumetric criteria for purposes of mixture design and construction specifications that will lead to consistently enhanced cracking performance. Laboratory test results from Superpave Indirect Tension Test (IDT) clearly showed that changes in IC gradation have an effect on mixture performance. The effect of changes in IC gradation on mixture properties were dependent on aggregate type and the characteristics of the aggregate. The two unmodified granite mixtures that met the preliminary established criteria exhibited the best mixture performance while all other granite mixtures exhibited marginal performance. Modification, however, helped to improve the underperforming granite mixtures except for excessively fine ICs. All the limestone mixtures had adequate performance and were relatively unaffected by modification. It was concluded that the preliminary volumetric criteria were effective, and their implementation would help to ensure consistently enhanced cracking performance. It may be possible to relax criteria if modified binder is used. 17. Key Word
Interstitial Component, Effective Film Thickness, Fine Aggregate Ratio, Energy Ratio, Cyclic Pore Pressure Conditioning, Granite, Limestone, unmodified
18. Distribution Statement No restrictions. This document is available
to the public through the National Technical Information Service, Springfield, VA, 22161
19. Security Classif. (of this report) Unclassified
20. Security Classif (of this page) Unclassified
21. No. of Pages 136
22. Price
Form DOT F 1700.7 (8-72) Reproduction of completed page authorized
iv

ACKNOWLEDGEMENT
The authors would like to acknowledge and thank the Florida Department of
Transportation (FDOT) for providing technical and financial support and materials for this project. Special thanks go to project manager Sungho Kim and engineers and technicians of the Bituminous section of the State Materials Office for their contributions throughout the various phases of this project.
v

EXECUTIVE SUMMARY
It is well documented in the literature that performance of asphalt mixture is strongly
affected by aggregate structure. Several theories have been proposed to characterize internal structure and to link gradation to aggregate structure and mixture performance. Specifically, relationships have been identified between the primary coarse aggregate structure and mixture resistance to rutting, based on interactive coarse particles. However, research has shown that mixtures with acceptable rutting performance may or may not result in acceptable cracking performance. Moreover, it has been identified that the volume between the coarse aggregate structure may be a critical factor on mixture cracking performance and that having an adequate coarse aggregate structure may not be enough to accurately distinguish the cracking performance of asphalt mixture. The Dominant Aggregate Size Range-Interstitial Component (DASR-IC) model provides a framework of gradation-based parameters and associated criteria to link gradation characteristics and volumetric properties to aggregate structure, mixture properties, and field performance. These parameters include DASR porosity, disruption factor (DF), effective film thickness (EFT), and fine aggregate ratio (FAR). Primary interlocking of coarse aggregate is characterized by DASR porosity and disruption factor (DF), which have been used to establish performance-based criteria based on extensive field rutting data. Two other parameters, EFT and FAR, were identified to characterize the interstitial component (IC). The objective of the study was to evaluate the effects of changes in interstitial volume (IV) characteristics on mixture’s cracking resistance. The main goal was to establish clear implementable gradation and volumetric criteria for purposes of mixture design and construction specifications that will lead to consistently enhanced cracking performance. The DASR-IC model was used to develop a range of mixtures to be tested by first designing the coarse aggregate structure with adequate interlocking and then varying the fine portion of the gradation. Laboratory test results from Superpave Indirect Tension Test (IDT) clearly showed that changes in IC gradation have a significant effect on the characteristics of the mixtures which affected performance. An increase in IC coarseness resulted in an increase in binder content. Additionally, fine IC gradations resulted in aggregates that were in close proximity, and hence asphalt binder was thinly distributed. Coarser IC gradations resulted in aggregates that were sparsely distributed, and hence asphalt binder was coarsely distributed. Furthermore, the effects of changes in IC gradation on mixture properties were dependent on aggregate type. Granite mixtures were more sensitive to changes in IC gradation than limestone mixtures. This is because the weaker limestone coarse aggregates dictated failure in the limestone mixtures, whereas the mastic dictated failure in granite mixtures. With respect to mixture performance, it was found that the two unmodified granite mixtures that met the preliminary established criteria exhibited the best mixture performance while all other granite mixtures exhibited marginal performance. Binder modification helped to improve the underperforming granite mixtures except for ones with excessively fine ICs. All the limestone mixtures had satisfactory performance and were relatively unaffected by modification. It was concluded that the preliminary volumetric criteria were effective and their implementation would help to ensure consistently enhanced cracking performance. It may be possible to relax the criteria if modified binder is used.
vi

TABLE OF CONTENTS
Page
DISCLAIMER ................................................................................................................................ ii
SI (MODERN METRIC) CONVERSION FACTORS ................................................................. iii
TECHNICAL REPORT DOCUMENTATION PAGE ................................................................. iv
ACKNOWLEDGEMENT ...............................................................................................................v
EXECUTIVE SUMMARY ........................................................................................................... vi
LIST OF TABLES ...........................................................................................................................x
LIST OF FIGURES ...................................................................................................................... xii
CHAPTER 1 - INTRODUCTION ...................................................................................................1
1.1 Background .........................................................................................................................1 1.2 Objectives ...........................................................................................................................2 1.3 Scope ...................................................................................................................................2 1.4 Research Approach .............................................................................................................2
CHAPTER 2 - LITERATURE REVIEW ........................................................................................4
2.1 Aggregate Structure ............................................................................................................4 2.2 Micromechanics Evaluation ...............................................................................................4 2.3 The Bailey Method .............................................................................................................5 2.4 DASR–IC model .................................................................................................................8 2.5 DASR Porosity ...................................................................................................................9 2.6 Interstitial Volume ............................................................................................................10
CHAPTER 3 - MATERIALS AND LABORATORY MIXTURE TESTS ..................................13
3.1 Mix Design for Isolating and Evaluating IC Effects ........................................................13 3.2 Materials and Final Mix Designs ......................................................................................15 3.3 Superpave IDT Tests ........................................................................................................21
3.3.1 Resilient Modulus Test ...........................................................................................22 3.3.2 Creep test ................................................................................................................23 3.3.3 Strength Test ...........................................................................................................24
3.4 Test Specimen Preparation ...............................................................................................27 3.4.1 Batching and Mixing ..............................................................................................27 3.4.2 Compaction .............................................................................................................27 3.4.3 Slicing and Gauge Points Attachment ....................................................................27
3.5 Conditioning Procedures ..................................................................................................28 3.5.1 Heat Oxidation Conditioning .................................................................................28
vii

3.5.2 Cyclic Pore Pressure Conditioning .........................................................................28
CHAPTER 4 - TEST RESULTS ...................................................................................................31
4.1 Introduction .......................................................................................................................31 4.2 Test Results .......................................................................................................................31 4.3 General Effects of IV Characteristics ...............................................................................33
4.3.1 Introduction ............................................................................................................33 4.3.2 Granite Mixtures with Unmodified Binder ............................................................33 4.3.3 Granite Mixtures with Modified Binder .................................................................37 4.3.4 Limestone Mixtures with Unmodified Binder .......................................................40 4.3.5 Limestone Mixtures with Modified Binder ............................................................43
4.4 Effect of IV Characteristics on Resistance to Oxidative Aging .......................................47 4.4.1 Introduction ............................................................................................................47 4.4.2 Granite Mixtures with Unmodified Binder ............................................................47 4.4.3 Granite Mixtures with Modified Binder at LTOA .................................................51 4.4.4 Limestone Mixtures with Unmodified Binder at LTOA ........................................55 4.4.5 Limestone Mixtures with Modified Binder at LTOA ............................................59
4.5 Effect of IV Characteristics on Resistance to Oxidation and Moisture Damage .............65 4.5.1 Introduction ............................................................................................................65 4.5.2 Granite Mixtures with Unmodified Binder at LTOA+CPPC .................................65 4.5.3 Granite Mixtures with Modified Binder at LTOA+CPPC .....................................69 4.5.4 Limestone Mixtures with Unmodified Binder at LTOA+CPPC ............................73 4.5.5 Limestone Mixtures with Modified Binder at LTOA+CPPC ................................78
4.6 Effect of IV Characteristics on Cracking Performance ....................................................83 4.6.1 Introduction ............................................................................................................83 4.6.2 Granite Mixtures at LTOA+CPPC .........................................................................84 4.6.3 Limestone Mixtures at LTOA+CPPC ....................................................................86
CHAPTER 5 - FINITE ELEMENT ANALYSIS ..........................................................................90
5.1 Introduction .......................................................................................................................90 5.2 Development of the Model Geometry ..............................................................................90 5.3 Effect of IC Particle Size ..................................................................................................93
CHAPTER 6 - CLOSURE .............................................................................................................99
6.1 Summary and Findings .....................................................................................................99 6.2 Conclusions.....................................................................................................................100
LIST OF REFERENCES .............................................................................................................116
viii

APPENDICES .............................................................................................................................101
Appendix A - LABORATORY MIXTURE INFORMATION ...................................................101
Appendix B - BATCHING WEIGHTS FOR DESIGNED MIXTURES ....................................105
Appendix C - IDT RESULTS ......................................................................................................114
ix

LIST OF TABLES
Table page Table 3-1. DASR-IC parameters and volumetric properties for granite mixtures .........................20
Table 3-2. DASR-IC parameters and volumetric properties for limestone mixtures ....................20
Table 5-1. Determination of DASR particle size for FE model ....................................................90
Table 5-2. Characteristics of the models used to define the gap size and resulting effective stiffness of the model .........................................................................................................92
Table 5-3. Characteristics of the models used to calibrate Emastic and resulting effective stiffness of the model .........................................................................................................94
Table A1. Gradations for granite mixtures ..................................................................................101
Table A2. Gradations for limestone mixtures ..............................................................................101
Table A3. Designed volumetrics for granite mixtures .................................................................104
Table A4. Designed volumetrics for limestone mixtures ............................................................104
Table B1. Aggregate stockpiles used for granite mixtures ..........................................................105
Table B2. Aggregate stockpiles used for limestone mixtures......................................................105
Table B3. Batch weight for granite mixture DASR I-IC1 gyratory samples...............................105
Table B4. Batch weight for granite mixture DASR I-IC2 gyratory samples...............................106
Table B5. Batch weight for granite mixture DASR I-IC3 gyratory samples...............................106
Table B6. Batch weight for granite mixture DASR I-IC4 gyratory samples...............................107
Table B7. Batch weight for granite mixture DASR II-IC1 gyratory samples .............................107
Table B8. Batch weight for granite mixture DASR II-IC2 gyratory samples .............................108
Table B9. Batch weight for granite mixture DASR II-IC3 gyratory samples .............................108
Table B10. Batch weight for granite mixture DASR II-IC4 gyratory samples ...........................109
Table B11. Batch weight for limestone mixture DASR I-IC1 gyratory samples ........................109
Table B12. Batch weight for limestone mixture DASR I-IC2 gyratory samples ........................110
Table B13. Batch weight for limestone mixture DASR I-IC3 gyratory samples ........................110
x

Table B14. Batch weight for limestone mixture DASR I-IC4 gyratory samples ........................111
Table B15. Batch weight for limestone mixture DASR II-IC1 gyratory samples .......................111
Table B16. Batch weight for limestone mixture DASR II-IC2 gyratory samples .......................112
Table B17. Batch weight for limestone mixture DASR II-IC3 gyratory samples .......................112
Table B18. Batch weight for limestone mixture DASR II-IC4 gyratory samples .......................113
Table C1. IDT results for unmodified granite mixtures ..............................................................114
Table C2. IDT results for modified granite mixtures ..................................................................114
Table C3. IDT results for unmodified limestone mixtures ..........................................................115
Table C4. IDT results for modified limestone mixtures ..............................................................115
xi

LIST OF FIGURES
Figure Page Figure 1-1 Flowchart for the experimental testing plan...................................................................3
Figure 2-1. Determination of mix type ............................................................................................6
Figure 2-2. Two-dimensional aggregate packing model .................................................................6
Figure 2-3. Overview of the divisions in a continuous gradation ....................................................7
Figure 2-4. DASR–IC model. (A) Schematic representation of the DASR-IC model. (B) Mixture components of asphalt mixture ..............................................................................9
Figure 3-1. The granite screenings stockpile gradations used in Florida ......................................14
Figure 3-2. The limestone screenings stockpile gradations used in Florida ..................................14
Figure 3-3. General illustration of DASR structure and interstitial volume: (A) DASR structure; (B) fine IC; and (C) coarse IC ...........................................................................16
Figure 3-4. General illustration of variation in IC coarseness for each DASR structure ..............17
Figure 3-5. Gradation design of granite mixtures for DASR I (IC-1 to IC-4) ...............................17
Figure 3-6. Gradation design of granite mixtures for DASR II (IC-1 to IC-4) .............................18
Figure 3-7. Gradation design of limestone mixtures for DASR I (IC-1 to IC-4) ..........................18
Figure 3-8. Gradation design of limestone mixtures for DASR II (IC-1 to IC-4) .........................19
Figure 3-9. Experimental testing plan ............................................................................................21
Figure 3-10. Superpave IDT test. (A) Specimen ready to be tested. (B) Representation of Superpave IDT test set-up ..................................................................................................22
Figure 3-11. Typical load, deformation versus time relationships in a repeated-load indirect tension test .........................................................................................................................22
Figure 3-12. Power model of creep compliance ............................................................................24
Figure 3-13. Determination of FE and DCSEf ..............................................................................26
Figure 3-14. Laboratory equipment used for specimen preparation. (A) Masonry saw. (B) Vacuum pump setup for gauge points attachment. ............................................................28
Figure 3-15. Tabletop triaxial chamber .........................................................................................29
xii

Figure 3-16. Sine wave form of cyclic pressure used for CPPC ...................................................30
Figure 4-1. Typical data presentation using bar charts ..................................................................32
Figure 4-2. Typical data presentation using lines ..........................................................................33
Figure 4-3. Strength of granite mixtures with unmodified binder at STOA ..................................34
Figure 4-4. Failure strain of granite mixtures with unmodified binder at STOA ..........................35
Figure 4-5. Fracture energy of granite mixtures with unmodified binder at STOA ......................35
Figure 4-6. Resilient modulus of granite mixtures with unmodified binder at STOA ..................36
Figure 4-7. Creep rate of granite mixtures with unmodified binder at STOA ...............................36
Figure 4-8. Strength of modified and unmodified granite mixtures at STOA ...............................37
Figure 4-9. Failure strain of modified and unmodified granite mixtures at STOA .......................38
Figure 4-10. Fracture energy of modified and unmodified granite mixtures at STOA .................38
Figure 4-11. Resilient modulus of modified and unmodified granite mixtures at STOA .............39
Figure 4-12. Creep rate of modified and unmodified granite mixtures at STOA ..........................39
Figure 4-13. Strength of limestone and granite mixtures with unmodified binder at STOA ........40
Figure 4-14. Failure strain of limestone and granite mixtures with unmodified binder at STOA .................................................................................................................................41
Figure 4-15. Fracture energy of limestone and granite mixtures with unmodified binder at STOA .................................................................................................................................41
Figure 4-16. Failure surface of limestone and granite mixture ......................................................42
Figure 4-17. A. Differences in surface texture. (A) Granite aggregate. (B) Limestone aggregate ............................................................................................................................42
Figure 4-18. Resilient modulus of limestone and granite mixtures with unmodified binder at STOA .................................................................................................................................42
Figure 4-19. Creep rate of limestone and granite mixtures with unmodified binder at STOA .....43
Figure 4-20. Strength of limestone and granite mixtures with modified binder at STOA ............44
Figure 4-21. Failure strain of limestone and granite mixtures with modified binder at STOA .....44
xiii

Figure 4-22. Fracture energy of limestone and granite mixtures with modified binder at STOA .................................................................................................................................45
Figure 4-23. Fracture energy of modified and unmodified limestone mixtures at STOA .............45
Figure 4-24. Resilient modulus of limestone and granite mixtures with modified binder at STOA .................................................................................................................................46
Figure 4-25. Creep rate of limestone and granite mixtures with modified binder at STOA .........46
Figure 4-26. Creep rate of modified and unmodified limestone mixtures at STOA .....................47
Figure 4-27. Effect of oxidation on strength for granite mixtures with unmodified binder ..........48
Figure 4-28. Effect of oxidation on failure strain for granite mixtures with unmodified binder .................................................................................................................................49
Figure 4-29. Effect of oxidation on FE for granite mixtures with unmodified binder ..................49
Figure 4-30. Effect of oxidation on MR for granite mixtures with unmodified binder .................50
Figure 4-31. Effect of oxidation on creep rate for granite mixtures with unmodified binder .......50
Figure 4-32. Effect of oxidation on strength of granite mixtures with modified binder ...............51
Figure 4-33. Effect of oxidation on failure strain of granite mixtures with modified binder ........52
Figure 4-34. Effect of oxidation on FE for granite mixtures with modified binder ......................52
Figure 4-35. Effect of modified binder on FE for granite mixtures with modified binder at LTOA .................................................................................................................................53
Figure 4-36. Effect of oxidation on MR for granite mixtures with modified binder .....................53
Figure 4-37. Effect of oxidation on creep for granite mixtures with modified binder ..................54
Figure 4-38. Effect of modified binder on creep rate for granite mixtures at LTOA ....................54
Figure 4-39. Effect of oxidation on strength for limestone mixtures with unmodified binder ......56
Figure 4-40. Effect of oxidation on failure strain for limestone mixtures with unmodified binder .................................................................................................................................56
Figure 4-41. Effect of oxidation on FE for limestone mixtures with unmodified binder ..............57
Figure 4-42. Effect of oxidation on MR for limestone mixtures with unmodified binder ............57
Figure 4-43. Effect of oxidation on creep rate for limestone mixtures with unmodified binder ...58
xiv

Figure 4-44. Fracture energy of limestone and granite mixtures with unmodified binder at LTOA .................................................................................................................................58
Figure 4-45. Creep rate of limestone and granite mixtures with unmodified binder at LTOA .....59
Figure 4-46. Effect of oxidation on strength for limestone mixtures with modified binder ..........60
Figure 4-47. Effect of oxidation on failure strain for limestone mixtures with modified binder .................................................................................................................................61
Figure 4-48. Effect of oxidation on FE for limestone mixtures with modified binder ..................61
Figure 4-49. Effect of modified binder on fracture energy for limestone mixtures at LTOA .......62
Figure 4-50. Effect of oxidation on MR for limestone mixtures with modified binder ................62
Figure 4-51. Effect of oxidation on creep rate for limestone mixtures with modified binder .......63
Figure 4-52. Effect of modified binder on creep rate for limestone mixtures at LTOA................63
Figure 4-53. Fracture energy of limestone and granite mixtures with modified binder at LTOA .................................................................................................................................64
Figure 4-54. Creep rate of limestone and granite mixtures with modified binder at LTOA .........64
Figure 4-55. Moisture effect on strength for granite mixtures with unmodified binder ................67
Figure 4-56. Moisture effect on failure strain for granite mixtures with unmodified binder ........67
Figure 4-57. Moisture effect on fracture energy for granite mixtures with unmodified binder ....68
Figure 4-58. Moisture effect on resilient modulus for granite mixtures with unmodified binder .................................................................................................................................68
Figure 4-59. Moisture effect on creep rate for granite mixtures with unmodified binder .............69
Figure 4-60. Moisture effect on strength for granite mixtures with modified binder ....................70
Figure 4-61. Moisture effect on failure strain for granite mixtures with modified binder ............70
Figure 4-62. Moisture effect on Fracture energy for granite mixtures with modified binder .......71
Figure 4-63. Fracture energy for modified and unmodified granite mixtures at LTOA+CPPC....71
Figure 4-64. Moisture effect on resilient modulus for granite mixtures with modified binder .....72
Figure 4-65. Moisture effect on creep rate for granite mixtures with modified binder .................72
Figure 4-66. Effect of modified binder on creep rate for granite mixtures at LTOA+CPPC ........73
xv

Figure 4-67. Moisture effect on strength for limestone mixtures with unmodified binder ...........74
Figure 4-68. Moisture effect on failure strain for limestone mixtures with unmodified binder ....75
Figure 4-69. Moisture effect on FE for limestone mixtures with unmodified binder....................75
Figure 4-70. Fracture energy of limestone and granite mixtures with unmodified binder at LTOA+CPPC .....................................................................................................................76
Figure 4-71. Moisture effect on resilient modulus for limestone mixtures with unmodified binder .................................................................................................................................76
Figure 4-72. Moisture effect on creep rate for limestone mixtures with unmodified binder.........77
Figure 4-73. Creep rate of limestone and granite mixtures with unmodified binder at LTOA+CPPC .....................................................................................................................77
Figure 4-74. Moisture effect on strength for limestone mixtures with modified binder ...............79
Figure 4-75. Moisture effect on failure strain for limestone mixtures with modified binder ........79
Figure 4-76. Moisture effect on fracture energy for limestone mixtures with modified binder ....80
Figure 4-77. Modified binder effect on FE for limestone mixtures after LTOA+CPPC ...............80
Figure 4-78. FE of limestone and granite mixtures with modified binder after LTOA+CPPC.....81
Figure 4-79. Moisture effect on resilient modulus for limestone mixtures with modified binder .................................................................................................................................81
Figure 4-80. Moisture effect on creep rate for limestone mixtures with modified binder .............82
Figure 4-81. Modified binder effect on creep rate for limestone mixtures after LTOA+CPPC ....82
Figure 4-82. Creep rate of limestone and granite mixtures with modified binder after LTOA+CPPC .....................................................................................................................83
Figure 4-83. Changes in ER for unmodified granite mixtures.......................................................84
Figure 4-84. Effect of modified binder on ER for granite mixtures ..............................................85
Figure 4-85. Effect of modified binder on ER for granite mixtures ..............................................85
Figure 4-86. Changes in ER for limestone mixtures with unmodified binder ...............................87
Figure 4-87. Changes in ER for limestone mixtures with modified binder ...................................87
Figure 4-88. Effect of modified binder on ER for limestone mixtures ..........................................88
xvi

Figure 4-89. Performances of granite and limestone mixtures with unmodified binder ...............88
Figure 4-90. Performances of granite and limestone mixtures with modified binder ...................89
Figure 5-1. Simple cubical packing ...............................................................................................90
Figure 5-2. Representation of the FE model. (A) DASR structure. (B) Two phase FE model (IC particles not included) .................................................................................................91
Figure 5-3. FE model used to define the gap size. (A) Design of the model. (B) Distribution of maximum principal stress within the model ..................................................................92
Figure 5-4. Determination of gap size ...........................................................................................92
Figure 5-5. FE model with coarse IC aggregate. (A) model configuration. (B) stress contour .....93
Figure 5-6. FE model with intermediate IC aggregate. (A) model configuration. (B) stress contour ...............................................................................................................................93
Figure 5-7. FE model with fine IC aggregate. (A) model configuration. (B) stress contour .........94
Figure 5-8. Determination of Emastic using the model with intermediate IC aggregate .................95
Figure 5-9. Effect of IC particle size on maximum principal stress in the gap between DASR particles (location 1) ..........................................................................................................95
Figure 5-10. Effect of IC particle size on maximum principal stress distribution at Location 2..........................................................................................................................................96
Figure 5-11. Comparison of peak stresses of three IC models at two locations ............................97
Figure 5-12. Modified intermediate IC model: (A) model configuration; (B) stress contour .......97
Figure 5-13. Modified fine IC model: (A) model configuration; (B) stress contour .....................98
Figure 5-14. Comparison of peak stresses of four IC models at three locations ...........................98
Figure A1. Close-up view of the IC portion of granite mixtures (DASR I) ................................102
Figure A2. Close-up view of the IC portion of granite mixtures (DASR II) ...............................102
Figure A3. Close-up view of the IC portion of limestone mixtures (DASR I) ............................103
Figure A4. Close-up view of the IC portion of limestone mixtures (DASR II) ..........................103
xvii

CHAPTER 1 INTRODUCTION
1.1 Background
Asphalt mixture is a heterogeneous multiphase material that consists of aggregates of different sizes, asphalt binder, and air voids. In particular, aggregates represent about 95% of the total weight of the mixture. It is well documented in literature that the performance of asphalt mixture is related to aggregate gradation, which affects the most important properties of the mixture, such as cracking and rutting resistance, durability, permeability, and workability. Typically, aggregate gradation is selected to meet Superior Performing Asphalt Pavements (Superpave) mix design specification. Consensus has not been reached regarding rational design guidelines to achieve optimal performance.
This issue has been addressed by several researchers during the past years, using different
approaches and techniques. Particularly, many researchers have identified relationships between the characteristics of the primary coarse aggregate structure (i.e. porosity, density, and contact length) and the mixture’s resistance to rutting. However, the interstitial volume within the coarse aggregate structure has not yet been properly characterized. Furthermore, research has shown that mixtures with acceptable rutting performance may or may not result in acceptable cracking performance. Studies conducted on the Superpave Field Monitoring project showed that Superpave mixtures exhibited highly variable cracking performance, even when all existing design and specification criteria were met. Results indicated that differences in performance were not explained by differences in binder properties between the mixtures; recovered binder from different mixtures had similar properties. It appears therefore that differences in cracking performance were primarily controlled by differences in gradation and resulting volumetric properties between the mixtures.
Recently, a conceptual and theoretical approach to evaluate aggregate structure based on
packing theory was developed at the University of Florida. Named the Dominant Aggregate Size Ratio-Interstitial Component (DASR-IC), the model is unique because it identifies the finer portion of the aggregate as the aggregate that does not interact with the coarser portion as opposed to arbitrarily setting a particle size, say #4, to distinguish between coarse and fine aggregates sizes. A comprehensive evaluation of field performance based on analysis of aggregates using this model established a set of performance-related parameters. These parameters included DASR porosity, disruption factor (DF), effective film thickness (EFT), and fine aggregate ratio (FAR). However, IC parameters proposed to date (i.e., DF, EFT and FAR) may not fully characterize the interstitial volume and its effects on mixture durability and cracking performance since the evaluation was based on limited field data. There is a need to validate and refine the criteria developed with a thorough laboratory study. This study focused on the EFT and FAR parameters which had not been previously validated. The objective was to evaluate the effects of changes in IV characteristics on cracking performance.
1

1.2 Objectives
The overall objective of this research was to establish clear implementable gradation and volumetric criteria for purposes of mixture design and construction specifications that lead to consistently enhanced cracking performance. It was envisaged that the findings of this research will lead to an enhancement of FDOT’s mix design procedure, which should result in longer lasting asphalt pavements.
The detailed objectives of this project are summarized below:
• Assess preliminary criteria established in the Superpave Field Monitoring Project for consistently enhanced cracking performance, including DASR porosity, disruption factor (DF), effective film thickness (EFT), and fine aggregate ratio (FAR).
• Design and conduct laboratory experiments to validate and refine the preliminary criteria for incorporation into asphalt mix design
• Based on the testing results, develop a set of implementable criteria that will help assure the majority of asphalt mixtures placed in Florida exhibit the best possible cracking performance given a specific combination of aggregates and binder.
o Determine values of DASR-IC parameters for all designed mixtures based on analyses of mixture component characteristics
o Establish the acceptable range for each DASR-IC parameter for incorporation into the FDOT’s mix design procedure for enhanced cracking performance
1.3 Scope
This study was initiated to validate and refine mixture volumetric material properties identified in the Superpave Monitoring Project II. To achieve the objectives of the project, the study was divided into two phases. For phase one, two types of aggregates widely used in the state of Florida were used to produce mixtures for laboratory testing: Georgia granite and Florida oolitic limestone. An unmodified binder PG 67-22 was utilized to produce the mixtures. Phase two of the project involved the use of the same aggregate types but with a modified PG 76-22 binder. The testing conditions were limited to one testing temperature (10˚C) and the mixtures were subjected to three different conditioning levels; short-term oven aging (STOA), long-term oven aging (LTOA) and cyclic pore pressure conditioning (CPPC). Mixtures with 12.5-mm NMAS were designed according to the Superpave Volumetric mix design method. The gradations were also designed according to the parameters defined by the DASR-IC model and their preliminary acceptable ranges. The Energy Ratio (ER) parameter was primarily used for relative comparison of fracture performance of designed mixtures subjected to same level of oxidation and moisture conditioning. Finite element analysis was performed to support laboratory test results and to achieve a better understanding of the relative effects of IC characteristics on stress and strain distribution within IV.
1.4 Research Approach
To meet the objectives of the project, the research was categorized into tasks, summarized below:
2

• Task 1- Literature Review: A literature review was conducted to gather and examine available information regarding issues associated with the identification and/or verification of relationships between asphalt mixture characteristics, including gradation and resulting volumetric properties, and asphalt mixture properties known to control cracking performance. Also, appropriate laboratory testing systems was identified to determine mixture properties for different aging and healing conditions. Additionally, unpublished information and ongoing research results was sought from public and private agencies and industry organizations.
• Task 2 – Experimental Testing Plan: A laboratory testing plan was designed to obtain the data necessary to meet the objectives of the project. The overall framework of the experimental testing plan is presented in Figure 1-1.
Figure 1-1 Flowchart for the experimental testing plan
• Task 3 – Specimen Preparation for Mixture testing: A total of 288 specimens, including the 32 different types of mixture, were prepared for standard Superpave IDT tests to obtain mixture properties for evaluation.
• Task 4 – Laboratory testing: Each mixture was tested at 10˚C after being conditioned by either of the three different conditioning levels: STOA, LTOA and LTOA+CPPC. The standard Superpave IDT tests which consist of resilient modulus, creep and strength tests were used. Fracture energy limit, which is associated with a mixture’s tolerance to damage, was obtained for evaluation.
• Task 5 – Analysis of Test Results: Analysis of laboratory test results formed the basis for further development and/or refinement of preliminary criteria identified as part of the phase II Superpave monitoring project
• Task 6 – Developing Implementable Gradation and volumetric criteria: an effective and implementable set of gradation and volumetric criteria has been established for purposes of mixture design and specification that will lead to consistently enhanced cracking performance.
3

CHAPTER 2 LITERATURE REVIEW
2.1 Aggregate Structure
Asphalt mixture is a heterogeneous multiphase material that consists of aggregates of different sizes, asphalt binder and air voids. In particular, aggregates represent about 95% of the total weight of the mixture. It is well documented in literature that the performance of asphalt mixture is strictly related to aggregate structure, which in turn affects the most important properties of the mixture, such as cracking and rutting resistance, durability, permeability and workability (Haddock et al., 1999, Kandhal et al., 2001, Ruth et al., 2002, Chun et al., 2012). Aggregate structure in governed by particle size distribution, or gradation, which is one of the most influential aggregate characteristics and a key factor in the mix design of an asphalt mixture.
The design of a mixture in the Superpave system bases the selection of the aggregate
gradation on achieving proper mixture volumetric. The gradation is designed to ensure that the maximum aggregate size is appropriate for the application, volumetric requirements are met and satisfactory aggregate skeleton is obtained. The objective is to develop a strong skeleton to enhance resistance to permanent deformation while allowing for sufficient void space to enhance mixture durability. These goals for the aggregate blend are achieved with a very loose control system which specifies control points that function as master ranges through which aggregate gradation must pass. Control points are placed at the nominal maximum size, an intermediate size (2.36 mm), and the smallest size (0.075 mm) and their limits depend on the nominal maximum aggregate size of the design mixture. The control points serve the purposes of controlling the top size of the aggregate, the relative proportion of coarse and fine aggregate and the dust proportion. The Superpave mix design system provides no specific guidance in the selection of the optimum aggregate blend, rather a trial and error process is proposed, which can be time consuming and costly. Furthermore, previous studies have determined that Superpave mix design criteria, including VMA, control points and effective asphalt content may not capture all critical aspects of gradation and mixture volumetric properties found to be strongly related to rutting and cracking performance (Coree et al., 2001, Nukunya et al., 2001, Kandhal et al.,2002). Therefore, guidance is lacking regarding the selection of an aggregate gradation for a suitable aggregate structure that will result in optimal performance. This issue has been addressed by several researchers during the past years, using many different approaches and techniques. The following subchapters summarize some of these approaches.
2.2 Micromechanics Evaluation
With the advent of computer imaging techniques, several researchers started characterizing mixture aggregate structure using imaging analysis. Digital imaging techniques allow analysis of digitized mixture images to obtain mixture aggregate internal structure. Images can be obtained using X-ray Computed Tomography (CT) which captures images of the internal structure of the specimen at a fixed interval or by high-resolution scanners; the internal structure of the scanned specimen can then be reconstructed and three-dimensional images of the specimen can be generated by combining the series of 2D images generated by the scanner.
4

In a recent research work by Sefidmazgi et al., 2012, a set of internal aggregate structure analysis features for asphalt mixtures was developed based on 2D image analysis. New indices were proposed to characterize asphalt mixtures’ internal structures, namely: number of aggregate-on-aggregate contact points, contact length/area and contact plane orientation. These new image-based indices were used to predict mixture rutting performance and were determined through the use of a modified version of the iPas software, developed in a previous study by the same research group.
You et al., 2008, developed a Discrete Element Model (DEM) of the asphalt mixture
microstructure to study the stiffness behavior both in 2D and 3D and to study the effects of air void content and distribution. The asphalt mixture microstructure was captured using high-resolution flat scanner, manipulated using image processing techniques and reconstructed into an assembly of 2D discrete elements. The 3D microstructure was obtained by using a number of layered 2D discrete element models. The asphalt mixture microstructure was modeled dividing it into two phases: aggregate phase (aggregates larger than 1.18 mm) and mastic phase (asphalt with aggregates smaller than 1.18 mm). Air voids were randomly generated in the mastic phase and modeled as deleted elements in the DEM model.
With the use of X-ray CT images to capture images of the internal structure of a mixture
specimen, You et al., 2011, 2013, 2013, developed a 3D finite element model (FEM) of an asphalt mixture microstructure able to predict its thermo-mechanical response. The model is composed of an aggregate phase (aggregates larger than 2.36 mm), considered as an elastic material and the matrix phase (asphalt, aggregates smaller than 2.36 mm and air voids) modeled using thermo-viscoelastic, thermo-viscoplastic, and thermo-viscodamage constitutive models. Through the use of the model, the researchers were able to simulate uniaxial monotonic tests and repeated creep-recovery tests, effectively evaluating the overall thermal-mechanical response of asphalt concrete.
Previous research has demonstrated that asphalt mixture microstructure can be effectively
characterized using both 2D and 3D image analysis. Through the use of imaging analysis coupled with finite or discrete element analysis, several researchers were able to evaluate the effects of air void content and distribution, aggregate microstructure and predict asphalt mixture rutting performance. Furthermore, when combined with complex constitutive models, researchers were able to perform ‘virtual testing’ by predicting the thermo-mechanical response of asphalt mixture when subjected to thermal or mechanical induced stresses. However, in order to simplify the analysis or because of limitations of the optical devices used to capture images, generally aggregates smaller than 1.18 – 2.36 mm have been considered as part of the asphalt mastic. Therefore, only the coarse aggregate structure has generally been characterized, mainly in relation with rutting performance.
2.3 The Bailey Method
Several theories have been proposed to characterize internal structure and in particular to link gradation to aggregate structure and mixture performance. In the early 1980’s, the Bailey method was developed at the Illinois DOT with the main purpose of controlling the volumetric properties of mixture during construction as a means to combat rutting of asphalt mixtures while
5

maintaining the proper durability characteristics. The Bailey method of mix design provides a set of tools to develop and analyze aggregate blends and to better understand the relationship between aggregate gradation and mixture voids, and offers a means to design the aggregate structure in an asphalt mixture (Vavrik et al., 2001, 2002; Aurilio et al., 2005). The method is a systematic approach to blending aggregates that provide aggregate interlock as the backbone of the structure and a balanced continuous gradation with adequate packing based on Voids in Mineral Aggregate (VMA) to complete the mixture and ensure optimal asphalt binder content.
Figure 2-1. Determination of mix type
The Bailey method defines three types of mixes (i.e. fine-graded, coarse-graded and SMA) based on the volume of the coarse fraction (aggregate), as shown in Figure 2-1. Furthermore, it defines coarse aggregates as the large particles that, when placed in a unit volume, create voids, while fine aggregates are defined as the smaller particles that fill the voids created by the coarse aggregates.
Figure 2-2. Two-dimensional aggregate packing model
6

The “break” sieve between the coarse and fine fraction is defined as the Primary Control Sieve (PCS) which is estimated as the closest sieve to the result of 0.22 times the Nominal Maximum Particle Size (NMPS). This coefficient is an average ratio based on two and three-dimensional simulations of packing of spherical particles models similar to Figure 2-2. The suitable coarse aggregate structure (interlock) is selected as a design input by controlling the density of the coarse aggregate in the compacted mixture. Aggregate interlock will provide a rut-resistant mixture. Once the degree of interlock is chosen, the volume of voids within the coarse aggregate structure is determined to be filled with fine aggregates. To ensure that the mixture contains adequate asphalt binder, VMA is adjusted by changing the packing of the coarse and fine aggregates.
Aggregate packing of the combined gradation is further analyzed by breaking down the
gradation into three distinct portions each one evaluated individually. The coarse portion of the combined blend is from the largest particle to the PCS. The fine aggregate is broken down and evaluated into two portions using the same 0.22 factor which is applied to the PCS to determine the secondary control sieve (SCS). SCS divides coarse sand from fine sand. Fine sand is further evaluated by determining the tertiary control sieve (TCS), which is determined by multiplying the SCS nu the 0.22 factor. The use of the four principles and admissible values for the different ratios depend upon the type of gradation (fine, coarse or SMA). Figure 2-3 is an overview of the divisions in a continuous gradation.
Figure 2-3. Overview of the divisions in a continuous gradation
The analysis is done using ratios related to air voids and VMA that evaluate packing within each of the three portions of the combined gradation. The parameters can be expressed in the following equations:
CA ratio =% passing half sieve − % passing PCS
100 − %passing half sieve
(2-1)
7

FAc ratio =% passing SCS% passing PCS
(2-2)
FAf ratio =% passing TCS% passing SCS
(2-3)
The Bailey method is a good tool for evaluating volumetrics and compactability of the mix and provides a better understanding of relationship between aggregate gradation, mixture voids and VMA. The method recognizes the need to have large enough particles in contact with each other for optimal mixture performance. To achieve a suitable coarse aggregate structure, the method relies on coarse aggregate density as a measure of aggregate interlock; however, achieving a specified coarse aggregate density may not necessarily ensure a suitable aggregate structure. Coarse aggregates may not be proportioned properly so that they cannot result in an interactive network of particles in continuous contact. In such case, coarse aggregates may act independently of each other and not providing a proper network for resistance to deformation.
Although the method recognizes the importance of finer aggregates on aggregate
structure, their primary and only role is to fill the voids within the coarse aggregate structure leaving enough space for asphalt, as determined by VMA. Furthermore, the method does not provide a direct link between aggregate structure characteristics (gradation) and mixture performance.
2.4 DASR – IC model
Recently, a conceptual and theoretical approach to evaluate aggregate structure based on packing theory named Dominant Aggregate Size Ratio – Interstitial Component (DASR-IC) model was developed at University of Florida, as described below, which is promising in addressing coarse aggregates structure and interstitial volume. The DASR-IC model provides a framework for the design and modification of gradations to ensure that mixtures will have sufficient aggregate interlock to resist permanent deformation, as well as adequate durability and fracture resistance (Kim et al., 2006; Guarin, 2009; Greene et al., 2011). This method can be used both at a mix design phase to assess the potential field performance of an asphalt mixture or as a tool to evaluate existing asphalt mixtures based solely on its aggregate gradation characteristics.
According to the model, mixture behavior is influenced by two primary components:
DASR, the coarse aggregate that forms the structural interactive network of aggregate and resists shear; and IC, the combination of fine aggregate, binder, and air voids, which fills the Interstitial Volume (IV) within DASR and resists primarily tension and to a lesser extent, shear. DASR can be composed of one size or multiple contiguous sizes of coarse particles.
8

A
Figure 2-4. DASR – IC model. (A) Schematic representation of the DASR-IC model. (B) Mixture components of asphalt mixture
The composition can be determined by conducting particle interaction analysis based on packing theory. Particles larger than DASR will simply float in the DASR matrix and will not play a major role in the aggregate structure. On the other hand, particles finer than DASR are identified as the aggregates that do not interact with the coarser portion and fill the IV. Figure 2-4 (A) illustrates these concepts.
2.5 DASR Porosity
Kim et al., 2006 indicated that the porosity of DASR can be used as a criterion to ensure contact between DASR particles and provide adequate interlocking. Field and laboratory results clearly showed that DASR porosity can be used as an indicator of mixture resistance to permanent deformation (rutting). It is a well-known fact in soil mechanics that the porosity of granular materials should be no greater than 50 % for particles to have contact with each other (Lambe and Whitman, 1969). Porosity can be calculated for any single size, or any set of contiguous sieve sizes within a mixture, by assuming that a mixture has certain effective asphalt content and air voids for a given gradation and, therefore, VMA is comparable to the volume of voids in soil. Porosity can be calculated using the below equations.
VT(DASR) = VTM − VAGG>DASR (2-4)
VV(DASR) = VICagg + VMA (2-5)
ηDASR =VV(DASR)
VT(DASR)=
VICagg + VMAVTM − VAGG>DASR
(2-6)
9

where
ɳDASR = DASR porosity, VV (DASR) = volume of voids within DASR, VT (DASR) = total volume available for DASR particles, VICagg = volume of IC aggregates, VTM = total volume of mixture, and VAGG>DASR = volume of particles larger than DASR (Figure 2-4 (b)).
Based on research to date, DASR porosity should be between 38 to 48% to ensure good
aggregate interlock and increased rutting performance. DASR porosities between 48 to 52% represent mixtures with questionable aggregate interlock and are referred to as marginal DASR porosities.
2.6 Interstitial Volume
The IV bonds the coarse aggregate structure together, thereby providing resistance to tension, as well as a secondary structure to help DASR resist shear. IC characteristics and properties strongly influence asphalt mixture fracture energy and creep rate as well as how they change with aging. Consequently, IC strongly influences mixture cracking resistance. Therefore, IC should fill the IV, forming a secondary structure that helps resist deformation and fracture without disrupting the DASR structure.
Guarin, 2009 developed a new parameter, the Disruption Factor (DF), to characterize the volumetric distribution of the IC and to determine the potential of fine aggregates to disrupt the DASR structure. The DF was determined through a 3D packing analysis assuming spherical particles and single size cubical or hexagonal packing configuration and it is defined as the ratio of potentially disruptive particles over the volume of DASR voids. The disruptive IC particles may include a single particle size or a combination of two particle sizes depending on the packing arrangement (cubical or hexagonal, respectively). DF can be calculated using the following equation:
DF =Volume of potentially disruptive IC particles
Volume of DASR voids (2-7)
Studies have shown that mixtures with acceptable DASR criteria may or may not result in acceptable cracking performance, indicating that IC strongly influences fracture resistance (Chun et al., 2012). For this reason, the DASR-IC model has been expanded to include two additional parameters for more defined characterization of the IV. The structure of the IC aggregate is represented by the Fine Aggregate Ratio (FAR). FAR (the ratio between the coarse and fine portions of the IC) is an indicator of the relative coarseness of the IC particle distribution and is defined as the ratio of the coarse portion of the fine aggregate (CFA) and the fine portion of the fine aggregate (FFA). Specifically, CFA includes only the largest particle size of the IC while the FFA is the remaining finer portion of IC particles.
10

To characterize the binder distribution in the IV, the Effective Film Thickness (EFT) parameter was introduced. The parameter is associated with the durability of the mixture and its ductility and can be calculated using the effective volumetric properties of fine aggregate portion (i.e., passing 2.36 mm sieve size) of asphalt mixture using the following equation:
EFT(microns) =Vbe
SA ∙ WT ∙ PFAGG= �
Pb − �Abs100� ∙ PAGG
SA ∙ PFAGG ∙ Gb� × 1000 (2-8)
where
Vbe= effective volume of asphalt binder, SA = surface area of fine aggregate, WT = total weight of mixture, PFAGG = percent of fine aggregate by mass of total mixture, Pb = percent of asphalt content by mass of total mixture, Abs = absorption, PAGG = percent of aggregate by mass of total mixture, and Gb = specific gravity of asphalt binder.
Previous research indicated that by minimizing asphalt mixture’s creep rate while maintaining adequate fracture energy, cracking performance of asphalt mixture could be improved (Zhang et al., 2001; Roque et al., 2002). Chun et al. (2012) suggested that creep rate could be minimized by controlling the IC structure (FAR) and that fracture energy could be increased by ensuring adequate DF and EFT. Furthermore, they identified preliminary acceptable ranges of each parameter, based on both laboratory and field data for optimal mixture property performance in terms of rutting and cracking:
• DASR porosity: 38 – 52 % (48 – 52 % : marginal) • DF: 0.50 – 0.95 • EFT: 12.5 – 25.0 microns • FAR: 0.28 – 0.36
Chun et al. indicated that EFT, FAR, and the DF criteria can be used together to enhance the cracking resistance of asphalt mixtures. However, the current IC parameters (EFT and FAR) were identified and evaluated using limited field data, and therefore, may not fully characterize the interstitial volume, resulting in a need for further evaluation and possible modification of the IC criteria.
Numerous research projects have focused on characterizing aggregate structure and its relationship to mixture performance. In particular, several researchers have identified relationships between the primary coarse aggregate structure and mixture resistance to rutting
11

based on interactive coarse particles (e.g., density, contact length characteristics) while considering fine aggregates (generally smaller than 1.18 – 2.36 mm) as part of the mastic/matrix phase. However, research has shown that mixtures with acceptable rutting performance may or may not result in acceptable cracking performance; moreover, it’s been identified that the interstitial volume between the coarse aggregate structure may be a critical factor on mixture cracking performance and that having an adequate coarse aggregate structure may not be enough to accurately distinguish the cracking performance of asphalt mixture.
12

CHAPTER 3 MATERIALS AND LABORATORY MIXTURE TESTS
The DASR-IC model provides a framework of gradation-based parameters and associated criteria to characterize mixture structural characteristics and to link gradation and volumetric properties to field performance. The model uses (a) DASR porosity to ensure contact between larger particles within the mixture to provide suitable resistance to deformation, (b) DF to evaluate the degree of disruption of the IC on the DASR structure, (c) EFT to characterize binder distribution within the IV, and (d) FAR to estimate the relative coarseness of IC particles.
DASR porosity and DF criteria have been evaluated through a wide range of field and
laboratory test results. Therefore, as long as the asphalt mixture design meets both criteria, it will have adequate coarse aggregate interlocking undisrupted by fine aggregates, which will ensure good rutting performance. EFT and FAR parameters and associated criteria play an important role in cracking performance; however, past research evaluated these elements with limited data, leaving a need for validation and refinement. This need led to the design of an experimental testing plan that will provide the data necessary to identify ICs effect on the cracking performance of asphalt mixture.
3.1 Mix Design for Isolating and Evaluating IC Effects
Given that all DASR-IC components are interrelated, realistically isolating the IC effects was challenging. The DASR porosity governs the coarse aggregate structure, which also affects the sizes and distribution of IV. Therefore, in order to isolate IC and its effects on performance, it was necessary to design first the coarse aggregate structure with adequate interlocking and then vary the fine portion of the gradation. This can be done by fixing the DASR porosity and DF within the acceptable range, and then designing the IC gradation with varying EFT and FAR parameters.
This approach involved the design of mixture gradations that were not associated with
actual mixtures; however, any alternative approaches would have required changing the gradation of the coarse portion in order to maintain the proposed ranges of IC parameters. This adjustment would have altered the DASR porosity and the DF, and would have led to complicated testing results involving the effects of both DASR and IC. Furthermore, it should be noted that the existing ranges for IC parameters were established using varying DASR characteristics representing varied levels of coarseness, which implies that the IC parameter criteria are applicable for varied DASR characteristics, as long as the mixture meets all gradation-based criteria. Therefore, the proposed approach appeared to be viable for isolating IC and determining its effects on the cracking performance of asphalt mixtures.
In order to assess the reasonableness of this approach, a broad range of screenings
stockpile gradations obtained from the Florida Department of Transportation (FDOT) was analyzed to determine the effect of those gradations on the interstitial component of mixtures that are potentially produced with these screenings. Figures 3-1 and 3-2 present the screenings stockpile gradations for granite and limestone aggregates involved in this study, respectively. It appeared that the IC gradation range required for this research (see Section 2.4) can be obtained by using the broad range of screenings available.
13

Figure 3-1. The granite screenings stockpile gradations used in Florida
Figure 3-2. The limestone screenings stockpile gradations used in Florida
0102030405060708090
100%
Pas
sing
(Sieve Size)0.45
#200 #30 #16 #8 #4 9.5 12.5 19.0
0102030405060708090
100
% P
assi
ng
(Sieve Size)0.45
#200 #30 #16 #8 #4 9.5 12.5 19.0
14

3.2 Materials and Final Mix Designs
In order to obtain the data necessary to meet the objectives of this study, an experimental testing plan was developed, which includes a wide range of mixtures subjected to different conditioning levels. Two aggregate types widely used in the state of Florida for road construction and rehabilitation projects were used to produce mixtures for laboratory testing: Georgia granite and Florida oolitic limestone. Two binder types: an unmodified binder (PG 67-22) and a polymer-modified binder (PG 76-22) were included in the testing plan to evaluate the interactive effects of binder type and interstitial volume characteristics. All mixtures were fine dense-graded and were designed using the Superpave® system with 12.5 mm Nominal Maximum Aggregate Size gradations and traffic level C, which corresponds to 3–10 million Equivalent Single Axle Loads over 20 years.
The DASR-IC model was used to design the range of mixtures to be tested. Figure 3-3(A)
presents an illustration of the DASR structure and the interstitial volume (IV). As stated previously, although a wide range of laboratory and field data was used to evaluate the DASR structure (i.e., DASR porosity and the DF), the acceptable ranges of IV/IC properties (i.e., EFT and FAR) were determined based on limited data. Therefore, further investigation was conducted to evaluate IV characteristics (e.g., interstitial aggregates, asphalt distribution and air voids) and their effects on mixture properties, including fracture energy limit and rate of damage accumulation. Generally if the IV is filled with fine interstitial aggregates, the air voids are smaller, less interconnected and less permeable, which will result in stiffer and more brittle mixtures (Figure 3-3(B)). On the contrary, for coarse interstitial aggregates, the air voids are larger, more interconnected and more permeable resulting in mixtures that are less stiff and less brittle (Figure 3-3(C)). In this study, two levels of DASR porosity within the acceptable range (with one close to the lower bound and the other close to the higher bound) were selected for each aggregate type to provide adequate interlocking. For each DASR porosity level, the DF was kept within the acceptable range to avoid disruption of the coarse structure, and four interstitial aggregates gradations (IC 1 through IC 4) were developed to represent a broad range of IC coarseness as shown in Figure 3-4. This led to eight gradations per aggregate type, as presented in Figures 3-5 to 3-8.
15

Figure 3-3. General illustration of DASR structure and interstitial volume: (A) DASR structure;
(B) fine IC; and (C) coarse IC
DASRIV
Air Void Air
Void
(A)
(B) (C)
16

Figure 3-4. General illustration of variation in IC coarseness for each DASR structure
Figure 3-5. Gradation design of granite mixtures for DASR I (IC-1 to IC-4)
DF within the acceptable range
Coarse IC (IC 4)
Intermediate IC (IC 2, 3)
Fine IC (IC 1)
17

Figure 3-6. Gradation design of granite mixtures for DASR II (IC 1 to IC 4)
Figure 3-7. Gradation design of limestone mixtures for DASR I (IC 1 to IC 4)
18
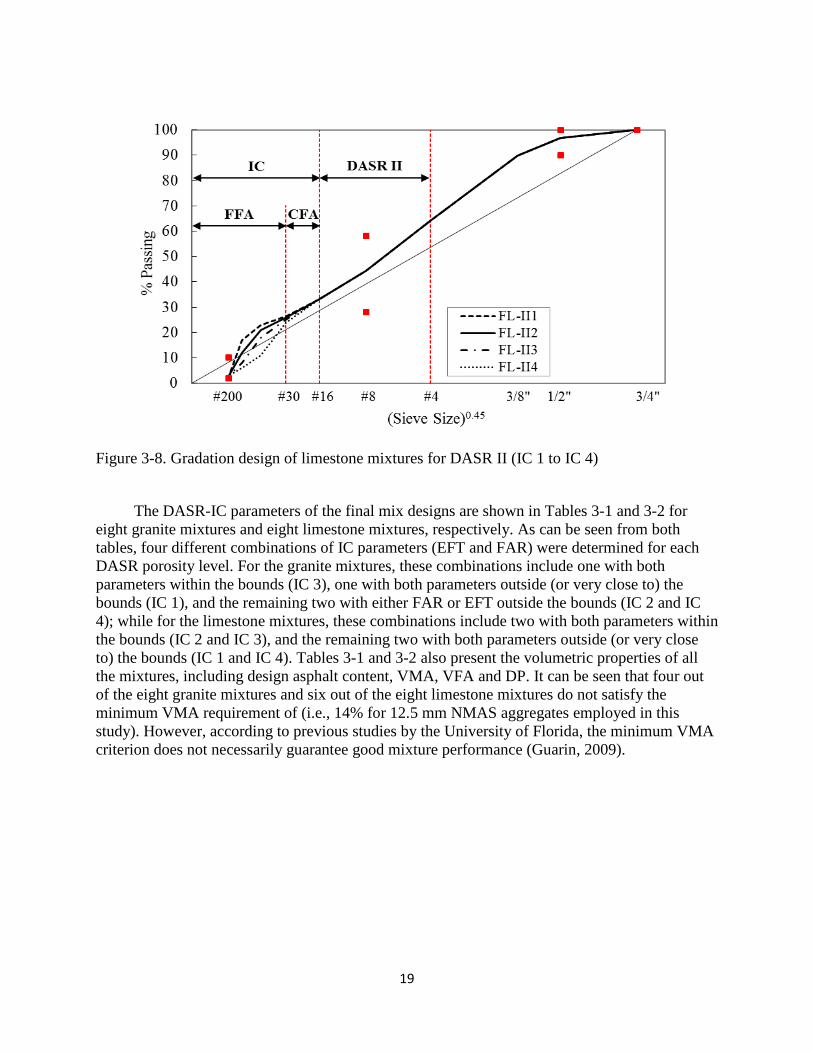
Figure 3-8. Gradation design of limestone mixtures for DASR II (IC 1 to IC 4)
The DASR-IC parameters of the final mix designs are shown in Tables 3-1 and 3-2 for
eight granite mixtures and eight limestone mixtures, respectively. As can be seen from both tables, four different combinations of IC parameters (EFT and FAR) were determined for each DASR porosity level. For the granite mixtures, these combinations include one with both parameters within the bounds (IC 3), one with both parameters outside (or very close to) the bounds (IC 1), and the remaining two with either FAR or EFT outside the bounds (IC 2 and IC 4); while for the limestone mixtures, these combinations include two with both parameters within the bounds (IC 2 and IC 3), and the remaining two with both parameters outside (or very close to) the bounds (IC 1 and IC 4). Tables 3-1 and 3-2 also present the volumetric properties of all the mixtures, including design asphalt content, VMA, VFA and DP. It can be seen that four out of the eight granite mixtures and six out of the eight limestone mixtures do not satisfy the minimum VMA requirement of (i.e., 14% for 12.5 mm NMAS aggregates employed in this study). However, according to previous studies by the University of Florida, the minimum VMA criterion does not necessarily guarantee good mixture performance (Guarin, 2009).
19

Table 3-1. DASR-IC parameters and volumetric properties for granite mixtures
Granite Acceptable ranges
DASR I (9.5 – 1.18 mm) DASR II (4.75 – 1.18 mm) IC 1 IC 2 IC 3 IC 4 IC 1 IC 2 IC 3 IC 4
Porosity (%) 38 - 48 41.0 42.3 42.4 42.5 43.6 44.6 45.2 45.2
DF 0.50 - 0.95 0.49 0.77 0.69 0.65 0.56 0.82 0.69 0.70 FAR 0.28 - 0.36 0.22 0.41 0.35 0.33 0.25 0.41 0.32 0.33
EFT (microns) 12.5 - 25 13.3 21.7 23.7 27.0 14.1 20.4 23.6 27.6 Pb (%) 4.5 4.8 5.4 5.8 4.8 4.9 5.3 5.7
VMA (%) 12.9 14.9 14.9 12.9 13.3 13.8 14.6 15.2 VFA (%) 69.0 73.2 73.2 69.0 69.9 71.0 72.6 73.7
DP 1.14 0.93 0.91 0.87 1.09 1.04 0.95 0.89
Table 3-2. DASR-IC parameters and volumetric properties for limestone mixtures
Limestone Acceptable ranges
DASR I (12.5 – 1.18 mm) DASR II (4.75 – 1.18 mm) IC 1 IC 2 IC 3 IC 4 IC 1 IC 2 IC 3 IC 4
Porosity (%) 38 - 48 40.2 41.2 41.7 42.4 45.3 45.8 46.4 47.1
DF 0.50 - 0.95 0.65 0.79 0.85 0.90 0.61 0.67 0.74 0.84 FAR 0.28 - 0.36 0.25 0.31 0.35 0.38 0.25 0.29 0.32 0.38
EFT (microns) 12.5 - 25 13.2 19.5 21.3 27.9 15.5 15.4 22.3 29.2 Pb (%) 5.7 5.9 6.0 6.9 6.1 5.7 6.6 7.3
VMA (%) 11.4 12.3 12.2 13.9 12.9 11.9 13.6 14.7 VFA (%) 65.0 67.5 67.3 71.3 69.1 66.4 70.6 72.7
DP 0.91 0.81 0.82 0.67 0.75 0.86 0.69 0.62
As stated previously, two binder types were adopted in this study. The optimal asphalt contents determined based on the unmodified binder for all sixteen gradations (see Figures 3-5 through 3-8) were employed to produce the other sixteen mixtures of the same gradations with the polymer-modified binder. As a result, a total of sixteen gradations and thirty-two mixtures were encompassed in this study. These thirty-two mixtures were subjected to three conditioning levels in order to evaluate the changes in fracture properties at different ages and to assess the relationship between IV characteristics, cracking performance, and conditioning level, including (a) Short Term Oven Aging (STOA), (b) Long Term Oven Aging (LTOA), and (c) A combination of LTOA and Cyclic Pore Pressure Conditioning (CPPC). STOA simulates the aging effects that occur during the mixing and construction processes. LTOA simulates the aging of mixtures subjected to in-situ conditions of approximately 5 to 10 years. LTOA plus CPPC was employed to simulate the combined effects of oxidative aging and repeated internal water pressure (Roque et al., 2012). More details regarding the conditioning procedures are presented in Section 3.5. Figure 3-9 shows the overall experimental testing plan of this study.
20

Figure 3-9. Experimental testing plan
3.3 Superpave IDT Tests
Superpave IDT tests were performed at 10 °C to obtain HMA fracture properties for each mixture at each conditioning level. The Superpave IDT is composed of a sequence of three tests (resilient modulus, creep compliance and strength tests), from which damage and fracture related mixture properties are determined, including resilient modulus, creep rate, and fracture energy. Resilient modulus is a measure of the stiffness of asphalt mixture; creep rate is the rate of change of the creep compliance curve at 1000 seconds, which has been shown in prior works to be related to the rate of damage accumulation of a mixture; fracture energy is the total energy necessary to induce fracture, and represents the tolerance of the mixture to fracture. Test procedure for Superpave IDT test is presented in this section. Test configuration of Superpave IDT test set-up is shown in Figure 3-10.
21

A B
Figure 3-10. Superpave IDT test. A) Specimen ready to be tested. B) Representation of Superpave IDT test set-up
3.3.1 Resilient Modulus Test
Resilient modulus test is a nondestructive test used to determine the resilient modulus (MR) of asphalt mixtures. Resilient modulus is defined as the ratio of the applied stress to the recoverable strain when repeated loads are applied. The test was performed according to the system developed by Roque et al. (1997) to determine the resilient modulus and Poisson’s ratio. A haversine waveform load is applied to the specimen for 0.1 second followed by a rest period of 0.9 second form a total of 5 cycles. The load is appropriately selected in order to keep the horizontal resilient deformations within the linear viscoelastic range (a typical range for horizontal deformations is 100 to 180 micro-inches). Figure 3-11 describes the haversine load applied and typical deformation response for a resilient modulus test.
Figure 3-11. Typical load, deformation versus time relationships in a repeated-load indirect
tension test
22

The resilient modulus and Poisson’s ratio can be calculated by the following equations, which were developed based on three-dimensional finite element analyses by Roque and Buttlar (1992). The equation is incorporated in the Superpave Indirect Tension Test at Low Temperatures (ITLT) computer program, which was developed by Roque et al. (1997).
MR =P × GL
∆H × t × D × Ccmpl (3-1)
ν = −0.1 + 1.480 × �XY�2
− 0.778 × �tD�2
× �XY�2
(3-2)
where
P = maximum load GL = gauge length ΔH = horizontal deformation t = thickness D = diameter Ccmpl = 0.6354 × (X Y⁄ )−1 − 0.332 ν = Poisson’s ratio (X Y⁄ ) = ratio of horizontal to vertical deformation
3.3.2 Creep test
Creep test is a nondestructive test used to determine the creep compliance and associated parameters. Creep compliance is defined as the ratio of the time-dependent strain over stress. Since it well represents the time-dependent behavior of asphalt concrete, it has been usually used to evaluate the rate of damage accumulation of asphalt mixture. Creep tests were performed in a load-controlled mode by applying a static load in the form of a step function to the specimen and then holding it for 1000 seconds. The magnitude of the load is appropriately selected in order to maintain the accumulated horizontal deformations in the linear viscoelastic range, which is below the total horizontal deformation of 750 micro-inches. During the first 100 seconds of test, a horizontal deformation of no greater than 100 to 130 micro-inches is generally considered to be acceptable to keep the maximum horizontal deformation below 750 micro-inches. As shown in Figure 3-12, D0, D1 and m-value are creep parameters obtained from the creep test. Although D1, and m-value are related to each other, D1 is more related to the early portion of the creep compliance curve, while m-value is more associated with the later portion of the creep compliance curve.
23

Figure 3-12. Power model of creep compliance
Creep properties of the mixtures were determined using the ITLT program by analyzing the load and deformation data. The program uses the following equations to complete creep compliance and Poisson’s ratio.
D(t) =∆H × t × D × Ccmpl
P × GL (3-3)
υ = −0.1 + 1.480 × �XY�2
− 0.778 × �tD�2
× �XY�2
(3-4)
where D(t) = creep compliance at time t (1/psi), ΔH, t, D, Ccmpl, GL, ν, P, and (X/Y) are same as described above.
3.3.3 Strength Test
Strength test is a destructive test used to determine the failure limits of the asphalt mixture, including tensile strength, failure strain, and fracture energy. These properties can be used to estimate the cracking resistance of the asphalt mixture. The test was performed in a displacement controlled mode by applying a constant rate of displacement of 50.8 mm/min until failure. Tensile strength can be calculated using the following equation:
St =2 × P × CSXπ × t × D
(3-5)
24

where St = maximum indirect tensile strength P = failure load at first crack CSX = 0.948 − 0.01114(t D⁄ ) − 0.2693υ + 1.436(t D⁄ )υ t = thickness D = diameter ν = Poisson’s ratio
From strength test and resilient modulus test, the following relationship can be developed:
MR =St
εf − ε0 → ε0 =
MRεf − StMR
(3-6)
Fracture energy (FE), which is the total energy applied to the specimen until it fractures, is determined as the area underneath the stress –strain curve until failure. Dissipated creep strain energy (DCSE) is the absorbed energy that damages the specimen, and dissipated creep strain energy to failure is the absorbed energy to fracture (DCSEf). Figure 3-13 indicates how to determine FE and DCSEf. The ITLT program calculates FE and DCSEf automatically.
Fracture Energy (FE) = � σ(ε)dεεf
0 (3-7)
Elastic Energy (EE) =12
St(εf − ε0) (3-8)
Dissipated Creep Strain Energy (DCSEf) = FE − EE (3-9)
where St = tensile strength εf = Failure strain
25

Figure 3-13. Determination of FE and DCSEf
The Energy Ratio (ER) parameter and associated criteria, developed based on a detailed analysis and evaluation of 22 field test sections in service for over 10 years throughout the State of Florida (Roque et al., 2004), were employed to evaluate performance of mixtures of this study. The ER parameter, defined as the ratio of dissipated creep strain energy limit (DCSEf) over the minimum dissipated creep strain energy (DCSEmin) required for good top-down cracking performance, is expressed in the following equation:
ER =DCSEf
DCSEmin=
A × DCSEfm2.98 × D1
(3-10)
A = 0.0299 × σ−3.10 × (6.36 − St) + 2.46 × 10⁻⁸ (3-11)
where σ = tensile stress in the asphalt layer (psi), St = tensile strength (MPa), DCSEf = is dissipated creep strain energy limit (kJ/m3), D1 = power law parameter from creep compliance test (1/psi) m = power law parameter from creep compliance test
26

3.4 Test Specimen Preparation
Specimens were prepared for laboratory testing using the materials described in the previous section. A total of 144 specimens, including three replicates for each set of Superpave IDT tests were produced according to the testing plan.
3.4.1 Batching and Mixing
The first step for specimen preparation was to batch 4500 g aggregates using the batching sheets included in Appendix B. Then, the batched aggregates and asphalt binder were heated in the oven at the mixing temperature (315°F for the PG 67-22 binder and 325°F for the PG 76-22 binder) for approximately three hours. Next, the aggregates and binder were mixed in the bucket until the aggregates were well coated with the binder. The mixed samples were then spread in pans and kept in an oven at the mixing temperature for two hours for STOA conditioning. The mixtures were stirred after one hour to obtain a uniformly aged sample.
3.4.2 Compaction
After the STOA conditioning procedure, the mixed samples were compacted using the Superpave Gyratory Compactor (SGC) with a compaction stress of 600 kPa and a gyratory angle of 1.25° at the mixing temperature. Even though the mixtures were designed to have a 4% air void content at Ndesign, the gyratory pills were compacted in the SGC to obtain a 7% air void content at the proper number of gyrations, which simulates the initial air voids (and density) typically achieved in the field. After letting the gyratory pills cool down at the room temperature, the bulk specific gravity (Gmb) of each pill was measured in accordance with AASHTO T166 procedure to determine the percent air voids. The target air void content of the gyratory pill was approximately 7.8 % because the air void content of the specimens after slicing (described subsequently) is approximately 0.5 – 1.0 % lower as compared to that of the pills.
3.4.3 Slicing and Gauge Points Attachment
Once the air void contents of compacted pills were properly checked and logged, all pills were sliced to obtain IDT test specimens of the desired thickness (approximately 1.5 inch). A masonry saw was used to slice specimens as shown in Figure 3-14(A). The, the sliced specimens were dried for 48 hours in a dehumidifier at room temperature before bulking. The bulk specific gravity (Gmb) of each IDT specimen was measured to make sure that the air void contents of the specimens was within the required range of 7.0% ± 0.5%.
Gage points were attached to both faces of the specimens using an epoxy adhesive, a steel
template, and a vacuum pump setup (see Figure 3-14(B)). Two pairs of gage points were placed on each face of the specimen at a distance of 19 mm (0.75 inch) from the center of the specimen along the vertical and horizontal axes, respectively.
27

A B
Figure 3-14. Laboratory equipment used for specimen preparation. A) Masonry saw. B) Vacuum pump setup for gage points attachment.
3.5 Conditioning Procedures
3.5.1 Heat Oxidation Conditioning
Oxidation is the reaction of oxygen molecules with asphalt binder and the rate of oxidation depends on the characteristics and amount of asphalt binder, accessibility to oxygen, and temperature. Asphalt pavements are continuously affected by oxidative aging during their service life, and the rheological properties of the asphalt binder are highly affected by oxidative aging. Heat oxidation is generally considered as a primary factor contributing to hardening or embrittlement of asphalt mixtures.
To simulate heat oxidation including short-term and long-term aging, standard Short-Term
Oven Aging (STOA) and Long-Term Oven Aging (LTOA) procedures were introduced under the Strategic Highway Research Program (SHRP) (Bell et al., 1994). STOA simulates the aging effects that occur during the mixing and construction process of asphalt mixtures. The current SHRP STOA process involves heating a loose mixture in a forced-draft oven for 2 hours at a temperature of 149-157°C. During the heating process, the loose mixture is spread in a pan and stirred after 1 hour to ensure uniform aging throughout. The LTOA process involves aging of compacted mixtures after the STOA procedure, and it simulates the additional aging of mixtures subjected to in situ conditions of approximately 5 to 10 years. LTOA requires a compacted sample (after STOA) to be placed in a forced-draft oven at 85 ± 2.8°C for 5 days (AASHTO R30).
3.5.2 Cyclic Pore Pressure Conditioning
The Cyclic Pore Pressure Conditioning (CPPC) system was developed at the University of Florida to induce damage in specimens due to combined effects of moisture and load (Birgisson et al., 2005; Isola et al., 2014). It was determined that CPPC can induce internal pressure (stress) in a tensile mode within the air voids that is similar to the effect of repeated load induced by traffic on mixtures in the field. Specifically, pore water under pressure in mixtures can cause
28

premature failure of hot-mix asphalt, through loss of adhesion between asphalt binder and aggregates (i.e. stripping of the asphalt film) or through loss of cohesion within the asphalt binder or mastic. The CPPC system is used for additional conditioning of asphalt mixtures after LTOA to simulate the effects of moisture and cyclic internal pressure on changes in mixture fracture properties after oxidative aging.
The structural core of the system is a triaxial cell modified for cyclic pore pressure
conditioning of asphalt specimens, which consists of two round stainless steel plates separated by posts or struts and encased with a Plexiglas cylinder. The triaxial chamber is connected with deaerated water supplier, pressure sensor, and pressurizer. Once sealed, the entire package creates an enclosed cavity capable of being pressurized. Figure 3-15 shows the tabletop triaxial chamber containing cut specimens for Superpave Indirect Tensile (IDT) tests. As can be seen, spacers were used in between specimens to facilitate water infiltration and to protect the gauge points from being damaged during the conditioning process.
Figure 3-15. Tabletop triaxial chamber
Prior to insertion in the chamber, the specimens were first subjected to a two-cycle saturation process. Each cycle included a 15-minute vacuum saturation period at 85.0 ± 7.0 kPa (12.3 ± 1.0 psi) followed by a 20-minute submergence period at atmospheric pressure. No specific saturation levels were targeted since each mixture has a unique void structure that may enhance or reduce its saturation capacity. The specimens were then placed into the tabletop triaxial chamber, carefully filled with deaerated water, and subjected to a combination of pore pressure cycles and temperature determined during previous research conducted at the University of Florida (Birgisson et al., 2005). Specifically, water pressure in a sine waveform at a frequency of 0.33 Hz and an amplitude of 69 kPa (10 psi), ranging from 34.5 to 172.5 kPa (5 to 25 psi), was applied for 5800 cycles at the room temperature, as indicated in Figure 3-16. Immediately after CPPC, specimens were kept in a water bath for two days at 10°C, the temperature used for Superpave IDT tests.
29

Figure 3-16. Sine wave form of cyclic pressure used for CPPC
0
5
10
15
20
25
30
0 5 10 15 20 25
Pres
sure
(psi
)
Time (s)
30

CHAPTER 4 TEST RESULTS
4.1 Introduction
All Superpave IDT data were reduced using the indirect tensile test at low temperature (ITLT) software to determine mixture properties. The data were analyzed to evaluate the effects of interstitial volume (IV) characteristics on mixture properties related to cracking performance. Mixture properties determined from the analysis include resilient modulus, creep rate, fracture energy, strength, dissipated creep strain energy (DCSE) and failure strain. Resilient modulus measures the elastic stiffness of the asphalt mixture. Creep rate is the rate of change of the creep compliance curve at 1000 seconds, which is related to the rate of damage accumulation of a mixture. Fracture energy (FE) represents the tolerance of the mixture to fracture. Failure strain is the maximum strain reached at failure and tensile strength is the maximum tensile stress at failure. Three different conditioning levels; short term oven aging (STOA), long term oven aging (LTOA) and a combination of LTOA and cyclic pore pressure (LTOA+CPPC) were used to provide relative comparisons of IV’s effect on the mixture properties and changes in mixture properties induced by oxidation and moisture. Additionally, comparisons were made to evaluate the effect modified binder had on the mixture properties at those three conditioning levels. Differences observed for the STOA condition provided the most direct effects of IC gradation and volumetric changes on mixture properties. LTOA provided information on the relative effects of IC gradation characteristics induced by oxidative aging. In earlier research conducted for FDOT, LTOA+CPPC was determined to most closely represent the effects of long term changes in properties observed in the field. Therefore, the overall effect of IV characteristics on cracking performance was based on mixture properties at LTOA+CPPC conditioning level using the Energy ratio (ER) parameter. The energy ratio factors both the fracture energy and the dissipated creep strain energy and is known to be a better predictor of cracking-related performance than any single mixture property.
4.2 Test Results
Figure 4-1 shows a cluster of bar charts that represent a complete set of fracture energy data for eight unmodified granite mixtures at all three conditioning levels. The chart is divided into two different porosity levels, the left side being DASR I and the right side DASR II. DASR I represents the lower porosity level while DASR II represent the higher porosity level. The average low and high porosity levels for the granite mixtures are 42% and 45% respectively while the average low and high porosity levels for the limestone mixtures are 41.5% and 46% respectively. For each DASR porosity level, a cluster of three data points, representing the three conditioning levels is presented in order of increasing IC coarseness. IC-1 cluster represents data for the finest IC gradation while the IC-4 cluster represents data for the coarsest IC gradation.
31

For clearer presentation, bar chart cluster results presented in Figure 4-1 will subsequently be presented in a simplified manner as shown in Figure 4-2, in which bar chart clusters were eliminated and replaced with single data points for each conditioning level for each of the four IC’s. common symbols were selected for each conditioning level and data points for each of the four IC’s were connected with a straight line, thereby making it visually clearer to evaluate changes in properties associated with different IC’s and conditioning level. It is emphasized that the lines are used as a matter of convenience and clarity and, of course, should not be interpreted as representing any type of relationship.
Figure 4-1. Typical data presentation using bar charts
0.00
2.00
4.00
6.00
8.00
10.00
12.00
IC-1 IC-2 IC-3 IC-4 IC-1 IC-2 IC-3 IC-4
FE (k
J/m
3 )
STOA LTOA LTOA+CPPC
ƞDASR = ~45%
DASR II
32

Figure 4-2. Typical data presentation using lines
4.3 General Effects of IV Characteristics
4.3.1 Introduction
Properties determined after short-term oven aging (STOA) conditioning provided the clearest opportunity to evaluate general effects of IV characteristics on the mixture properties, because properties determined after further conditioning (LTOA and/or CPPC) involve confounding effects of IV characteristics on resistance to oxidation and/or moisture. STOA simulates oxidative aging effects induced by production and placement.
4.3.2 Granite Mixtures with Unmodified Binder
Figures 4-3 and 4-4 show that for both DASR porosity levels, tensile strength decreased and failure strain increased as IC got coarser. As shown in Figure 4-5, the overall effect of these trends resulted in FE increasing as IC coarseness increased from IC-1 to IC-3, but then decreased for the coarsest IC-4. The increase in fracture energy is consistent with an increase in design binder as IC coarseness increased. The reversal of this trend for the coarsest IC indicates that other changes induced by increasing coarseness, which are having a negative effect on fracture energy, become more dominant than the beneficial effect of increasing binder content. Greater coarseness results in larger, more interconnected voids, as well as in changes in IC aggregate structure that cause IC aggregate and binder to behave more independently of each other. Both effects would lead to a reduction in fracture energy.
These trends are supported by the finite element analysis results presented in Chapter 5,
which showed that finer IC gradations resulted in higher internal stresses, which lead to lower fracture energy. The lower FE obtained for the finer IC gradations is very likely a result of the
0.00
2.00
4.00
6.00
8.00
10.00
12.00
FE (k
J/m
3 )
STOA LTOA LTOA+CPPC
IC1 IC2 IC3 IC4 IC1 IC2 IC3 IC4
33

combined effect of gradation and lower binder content. It is interesting to note that these effects are captured by the effective film thickness (EFT).
It is also interesting to note that fracture energy peaked for IC-3 at both DASR porosity
levels. IC-3 was the only one of the four IC gradations that met all the preliminary DASR-IC gradation criteria, including effective film thickness (EFT) and fine aggregate ratio (FAR). Therefore, these results appear to support the effectiveness of these criteria. However, final evaluation clearly cannot be made on the basis of a single property or without considering effects of oxidation and moisture
Figure 4-6 shows that resilient modulus decreased as IC got coarser. This was as expected
because the finer IC gradations have lower binder contents than the coarser IC gradations. The aggregate distribution of the finer IC’s result in aggregates that are in close proximity to each other and asphalt binder is more thinly distributed. This creates thin film effect, which induces confinement in the asphalt binder, resulting in a stiffer more brittle mixture. Conversely, coarser IC’s have aggregates that are more sparsely distributed and asphalt binder is more coarsely distributed within the aggregates. As a result the aggregates do not confine the binder as much, which makes the mixture less stiff and less brittle. A conceptual illustration of this concept is provided in a pictorial form in Chapter 3, Figure 3-3. Creep rate results shown in Figure 4-7 indicates that as the IC became coarser, the creep rate increased. This is consistent with the same arguments articulated for the observed trends in stiffness. After all, compliance is related to stiffness as longer loading times.
Figure 4-3. Strength of granite mixtures with unmodified binder at STOA
0.00
1.00
2.00
3.00
STR
ENG
TH (M
Pa)
ɳDASR = ~45%
DASR II
ɳDASR = ~42%
DASR I
IC1 IC2 IC3 IC4 IC1 IC2 IC3 IC4
34

Figure 4-4. Failure strain of granite mixtures with unmodified binder at STOA
Figure 4-5. Fracture energy of granite mixtures with unmodified binder at STOA
0.0
1000.0
2000.0
3000.0
4000.0
5000.0
6000.0FA
ILU
RE
STR
AIN
(με)
ɳDASR = ~45%
DASR II
IC1 IC2 IC3 IC4 IC1 IC2 IC3 IC4
0.00
2.00
4.00
6.00
8.00
10.00
FE (k
J/m
3 )
IC1 IC2 IC3 IC4 IC1 IC2 IC3 IC4
35

Figure 4-6. Resilient modulus of granite mixtures with unmodified binder at STOA
Figure 4-7. Creep rate of granite mixtures with unmodified binder at STOA
0.00
2.00
4.00
6.00
8.00
10.00
12.00M
R (G
Pa)
IC1 IC2 IC3 IC4 IC1 IC2 IC3 IC4
0.00E+00
1.00E-08
2.00E-08
3.00E-08
4.00E-08
5.00E-08
6.00E-08
CR
EEP
RAT
E (1
/psi
·sec
)
IC1 IC2 IC3 IC4 IC1 IC2 IC3 IC4
36

4.3.3 Granite Mixtures with Modified Binder
Figures 4-8 and 4-9 indicate the modified binder did not affect tensile strength and generally resulted in a modest increase in failure strain. The modest increase in failure strain was reflected in a modest increase in fracture energy as shown in Figure 4-10. Exceptions to the general trend were observed for two mixtures; IC-3 in DASR I and IC-1 in DASR II. However, effect of IC on failure limits was generally the same for both unmodified and modified mixtures. As IC became coarser fracture energy generally increased for both DASR porosity levels. As mentioned earlier, this effect is consistent with the fact that design asphalt increased as IC coarseness increased. An explanation for the slight reduction in FE observed for IC-4 in the DASR II mixtures was also provided earlier when discussing results for unmodified mixture. The effect was not observed in the DASR I mixture with modified binder.
Figure 4-11 shows that the modified binder had a relatively minor effect on the resilient
modulus. Furthermore, the effect of IC on MR was generally the same for unmodified and modified mixtures. This observation is consistent with earlier work by the researchers indicating that polymer modification has little effect on short loading time stiffness.
As shown in Figure 4-12, polymer modification consistently reduced creep rate for all
mixtures, which is also consistent with earlier work by the researchers. The reduction implies that modified mixtures have a lower rate of damage accumulation that when combined with equal or greater fracture energy results in better cracking performance.
The general observation that mixture stiffness decreased and compliance increased as IC
became coarser was explained in section 4.3.2.
Figure 4-8. Strength of modified and unmodified granite mixtures at STOA
0
1
2
3
STR
ENG
TH (M
Pa)
STOA_MOD STOA_UNMOD
IC1 IC2 IC3 IC4 IC1 IC2 IC3 IC4
37

Figure 4-9. Failure strain of modified and unmodified granite mixtures at STOA
Figure 4-10. Fracture energy of modified and unmodified granite mixtures at STOA
0
1000
2000
3000
4000
5000
6000
7000
8000
FAIL
UR
E ST
RAI
N (μ
ε)
STOA_MOD STOA_UNMOD
0.00
2.00
4.00
6.00
8.00
10.00
12.00
FE (k
J/m
3 )
STOA_MOD STOA_UNMOD
38

Figure 4-11. Resilient modulus of modified and unmodified granite mixtures at STOA
Figure 4-12. Creep rate of modified and unmodified granite mixtures at STOA
0
2
4
6
8
10
12
MR
(GPa
)
STOA_MOD STOA_UNMOD
0.00E+00
1.00E-08
2.00E-08
3.00E-08
4.00E-08
5.00E-08
6.00E-08
CR
EEP
RAT
E (1
/psi
·sec
)
STOA_MOD STOA_UNMOD
39

4.3.4 Limestone Mixtures with Unmodified Binder
Figure 4-13 shows limestone mixtures exhibited slightly higher tensile strengths than granite mixture, while Figure 4-14 and 4-15 show that limestone mixtures have much lower failure strain and fracture energy than granite mixtures. Furthermore, all three figures show that the effect of IC coarseness was greatly diminished for the limestone mixture as compared to granite mixtures. These effects can be explained by the fact that fracture typically occurs through the coarse aggregates of the limestone mixtures as opposed to through the mastic for the granite mixtures. This phenomenon is clearly visible in Figure 4-16, which shows photographs of failure surfaces for limestone and granite mixtures after testing in Superpave IDT. Failure through the aggregates observed in limestone mixtures results in lower failure strain and fracture energy due to the brittle nature of rock. Figure 4-17 also includes microscopic pictures of limestone and granite rock surfaces, which explains why the more porous nature of the limestone aggregate used in this study results in fracture through the rock while fracture in a similar granite mixture goes around the aggregate.
Results of the resilient modulus (Figure 4-18) indicated that effect of IC on limestone
mixtures was similar to observations for the granite mixtures; as IC became coarser, resilient modulus reduced. Figure 4-18 also shows that limestone mixtures had higher resilient modulus than the granite mixtures at all IC gradations. This may be explained by the fact that limestone aggregates have a much rougher surface texture and are more porous than granite aggregates as shown in Figure 4-18. Both characteristics increase stiffness and reduce compliance relative to smoother, less porous aggregate. So as expected, Figure 4-19 shows that an increase limestone mixtures exhibited much lower creep rate than granite mixtures at all IC gradations. Also, as IC became coarser, creep rate increased, although the effect of IC seemed less pronounced than for the granite mixtures.
Figure 4-13. Strength of limestone and granite mixtures with unmodified binder at STOA
0.00
0.50
1.00
1.50
2.00
2.50
3.00
STR
ENG
TH (M
Pa)
Limestone granite
ɳDASR = 41.5%
DASR I
40

Figure 4-14. Failure strain of limestone and granite mixtures with unmodified binder at STOA
Figure 4-15. Fracture energy of limestone and granite mixtures with unmodified binder at STOA
0.0
1000.0
2000.0
3000.0
4000.0
5000.0
6000.0FA
ILU
RE
STR
AIN
(με
)
limestone granite
IC1 IC2 IC3 IC4 IC1 IC2 IC3 IC4
0.00
2.00
4.00
6.00
8.00
10.00
FE (k
J/m
3)
limestone granite
41

Figure 4-16. Failure surface of limestone and granite mixture
Figure 4-17. A. Differences in surface texture. A) Granite aggregate. B) Limestone aggregate
Figure 4-18. Resilient modulus of limestone and granite mixtures with unmodified binder at
STOA
0.00
2.00
4.00
6.00
8.00
10.00
12.00
MR
(GPa
)
limestone granite
42

Figure 4-19. Creep rate of limestone and granite mixtures with unmodified binder at STOA
4.3.5 Limestone Mixtures with Modified Binder
Comparison of modified limestone mixture to modified granite mixture results revealed similar trends as for unmodified mixtures. Figures 4-20 to 4-22 show that strength of modified limestone mixture was slightly higher and failure strain and fracture energy were lower than modified granite mixtures. As with unmodified mixture, the failure limits appeared to be dominated by properties of the limestone aggregate because fracture went through the coarse limestone aggregate. Note that fairly little difference in failure limits was observed among aggregate types for the finest IC-1. Mixture gets more brittle as IC gets finer, and it appears that IC-1 was nearly as brittle as the limestone aggregate.
Figure 4-23 shows that modification appeared to increase fracture energy of only the finer
ICs (IC-1 and IC-2 for DASR I, and IC-1 for DASR II) but had no influence on fracture energy on coarser IC’s. Negligible effects of modified binder were expected because of the dominant effect of the limestone aggregate, whereas the positive effect of the modified binder for the finest IC is less clear. It appears that in the resulting mixture, specifically at the lower DASR porosity, the modified binder is able to redistribute local stresses to enhance fracture energy.
Figures 4-24 and 4-25 show that trends of modified granite and modified limestone
mixtures were also similar for resilient modulus and creep rate. Resilient modulus was higher and creep rate was lower for the modified limestone mixture than for the modified granite mixture. As explained earlier, this can be explained by differences in surface roughness and porosity of the aggregates. Figure 4-26 shows modified asphalt reduced creep rate of limestone mixtures, as expected.
0.00E+00
1.00E-08
2.00E-08
3.00E-08
4.00E-08
5.00E-08
6.00E-08
CR
EEP
RAT
E (1
/psi
·sec
)
limestone granite
43

Figure 4-20. Strength of limestone and granite mixtures with modified binder at STOA
Figure 4-21. Failure strain of limestone and granite mixtures with modified binder at STOA
0
0.5
1
1.5
2
2.5
3
STR
ENG
TH (M
Pa)
limestone granite
0
1000
2000
3000
4000
5000
6000
7000
8000
FAIL
UR
E ST
RAI
N (μ
ε)
limestone granite
44

Figure 4-22. Fracture energy of limestone and granite mixtures with modified binder at STOA
Figure 4-23. Fracture energy of modified and unmodified limestone mixtures at STOA
0.00
2.00
4.00
6.00
8.00
10.00
12.00
FE (k
J/m
3 )
limestone granite
0
2
4
6
8
10
12
FE (k
J/m
3 )
MOD_STOA UNMOD_STOA
45

Figure 4-24. Resilient modulus of limestone and granite mixtures with modified binder at STOA
Figure 4-25. Creep rate of limestone and granite mixtures with modified binder at STOA
0
2
4
6
8
10
12
MR
(GPa
)
limestone granite
0.00E+00
1.00E-08
2.00E-08
3.00E-08
4.00E-08
5.00E-08
6.00E-08
CR
EEP
RAT
E (1
/psi
·sec
)
limestone granite
46

Figure 4-26. Creep rate of modified and unmodified limestone mixtures at STOA
4.4 Effect of IV Characteristics on Resistance to Oxidative Aging
4.4.1 Introduction
Properties determined after long term oven aging (LTOA) conditioning allowed for evaluation of effects of IV characteristics on resistance to oxidative aging. This level of conditioning attempts to simulate oxidative aging effects induced during the service of the asphalt. In earlier research performed for FDOT, UF researchers showed that oxidative aging alone does not adequately simulate all aging effect occurring in real field pavement. Consequently, LTOA evaluation was limited to effects on oxidation and not cracking performance. Effects of IV characteristics on cracking performance was restricted to properties obtained after conditioning using both LTOA and cyclic pore pressure conditioning (CPPC), which was determined to better simulate all aging effects in field pavement.
4.4.2 Granite Mixtures with Unmodified Binder
Figure 4-27 and 4-28 show that oxidative aging increased the strength but reduced the failure strain for all mixtures. This resulted in a reduction in fracture energy for all IC gradations as shown in Figure 4-29. LTOA embrittles and stiffens the granite mixtures which lowers the failure strain and reduces the FE. However, reduction of FE was relatively small for the coarsest IC-4 for both DASR porosity levels. IC-4 for both DASR porosity levels had the highest asphalt content, which is reflected in the relatively high effective film thickness (EFT) values presented in Table 3-1. In addition to the higher asphalt content and EFT, asphalt is more coarsely
0.00E+00
1.00E-08
2.00E-08
3.00E-08
4.00E-08
5.00E-08
6.00E-08
CR
EEP
RAT
E (1
/psi
·sec
)
MOD_STOA UNMOD_STOA
47

distributed among coarser gradations, which also makes it less accessible to oxidation. These characteristics appeared to have reduced oxidation so that greater fracture tolerance was retained. Figures 4-27 and 4-28 also show that as IC got coarser, the failure strain increased while the strength remained unaffected. As expected, FE increased with increasing IC coarseness at the LTOA condition. As expected, Figures 4-30 and 4-31 show that oxidative aging increased the resilient modulus and reduced creep rate for all mixtures. Also, the figures show the general effects of IC coarseness on MR and creep rate was the same as that observed for STOA condition. As IC got coarser the resilient modulus decreased while creep rate increased. Explanations for these trends articulated for the STOA condition in section 4.3.2, also apply for the LTOA results.
Figure 4-27. Effect of oxidation on strength for granite mixtures with unmodified binder
0.00
0.50
1.00
1.50
2.00
2.50
3.00
STR
ENG
TH (M
Pa)
STOA LTOA
48

Figure 4-28. Effect of oxidation on failure strain for granite mixtures with unmodified binder
Figure 4-29. Effect of oxidation on FE for granite mixtures with unmodified binder
0.0
1000.0
2000.0
3000.0
4000.0
5000.0
6000.0
FAIL
UR
E ST
RAI
N (μ
ε)
STOA LTOA
0.00
2.00
4.00
6.00
8.00
10.00
FE (k
J/m
3 )
STOA LTOA
49

Figure 4-30. Effect of oxidation on MR for granite mixtures with unmodified binder
Figure 4-31. Effect of oxidation on creep rate for granite mixtures with unmodified binder
0.00
4.00
8.00
12.00
16.00M
R (G
Pa)
STOA LTOA
0.00E+00
1.00E-08
2.00E-08
3.00E-08
4.00E-08
5.00E-08
6.00E-08
CR
EEP
RAT
E (1
/psi
·sec
)
STOA LTOA
50

4.4.3 Granite Mixtures with Modified Binder at LTOA
Figures 4-32 and 4-33 show oxidative aging generally increased tensile strength and reduced failure strain for all IC gradations. Figure 4-34 shows the overall effect was a reduction in fracture energy for all mixtures except IC-1 and IC-4 at DASR II, which exhibited a slight increase in fracture energy after LTOA. Combined effects of modification and oxidation appeared to have different effects for the two DASR porosity levels. This is further illustrated in Figure 4-35, which shows modification had relatively little effect on fracture energy at the lower DASR I porosity, but had a greater positive effect on fracture energy at the higher DASR II porosity. It is known that introduction of elastomeric polymers or rubber in binder generally reduces rate of oxidation. Rate of oxidation is also affected by the manner in which asphalt is distributed throughout the mixture, as well as by characteristics of air void distribution. The fact is there is a complex series of interactive variables associated with combined effects of modifiers and oxidation, particularly as they affect tensile failure limits of asphalt mixture. This may explain the somewhat variable results in tensile failure limits for the broad range in variables involved in this experiment. In the end, fracture energy generally increased as the IC coarseness increased.
Effects of modifier and oxidation on stiffness and compliance are much more
straightforward, which is reflected in results of resilient modulus and creep rate presented in Figures 4-36 to 4-38. As expected, for both DASR porosity levels and IC’s, resilient modulus increased (Figure 4-36), while creep rate decreased (Figure 4-37) after LTOA. In addition, modified binder resulted in the expected reduction in creep rate for all mixtures (Figure 4-38). Finally, all three figures show that for both porosity levels resilient modulus decreased and creep rate increased as IC got coarser. This trend was consistently observed for all experiments performed in this study.
Figure 4-32. Effect of oxidation on strength of granite mixtures with modified binder
0
0.5
1
1.5
2
2.5
3
STR
ENG
TH (M
Pa)
STOA LTOA
51

Figure 4-33. Effect of oxidation on failure strain of granite mixtures with modified binder
Figure 4-34. Effect of oxidation on FE for granite mixtures with modified binder
0
1000
2000
3000
4000
5000
6000
7000
8000FA
ILU
RE
STR
AIN
(με)
STOA LTOA
0.00
2.00
4.00
6.00
8.00
10.00
12.00
FE (k
J/m
3 )
STOA LTOA
52

Figure 4-35. Effect of modified binder on FE for granite mixtures with modified binder at LTOA
Figure 4-36. Effect of oxidation on MR for granite mixtures with modified binder
0.00
2.00
4.00
6.00
8.00
10.00
FE (k
J/m
3 )
MOD UNMOD
0
2
4
6
8
10
12
MR
(GPa
)
STOA LTOA
53

Figure 4-37. Effect of oxidation on creep for granite mixtures with modified binder
Figure 4-38. Effect of modified binder on creep rate for granite mixtures at LTOA
0.00E+00
1.00E-08
2.00E-08
3.00E-08
4.00E-08
5.00E-08
6.00E-08C
REE
P R
ATE
(1/p
si·s
ec)
STOA LTOA
0.00E+00
1.00E-08
2.00E-08
3.00E-08
4.00E-08
5.00E-08
6.00E-08
CR
EEP
RAT
E (1
/psi
·sec
)
MOD UNMOD
54

4.4.4 Limestone Mixtures with Unmodified Binder at LTOA
Figure 4-39 shows that except for the finest IC-1 at the lower porosity level DASR I, LTOA had little effect on mixture tensile strength. This is consistent with the fact that limestone mixtures broke through the aggregate, so tensile strength was relatively unaffected by changes in binder properties. Results presented in Figure 4-40 show that failure strains of the higher DASR II porosity mixtures appeared to decrease more after LTOA than the lower DASR I porosity mixtures. This effect was also clearly reflected in the fracture energy data presented in Figure 4-41. These results appear to indicate that higher DASR porosity mixtures may have more interconnected void structures, thereby allowing for easier access to air and greater oxidation. This effect was also observed for the granite mixtures (see Figure 4-29).
It is interesting and important to note that tensile strain and fracture energy were affected
by changes in binder properties induced by LTOA, while tensile strength was relatively unaffected. While maximum stress at failure (strength) is dictated by the limestone rock, the strain at which fracture initiates is dictated by binder. In other words, fracture initiates in the binder then propagates through the rock.
Figures 4-39 to 4-41 also show that the effect of IC on failure limits was desensitized after
LTOA. All three failure limits (tensile strength, failure strain, and fracture energy) were about the same for all ICs at both DASR porosity levels after LTOA.
As expected, Figure 4-42 shows that LTOA increased resilient modulus of all mixtures.
The effect of oxidative aging was generally more pronounced for the higher DASR II porosity mixtures, which is consistent with observations made for failure strain and fracture energy. Figure 4-43 shows that LTOA uniformly reduced creep rate of all mixtures. Interestingly, effects of LTOA on creep rate were not more pronounced for the higher DASR II mixtures. IC coarseness did not appear to have an effect on how oxidative aging affected modulus or creep rate.
Direct comparisons of fracture energy and creep rate after LTOA between granite and
limestone mixtures are presented in Figures 4-44 and 4-45. Figure 4-44 shows fracture energy clearly increases as IC gets coarser in granite mixtures at both DASR porosity levels, while it remains about the same for the limestone mixtures. It appears the granite mixture is able to take advantage of the effects of higher binder content and effective film thickness resulting from coarser IC. On the other hand, limestone mixture fracture is overwhelmed by the coarser limestone aggregates, which limits the overall fracture energy. Figure 4-45 shows creep rate generally increases as IC coarseness increases in both granite and limestone mixtures, but creep rate is much lower for limestone mixtures at both DASR porosity levels. As explained earlier, this effect can be attributed to the rougher more porous nature of the limestone aggregate.
55

Figure 4-39. Effect of oxidation on strength for limestone mixtures with unmodified binder
Figure 4-40. Effect of oxidation on failure strain for limestone mixtures with unmodified binder
0.00
0.50
1.00
1.50
2.00
2.50
3.00
STR
ENG
TH (M
Pa)
STOA LTOA
0.0
1000.0
2000.0
3000.0
4000.0
5000.0
6000.0
FAIL
UR
E ST
RAI
N (μ
ε)
STOA LTOA
56

Figure 4-41. Effect of oxidation on FE for limestone mixtures with unmodified binder
Figure 4-42. Effect of oxidation on MR for limestone mixtures with unmodified binder
0.00
2.00
4.00
6.00
8.00
10.00
FE (k
J/m
3 )
STOA LTOA
0.00
2.00
4.00
6.00
8.00
10.00
12.00
14.00
MR
(GPa
)
STOA LTOA
57

Figure 4-43. Effect of oxidation on creep rate for limestone mixtures with unmodified binder
Figure 4-44. Fracture energy of limestone and granite mixtures with unmodified binder at LTOA
0.00E+00
5.00E-09
1.00E-08
1.50E-08
2.00E-08
2.50E-08
3.00E-08
CR
EEP
RAT
E (1
/psi
·sec
)
STOA LTOA
0.00
2.00
4.00
6.00
8.00
10.00
FE (k
J/m
3 )
limestone granite
58

Figure 4-45. Creep rate of limestone and granite mixtures with unmodified binder at LTOA
4.4.5 Limestone Mixtures with Modified Binder at LTOA
Figure 4-46 and 4-47 show oxidative aging generally increased tensile strength and reduced failure strain for all IC’s except the finest IC-1 at the lower DASR I porosity level, for which strength slightly decreased but failure strain exhibited the greatest reduction. LTOA resulted in an overall reduction in fracture energy for all IC’s at both DASR porosity levels (Figure 4-48). As was observed for the granite mixtures, combined effects of modification and oxidation appeared to have different effects for the two DASR porosity levels. This is further illustrated in Figure 4-49, which shows modification had relatively little effect on fracture energy at the lower DASR I porosity level, but had a more consistent positive effect at the higher DASR II porosity. This is similar to observations made for the granite mixtures. As explained in section 4.4.3, there is a complex series of interactive variables associated with combined effects of modifier and oxidation for mixtures with different binder distribution and void structure characteristics. Regardless, results presented in Figure 4-48 indicate fracture energy after LTOA generally increased as IC coarseness increased for both DASR porosity levels.
Effects of modifier and oxidation on stiffness and compliance are much more
straightforward, which is reflected in results of resilient modulus and creep rate presented in Figures 4-50 to 4-52. As expected, for all IC’s at both DASR porosity levels, resilient modulus increased (Figure 4-50) while creep rate decreased (Figure 4-51) after LTOA. In addition, modified binder resulted in the expected reduction in creep rate for all mixtures (Figure 4-52). Finally, all three figures show that for both porosity levels resilient modulus generally decreased and creep rate generally increased as IC got coarser.
0.00E+00
1.00E-08
2.00E-08
3.00E-08
4.00E-08
5.00E-08
6.00E-08
CR
EEP
RAT
E (1
/psi
·sec
)
limestone granite
59

Direct comparisons of fracture energy and creep rate after LTOA between modified granite and modified limestone mixtures are presented in Figures 4-53 and 4-54. Figure 4-53 shows fracture energy clearly increases as IC gets coarser in granite mixtures at both DASR porosity levels, while the increase for the limestone mixtures is less pronounced. As explained earlier, limestone mixture fracture is predominantly controlled by the coarser limestone aggregates, which limit overall fracture energy, regardless of binder content or IC characteristics. Figure 4-54 shows creep rate generally increases as IC coarseness increases in both granite and limestone mixtures, but creep rate is much lower for limestone mixtures at both DASR porosity levels. As explained earlier, this effect can be attributed to the rougher more porous nature of the limestone aggregate
Figure 4-46. Effect of oxidation on strength for limestone mixtures with modified binder
0
0.5
1
1.5
2
2.5
3
STR
ENG
TH (M
Pa)
STOA LTOA
60

Figure 4-47. Effect of oxidation on failure strain for limestone mixtures with modified binder
Figure 4-48. Effect of oxidation on FE for limestone mixtures with modified binder
0
1000
2000
3000
4000
5000
6000
FAIL
UR
E ST
RAI
N (μ
ε)
STOA LTOA
0.00
2.00
4.00
6.00
8.00
10.00
FE (k
J/m
3 )
STOA LTOA
61

Figure 4-49. Effect of modified binder on fracture energy for limestone mixtures at LTOA
Figure 4-50. Effect of oxidation on MR for limestone mixtures with modified binder
0.001.002.003.004.005.006.007.008.009.00
10.00
FE (k
J/m
3 )
MOD UNMOD
0
2
4
6
8
10
12
14
16
MR
(GPa
)
STOA LTOA
62

Figure 4-51. Effect of oxidation on creep rate for limestone mixtures with modified binder
Figure 4-52. Effect of modified binder on creep rate for limestone mixtures at LTOA
0.00E+00
1.00E-08
2.00E-08
3.00E-08
CR
EEP
RAT
E (1
/psi
·sec
)
STOA LTOA
0.00E+00
5.00E-09
1.00E-08
1.50E-08
2.00E-08
2.50E-08
3.00E-08
CR
EEP
RAT
E (1
/psi
·sec
)
MOD UNMOD
63

Figure 4-53. Fracture energy of limestone and granite mixtures with modified binder at LTOA
Figure 4-54. Creep rate of limestone and granite mixtures with modified binder at LTOA
0.00
2.00
4.00
6.00
8.00
10.00FE
(kJ/
m3 )
limestone granite
0.00E+00
1.00E-08
2.00E-08
3.00E-08
CR
EEP
RAT
E (1
/psi
·sec
)
limestone granite
64

4.5 Effect of IV Characteristics on Resistance to Oxidation and Moisture Damage
4.5.1 Introduction
Based on a previous FDOT-sponsored study conducted at University of Florida, it was found that the combination of oxidative aging and cyclic pore water pressure (i.e., LTOA+CPPC) is a viable approach to simulate mixture property changes to levels observed in the field. For this reason, properties determined after LTOA+CPPC conditioning procedure provided the clearest opportunity to evaluate the effects of IV characteristics on mixture durability (i.e., changes in mixture fracture properties with time). Furthermore, properties obtained after LTOA+CPPC conditioning are most appropriate for relative performance evaluation and will be used for this purpose in section 4.6.
However, prior to discussing effects of CPPC moisture conditioning, it is important to
recognize that specimens tested after LTOA+CPPC contain moisture, while specimens tested after STOA and LTOA are completely dry. It is well known that moisture induces pore pressures that affect stiffness of asphalt mixture (positive pore pressures reduce stiffness while negative pore pressures increase stiffness). Negative pore pressures are inherent to partially saturated mixture, and their magnitude is affected by void level, void structure, and degree of saturation. Positive and/or negative pore pressures also develop as a result of rapid loading conditions such as that associated with resilient modulus tests. Their magnitude is affected by stress state as well as by void level, void structure, and degree of saturation. Clearly, effects of pore pressures on stiffness related properties are mixture dependent.
The discussion presented above clearly indicates that resilient modulus and creep rate
results after LTOA+CPPC are not directly comparable to resilient modulus and creep rate results after STOA and LTOA. Therefore, although resilient modulus and creep rate results for STOA, LTOA, and LTOA+CPPC conditions are presented together throughout this section, they are not meant to be compared to each other. Instead, the reason for presenting these results together is to compare the relative effects of IC characteristics among the three conditioning levels. These types of comparisons may make it possible to infer differences in void structure among mixtures with different IC coarseness and DASR porosity levels.
4.5.2 Granite Mixtures with Unmodified Binder at LTOA+CPPC
Figures 4-55 and 4-56 show that moisture conditioning by LTOA+CPPC generally reduced tensile strength and failure strain for all IC’s and both DASR porosity levels. Figure 4-57 shows the overall effect was to reduce FE of all mixtures, indicating that CPPC caused permanent damage in granite mixtures. The largest reduction in FE caused by CPPC was for the coarsest IC-4. It appears the larger more interconnected void structure of the coarser IC allows for greater water penetration and damage even though the coarser IC has higher binder content. It is important to note that for both DASR porosity levels, FE increased as IC coarseness increased from IC-1 to IC-3, but then decreased for the coarsest IC-4. Apparently, the negative effects of larger more interconnected voids overwhelmed the positive effect of increasing binder content for IC-4. Interestingly, IC-3 resulted in the highest FE after LTOA+CPPC for both porosity levels. Furthermore, IC-3 was the only one of the IC gradations evaluated that met all preliminary DASR-IC gradation criteria.
65

Figure 4-58 shows resilient modulus values after LTOA+CPPC conditioning decreased
more for the finer IC-1 and IC-2 mixtures than for the coarser IC-3 and IC-4 mixtures for both DASR porosity levels. The effect was more pronounced for the lower DASR I porosity mixtures. Reduction in modulus after LTOA+CPPC is a result of either micro-damage induced by CPPC or effect of positive pore pressure development during loading. Given that relatively larger damage was observed in the form of reduced fracture energy for the coarser IC-4 mixture (Figure 4-57), it appears more likely that the effect is pore pressure related. This explanation also makes sense because finer IC mixtures have finer pore structure that is more conducive to pore-pressure development during rapid loading.
Figure 4-59 shows a relative increase in creep rate for the finest IC-1 mixture at the lower
DASR porosity level and a relative decrease in creep rate for the coarsest IC-4 mixture at the higher DASR porosity level. Relative changes in creep rate result from either relative differences in micro-damage or differences in negative pore pressure. For creep tests, which involve a static load, pore pressure effects are primarily a result of inherent negative pore pressures that are a function of void level, void structure and degree of saturation. Higher creep rate implies lower negative pore pressures. Therefore, the higher creep rate observed for IC-1 at DASR I is either a result of greater micro-damage induced by CPPC or because its pore structure is such that negative pore pressure do not develop to the same level as for the coarser IC’s. Given that fracture energy results (Figure 4-57) showed IC-1 appeared to have induced less micro-damage (reduction in fracture energy was less than for coarser IC’s), it appears more likely that the effect is pore pressure related. The lower creep rate observed for IC-4 at DASR II is either a result of lower micro-damage induced by CPPC or because its pore structure is such that higher negative pore pressures develop. Once again, the likely effect is pore pressure related because this coarser IC-4 mixture exhibited more micro-damage after CPPC (Figure 4-57).
The results presented above indicate that interstitial component characteristics result in
significantly different pore structure for mixtures with the same air void content. These differences appear to affect mixture’s resistance to moisture damage, where mixtures with the coarsest IC’s were most susceptible. The pore structure also affects pore pressures when moisture is present, which can make data interpretation difficult. These observations indicate the need to revisit standardization of mixture testing and evaluation accounting for moisture effects.
66

Figure 4-55. Moisture effect on strength for granite mixtures with unmodified binder
Figure 4-56. Moisture effect on failure strain for granite mixtures with unmodified binder
0.00
0.50
1.00
1.50
2.00
2.50
3.00ST
REN
GTH
(MPa
)
STOA LTOA LTOA+CPPC
0.0
1000.0
2000.0
3000.0
4000.0
5000.0
6000.0
FAIL
UR
E ST
RAI
N (μ
ε)
STOA LTOA LTOA+CPPC
67

Figure 4-57. Moisture effect on fracture energy for granite mixtures with unmodified binder
Figure 4-58. Moisture effect on resilient modulus for granite mixtures with unmodified binder
0.00
2.00
4.00
6.00
8.00
10.00
FE (k
J/m
3 )
STOA LTOA LTOA+CPPC
0.00
4.00
8.00
12.00
16.00
MR
(GPa
)
STOA LTOA LTOA+CPPC
68

Figure 4-59. Moisture effect on creep rate for granite mixtures with unmodified binder
4.5.3 Granite Mixtures with Modified Binder at LTOA+CPPC
Figure 4-60 and 4-61 show that moisture conditioning by LTOA+CPPC generally reduced tensile strength and failure strain for all IC’s and both DASR porosity levels. Figure 4-62 shows that except for the coarsest IC-4 at DASR I, the overall effect of LTOA+CPPC was to reduce FE of all mixtures, indicating LTOA+CPPC caused permanent damage in granite mixtures, even when modifier was introduced. The reduction in FE was greater for the higher DASR II mixtures. The general trend observed throughout most of this study of increasing FE as IC coarseness increased was clear for the DASR I mixtures, but not as definitive for the DASR II mixtures.
Figure 4-63 shows modifier had relatively little effect on fracture energy of the three finer
IC mixtures at DASR I, but significantly increased fracture energy of the coarsest IC-4 mixture. Interestingly, the fracture energy of the DASR II mixtures exhibited a modest improvement for all but IC-3. Overall, modifier improved mixture resistance to moisture damage as reflected by loss in fracture energy after LTOA+CPPC.
Figure 4-64 and 4-65 show that resilient modulus and creep rate were relatively unaffected
by moisture conditioning in modified mixtures. Minor differences in trends may be attributed to differences in pore pressure effects discussed earlier.
Figure 4-66 shows modifier uniformly reduced creep rate of all IC’s for the lower DASR I
porosity mixtures, but had relatively little effect on creep rate of the higher DASR II mixtures. However, note that DASR II mixtures had low creep rate after LTOA+CPPC even without modifier.
0.00E+00
1.00E-08
2.00E-08
3.00E-08
4.00E-08
5.00E-08
6.00E-08
CR
EEP
RAT
E (1
/psi
·sec
)
STOA LTOA LTOA+CPPC
69
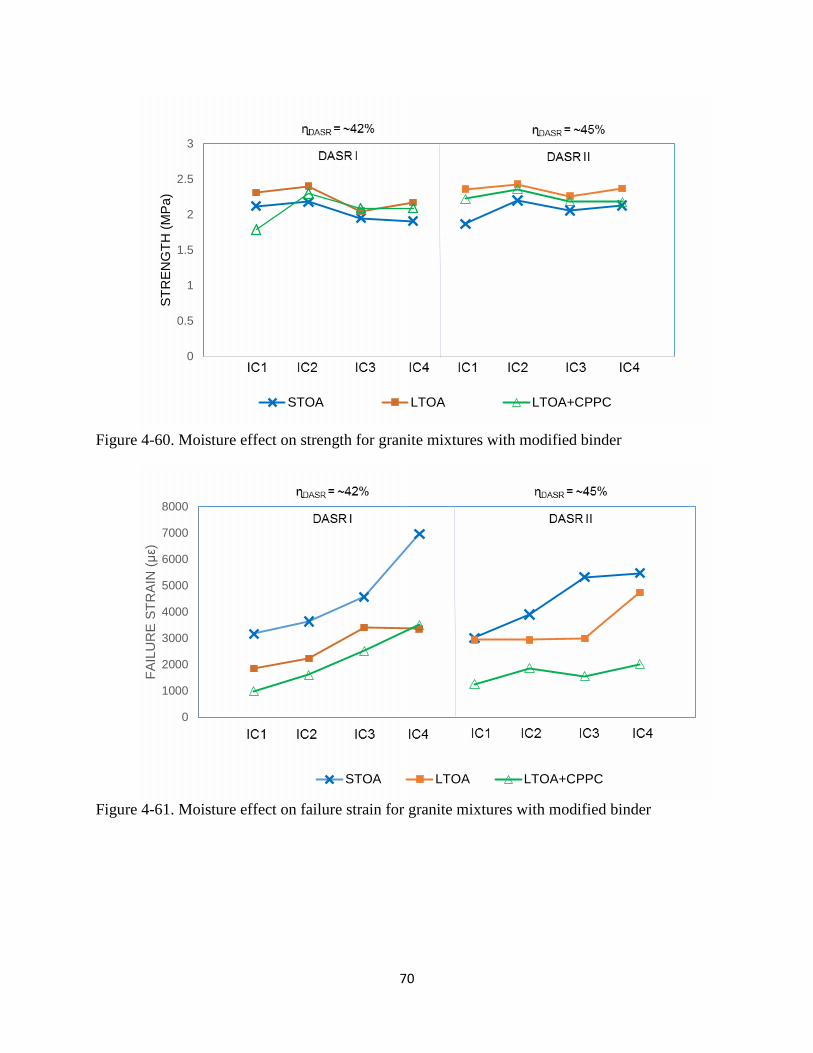
Figure 4-60. Moisture effect on strength for granite mixtures with modified binder
Figure 4-61. Moisture effect on failure strain for granite mixtures with modified binder
0
0.5
1
1.5
2
2.5
3
STR
ENG
TH (M
Pa)
STOA LTOA LTOA+CPPC
0
1000
2000
3000
4000
5000
6000
7000
8000
FAIL
UR
E ST
RAI
N (μ
ε)
STOA LTOA LTOA+CPPC
70

Figure 4-62. Moisture effect on Fracture energy for granite mixtures with modified binder
Figure 4-63. Fracture energy for modified and unmodified granite mixtures at LTOA+CPPC
0.00
2.00
4.00
6.00
8.00
10.00
12.00
FE (k
J/m
3 )
STOA LTOA LTOA+CPPC
0.00
2.00
4.00
6.00
8.00
10.00
FE (k
J/m
3 )
MOD UNMOD
71

Figure 4-64. Moisture effect on resilient modulus for granite mixtures with modified binder
Figure 4-65. Moisture effect on creep rate for granite mixtures with modified binder
0
2
4
6
8
10
12
MR
(GPa
)
STOA LTOA LTOA+CPPC
0.00E+00
1.00E-08
2.00E-08
3.00E-08
4.00E-08
5.00E-08
6.00E-08
CR
EEP
RAT
E (1
/psi
·sec
)
STOA LTOA LTOA+CPPC
72

Figure 4-66. Effect of modified binder on creep rate for granite mixtures at LTOA+CPPC
4.5.4 Limestone Mixtures with Unmodified Binder at LTOA+CPPC
Figure 4-67 shows that moisture conditioning by LTOA+CPPC had a relatively minor effect on tensile strength of all IC’s at both DASR porosity levels, except perhaps for the finest IC-1 at DASR I porosity level. As mentioned throughout the report, tensile strength of limestone mixtures is governed primarily by strength of coarse aggregate, so other factors have relatively little impact on tensile strength. Figure 4-68 shows that failure strain was generally reduced by LTOA+CPPC conditioning. The overall effect on fracture energy is shown in Figure 4-69, which reflects the overall reduction in failure strain on fracture energy.
Comparison of fracture energy of limestone and granite mixtures after LTOA+CPPC
presented in Figure 4-70 shows granite mixtures had higher fracture energy for intermediate coarseness IC-2 and IC-3 for both DASR porosity levels. Whereas limestone fracture energy was relatively unaffected by IC characteristics, granite mixtures exhibited superior fracture energy for IC-3, which was the only IC that met all preliminary criteria identified for optimal mixture performance.
Figure 4-71 appears to indicate the presence of moisture affected resilient modulus of
mixtures at the lower DASR I porosity level. Resilient modulus values were much more variable among the different IC’s after LTOA+CPPC. The effect was not observed for mixtures at the higher DASR II porosity level.
0.00E+00
1.00E-08
2.00E-08
3.00E-08C
REE
P R
ATE
(1/p
si·s
ec)
MOD UNMOD
73

Creep rate results presented in Figure 4-72 showed LTOA+CPPC conditioning consistently resulted in reduced creep rate for all mixtures (all IC’s and both DASR porosity levels). Lower creep rate implies that either the mixture was enhanced by LTOA+CPPC conditioning, which is counterintuitive, or negative pore pressures were induced by introduction of water. The latter explanation appears to be the only reasonable one.
Figure 4-75 shows that even after LTOA+CPPC conditioning, creep rate of limestone
mixtures was dramatically lower than that of granite mixtures. As mentioned earlier, the rougher, more porous nature of limestone aggregate enhances inter-aggregate shear resistance, thereby reducing mixture compliance.
Figure 4-67. Moisture effect on strength for limestone mixtures with unmodified binder
0.00
0.50
1.00
1.50
2.00
2.50
3.00
STR
ENG
TH (M
Pa)
STOA LTOA LTOA+CPPC
74
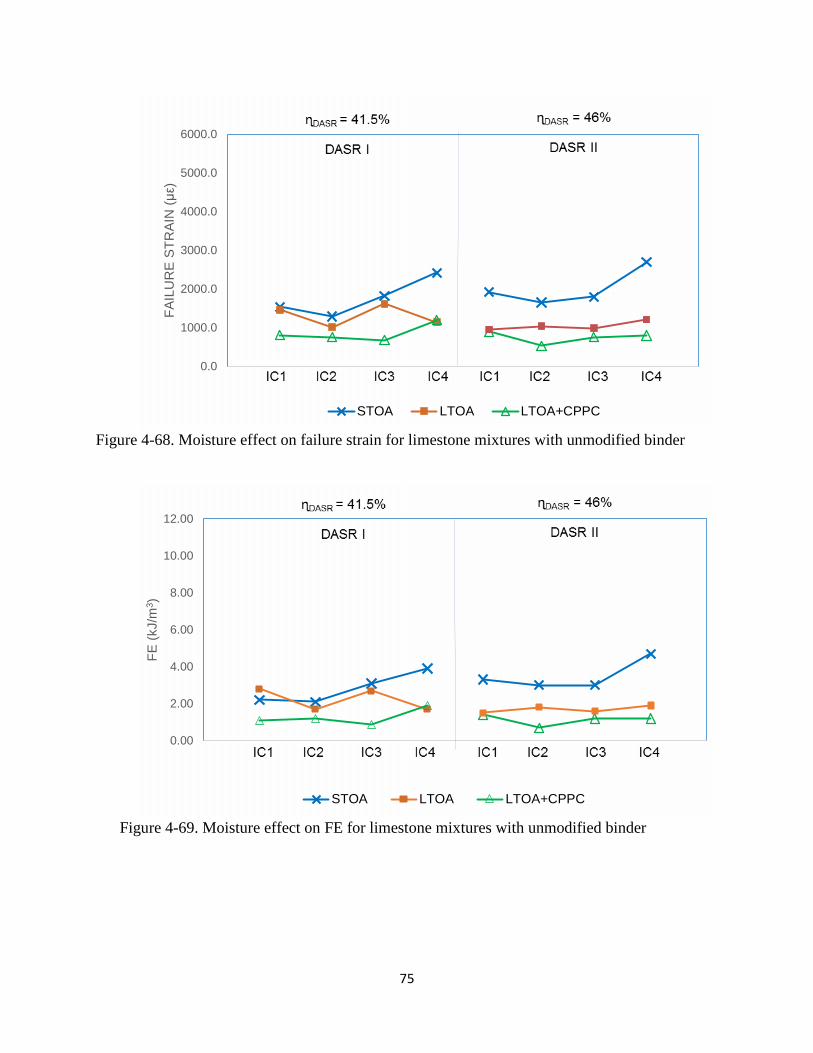
Figure 4-68. Moisture effect on failure strain for limestone mixtures with unmodified binder
Figure 4-69. Moisture effect on FE for limestone mixtures with unmodified binder
0.0
1000.0
2000.0
3000.0
4000.0
5000.0
6000.0
FAIL
UR
E ST
RAI
N (μ
ε)
STOA LTOA LTOA+CPPC
0.00
2.00
4.00
6.00
8.00
10.00
12.00
FE (k
J/m
3 )
STOA LTOA LTOA+CPPC
75

Figure 4-70. Fracture energy of limestone and granite mixtures with unmodified binder at
LTOA+CPPC
Figure 4-71. Moisture effect on resilient modulus for limestone mixtures with unmodified binder
0.00
1.00
2.00
3.00
4.00
5.00
6.00
7.00
8.00
9.00
10.00FE
(kJ/
m3 )
limestone granite
0.00
2.00
4.00
6.00
8.00
10.00
12.00
14.00
16.00
MR
(GPa
)
STOA LTOA LTOA+CPPC
76

Figure 4-72. Moisture effect on creep rate for limestone mixtures with unmodified binder
Figure 4-73. Creep rate of limestone and granite mixtures with unmodified binder at
LTOA+CPPC
0.00E+00
1.00E-08
2.00E-08
3.00E-08
4.00E-08
5.00E-08
CR
EEP
RAT
E (1
/psi
·sec
)
STOA LTOA LTOA+CPPC
0.00E+00
5.00E-09
1.00E-08
1.50E-08
2.00E-08
2.50E-08
3.00E-08
CR
EEP
RAT
E (1
/psi
·sec
)
limestone granite
77

4.5.5 Limestone Mixtures with Modified Binder at LTOA+CPPC
Figures 4-74 shows that moisture conditioning by CPPC reduced tensile strength of all IC’s at both DASR porosity levels, while Figure 4-75 shows LTOA+CPPC conditioning had a relatively small influence on failure strain, except for the coarsest IC-4 mixture at DASR II porosity level. This is different than observations for the unmodified mixtures, for which strength remained the same and failure strain decreased. The effects on fracture energy presented in Figure 4-76 shows moisture conditioning appeared to have a greater effect (reduction in fracture energy) for the higher DASR II porosity mixtures. Most importantly, Figure 4-76 shows that fracture energy of all modified limestone mixtures after LTOA+CPPC was approximately the same for all IC’s at both DASR porosity levels, once again re-emphasizing the insensitivity of failure limits of limestone mixtures to everything except the strength of the aggregate.
Figure 4-77 illustrates that addition of modifier did not have a consistently beneficial effect
on fracture energy of limestone mixtures. Figure 4-78 shows fracture energy of modified granite mixture was consistently higher than that of limestone mixtures. Given earlier observations that modifier did not consistently increase fracture energy of granite mixtures either, the higher fracture energy of granite mixtures is primarily because failure does not occur through the brittle aggregate as it does in the limestone mixtures, so the mixture is able to take advantage of higher fracture energy of modified binder.
Figure 4-79 shows that moisture conditioning by LTOA+CPPC reduced the resilient
modulus for all IC’s at both DASR porosity levels. The observed reduction is the combined effect of damage induced by CPPC and/or positive pore pressure induced by loading. Figure 4-80 shows creep rate was relatively unaffected by moisture conditioning. These observations are consistent with the fact that limestone is not considered a moisture sensitive aggregate. Also, given the very low creep rate of limestone mixtures, any potential negative pore pressure effect on creep rate appeared to be negligible. Similarly, Figure 4-81 shows polymer modification had a negligible effect on the already low creep rates associated with these mixtures. Figure 4-82 shows creep rates of limestone mixtures are dramatically lower than those of granite mixtures.
78

Figure 4-74. Moisture effect on strength for limestone mixtures with modified binder
Figure 4-75. Moisture effect on failure strain for limestone mixtures with modified binder
0
0.5
1
1.5
2
2.5
3
STR
ENG
TH (M
Pa)
STOA LTOA LTOA+CPPC
0
1000
2000
3000
4000
5000
6000
FAIL
UR
E ST
RAI
N (μ
ε)
STOA LTOA LTOA+CPPC
79

Figure 4-76. Moisture effect on fracture energy for limestone mixtures with modified binder
Figure 4-77. Modified binder effect on FE for limestone mixtures after LTOA+CPPC
0.00
2.00
4.00
6.00
8.00
10.00
FE (k
J/m
3 )
STOA LTOA LTOA+CPPC
0.00
1.00
2.00
3.00
4.00
FE (k
J/m
3 )
MOD UNMOD
80

Figure 4-78. FE of limestone and granite mixtures with modified binder after LTOA+CPPC
Figure 4-79. Moisture effect on resilient modulus for limestone mixtures with modified binder
0.00
2.00
4.00
6.00
8.00
FE (k
J/m
3 )
limestone granite
0
2
4
6
8
10
12
14
16
MR
(GPa
)
STOA LTOA LTOA+CPPC
81

Figure 4-80. Moisture effect on creep rate for limestone mixtures with modified binder
Figure 4-81. Modified binder effect on creep rate for limestone mixtures after LTOA+CPPC
0.00E+00
1.00E-08
2.00E-08
3.00E-08
CR
EEP
RAT
E (1
/psi
·sec
)
STOA LTOA LTOA+CPPC
0.00E+00
1.00E-08
2.00E-08
3.00E-08
CR
EEP
RAT
E (1
/psi
·sec
)
MOD UNMOD
82

Figure 4-82. Creep rate of limestone and granite mixtures with modified binder after
LTOA+CPPC
4.6 Effect of IV Characteristics on Cracking Performance
4.6.1 Introduction
The overall effect of IV characteristics on cracking performance was based on mixture properties at LTOA+CPPC conditioning level using the Energy Ratio (ER) parameter. ER was calibrated using properties measured on aged field cores, so appropriate use of ER requires determination of properties on mixtures conditioned to levels representing combined effects of oxidative aging and moisture. A research project conducted by the University of Florida for FDOT specifically dealt with identification of the most appropriate laboratory conditioning procedures to simulate field aging. The conclusion was reached that LTOA alone was insufficient to represent observed changes in properties determined to occur in field pavement. Furthermore, it was determined that LTOA followed by cyclic pore pressure conditioning (CPPC) resulted in mixture property changes consistent with field measurements. Therefore, evaluation of cracking performance using ER should be based on LTOA+CPPC conditioned mixture.
0.00E+00
1.00E-08
2.00E-08
3.00E-08
CR
EEP
RAT
E (1
/psi
·sec
)
limestone granite
83

4.6.2 Granite Mixtures at LTOA+CPPC
Figure 4-83 shows ER for each IC coarseness and DASR porosity levels for unmodified granite mixtures. For both DASR porosity levels, it is clear that IC-3 resulted in the highest ER, indicating the best cracking performance of all IC’s evaluated in this study. Furthermore, IC-3 for both porosity levels was the only IC resulting in ER significantly greater than 1.0. This finding is especially significant for this study because IC-3 was the only one of the four IC’s that met all preliminary DASR-IC gradation criteria, including effective film thickness (EFT) and fine aggregate ratio (FAR). Consequently, these results appear to support the validity of these criteria.
Figure 4-84 shows modified binder significantly increased ER for all mixtures, except the
finest IC-1 at DASR I, which showed only a modest improvement. Interestingly, the finest IC-1at DASR II also did not see as much of an improvement in ER by modification as did the coarser IC’s. Comparison of modified and unmodified mixture ER presented in Figure 4-85 shows both DASR porosity levels resulted in very similar performance levels and trends. The two primary conclusions from these observations were:
• Introduction of polymer modified binder generally overwhelmed the negative effects of the lower performing IC’s, so its use should be strongly recommended if mixture gradation variability in the field is expected to result in substandard DASR-IC criteria.
• Finer IC gradations should not be used even when polymer modified binder is specified.
Figure 4-83. Changes in ER for unmodified granite mixtures
0.00
1.00
2.00
3.00
4.00
ENER
GY
RAT
IO
84

Figure 4-84. Effect of modified binder on ER for granite mixtures
Figure 4-85. Effect of modified binder on ER for granite mixtures
0
1
2
3
4
ENER
GY
RAT
IO
MOD UNMOD
0.00
1.00
2.00
3.00
4.00
ENER
GY
RAT
IO
IC1 IC2 IC3 IC4
85

4.6.3 Limestone mixtures at LTOA+CPPC
Figure 4-86 shows ER for each IC coarseness and DASR porosity levels for unmodified limestone mixtures. For both DASR porosity levels, there is a gradual reduction in ER as IC coarseness increases. The data also shows that ER for all limestone mixtures was greater than or equal to 2.0, except for the IC-3 DASR I mixture, which the authors think is an anomalous value resulting from an unusually low FE value. It is clear this ER value is completely out of line with the general trends of the data and does not pass the test of “engineering reasonableness.” There is absolutely no reason other than an anomalous test result that would explain the large difference the ER value for IC-3 DASR I and IC-3 DASR II, for example. Note how the two data sets, DASR I and DASR II, are identical in terms of both trend and magnitude except for this result. As discussed below, the same trend and magnitude for ER was observed for the modified mixture results, except for one of the eight values (Figure 4-87 IC-2 DASR I). Limestone aggregate mixtures result in very low tensile strengths and exceedingly low creep rates, so relatively small errors in data collection and interpretation can result in anomalies in the ER parameter.
Figure 4-87 shows ER for each IC coarseness and DASR porosity levels for the modified
limestone mixtures. The magnitude and trend of ER values is virtually identical as those of the unmodified limestone mixtures. This was to be expected, since modified asphalt was generally found not to have a strong effect on limestone mixture creep rate or fracture energy. Figure 4-87 shows that there was also one anomalous point for the eight modified mixture (IC-2 at DASR I). A similar argument is made that the large ER difference is unreasonable and almost certainly due to errors in data collection and interpretation.
All ER results for the unmodified and modified limestone mixtures, except for the two
anomalous points, are plotted in Figure 4-88. The consistency of the data is unquestionable, once again supporting the argument questioning the validity of the two anomalous results. Furthermore, the results show limestone mixture performance was much less affected by differences in IC characteristics than granite mixtures. In addition, unmodified limestone mixtures exhibited superior performance than unmodified granite mixtures as illustrated in Figure 4-89. Figure 4-90 shows performance of modified granite mixture was about the same as that of modified limestone mixture. However, it should be noted that unmodified limestone mixture performed just as well as modified limestone mixture.
86

Figure 4-86. Changes in ER for limestone mixtures with unmodified binder
Figure 4-87. Changes in ER for limestone mixtures with modified binder
0.00
2.00
4.00
6.00
ENER
GY
RAT
IO
Too low FE
0.00
2.00
4.00
6.00
8.00
ENER
GY
RAT
IO
Too low creep rate
87

Figure 4-88. Effect of modified binder on ER for limestone mixtures
Figure 4-89. Performances of granite and limestone mixtures with unmodified binder
0.00
1.00
2.00
3.00
4.00
5.00
6.00
ENER
GY
RAT
IO
DASR1(U) DASRII(U) DASR1(M) DASRII(M)
Too low creep rate
Too low FE
IC1 IC2 IC3 IC4
0.00
2.00
4.00
6.00
8.00
ENER
GY
RAT
IO
limestone granite
88

Figure 4-90. Performances of granite and limestone mixtures with modified binder
0.00
2.00
4.00
6.00
8.00
ENER
GY
RAT
IO
limestone granite
ɳDASR = 46%
DASR II
89

CHAPTER 5 FINITE ELEMENT ANALYSIS
5.1 Introduction
In order to help achieve the objectives of this study Finite Element Analysis (FEA) was performed using Abaqus FEA software, which is one of the powerful simulation tools widely used by academic and research institutions. The goal of the analysis was to achieve a better understanding of the effects of IC characteristics (e.g., IC particle size and distribution) on the stress and strain distribution within the IV of the mixture. In this chapter, the development of the models and the results of the FEA are presented.
5.2 Development of the Model Geometry
The objective was to create a two dimensional (2D) schematic representation of the IV of the mixture, assuming circular aggregates and simple cubical packing (Figure 5-1). In order to simplify the geometry, the coarse aggregate structure, i.e., DASR was assumed to be composed of single size particles with an 8-mm diameter; the diameter was determined as the average size of a 12.5 – 2.36 mm DASR as shown in Table 5-1.
Figure 5-1. Simple cubical packing
Table 5-1. Determination of DASR particle size for FE model
90

The model is composed of an aggregate phase (DASR aggregate and IC aggregate), and a mastic phase (asphalt, aggregates smaller than 0.30 mm (passing #50 sieve)). Air voids were not included in the model. Both phases were modeled as linear elastic materials. The DASR in simple cubical packing was loaded at the two horizontal borders by applying a displacement along the y-axis (Figure 5.2(A)). The representative FE model is shown in Figure 5-2(B). Because of the symmetry of the model along both axes, only one quarter of the model was considered in the finite element analysis as indicated in the upper-right part of Figure 5-2(B).
Figure 5-2. Representation of the FE model. A) DASR structure. B) Two phase FE model (IC particles not included)
The next step was to define the gap between DASR particles as indicated in Figure 5-3(A). In order to determine the gap size, material properties of both aggregate and mastic phases were selected based on typical values from the literature, i.e., 50,000 MPa and 600 MPa, respectively; the gap size was then gradually changed until the global effective stiffness of the model matched typical asphalt mixture stiffness at 10°C (i.e. 3450 MPa (or 500,000 psi)). Each generated model was tested in the displacement control mode by applying a fixed displacement along the y-axis at the top and bottom borders of the model. As expected, the area along the gap between DASR particles exhibited higher tensile stresses than the rest of the mastic phase as shown in Figure 5-3(B). Changes in the gap size have a significant effect on the overall stiffness of the model as shown in Table 5-2. The optimal gap size was found to be of 0.27 mm (see Figure 5-4), rounded down to 0.25 mm (6.25 % of the DASR particle radius).
91

Figure 5-3. FE model used to define the gap size. A) Design of the model. B) Distribution of maximum principal stress within the model
Table 5-2. Characteristics of the models used to define the gap size and resulting effective stiffness of the model
GAP size GAP size Eagg νagg Emastic νmastic
∆ F σave εave Eeff [%RDASR] [mm] [MPa] [MPa] [mm] [N] [MPa] [µε] [ksi]
5 0.2
50,000 0.25 600 0.4 0.002
8.82 1.52 344.9 639 6.25 0.25 7.08 1.21 342.9 513 7.5 0.3 6.50 1.15 341.7 471 10 0.4 5.56 1.11 341.3 403
Figure 5-4. Determination of gap size
y = 5957x2 - 4712.4x + 1337.1R² = 0.9828
0
200
400
600
800
1000
0 0.1 0.2 0.3 0.4 0.5
Eeff
(ksi
)
GAP size (mm)
92

5.3 Effect of IC Particle Size
Once the geometry of the DASR structure was defined, IC aggregates were introduced within the IV. Three IC aggregate sizes were selected:
• Coarse IC aggregate (FIC = 1.50 mm): average aggregate particle size passing #8 sieve (2.36 mm) and retained at #16 sieve (1.18 mm).
• Intermediate size IC aggregate (FIC = 0.75 mm): average aggregate particle size passing #16 sieve (1.18 mm) and retained at #30 sieve (0.60 mm).
• Fine IC aggregate (FIC = 0.375 mm): average aggregate particle size passing #30 sieve (0.60 mm) and retained at #50 sieve (0.30 mm).
Three models were developed with coarse, intermediate and fine IC particles introduced within the IV, as shown in Figures 5-5(A), 5-6(A), and 5-7(A) respectively. The same volume concentration of 40%, defined as the area of IC aggregates over the total area of IV, was employed for all three models.
Figure 5-5. FE model with coarse IC aggregate. A) model configuration. B) stress contour
Figure 5-6. FE model with intermediate IC aggregate. A) model configuration. B) stress contour
93

Figure 5-7. FE model with fine IC aggregate. A) model configuration. B) stress contour
To overcome the stiffening effect of IC particles introduced within the IV on the overall effective stiffness of the model, Emastic was reduced gradually to identify the optimum value that can maintain the effective stiffness of the model (see Table 5-3). Using the model with intermediate IC particle size, the optimum value was determined to be 365 MPa, as shown in both Table 5-3 and Figure 5-8. This optimum Emastic was then used in the other two models with coarse and fine IC particle sizes respectively, which resulted in a similar effective stiffness of about 500 ksi among all three models. It appeared that the effect of IC particle size on the overall effective stiffness of the model is negligible, as long as the volume concentration of the IC particles is kept the same.
Table 5-3. Characteristics of the models used to calibrate Emasti c and resulting effective stiffness
of the model GAP size GAP size Eagg νagg
Emastic νmastic ∆ F σave εave Eeff
[%RDASR] [mm] [MPa] [MPa] [mm] [N] [MPa] [µε] [ksi]
6.25 0.25 50,000 0.25
600
0.4 0.002
10.94 1.88
342.8
793 500 9.29 1.59 674 400 7.57 1.30 549 365 6.96 1.19 505 300 5.79 0.99 420
94

Figure 5-8. Determination of Emastic using the model with intermediate IC aggregate
The maximum principal stress contours for the three models with coarse, intermediate, and fine IC particles of the same volume concentration are presented in Figures 5-5(B), 5-6(B) and 5-7(B), respectively. In general, all three models exhibited higher tensile stresses at two locations: Location 1 and Location 2 as clearly marked in Figures 5-5(A) through 5-7(A), than in the rest of the IV. Location 1 is going across the gap between DASR particles, and Location 2 is passing through the IC particle(s) next to the center-line of the models. Figure 5-9 compares the maximum principal stress distributions at Location 1 for the model with no IC particle and all three models with IC particles of varying size. It is clear that the introduction of IC aggregates in the IV significantly reduced the stresses in the gap. However, variations in the IC aggregate size didn’t change the stress distribution within the gap.
Figure 5-9. Effect of IC particle size on maximum principal stress in the gap between DASR
particles (location 1)
0.0
1.0
2.0
3.0
4.0
5.0
0.0 0.1 0.2 0.3 0.4 0.5 0.6 0.7 0.8 0.9 1.0
Max
. Prin
cipa
l Str
ess
Dis
trib
utio
n (M
Pa)
Normalized Distance
No IC aggregateCoarseIntermediateFine
GAP
95

The maximum principal stress distributions at Location 2 for all models are presented in Figure 5-10. Generally, the three models having IC particles of varying sizes exhibited higher tensile stresses than the model with no IC particle. Among the three models with IC particles, peak stresses were observed in the mastic between IC particles. Furthermore, the magnitude and number of the peak stresses were found to increase when the IC particles are getting smaller (i.e., when the IC coarseness reduces). The reduction in IC coarseness resulted in increased number of IC particles and thinner mastic film thickness between the IC particles for the same volume concentration, which led to more severe stress condition within the IV. This observation may be explained by the “thin film” phenomenon, where a thinner mastic film thickness implies higher stress concentration. In addition, the observed trend in Figure 5-10 appeared to be consistent with fracture energy limit (FEf) results for both the granite and limestone mixtures with the unmodified asphalt binder, which showed that the reduction in coarseness resulted in lower FEf, i.e., lower tolerance of the mixtures to fracture. Figure 5-11 presents the peak stresses for all three models with IC particles at both critical locations.
Figure 5-10. Effect of IC particle size on maximum principal stress distribution at Location 2
0.0
1.0
2.0
3.0
4.0
5.0
0.0 0.1 0.2 0.3 0.4 0.5 0.6 0.7 0.8 0.9 1.0
Max
Prin
cipa
l Str
ess
Dis
trib
utio
n (M
Pa)
Normalized Distance
No IC aggregateCoarseIntermediateFine
96

Figure 5-11. Comparison of peak stresses of three IC models at two locations
In order to assess the effect of IC aggregate distribution on resulting stresses within the IV, one modified intermediate IC model and one modified fine IC model were created as shown in Figures 5-12(A) and 5-13(A), respectively. In the modified intermediate IC model, only two corner IC particles were placed closer to the gap between the two DASR particles to simulate a slightly more evenly distributed IC configuration. While, eight IC particles were placed closer to the gap in the modified fine IC model to simulate a further more evenly distributed IC configuration.
A B
Figure 5-12. Modified intermediate IC model: A) model configuration; B) stress contour
Figure 5-12(B) presents the maximum principal stress contour for the modified intermediate IC model. As compared to the stress contour of the original configure (Figure 5-6(B)), the relocation of the two intermediate IC particles did not change the stresses at Locations 1 and 2, but resulted in a third location, i.e., Location 3 marked in Figure 5-12(A), with high stresses that are comparable with those at the two critical locations, as can be clearly seen in Figure 5-14. The maximum principal stress contour for the modified fine IC model is presented
0.0
1.0
2.0
3.0
4.0
5.0
Location 1 Location 2
Peak
Val
ue o
f Max
. Prin
cipa
l Str
esse
s (M
Pa)
Critical Location in IV
Coarse IC
Intermediate IC
Fine IC
97

in Figure 5-13(B), which showed that the peak stress is located near the single IC particle closest to the gap, i.e., Location 3 marked in Figure 5-13(A). Further comparison was made between the stresses of the original and the modified fine IC models at three locations as shown in Figure 5-14. Interestingly, the stresses at Locations 1 and 2 remained almost the same, but the stress at Location 3 of the modified fine IC model nearly doubled the stresses at the other locations. It appeared that a more evenly distributed IC configuration will result in more severe stress states, particularly at locations where the IC particle(s) are very close to the gap between the two DASR particles.
A B
Figure 5-13. Modified fine IC model: A) model configuration; B) stress contour
Figure 5-14. Comparison of peak stresses of four IC models at three locations
0.0
1.0
2.0
3.0
4.0
5.0
Location 1 Location 2 Location 3
Peak
Val
ue o
f Max
. Prin
cipa
l Str
esse
s (M
Pa)
Critical Location in IV
Intermediate IC
Intermediate IC_Mod
Fine IC
Fine IC_Mod
98

CHAPTER 6 CLOSURE
6.1 Summary and Findings
The focus of the study was to assess the effects of changes in IV characteristics on asphalt mixture performance. The overall goal was to establish clear implementable gradation and volumetric criteria for purposes of mixture design and construction specifications that will lead to consistently enhanced cracking performance. Evaluated volumetric criteria from earlier FDOT-sponsored studies conducted by UF established the following parameters; DASR porosity, Disruption factor (DF), Fine Aggregate Ratio (FAR) and Effective Film Thickness (EFT). The porosity of the DASR and the DF have been validated in earlier studies. This study focused on FAR and EFT which are related to the interstitial component of the mixture. All mixtures were tested using the Superpave IDT test protocol and the mixture properties were determined using the ITLT software. The mixtures were subjected to three conditioning levels; STOA, LTOA and LTOA+CPPC. The main findings based on results of laboratory testing and finite element analysis are listed below:
• It was found that changes in IC gradation affected the amount of binder content in the
mixture, the distribution of the asphalt binder and the void structure. As IC gradation increased in coarseness, the binder content also increased. Furthermore, the aggregate distribution of the finer IC gradations resulted in aggregates that were in close proximity, and hence, the asphalt binder was thinly distributed which resulted in a stiffer mixture. Conversely, coarser IC’s had aggregates that were more sparsely distributed and the asphalt binder was more coarsely distributed within the aggregates resulting in a less stiff mixture. These effects resulted in different mixture property responses. Overall, an increase in IC coarseness which resulted in an increase in binder content increased the FE of the granite mixtures. These findings were supported by the finite element analysis which showed that finer IC resulted in an increase in internal stresses which reduces the FE. Furthermore, creep rate of all mixtures increased as IC got coarser which was due to the reduction in stiffness. The increase in creep rate was more pronounced for the granite mixtures than the limestone mixtures.
• The effects of changes in IC gradation on mixture properties were dependent on aggregate type. Granite mixtures were more sensitive to changes in IC gradation than limestone mixtures. While FE and creep rate generally increased as IC became coarser for the granite mixtures, properties of the limestone mixtures were less affected by changes in IC gradation. FE was less sensitive in the limestone mixtures because failure occurs through the limestone aggregates as opposed to through the mastic for the granite mixtures. With respect to performance, the unmodified granite mixtures that were best met the volumetric criteria while all others were not satisfactory. On the other hand limestone mixtures generally decreased as IC became coarser even though all the mixtures had satisfactory performance.
• Mixture properties were dependent on the characteristics of the aggregate type. Fracture
energy of the granite mixtures was higher than the limestone mixtures at all conditioning levels. This was because the Florida limestone aggregates used for the study are weaker
99

than the granite aggregates. Furthermore, creep rate for the limestone mixtures were lower than the granite because the limestone aggregates have a much rougher surface texture and are more porous than the granite aggregates. These characteristics of the limestone aggregates increase stiffness and reduce compliance than a smoother less porous granite aggregate.
• Modified binder improved the performance of all the granite mixtures but the finest IC
mixtures. However, the modified binder did not improve the performance of the limestone mixtures. Overall, the modified limestone mixtures performed just as well as the modified granite mixtures.
• Moisture conditioning induced micro damage and generally reduced the fracture energy
of all mixtures. Granite mixtures were more strongly affected by moisture conditioning than limestone mixtures. Modified binder improved granite mixtures most affected by moisture conditioning but did not have as much effect for the limestone mixtures.
• Moisture conditioning affected the stiffness of the mixtures to varying degrees.
Depending on the pore structure of the mixture and the loading times, either positive or negative pore pressures develop within the mixtures. Positive pore pressures reduced the stiffness while negative pore pressures increased the stiffness.
6.2 Conclusions
It was found that the two unmodified granite mixtures that met the preliminary established criteria exhibited the best mixture performance while all the other granite mixtures exhibited marginal or unsatisfactory performance. Limestone mixtures resulted in satisfactory performance. It can be concluded that:
• The preliminary volumetric criteria were effective and their implementation would help
to ensure consistently enhanced cracking performance.
• It may be possible to relax criteria if Styrene-Butadiene-Styrene (SBS) modified binder is used except for excessively fine mixtures. This finding supports the continuous use of SBS on heavy traffic roads in the state of Florida.
100

APPENDIX
A. LABORATORY MIXTURE INFORMATION
Table A1. Gradations for granite mixtures
Table A2. Gradations for limestone mixtures
101

Figure A1. Close up view of the IC portion of granite mixtures (DASR I)
Figure A2. Close up view of the IC portion of granite mixtures (DASR II)
102

Figure A3. Close up view of the IC portion of limestone mixtures (DASR I)
Figure A4. Close up view of the IC portion of limestone mixtures (DASR II)
103

Table A3. Designed volumetrics for granite mixtures
Table A4. Designed volumetrics for limestone mixtures
104

B. BATCHING WEIGHTS FOR DESIGNED MIXTURES
Table B1. Aggregate stockpiles used for granite mixtures
Table B2. Aggregate stockpiles used for limestone mixtures
Table B3. Batch weight for granite mixture DASR I-IC1 gyratory samples
105

Table B4. Batch weight for granite mixture DASR I-IC2 gyratory samples
Table B5. Batch weight for granite mixture DASR I-IC3 gyratory samples
106

Table B6. Batch weight for granite mixture DASR I-IC4 gyratory samples
Table B7. Batch weight for granite mixture DASR II-IC1 gyratory samples
107

Table B8. Batch weight for granite mixture DASR II-IC2 gyratory samples
Table B9. Batch weight for granite mixture DASR II-IC3 gyratory samples
108

Table B10. Batch weight for granite mixture DASR II-IC4 gyratory samples
Table B11. Batch weight for limestone mixture DASR I-IC1 gyratory samples
109

Table B12. Batch weight for limestone mixture DASR I-IC2 gyratory samples
Table B13. Batch weight for limestone mixture DASR I-IC3 gyratory samples
110

Table B14. Batch weight for limestone mixture DASR I-IC4 gyratory samples
Table B15. Batch weight for limestone mixture DASR II-IC1 gyratory samples
111

Table B16. Batch weight for limestone mixture DASR II-IC2 gyratory samples
Table B17. Batch weight for limestone mixture DASR II-IC3 gyratory samples
112

Table B18. Batch weight for limestone mixture DASR II-IC4 gyratory samples
4
113

C. IDT RESULTS
Table C1. IDT results for unmodified granite mixtures
Table C2. IDT results for modified granite mixtures
D1 St MR FE DCSEf Creep Rate D(t) Failure Strain(1/psi) (Mpa) (Gpa) (kJ/m3) (kJ/m3) (1/psi·sec) (1/GPa) (µε)
IC-1 0.472 1.13E-06 2.14 9.17 3.40 3.15 1.40E-08 4.34 2115.9 1.25IC-2 0.533 9.23E-07 2.19 8.72 4.30 4.03 1.95E-08 5.39 2626.2 1.36IC-3 0.562 1.14E-06 2.04 7.91 7.50 7.24 3.11E-08 8.11 4573.8 1.72IC-4 0.580 1.32E-06 1.76 6.09 7.20 6.90 4.21E-08 10.65 5108.4 1.34IC-1 0.473 1.56E-06 2.20 8.19 5.70 5.40 1.94E-08 5.97 3336.4 1.54IC-2 0.523 1.37E-06 2.05 7.94 6.10 5.80 2.66E-08 7.37 3683.0 1.43IC-3 0.594 8.63E-07 2.04 8.63 7.10 6.86 3.10E-08 7.60 4366.6 1.83IC-4 0.532 1.56E-06 1.88 7.00 5.60 5.35 3.27E-08 8.94 3892.1 1.12IC-1 0.447 4.34E-07 2.32 12.28 2.10 1.88 4.25E-09 1.44 1248.4 2.25IC-2 0.495 6.20E-07 2.38 10.97 3.50 3.24 9.40E-09 2.79 1830.1 1.99IC-3 0.494 7.38E-07 2.27 9.36 4.60 4.32 1.11E-08 3.31 2663.0 2.27IC-4 0.525 7.12E-07 2.30 9.27 6.80 6.51 1.41E-08 3.95 3671.0 2.95IC-1 0.488 5.85E-07 2.24 10.58 2.90 2.66 8.27E-09 2.53 1751.3 1.84IC-2 0.464 7.33E-07 2.21 10.20 2.30 2.06 8.41E-09 2.69 1483.67 1.32IC-3 0.556 5.61E-07 2.24 9.49 4.40 4.14 1.46E-08 3.85 2604.4 2.01IC-4 0.566 6.48E-07 2.09 9.57 4.70 4.47 1.83E-08 4.75 2851.5 1.82IC-1 0.478 7.96E-07 1.79 8.72 1.40 1.22 1.03E-08 3.21 1087.6 0.69IC-2 0.426 1.17E-06 1.99 9.16 1.80 1.58 9.47E-09 3.22 1285.5 0.84IC-3 0.493 9.59E-07 2.06 8.70 3.60 3.36 1.42E-08 4.16 2259.2 1.40IC-4 0.529 8.46E-07 1.88 8.41 2.30 2.09 1.73E-08 4.83 1656.7 0.82IC-1 0.393 8.53E-07 1.74 9.53 1.20 1.04 5.08E-09 1.94 998.4 0.99IC-2 0.420 8.16E-07 1.99 9.31 1.60 1.39 6.24E-09 2.20 1164.2 1.10IC-3 0.486 7.40E-07 2.21 9.74 2.70 2.45 1.03E-08 3.17 1678.1 1.36IC-4 0.491 5.49E-07 1.94 9.17 1.40 1.19 8.04E-09 2.46 1038.4 0.89
Laboratory Conditioning Mixture Type m-value ER
STOA
DASR I
DASR II
LTOA
DASR I
DASR II
LTOA+CPPC
DASR I
DASR II
D1 St MR FE DCSEf Creep Rate D(t) Failure Strain(1/psi) (Mpa) (Gpa) (kJ/m3) (kJ/m3) (1/psi·sec) (1/GPa) (µε)
IC-1 0.453 8.70E-07 2.12 9.21 5.20 5.00 9.01E-09 2.96 3161.8 2.92IC-2 0.476 9.18E-07 2.18 8.03 6.20 5.90 1.17E-08 3.62 3630.0 2.81IC-3 0.561 9.19E-07 1.95 7.36 6.70 6.40 2.48E-08 6.48 4572.1 1.93IC-4 0.546 1.33E-06 1.91 6.52 10.90 10.60 3.16E-08 8.50 6965.3 2.4IC-1 0.514 8.38E-07 1.87 8.23 4.20 4.00 1.50E-08 4.28 3015.2 1.71IC-2 0.534 7.32E-07 2.20 7.95 6.40 6.10 1.56E-08 4.36 3896.5 2.58IC-3 0.512 1.22E-06 2.06 6.7 8.50 8.20 2.15E-08 6.11 5322.8 2.39IC-4 0.546 1.10E-06 2.13 6.96 8.25 7.92 2.61E-08 7.00 5476.8 2.11IC-1 0.375 7.46E-07 2.31 9.78 3.20 2.90 3.73E-09 1.52 1844.4 3.44IC-2 0.435 6.01E-07 2.40 9.70 4.00 3.70 5.28E-09 1.81 2227.8 3.44IC-3 0.497 7.62E-07 2.05 8.13 5.10 4.80 1.17E-08 3.46 3406.2 2.48IC-4 0.454 7.50E-07 2.17 7.84 5.70 5.40 7.84E-09 2.57 3354.2 3.62IC-1 0.423 6.98E-07 2.36 9.93 5.30 5.00 5.49E-09 1.93 2932.2 4.37IC-2 0.424 7.53E-07 2.43 9.78 5.50 5.20 5.97E-09 2.09 2933.07 4.15IC-3 0.474 6.24E-07 2.26 9.35 5.20 4.90 7.82E-09 2.45 2994.5 3.46IC-4 0.484 6.97E-07 2.37 8.14 8.90 8.60 9.55E-09 2.93 4736.0 5.01IC-1 0.376 9.70E-07 1.79 9.57 1.30 1.10 4.90E-09 1.98 990.8 1.08IC-2 0.401 6.28E-07 2.30 9.61 2.60 2.30 4.02E-09 1.52 1609.2 2.66IC-3 0.412 1.11E-06 2.09 7.66 4.00 3.70 7.87E-09 2.87 2527.0 2.29IC-4 0.454 1.00E-06 2.09 7.05 5.90 5.60 1.04E-08 3.48 3515.2 2.84IC-1 0.401 7.89E-07 2.22 9.00 2.00 1.70 5.05E-09 1.91 1260.6 1.59IC-2 0.435 7.72E-07 2.36 9.68 3.20 2.90 6.78E-09 2.32 1855.1 2.11IC-3 0.399 7.91E-07 2.19 9.66 2.50 2.30 4.97E-09 1.83 1547.5 2.11IC-4 0.417 9.13E-07 2.18 8.10 3.20 2.90 6.79E-09 2.39 2017.8 2.07
LTOA
DASR I
DASR II
LTOA+CPPC
DASR I
DASR II
Laboratory Conditioning Mixture Type m-value ER
STOA
DASR I
DASR II
114
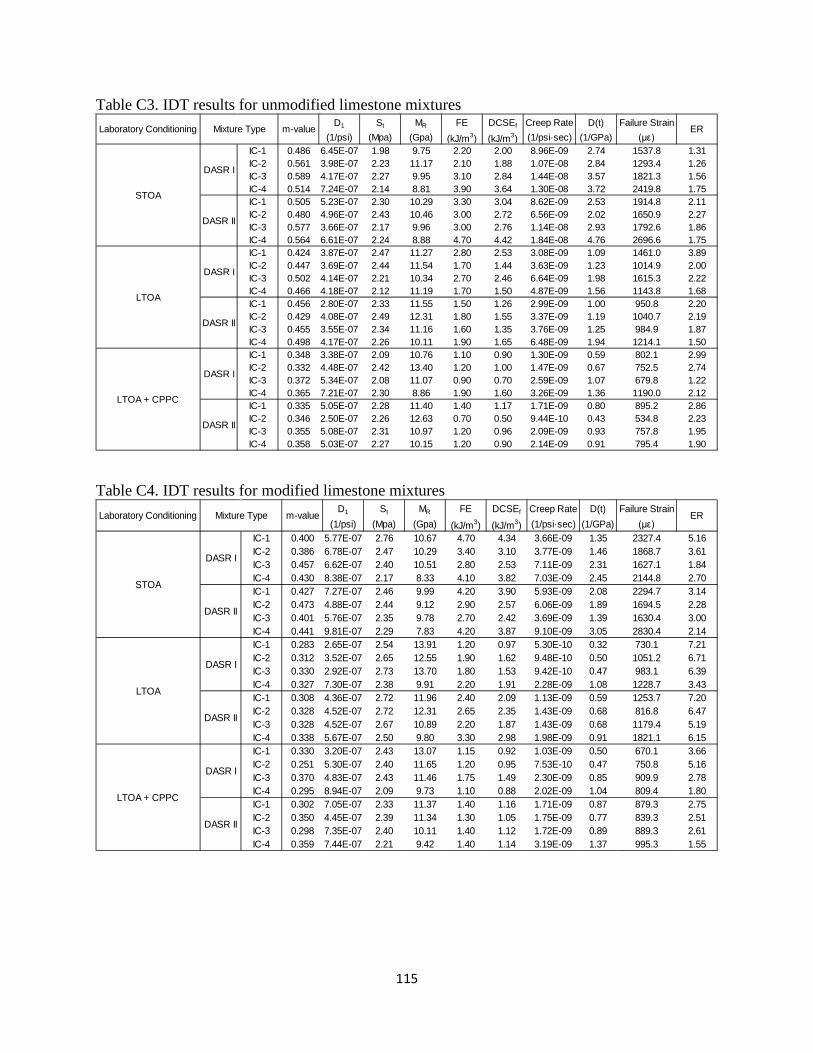
Table C3. IDT results for unmodified limestone mixtures
Table C4. IDT results for modified limestone mixtures
D1 St MR FE DCSEf Creep Rate D(t) Failure Strain(1/psi) (Mpa) (Gpa) (kJ/m3) (kJ/m3) (1/psi·sec) (1/GPa) (µε)
IC-1 0.486 6.45E-07 1.98 9.75 2.20 2.00 8.96E-09 2.74 1537.8 1.31IC-2 0.561 3.98E-07 2.23 11.17 2.10 1.88 1.07E-08 2.84 1293.4 1.26IC-3 0.589 4.17E-07 2.27 9.95 3.10 2.84 1.44E-08 3.57 1821.3 1.56IC-4 0.514 7.24E-07 2.14 8.81 3.90 3.64 1.30E-08 3.72 2419.8 1.75IC-1 0.505 5.23E-07 2.30 10.29 3.30 3.04 8.62E-09 2.53 1914.8 2.11IC-2 0.480 4.96E-07 2.43 10.46 3.00 2.72 6.56E-09 2.02 1650.9 2.27IC-3 0.577 3.66E-07 2.17 9.96 3.00 2.76 1.14E-08 2.93 1792.6 1.86IC-4 0.564 6.61E-07 2.24 8.88 4.70 4.42 1.84E-08 4.76 2696.6 1.75IC-1 0.424 3.87E-07 2.47 11.27 2.80 2.53 3.08E-09 1.09 1461.0 3.89IC-2 0.447 3.69E-07 2.44 11.54 1.70 1.44 3.63E-09 1.23 1014.9 2.00IC-3 0.502 4.14E-07 2.21 10.34 2.70 2.46 6.64E-09 1.98 1615.3 2.22IC-4 0.466 4.18E-07 2.12 11.19 1.70 1.50 4.87E-09 1.56 1143.8 1.68IC-1 0.456 2.80E-07 2.33 11.55 1.50 1.26 2.99E-09 1.00 950.8 2.20IC-2 0.429 4.08E-07 2.49 12.31 1.80 1.55 3.37E-09 1.19 1040.7 2.19IC-3 0.455 3.55E-07 2.34 11.16 1.60 1.35 3.76E-09 1.25 984.9 1.87IC-4 0.498 4.17E-07 2.26 10.11 1.90 1.65 6.48E-09 1.94 1214.1 1.50IC-1 0.348 3.38E-07 2.09 10.76 1.10 0.90 1.30E-09 0.59 802.1 2.99IC-2 0.332 4.48E-07 2.42 13.40 1.20 1.00 1.47E-09 0.67 752.5 2.74IC-3 0.372 5.34E-07 2.08 11.07 0.90 0.70 2.59E-09 1.07 679.8 1.22IC-4 0.365 7.21E-07 2.30 8.86 1.90 1.60 3.26E-09 1.36 1190.0 2.12IC-1 0.335 5.05E-07 2.28 11.40 1.40 1.17 1.71E-09 0.80 895.2 2.86IC-2 0.346 2.50E-07 2.26 12.63 0.70 0.50 9.44E-10 0.43 534.8 2.23IC-3 0.355 5.08E-07 2.31 10.97 1.20 0.96 2.09E-09 0.93 757.8 1.95IC-4 0.358 5.03E-07 2.27 10.15 1.20 0.90 2.14E-09 0.91 795.4 1.90
Laboratory Conditioning Mixture Type m-value ER
STOA
DASR I
DASR II
LTOA
DASR I
DASR II
LTOA + CPPC
DASR I
DASR II
D1 St MR FE DCSEf Creep Rate D(t) Failure Strain(1/psi) (Mpa) (Gpa) (kJ/m3) (kJ/m3) (1/psi·sec) (1/GPa) (µε)
IC-1 0.400 5.77E-07 2.76 10.67 4.70 4.34 3.66E-09 1.35 2327.4 5.16IC-2 0.386 6.78E-07 2.47 10.29 3.40 3.10 3.77E-09 1.46 1868.7 3.61IC-3 0.457 6.62E-07 2.40 10.51 2.80 2.53 7.11E-09 2.31 1627.1 1.84IC-4 0.430 8.38E-07 2.17 8.33 4.10 3.82 7.03E-09 2.45 2144.8 2.70IC-1 0.427 7.27E-07 2.46 9.99 4.20 3.90 5.93E-09 2.08 2294.7 3.14IC-2 0.473 4.88E-07 2.44 9.12 2.90 2.57 6.06E-09 1.89 1694.5 2.28IC-3 0.401 5.76E-07 2.35 9.78 2.70 2.42 3.69E-09 1.39 1630.4 3.00IC-4 0.441 9.81E-07 2.29 7.83 4.20 3.87 9.10E-09 3.05 2830.4 2.14IC-1 0.283 2.65E-07 2.54 13.91 1.20 0.97 5.30E-10 0.32 730.1 7.21IC-2 0.312 3.52E-07 2.65 12.55 1.90 1.62 9.48E-10 0.50 1051.2 6.71IC-3 0.330 2.92E-07 2.73 13.70 1.80 1.53 9.42E-10 0.47 983.1 6.39IC-4 0.327 7.30E-07 2.38 9.91 2.20 1.91 2.28E-09 1.08 1228.7 3.43IC-1 0.308 4.36E-07 2.72 11.96 2.40 2.09 1.13E-09 0.59 1253.7 7.20IC-2 0.328 4.52E-07 2.72 12.31 2.65 2.35 1.43E-09 0.68 816.8 6.47IC-3 0.328 4.52E-07 2.67 10.89 2.20 1.87 1.43E-09 0.68 1179.4 5.19IC-4 0.338 5.67E-07 2.50 9.80 3.30 2.98 1.98E-09 0.91 1821.1 6.15IC-1 0.330 3.20E-07 2.43 13.07 1.15 0.92 1.03E-09 0.50 670.1 3.66IC-2 0.251 5.30E-07 2.40 11.65 1.20 0.95 7.53E-10 0.47 750.8 5.16IC-3 0.370 4.83E-07 2.43 11.46 1.75 1.49 2.30E-09 0.85 909.9 2.78IC-4 0.295 8.94E-07 2.09 9.73 1.10 0.88 2.02E-09 1.04 809.4 1.80IC-1 0.302 7.05E-07 2.33 11.37 1.40 1.16 1.71E-09 0.87 879.3 2.75IC-2 0.350 4.45E-07 2.39 11.34 1.30 1.05 1.75E-09 0.77 839.3 2.51IC-3 0.298 7.35E-07 2.40 10.11 1.40 1.12 1.72E-09 0.89 889.3 2.61IC-4 0.359 7.44E-07 2.21 9.42 1.40 1.14 3.19E-09 1.37 995.3 1.55
LTOA
DASR I
DASR II
LTOA + CPPC
DASR I
DASR II
Laboratory Conditioning Mixture Type m-value ER
STOA
DASR I
DASR II
115

LIST OF REFERENCES
AASHTO, Standard Method of Test for Bulk Specific Gravity of Compacted Bituminous
Mixtures Using Saturated Surface-Dry Specimens, AASHTO T 166, Washington, D.C., 2001.
AASHTO, Standard Practice for Mixture Conditioning of Hot-mix Asphalt, AASHTO R 30, Washington, D.C., 2001.
AASHTO, Standard Method of Test for Specific Gravity and Absorption of Fine Aggregate, AASHTO T 84, Washington, D.C., 2004.
AASHTO, Standard Method of Test for Specific Gravity and Absorption of Coarse Aggregate, AASHTO T 85, Washington, D.C., 2004.
AASHTO, Standard Method of Test for Theoretical Maximum Specific Gravity (Gmm) and Density of Hot-Mix Asphalt (HMA), AASHTO T 209-12, 2012.
Aurilio, V., Pine, W.J., Lum, P., “The Bailey Method – Achieving Volumetrics and HMA Compactability”, Proceedings of the Fiftieth Annual Conference of the Canadian Technical Asphalt Association (CTAA), Victoria, British Columbia, 2005.
Bell, C.A., Ab., Wahab, Y., Cristi, M.E. and Sosnoveske, D., “Selection of Laboratory Aging Procedures for Asphalt-Aggregate Mixtures,” SHRP-A-383, Strategic Highway Research Program, Transportation Research Board, National Research Council, Washington, D.C., 1994.
Bell, C.A. and Sosnovske, D., “Aging: Binder Validation,” SHRP-A-384, Strategic Highway
Research Program, Transportation Research Board, National Research Council, Washington, D.C., 1994.
Bell, C.A., Wieder, A.J. and Fellin, M.J., “Laboratory Aging of Asphalt-Aggregate Mixtures:
Field Validation,” SHRP-A-390, Strategic Highway Research Program, Transportation Research Board, National Research Council, Washington, D.C., 1994.
Birgisson, B., Roque, R., Mang, T. and Masad, E., Development and Evaluation of Test Methods to Evaluate Water Damage and Effectiveness of Antistripping Agents, (Florida Department of Transportation Research Report BC-354-11, University of Florida, Gainesville, FL, 2005.
Buttlar, W. G., Roque, R., “Development and Evaluation of the Strategic Highway Research Program Measurement and Analysis System for Indirect Tensile Testing at Low Temperatures”, Transportation Research Record 1454, Transportation Research Board, Washington, D.C., pp. 163–71, 1994.
116
Chun, S., Roque, R., Zou, J., “Effect of Gradation Characteristics on Performance of Superpave Mixtures in the Field”, Transportation Research Record 1540, Transportation Research Board, Washington, D.C., pp. 43–52, 2012.
Chun, S., Zou, J., Roque, R., Lopp, G., “Predictive Relationships for HMA Fracture Properties Based on Mixture Component Characteristics”, Journal of Road Materials and Pavement Design, Vol. 13, pp. 140-160, 2012.
Coree, B. J., Hislop, W.P. “A Laboratory Investigation into the Effects of Aggregate-Related Factors on Critical VMA in Asphalt Paving Mixtures”, Journal of the Association of Asphalt Paving Technologists, Vol. 70, pp. 70-131, 2001.
Greene, J., Kim, S., Choubane, B., “Accelerated Pavement Testing and Gradation-Based Performance Evaluation Method”, Transportation Research Record 2225, Transportation Research Board, Washington, D.C., pp. 119–127, 2011.
Guarin, A. “Interstitial Component Characterization to Evaluate Asphalt Mixture Performance”, Ph.D. Dissertation, University of Florida, Gainesville, FL, 2009.
Haddock, J., Pan, C., Feng, A., White, T., “Effect of Gradation on Asphalt Mixture Performance”, Transportation Research Record 1681, Transportation Research Board, Washington, D.C., pp. 59–68, 1999.
Hinrichsen, J.A., Heggen, J., "Minimum Voids in Mineral Aggregate in Hot-Mix Asphalt Based on Gradation and Volumetric Properties", Transportation Research Record: Journal of the Transportation Research Board, No. 1545, National Research Council, National Academy Press, Washington, D.C., pp. 75–79, 1996.
Isola, M., Chun, S., Roque, R., Zou, J., Koh, C., Lopp, G., “Development and Evaluation of Laboratory Conditioning Procedures to Effectively Simulate Mixture Property Changes in the Field”, Transportation Research Board 93rd annual meeting, Washington, D.C., 2014.
Kandhal, P., Mallick, R. B., “Effect of Mix Gradation on Rutting Potential of Dense-Graded Asphalt Mixtures”, Transportation Research Record 1767, Transportation Research Board, Washington, D.C., pp. 146–151, 2001.
Kandhal, P. S., and Cooley, Jr. L. A. “Coarse versus Fine-Graded Superpave Mixtures: Comparative Evaluation of Resistance to Rutting”, Transportation Research Record: Journal of the Transportation Research Board, Vol. 1789, 2002.
Kim, S., Roque, R., Birgisson, B., “Identification and Assessment of the Dominant Aggregate Size Range (DASR) of Asphalt Mixture”, Journal of the Association of Asphalt Paving Technologists, Vol. 75, pp. 789–814, 2006.
Lambe, T. W., Whitman, R.V. Soil Mechanics, John Wiley & Sons, New York, 1969.
117

Nukunya B., Roque R., Mang Tia, Birgisson B., “Evaluation of VMA and Other Volumetric Properties as Criteria for the Design and Acceptance of Superpave Mixtures”, Journal of the Association of Asphalt Paving Technologists, Vol. 70, pp. 38–69, 2001.
Roque, R., Birgisson, B., Drakos, C.A and Dietrich, B “Development and Field Evaluation of Energy-Based Criteria for Top-Down Cracking Performance of Hot Mix Asphalt,”, Journal of the Association of Asphalt Paving Technologists, Vol. 73, pp. 229-260, 2004.
Roque, R., Birgisson, B., Sangpetgnam, B., Zhang, Z., “Hot-Mix Asphalt Fracture Mechanics: A Fundamental Crack Growth Law for Asphalt Mixtures”, Journal of the Association of Asphalt Paving Technologists, Vol. 71, pp. 816–827, 2002.
Roque, R., Buttlar, W. G., “The Development of a Measurement and Analysis System to Accurately Determine Asphalt Concrete Properties Using the Indirect Tensile Mode”, Journal of the Association of Asphalt Paving Technologists, Vol. 61, pp. 304–32, 1992.
Roque, R., Buttlar, W. G., Ruth, B. E., Tia, M., Dickson, S. W. and Reid, B., Evaluation of
SHRP Indirect Tension Tester to Mitigate Cracking in Asphalt Pavements and Overlays, (Florida Department of Transportation Research Report 99700-3311-010), University of Florida, Gainesville, FL, 1997.
Roque R., Chun S., Zou J., Lopp G., Villiers C., Continuation of Superpave Projects Monitoring, (Florida Department of Transportation Research Report BDK-75-977-06), University of Florida, Gainesville, Florida, 2011.
Roque R., Chun S., Isola M., Chun S., Zou J., Koh C., Lopp G., Effects of Laboratory Heating, Cyclic Pore Pressure, and Cyclic Loading on Fracture Properties of Asphalt Mixture (Florida Department of Transportation Research Report BDK75-977-28, University of Florida, Gainesville, Florida, 2012.
Ruth, B. E., Roque, R., Nukunya, B., “Aggregate Gradation Characterization Factors and their
Relationships to Fracture Energy and Failure Strain of Asphalt Mixtures”, Journal of the Association of Asphalt Paving Technologists, Vol. 71, pp. 310–344, 2002.
Sefidmazgi, N. R., Tashman, L., Bahia, H., “Internal Structure Characterization of Asphalt
Mixtures for Rutting Performance Using Imaging Analysis,” Journal of the Association of Asphalt Paving Technologists, Vol. 81, pp. 109-138, 2012.
Vavrik, W., Pine, W. J., Huber, G., Carpenter, S. H., Bailey, R., “The Bailey Method of Gradation Evaluation: The Influence of Aggregate Gradation and Packing Characteristics on Voids in the Mineral Aggregate,” Journal of the Association of Asphalt Paving Technologists, Vol. 70, pp. 132-175, 2001.
118

Vavrik, W., Pine, W. J., Huber, G., Carpenter, S. H., Bailey, R., “Bailey Method for Gradation Selection in HMA Mixture Design,” Transportation Research Circular, E-C044, Washington, D.C., 2002.
You, Z., Adhikari, S., Dai, Q., “Two Dimensional and Three Dimensional Discrete Element Models for HMA”, Journal of Pavements and Materials, pp. 117-126, 2008.
You, T., Abu Al-Rub, R. K., Darabi, M.K., Masad, E. A., Little, D. N., “Three-Dimensional Microstructural Modeling of Asphalt Concrete using a Unified Viscoelastic-Viscoplastic- Viscodamage Model”, Journal of Construction and Building Materials, Vol. 28, No. 1, pp. 531-548, 2011.
You, T., Abu Al-Rub, Masad, E. A., Kassem, E., Little, D. N., “Three-Dimensional Microstructural Modeling Framework for Dense-Graded Asphalt Concrete Using a Coupled Viscoelastic, Viscoplastic, and Viscodamage Model”, Journal of Materials in Civil Engineering, Vol. 26, No. 4, pp 607-621, 2014.
You, T., Abu Al-Rub, Masad, E. A., Little, D. N., “X-Ray CT-Based Three-Dimensional Microstructural Modeling of Asphalt Concrete”, Transportation Research Record: Journal of the Transportation Research Board, No. 2373, Transportation Research Board of the National Academies, Washington, D.C., 2013, pp. 63-70.
Zhang, Z., Roque, R., Birgisson, B., Sangpetgnam, B., “Identification and Verification of a Suitable Crack Growth Law”, Journal of the Association of Asphalt Paving Technologists, Vol. 70, pp. 206–241, 2001.
119